Embed Size (px)
Citation preview
Item 6a, Attachment 3, Page 1 of 45
S E M I - A N N U A L P E R F O R M A N C E R E P O R T
California Public Employees’ Retirement System
Private Equity Program
Semi-Annual Report – December 31, 2017
M E K E T A I N V E S T M E N T G R O U P
B O S T O N C H I C A G O M I A M I P O R T L A N D S A N D I E G O LO N D O N
M A S S A C H U S E T T S I L L I N O I S F L O R I D A O R E G O N C A L I F O R N I A U N I T E D K I N G D O M
www. meketagroup .com
Item 6a, Attachment 3, Page 2 of 45
California Public Employees’ Retirement System Private Equity Program
Table of Contents
1. Introduction and Executive Summary
2. Private Equity Industry Review
3. Portfolio Overview
4. Program Performance
5. Program Activity
6. Appendix
Vintage Year Statistics
Glossary
Prepared by Meketa Investment Group
Item 6a, Attachment 3, Page 3 of 45
California Public Employees’ Retirement System Private Equity Program
Introduction and Executive Summary
Overview
This report provides a review of CalPERS Private Equity Program as of December 31, 2017, and includes a review and outlook for the Private Equity industry. CalPERS began investing in the private equity asset class in 1990. CalPERS currently has an 8% interim target allocation to the private equity asset class. The total value of the portfolio was $26.7 billion1, with total exposure (net asset value plus unfunded commitments) of $40.8 billion2. The Private Equity portfolio represented 7.6% of CalPERS total assets as of the end of 2017.
Executive Summary
Portfolio
The portfolio is diversified by strategy, with Buyouts representing the largest exposure at 62% of total Private Equity.
Mega and Large buyout funds represent approximately 56% of CalPERS’ Buyouts exposure.
By net asset value (NAV), assets within the United States comprise approximately 60% of the Program’s investments.
The commitments made to the 2005 – 2008 vintages represent 46% of CalPERS’ total private equity commitments.
Fund investments represent 72% of exposure, with the balance in Customized Investment Accounts (14%), Fund of Funds (9%), and Co-Investments/Direct Investments (5%).
1 Source: State Street cash-flow adjusted NAVs, as of 12/31/2017. Total exposure is the sum of NAVs and unfunded commitments. 2 Source: State Street, CalPERS.
Prepared by Meketa Investment Group
Item 6a, Attachment 3, Page 4 of 45
California Public Employees’ Retirement System Private Equity Program
Introduction and Executive Summary
Performance
The Program reported a value increase of $2.5 billion from July 1, 2017 to December 31, 2017, and $4.4 billion for the full calendar year 2017.
The Private Equity Program has underperformed its policy benchmark across periods of ten years or less.
Activity
The Private Equity Program experienced a net positive cash flow of $1.7 billion through the second half of 2017, and $3.1 billion for the full calendar year 2017.
For the second half of 2017, Staff completed eight commitments totaling $2.4 billion, and eleven commitments for $4.0 billion for the full calendar year 2017.
Prepared by Meketa Investment Group
Item 6a, Attachment 3, Page 5 of 45
California Public Employees’ Retirement System Private Equity Program
Private Equity Industry Review – Buyouts
$455
$820
$337
$142
$289
$335
$372
$441
$531
$550
$578
$373
2,826 3,553
2,763
1,885
2,758 3,110
3,5113,390
2,641
0
500
1,000
1,500
2,000
2,500
3,000
3,500
4,000
$0
$100
$200
$300
$400
$500
$600
$700
$800
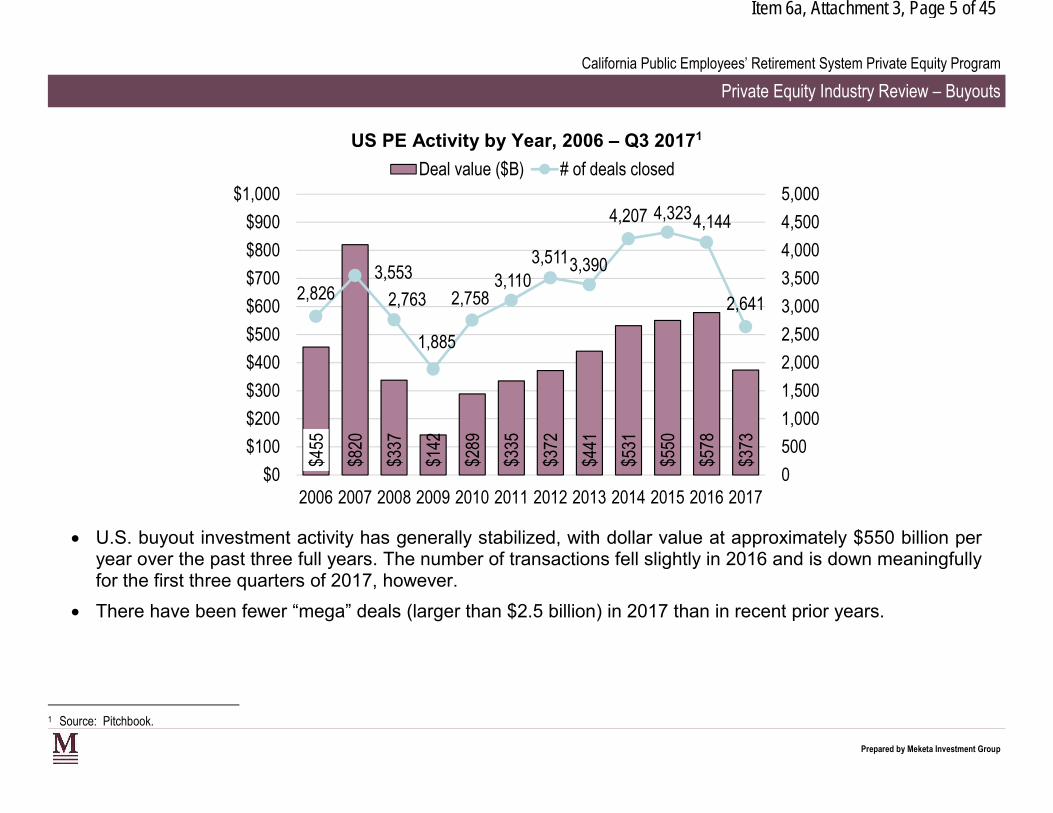
US PE Activity by Year, 2006 – Q3 20171
Deal value ($B) # of deals closed $1,000 5,000
$900 4,207 4,3234,144 4,500
2006 2007 2008 2009 2010 2011 2012 2013 2014 2015 2016 2017
U.S. buyout investment activity has generally stabilized, with dollar value at approximately $550 billion per year over the past three full years. The number of transactions fell slightly in 2016 and is down meaningfully for the first three quarters of 2017, however.
There have been fewer “mega” deals (larger than $2.5 billion) in 2017 than in recent prior years.
1 Source: Pitchbook.
Prepared by Meketa Investment Group
Item 6a, Attachment 3, Page 6 of 45
California Public Employees’ Retirement System Private Equity Program
Private Equity Industry Review – Buyouts
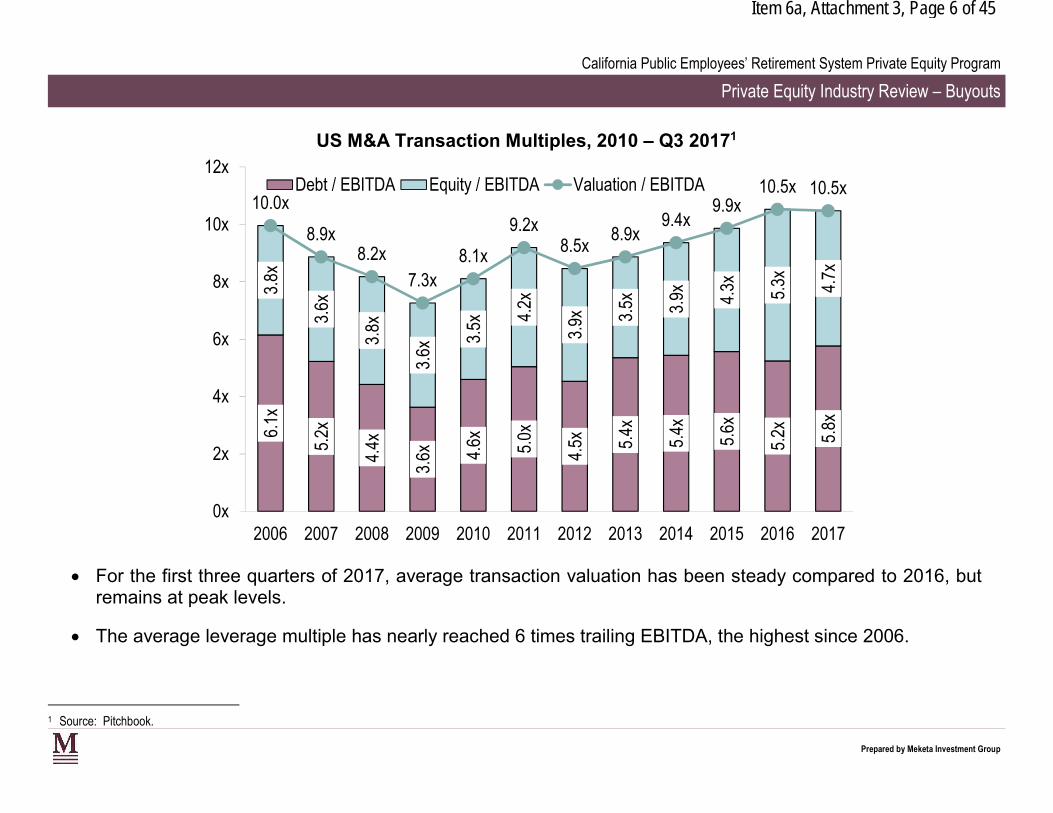
US M&A Transaction Multiples, 2010 – Q3 20171
12x
10x
8x
6x
4x
2x
0x
6.1x
5.2x
4.4x
3.6x 4.
6x 5.0x
4.5x 5.
4x
5.4x
5.6x
5.2x 5.8x
3.8x
3.6x
3.8x
3.6x
3.5x 4.
2x
3.9x 3.
5x 3.9x 4.
3x 5.3x 4.7x
10.0x
8.9x 8.2x
7.3x 8.1x
9.2x 8.5x
8.9x 9.4x
9.9x 10.5x 10.5x Debt / EBITDA Equity / EBITDA Valuation / EBITDA
2006 2007 2008 2009 2010 2011 2012 2013 2014 2015 2016 2017
For the first three quarters of 2017, average transaction valuation has been steady compared to 2016, but remains at peak levels.
The average leverage multiple has nearly reached 6 times trailing EBITDA, the highest since 2006.
1 Source: Pitchbook.
Prepared by Meketa Investment Group
Item 6a, Attachment 3, Page 7 of 45
California Public Employees’ Retirement System Private Equity Program
Private Equity Industry Review – Buyouts
$139
$157
$78
$49
$127
$122
$182
$176
$255
$335
$249
$129
756
916
629
420
822 900
1,112 1,024
1,213
755
0
200
400
600
800
1,000
1,200
1,400
$0
$50
$100
$150
$200
$250
$300
$350
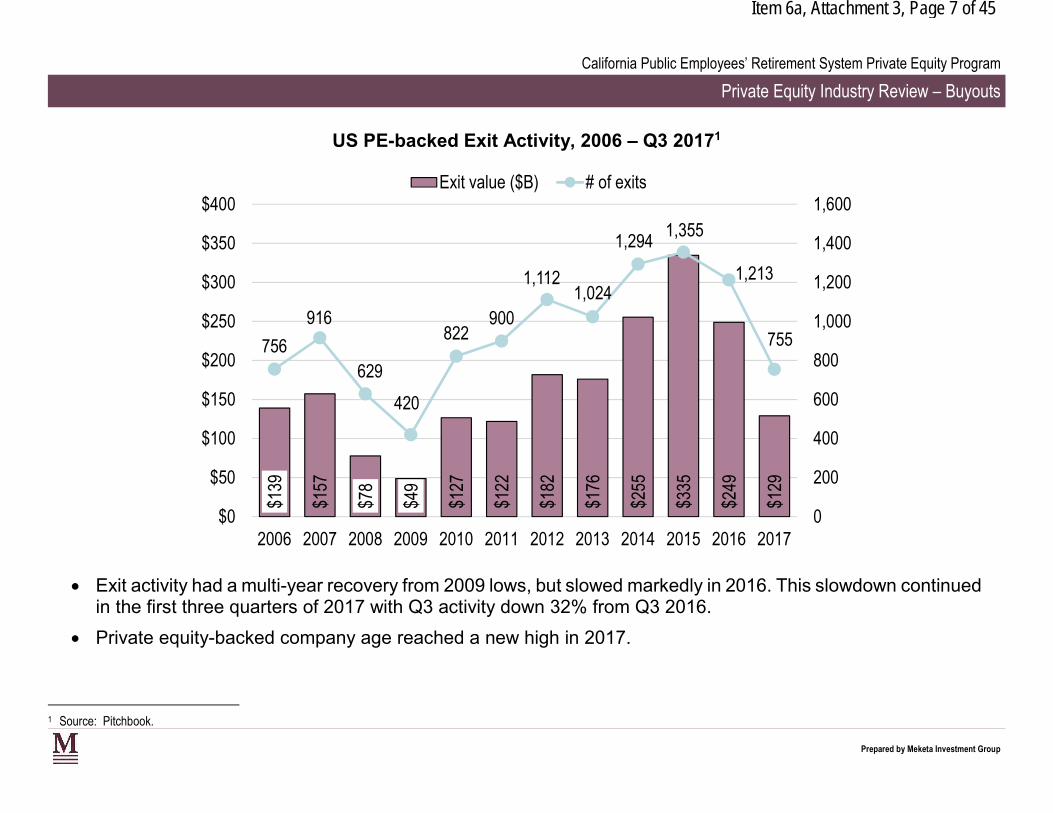
US PE-backed Exit Activity, 2006 – Q3 20171
Exit value ($B) # of exits $400 1,600
1,294 1,355
2006 2007 2008 2009 2010 2011 2012 2013 2014 2015 2016 2017
Exit activity had a multi-year recovery from 2009 lows, but slowed markedly in 2016. This slowdown continued in the first three quarters of 2017 with Q3 activity down 32% from Q3 2016.
Private equity-backed company age reached a new high in 2017.
1 Source: Pitchbook.
Prepared by Meketa Investment Group
Acquisition 46%
Item 6a, Attachment 3, Page 8 of 45
California Public Employees’ Retirement System Private Equity Program
Private Equity Industry Review – Buyouts
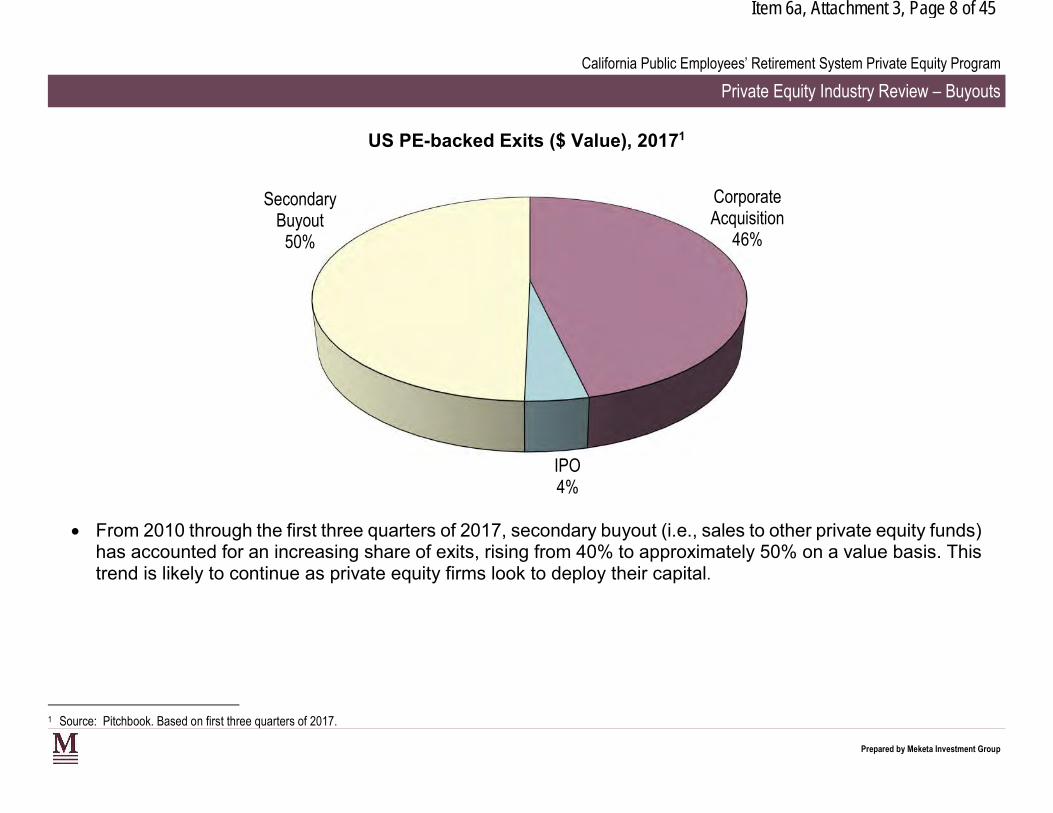
US PE-backed Exits ($ Value), 20171
Secondary Corporate
Buyout 50%
IPO 4%
From 2010 through the first three quarters of 2017, secondary buyout (i.e., sales to other private equity funds) has accounted for an increasing share of exits, rising from 40% to approximately 50% on a value basis. This trend is likely to continue as private equity firms look to deploy their capital.
1 Source: Pitchbook. Based on first three quarters of 2017.
Prepared by Meketa Investment Group
Item 6a, Attachment 3, Page 9 of 45
California Public Employees’ Retirement System Private Equity Program
Private Equity Industry Review – Buyouts
US VC Activity by Year ($mm), 2006 – 20171
Deal value ($B) # of deals closed
$120 12,000 10,406 10,463
$29
$36
$37
$27
$32
$44
$41
$45
$70
$79
$72
$84
3,310 4,286 4,684 4,434
5,351
6,703
7,849
9,183 8,635 8,076
0
2,000
4,000
6,000
8,000
10,000
$0
$20
$40
$60
$80
$100
2006 2007 2008 2009 2010 2011 2012 2013 2014 2015 2016 2017
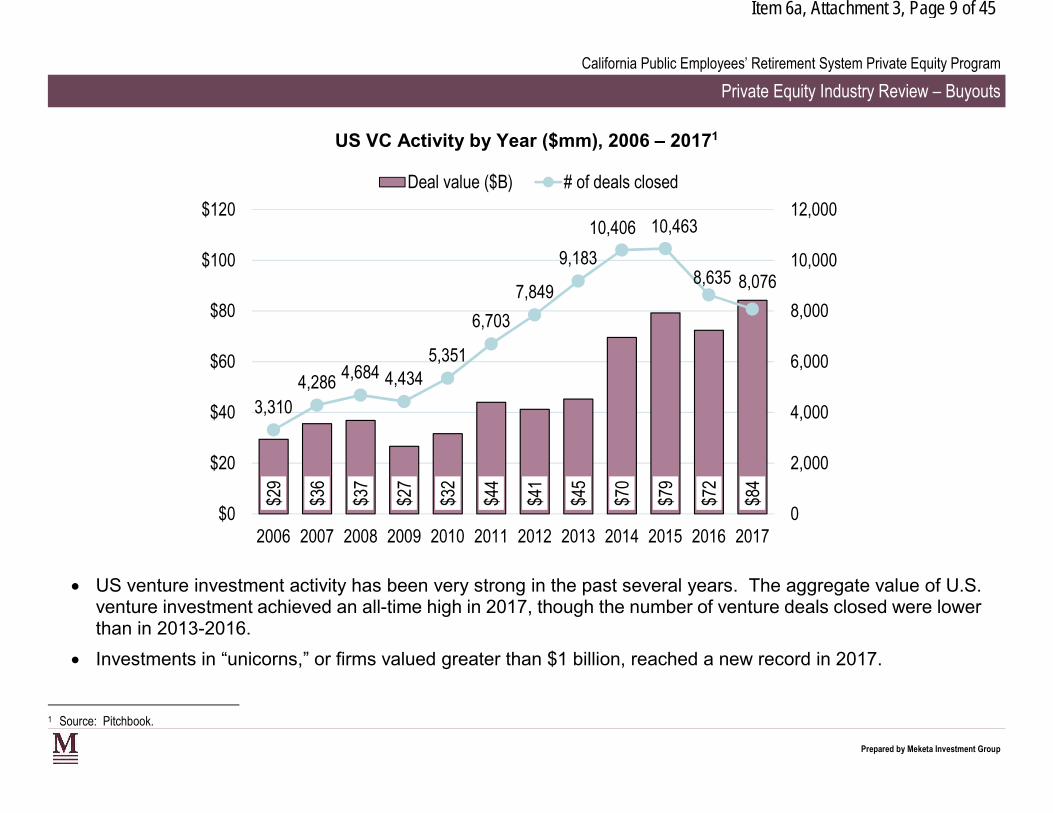
US venture investment activity has been very strong in the past several years. The aggregate value of U.S. venture investment achieved an all-time high in 2017, though the number of venture deals closed were lower than in 2013-2016.
Investments in “unicorns,” or firms valued greater than $1 billion, reached a new record in 2017.
1 Source: Pitchbook.
Prepared by Meketa Investment Group
Item 6a, Attachment 3, Page 10 of 45
California Public Employees’ Retirement System Private Equity Program
Private Equity Industry Review – Buyouts
Median VC Round Size ($mm), 2006 – 20171
Angel/Seed Early VC Later VC
11.40 $12
$10
$8
$6
$4
$2
$0
0.88 0.75 0.75 0.90 1.000.58 0.50 0.50 0.50 0.50 0.54 0.60
4.76 4.00 3.83
3.00 2.60 2.70 2.75 3.00 3.40 4.38
5.00 6.00
8.98
6.00
9.56
8.00
6.20
7.61 7.41 6.79
9.00 10.10 10.00
2006 2007 2008 2009 2010 2011 2012 2013 2014 2015 2016 2017
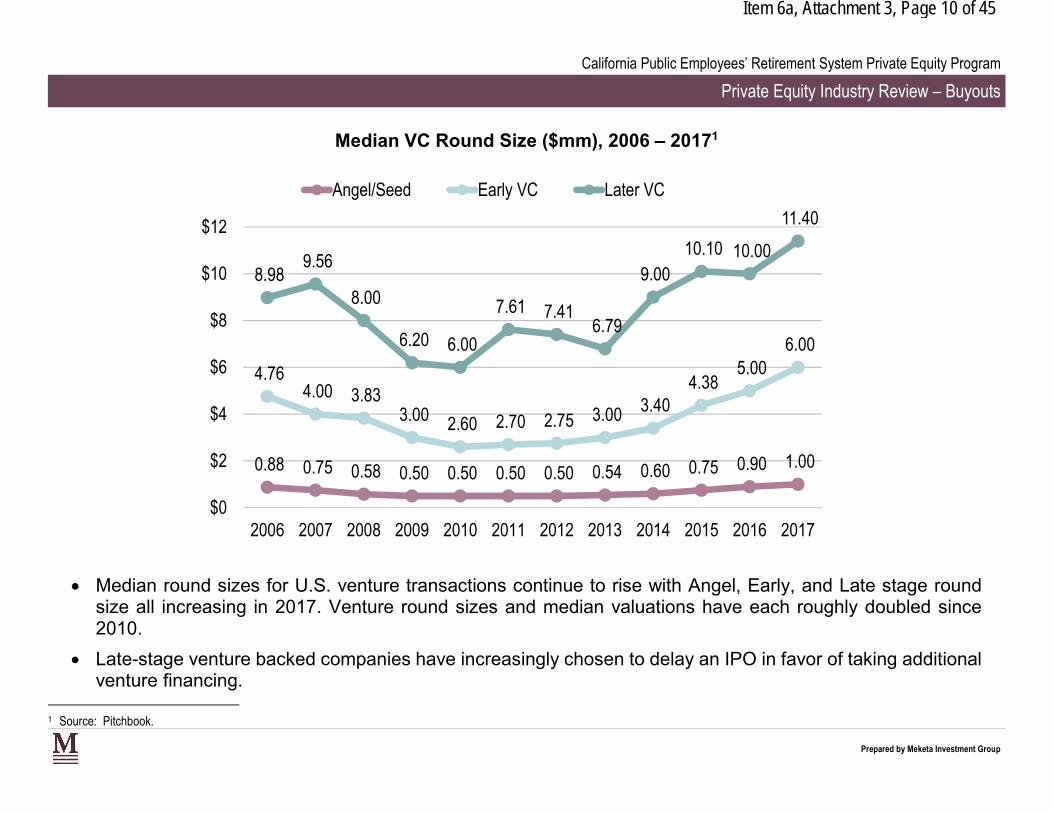
Median round sizes for U.S. venture transactions continue to rise with Angel, Early, and Late stage round size all increasing in 2017. Venture round sizes and median valuations have each roughly doubled since 2010.
Late-stage venture backed companies have increasingly chosen to delay an IPO in favor of taking additional venture financing.
1 Source: Pitchbook.
Prepared by Meketa Investment Group
Item 6a, Attachment 3, Page 11 of 45
California Public Employees’ Retirement System Private Equity Program
Private Equity Industry Review – Buyouts
$24
$42
$16
$16
$32
$34
$56
$37
$80
$50
$53
$51
527 622
484 479
698 738
867 891
1,003
857 769
0
200
400
600
800
1,000
$0
$10
$20
$30
$40
$50
$60
$70
$80
US VC-backed Exit Activity, 2006 – 20171
Exit value ($B) # of Exits Closed
$90 1,200 1,065
2006 2007 2008 2009 2010 2011 2012 2013 2014 2015 2016 2017
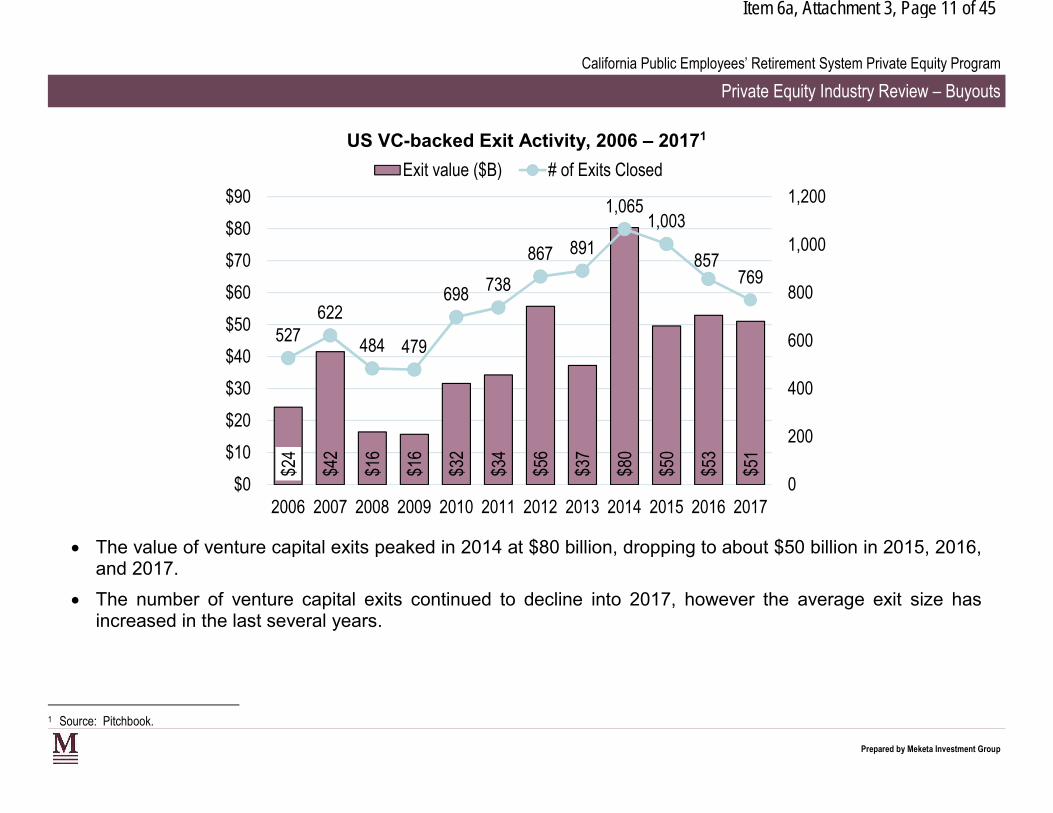
The value of venture capital exits peaked in 2014 at $80 billion, dropping to about $50 billion in 2015, 2016, and 2017.
The number of venture capital exits continued to decline into 2017, however the average exit size has increased in the last several years.
1 Source: Pitchbook.
Prepared by Meketa Investment Group
Item 6a, Attachment 3, Page 12 of 45
California Public Employees’ Retirement System Private Equity Program
Private Equity Industry Review – Buyouts
US VC-backed Exits ($ Value), 20171
Buyout 19%
IPO 8%
Acquisition 73%
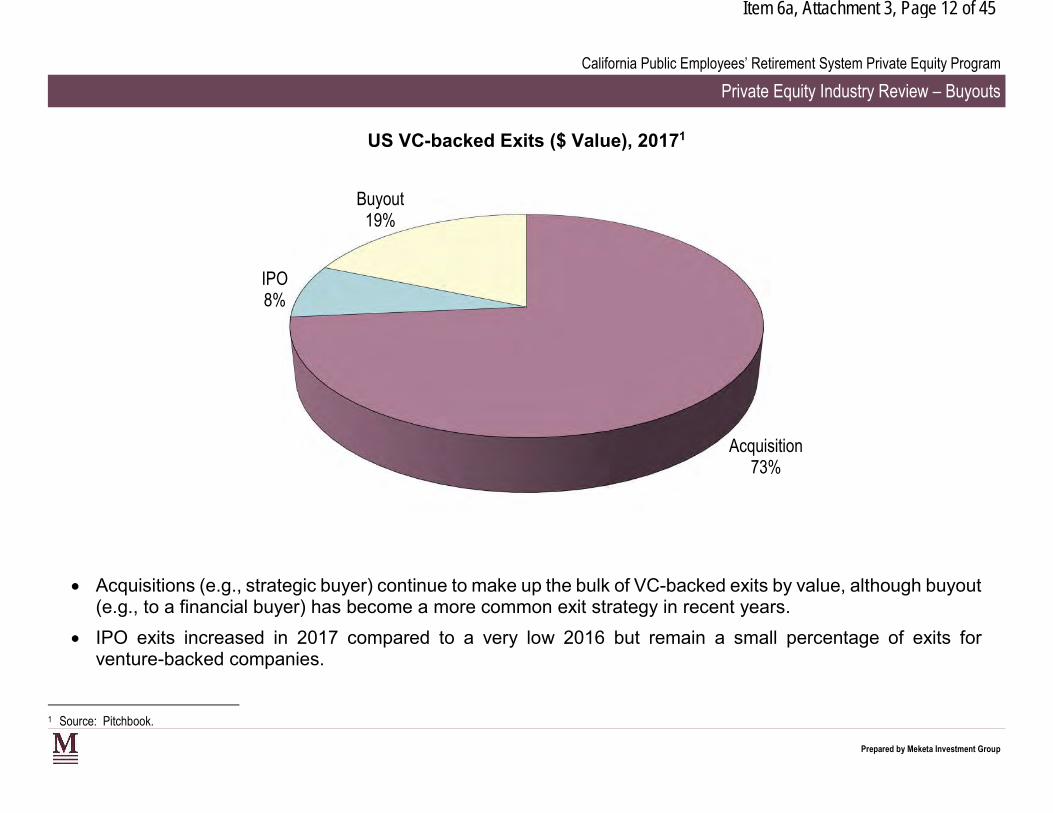
Acquisitions (e.g., strategic buyer) continue to make up the bulk of VC-backed exits by value, although buyout (e.g., to a financial buyer) has become a more common exit strategy in recent years.
IPO exits increased in 2017 compared to a very low 2016 but remain a small percentage of exits for venture-backed companies.
1 Source: Pitchbook.
Prepared by Meketa Investment Group
Item 6a, Attachment 3, Page 13 of 45
California Public Employees’ Retirement System Private Equity Program
Private Equity Industry Review – Fundraising
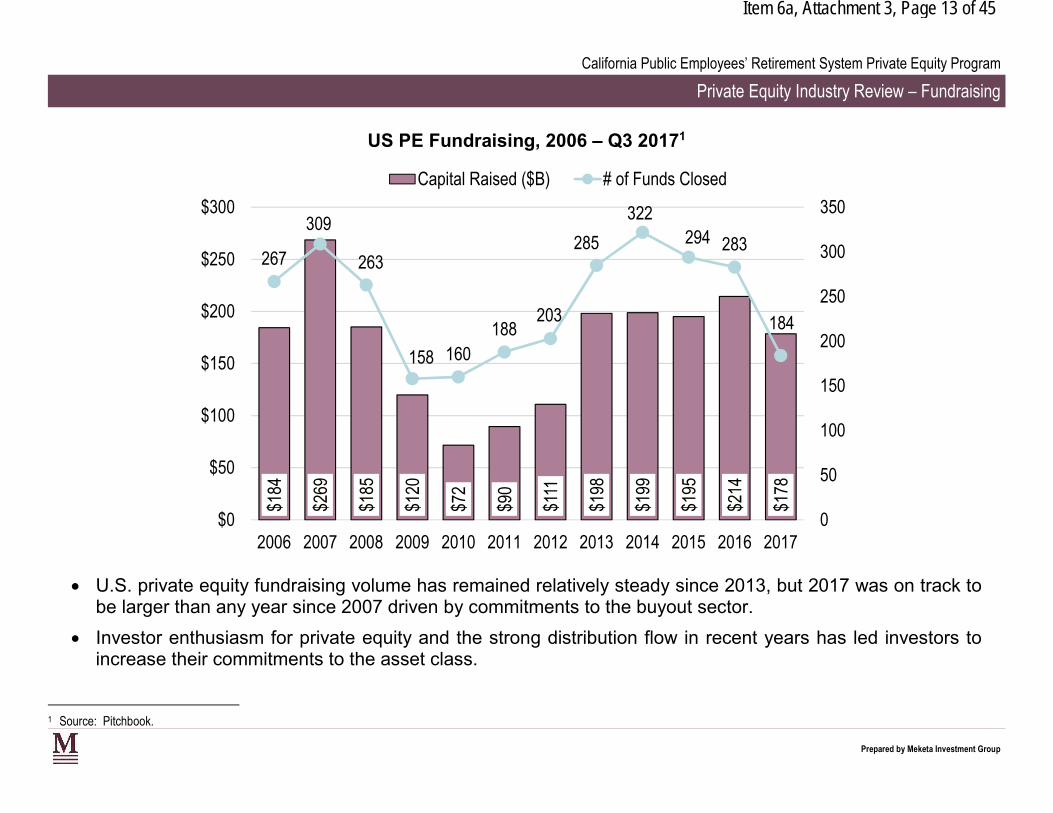
US PE Fundraising, 2006 – Q3 20171
Capital Raised ($B) # of Funds Closed
$184
$269
$185
$120
$72
$90
$111
$198
$199
$195
$214
$178
267
309
263
158 160 188
203
285
322 294 283
184
0
50
100
150
200
250
300
350
$0
$50
$100
$150
$200
$250
$300
2006 2007 2008 2009 2010 2011 2012 2013 2014 2015 2016 2017
U.S. private equity fundraising volume has remained relatively steady since 2013, but 2017 was on track to be larger than any year since 2007 driven by commitments to the buyout sector.
Investor enthusiasm for private equity and the strong distribution flow in recent years has led investors to increase their commitments to the asset class.
1 Source: Pitchbook.
Prepared by Meketa Investment Group
Item 6a, Attachment 3, Page 14 of 45
California Public Employees’ Retirement System Private Equity Program
Private Equity Industry Review – Fundraising
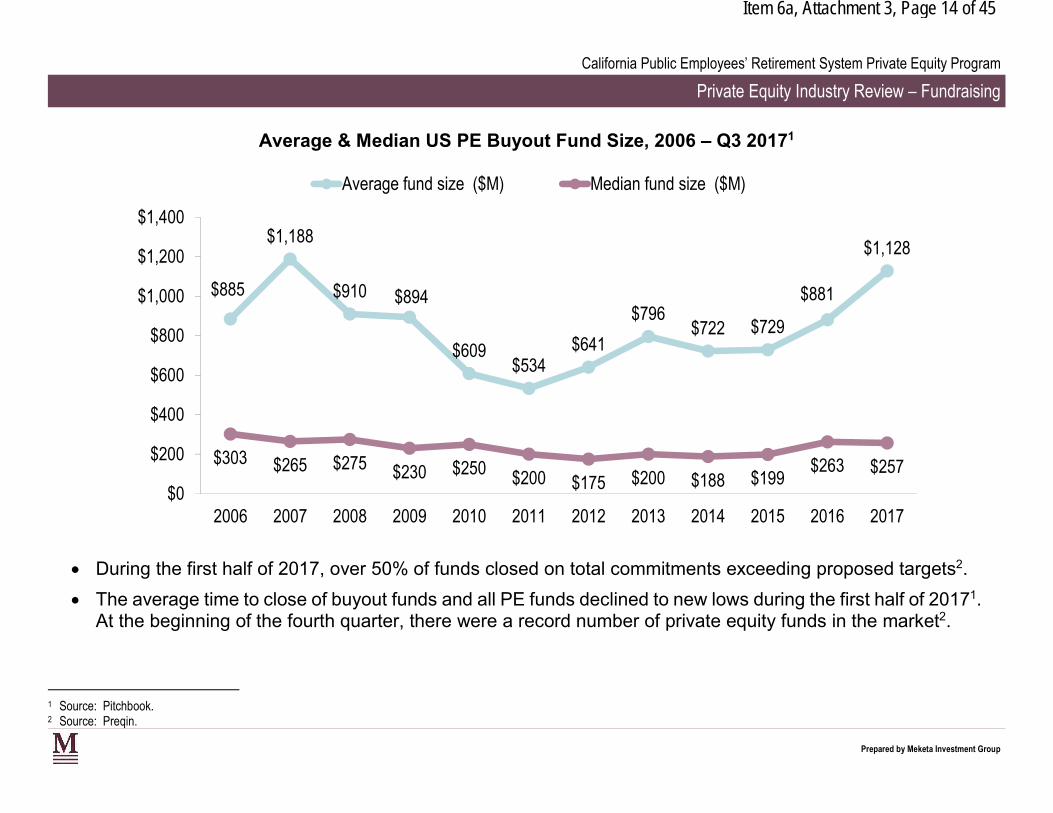
Average & Median US PE Buyout Fund Size, 2006 – Q3 20171
Average fund size ($M) Median fund size ($M)
$1,400 $1,188
$1,128 $1,200
$1,000
$800
$600
$400
$200 $265 $250 $263 $257 $230 $200 $200 $199
$303 $275
$885 $910 $894
$609 $534
$641
$796 $722 $729
$881
$175 $188 $0
2006 2007 2008 2009 2010 2011 2012 2013 2014 2015 2016 2017
During the first half of 2017, over 50% of funds closed on total commitments exceeding proposed targets2.
The average time to close of buyout funds and all PE funds declined to new lows during the first half of 20171. At the beginning of the fourth quarter, there were a record number of private equity funds in the market2.
1 Source: Pitchbook. 2 Source: Preqin.
Prepared by Meketa Investment Group
Item 6a, Attachment 3, Page 15 of 45
California Public Employees’ Retirement System Private Equity Program
Portfolio Overview
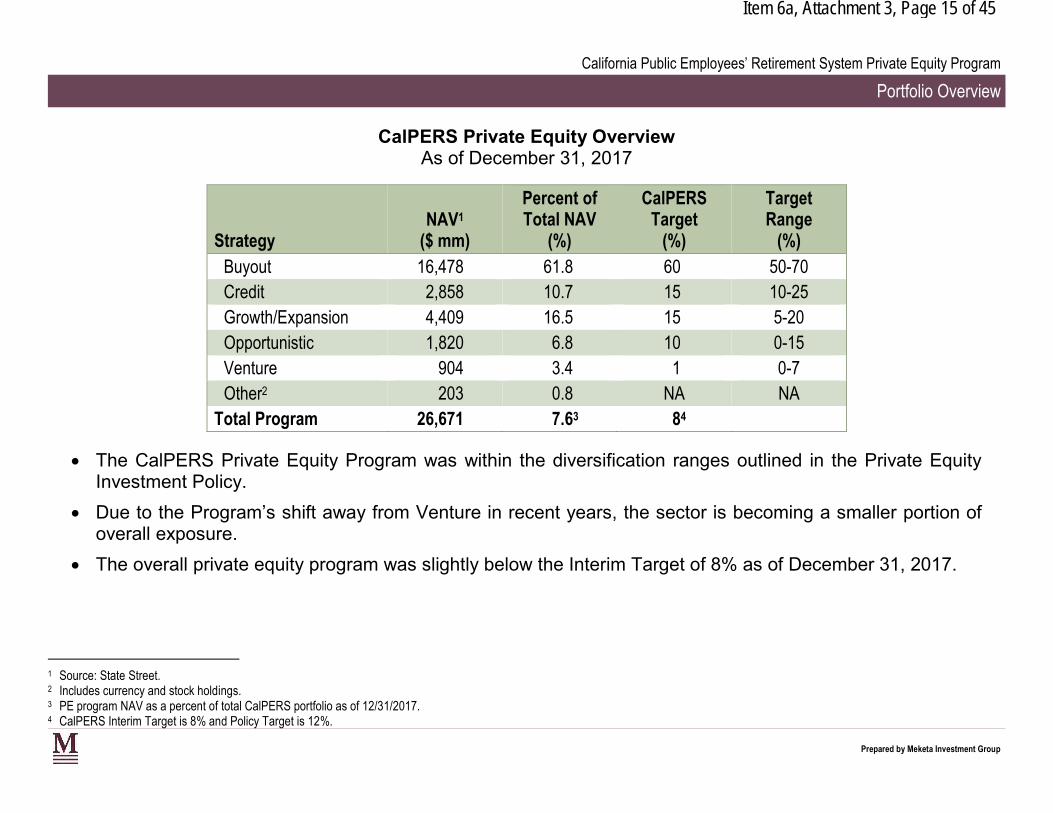
CalPERS Private Equity OverviewAs of December 31, 2017
Strategy NAV1
($ mm)
Percent of Total NAV
(%)
CalPERS Target
(%)
TargetRange
(%) Buyout 16,478 61.8 60 50-70 Credit 2,858 10.7 15 10-25 Growth/Expansion 4,409 16.5 15 5-20 Opportunistic 1,820 6.8 10 0-15 Venture 904 3.4 1 0-7 Other2 203 0.8 NA NA
Total Program 26,671 7.63 84
The CalPERS Private Equity Program was within the diversification ranges outlined in the Private Equity Investment Policy.
Due to the Program’s shift away from Venture in recent years, the sector is becoming a smaller portion of overall exposure.
The overall private equity program was slightly below the Interim Target of 8% as of December 31, 2017.
1 Source: State Street. 2 Includes currency and stock holdings. 3 PE program NAV as a percent of total CalPERS portfolio as of 12/31/2017. 4 CalPERS Interim Target is 8% and Policy Target is 12%.
Prepared by Meketa Investment Group
Item 6a, Attachment 3, Page 16 of 45
California Public Employees’ Retirement System Private Equity Program
Portfolio Overview
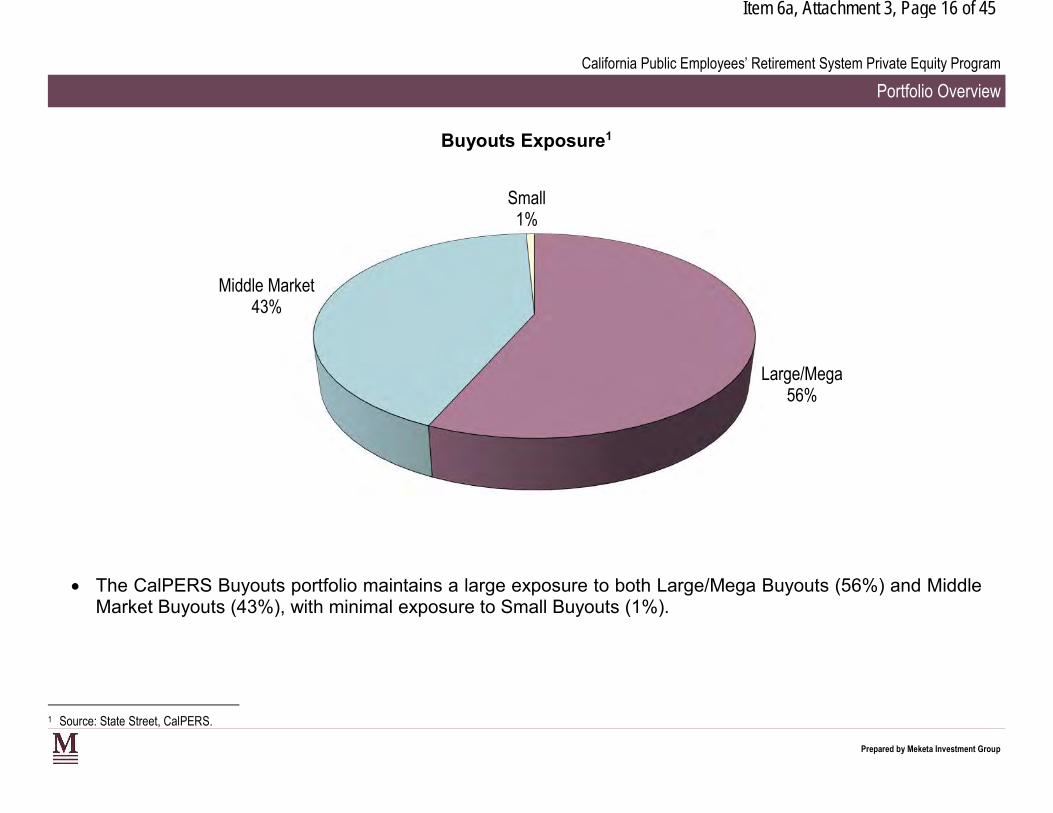
Buyouts Exposure1
Small 1%
Middle Market 43%
Large/Mega 56%
The CalPERS Buyouts portfolio maintains a large exposure to both Large/Mega Buyouts (56%) and Middle Market Buyouts (43%), with minimal exposure to Small Buyouts (1%).
1 Source: State Street, CalPERS.
Prepared by Meketa Investment Group
Item 6a, Attachment 3, Page 17 of 45
California Public Employees’ Retirement System Private Equity Program
Portfolio Overview
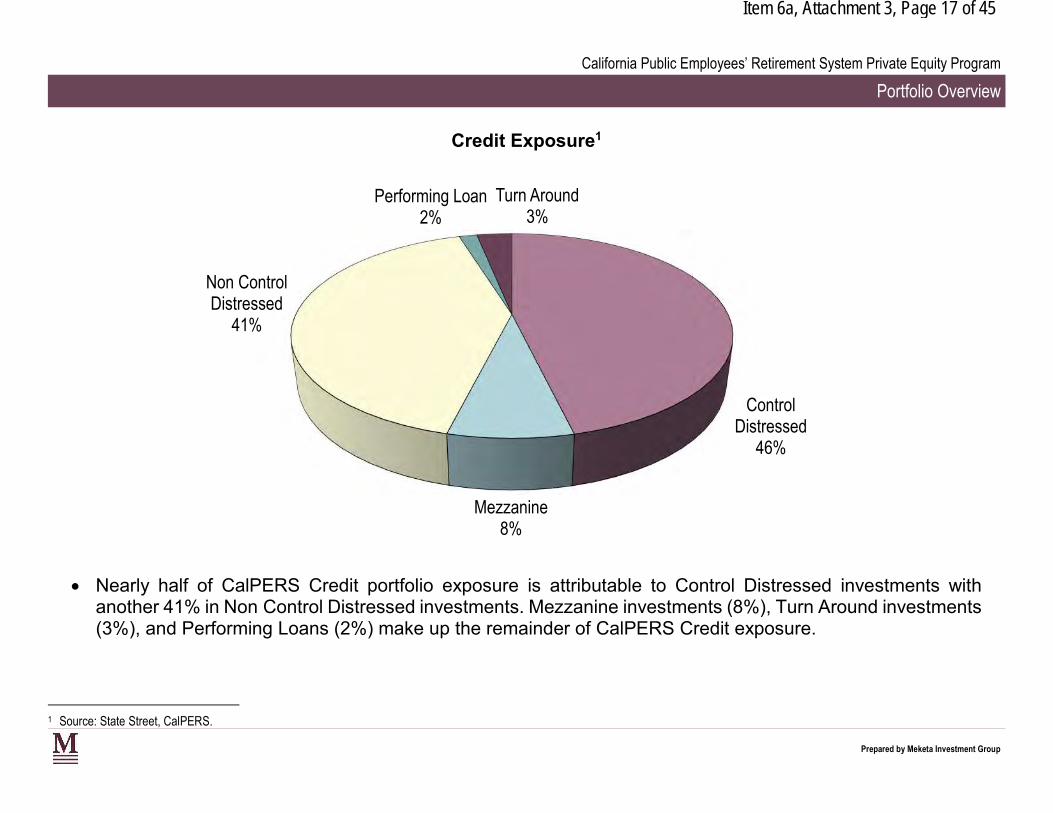
Credit Exposure1
Performing Loan Turn Around 2% 3%
Non Control Distressed
41%
Control Distressed
46%
Mezzanine 8%
Nearly half of CalPERS Credit portfolio exposure is attributable to Control Distressed investments with another 41% in Non Control Distressed investments. Mezzanine investments (8%), Turn Around investments (3%), and Performing Loans (2%) make up the remainder of CalPERS Credit exposure.
1 Source: State Street, CalPERS.
Prepared by Meketa Investment Group
Item 6a, Attachment 3, Page 18 of 45
California Public Employees’ Retirement System Private Equity Program
Portfolio Overview
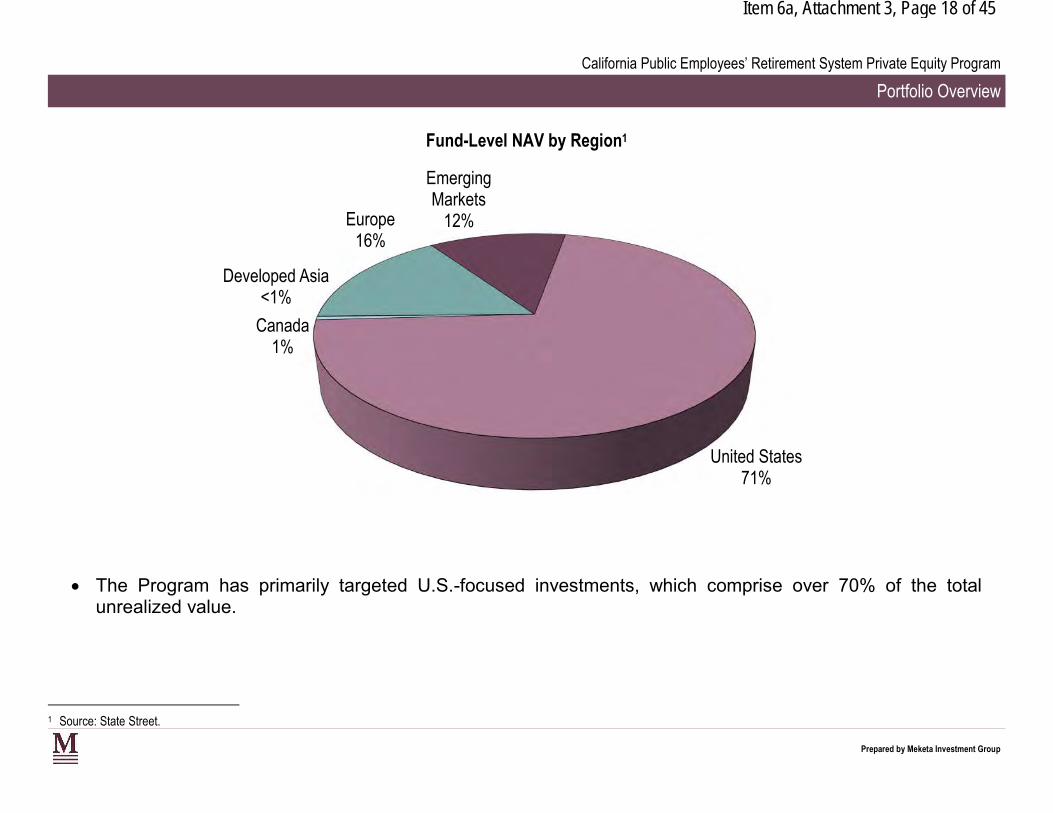
Fund-Level NAV by Region1
Europe 16%
Emerging Markets
12%
Developed Asia <1%
Canada 1%
United States 71%
The Program has primarily targeted U.S.-focused investments, which comprise over 70% of the total unrealized value.
1 Source: State Street.
Prepared by Meketa Investment Group
Item 6a, Attachment 3, Page 19 of 45
California Public Employees’ Retirement System Private Equity Program
Portfolio Overview
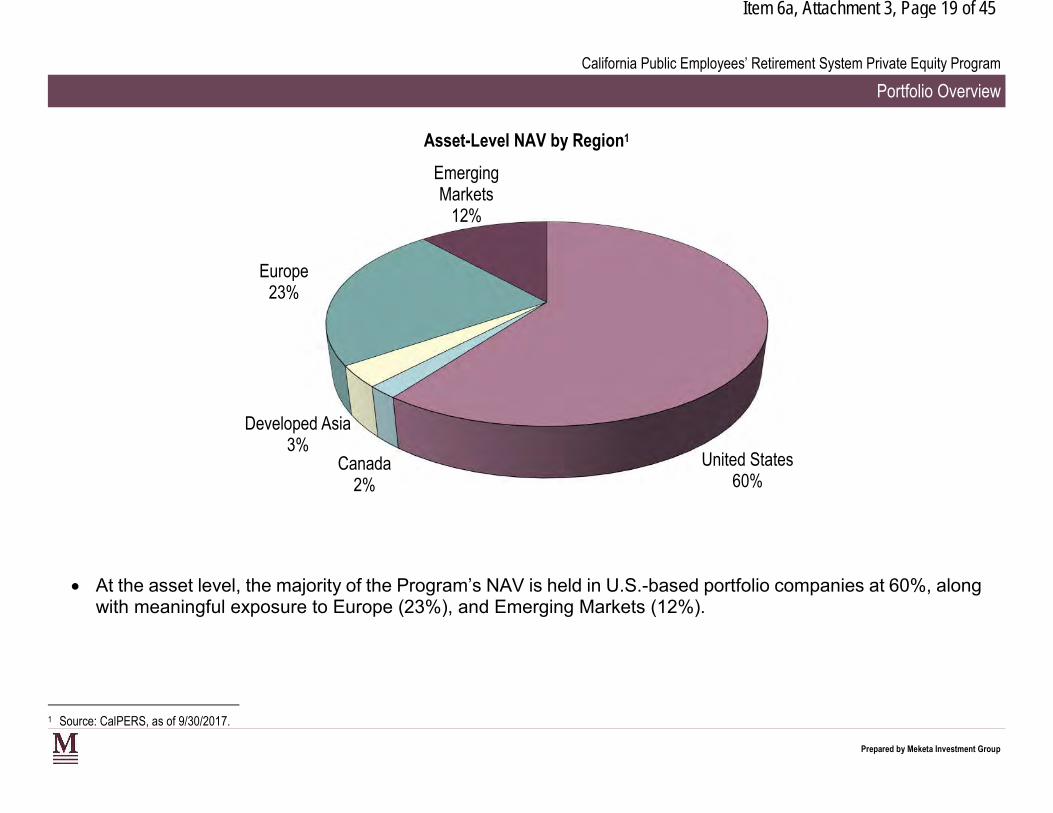
Asset-Level NAV by Region1
Emerging Markets
12%
Europe 23%
Developed Asia 3%
United States Canada 60% 2%
At the asset level, the majority of the Program’s NAV is held in U.S.-based portfolio companies at 60%, along with meaningful exposure to Europe (23%), and Emerging Markets (12%).
1 Source: CalPERS, as of 9/30/2017.
Prepared by Meketa Investment Group
Item 6a, Attachment 3, Page 20 of 45
California Public Employees’ Retirement System Private Equity Program
Portfolio Overview
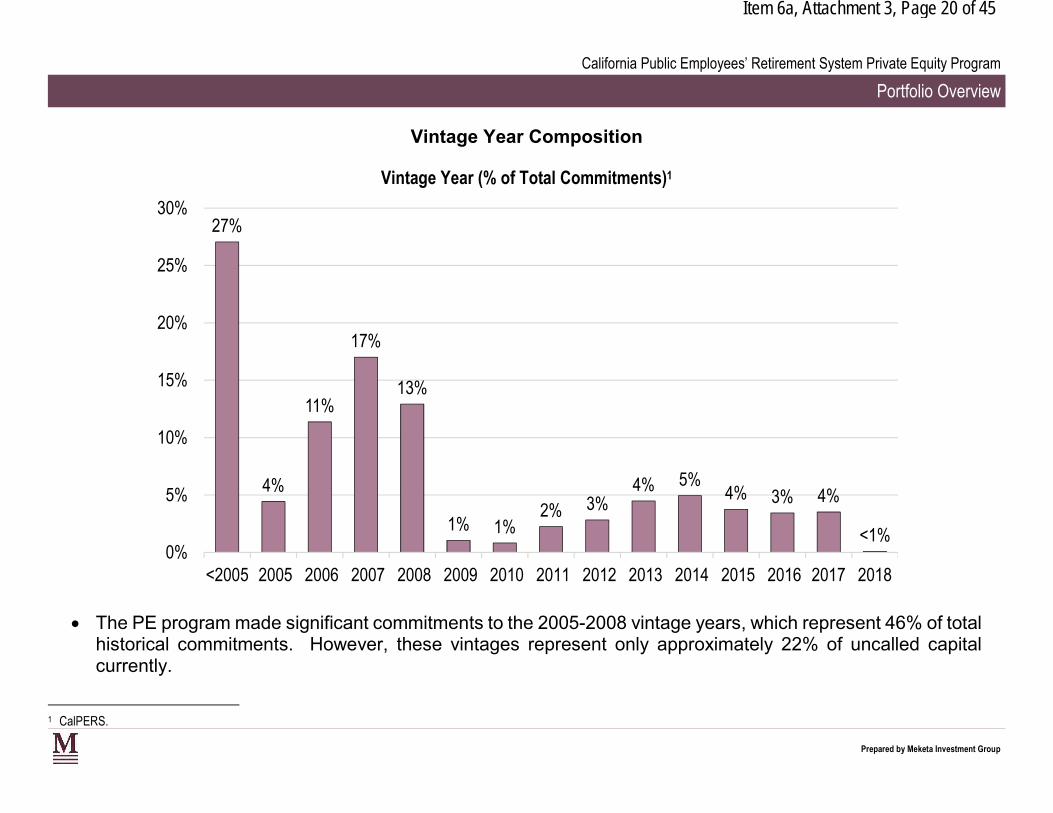
Vintage Year Composition
Vintage Year (% of Total Commitments)1
30% 27%
25%
20% 17%
15% 13% 11%
10%
5%4%4% 4% 3% 4%5% 3%2%1% 1% <1%
0% <2005 2005 2006 2007 2008 2009 2010 2011 2012 2013 2014 2015 2016 2017 2018
The PE program made significant commitments to the 2005-2008 vintage years, which represent 46% of total historical commitments. However, these vintages represent only approximately 22% of uncalled capital currently.
1 CalPERS.
Prepared by Meketa Investment Group
Item 6a, Attachment 3, Page 21 of 45
California Public Employees’ Retirement System Private Equity Program
Portfolio Overview
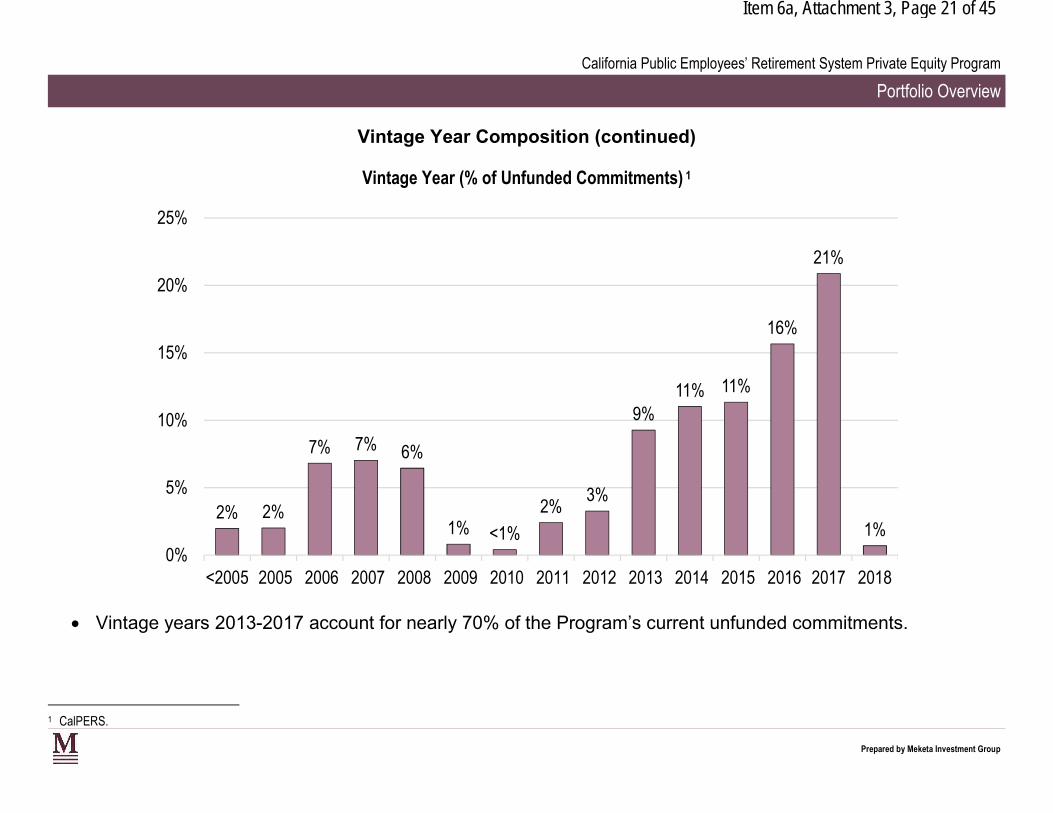
Vintage Year Composition (continued)
Vintage Year (% of Unfunded Commitments) 1
25%
21%
2% 2%
7% 7% 6%
1% <1%
2% 3%
9% 11% 11%
16%
1% 0%
5%
10%
15%
20%
<2005 2005 2006 2007 2008 2009 2010 2011 2012 2013 2014 2015 2016 2017 2018
Vintage years 2013-2017 account for nearly 70% of the Program’s current unfunded commitments.
1 CalPERS.
Prepared by Meketa Investment Group
Item 6a, Attachment 3, Page 22 of 45
California Public Employees’ Retirement System Private Equity Program
Portfolio Overview
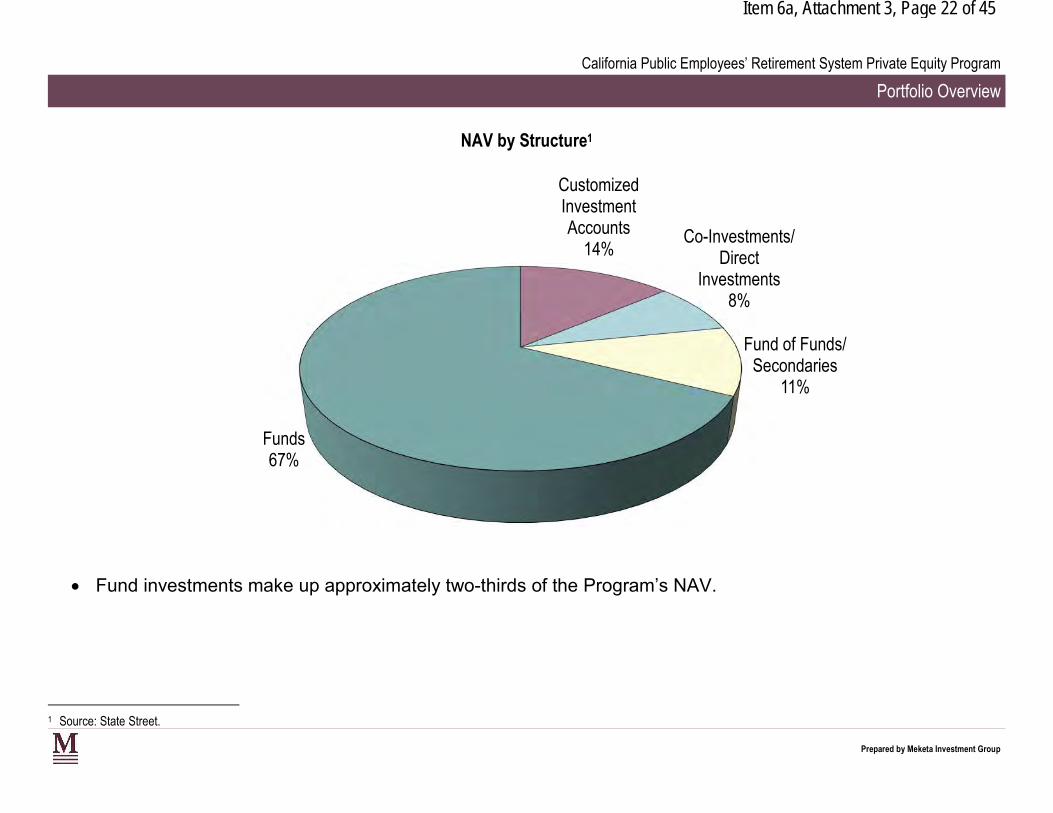
NAV by Structure1
Customized Investment Accounts Co-Investments/
14% Direct Investments
8%
Fund of Funds/ Secondaries
11%
Funds 67%
Fund investments make up approximately two-thirds of the Program’s NAV.
1 Source: State Street.
Prepared by Meketa Investment Group
Item 6a, Attachment 3, Page 23 of 45
California Public Employees’ Retirement System Private Equity Program
Portfolio Overview
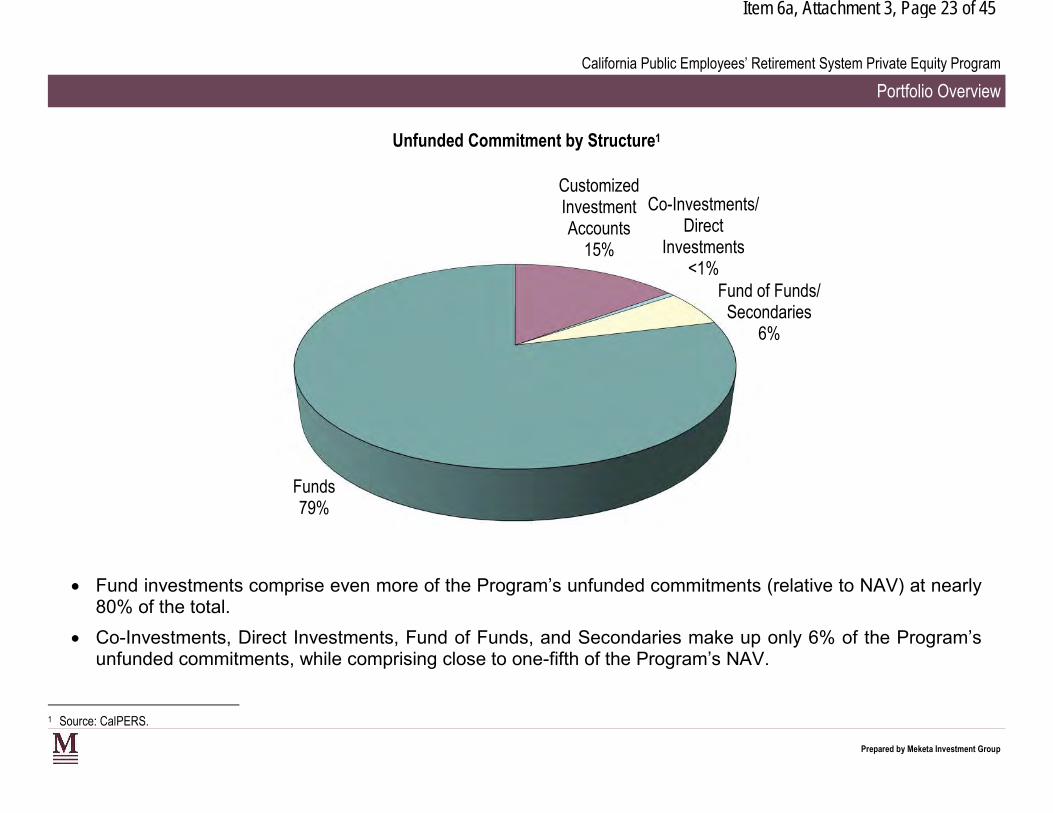
Unfunded Commitment by Structure1
Customized Investment Co-Investments/ Accounts Direct
15% Investments <1%
Fund of Funds/ Secondaries
6%
Funds 79%
Fund investments comprise even more of the Program’s unfunded commitments (relative to NAV) at nearly 80% of the total.
Co-Investments, Direct Investments, Fund of Funds, and Secondaries make up only 6% of the Program’s unfunded commitments, while comprising close to one-fifth of the Program’s NAV.
1 Source: CalPERS.
Prepared by Meketa Investment Group
Item 6a, Attachment 3, Page 24 of 45
California Public Employees’ Retirement System Private Equity Program
Portfolio Overview
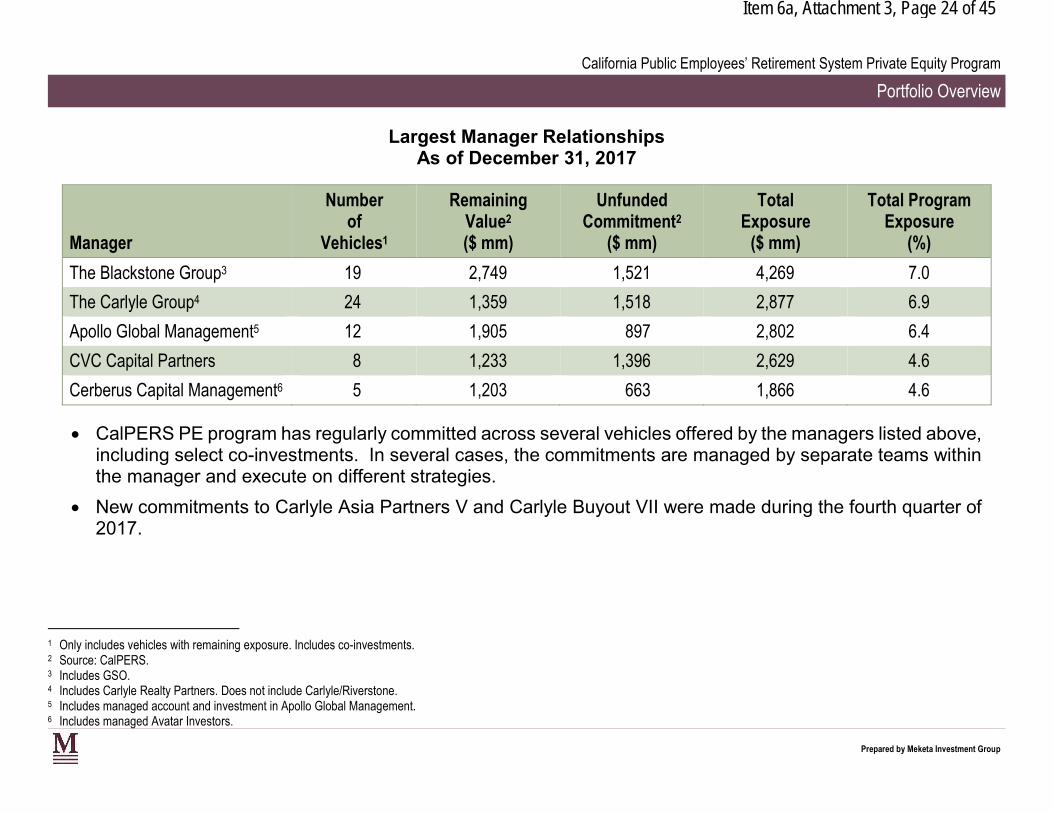
Largest Manager RelationshipsAs of December 31, 2017
Manager
Number of
Vehicles1
RemainingValue2
($ mm)
Unfunded Commitment2
($ mm)
Total Exposure
($ mm)
Total ProgramExposure
(%)
The Blackstone Group3 19 2,749 1,521 4,269 7.0
The Carlyle Group4 24 1,359 1,518 2,877 6.9
Apollo Global Management5 12 1,905 897 2,802 6.4
CVC Capital Partners 8 1,233 1,396 2,629 4.6
Cerberus Capital Management6 5 1,203 663 1,866 4.6
CalPERS PE program has regularly committed across several vehicles offered by the managers listed above, including select co-investments. In several cases, the commitments are managed by separate teams within the manager and execute on different strategies.
New commitments to Carlyle Asia Partners V and Carlyle Buyout VII were made during the fourth quarter of 2017.
1 Only includes vehicles with remaining exposure. Includes co-investments. 2 Source: CalPERS. 3 Includes GSO. 4 Includes Carlyle Realty Partners. Does not include Carlyle/Riverstone. 5 Includes managed account and investment in Apollo Global Management. 6 Includes managed Avatar Investors.
Prepared by Meketa Investment Group
Item 6a, Attachment 3, Page 25 of 45
California Public Employees’ Retirement System Private Equity Program
Portfolio Overview
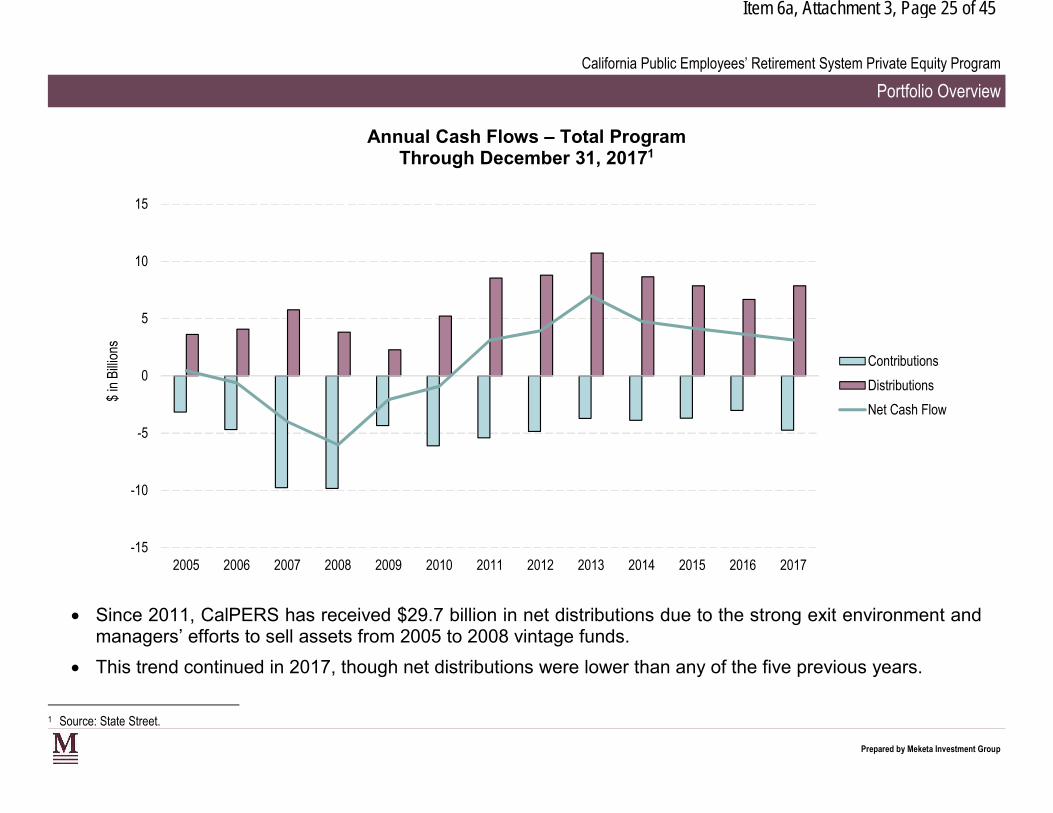
Annual Cash Flows – Total ProgramThrough December 31, 20171
15
10
5
Contributions 0
Distributions
Net Cash Flow
-5
-10
-15
Since 2011, CalPERS has received $29.7 billion in net distributions due to the strong exit environment and managers’ efforts to sell assets from 2005 to 2008 vintage funds.
This trend continued in 2017, though net distributions were lower than any of the five previous years.
$ in
Bill
ions
2005 2006 2007 2008 2009 2010 2011 2012 2013 2014 2015 2016 2017
1 Source: State Street.
Prepared by Meketa Investment Group
25.9 2.5
2.5 26.7
Item 6a, Attachment 3, Page 26 of 45
California Public Employees’ Retirement System Private Equity Program
Program Performance
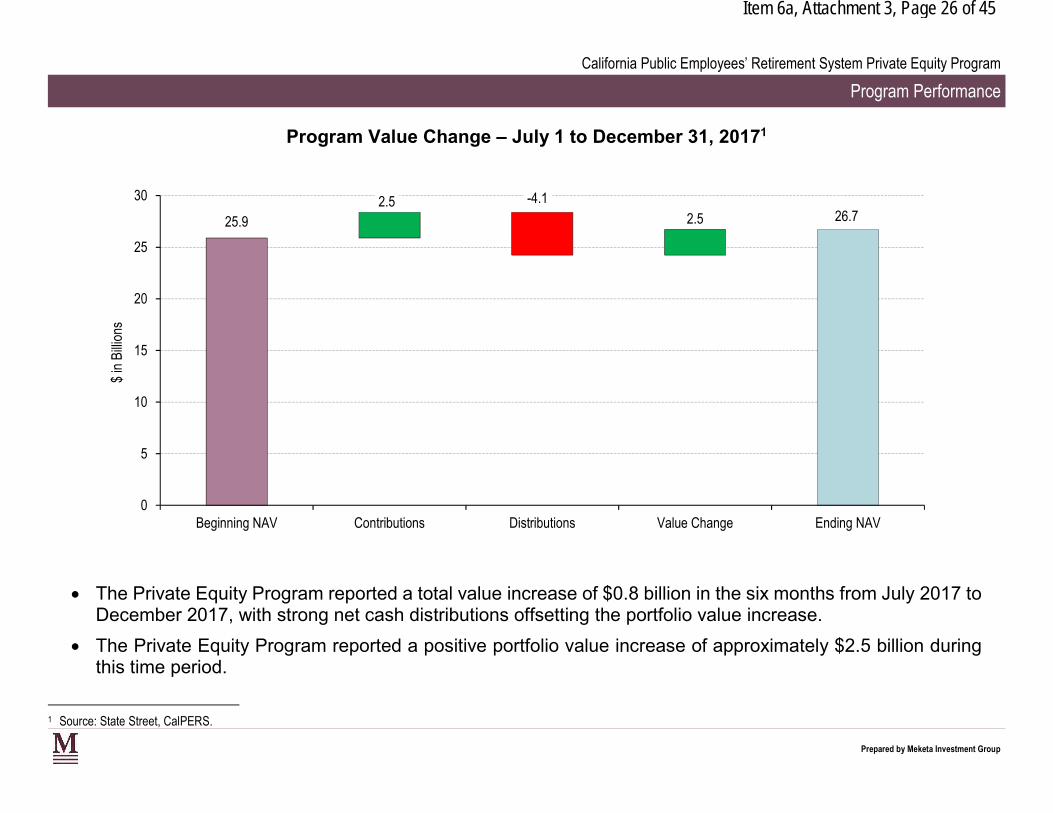
Program Value Change – July 1 to December 31, 20171
-4.1
$ in
Bill
ions
30
25
20
15
10
5
0 Beginning NAV Contributions Distributions Value Change Ending NAV
The Private Equity Program reported a total value increase of $0.8 billion in the six months from July 2017 to December 2017, with strong net cash distributions offsetting the portfolio value increase.
The Private Equity Program reported a positive portfolio value increase of approximately $2.5 billion during this time period.
1 Source: State Street, CalPERS.
Prepared by Meketa Investment Group
Item 6a, Attachment 3, Page 27 of 45
California Public Employees’ Retirement System Private Equity Program
Program Performance
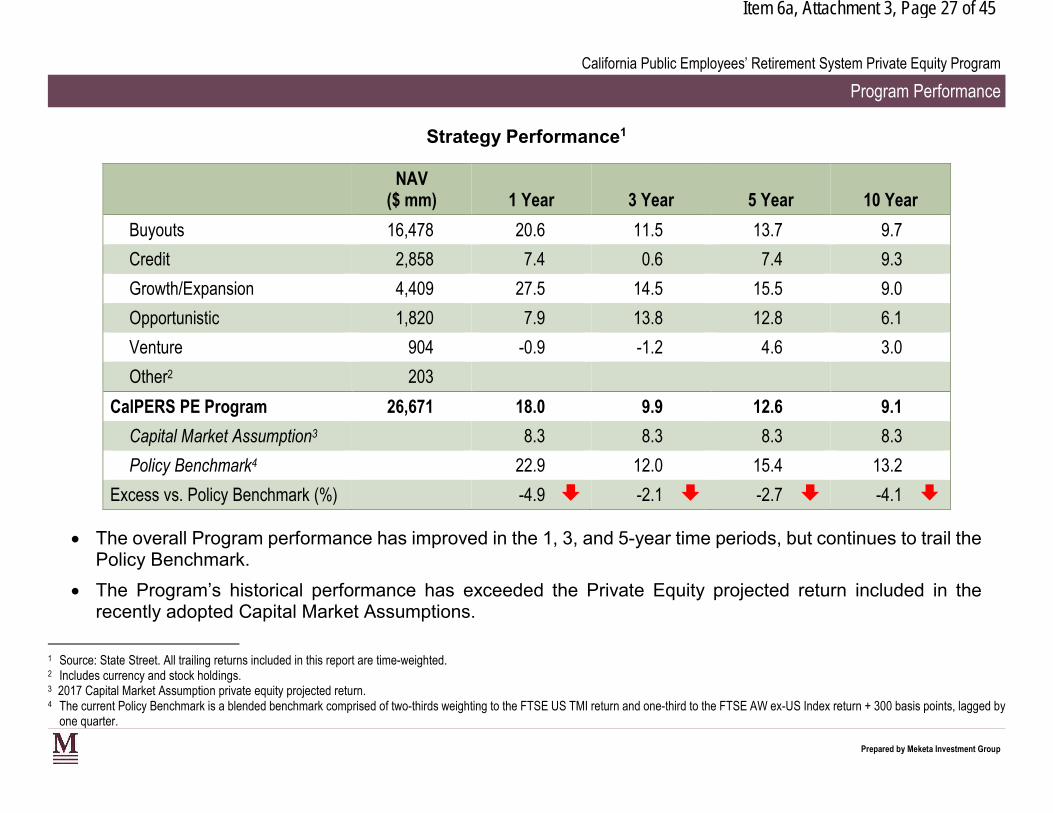
Strategy Performance1
NAV ($ mm) 1 Year 3 Year 5 Year 10 Year
Buyouts 16,478 20.6 11.5 13.7 9.7
Credit 2,858 7.4 0.6 7.4 9.3
Growth/Expansion 4,409 27.5 14.5 15.5 9.0
Opportunistic 1,820 7.9 13.8 12.8 6.1
Venture 904 -0.9 -1.2 4.6 3.0
Other2 203
CalPERS PE Program 26,671 18.0 9.9 12.6 9.1
Capital Market Assumption3 8.3 8.3 8.3 8.3
Policy Benchmark4 22.9 12.0 15.4 13.2
Excess vs. Policy Benchmark (%) -4.9 -2.1 -2.7 -4.1
The overall Program performance has improved in the 1, 3, and 5-year time periods, but continues to trail the Policy Benchmark.
The Program’s historical performance has exceeded the Private Equity projected return included in the recently adopted Capital Market Assumptions.
1 Source: State Street. All trailing returns included in this report are time-weighted. 2 Includes currency and stock holdings. 3 2017 Capital Market Assumption private equity projected return. 4 The current Policy Benchmark is a blended benchmark comprised of two-thirds weighting to the FTSE US TMI return and one-third to the FTSE AW ex-US Index return + 300 basis points, lagged by
one quarter.
Prepared by Meketa Investment Group
Item 6a, Attachment 3, Page 28 of 45
California Public Employees’ Retirement System Private Equity Program
Program Performance
Strategy Performance1 (continued)
Growth/Expansion investments have generated strong returns in the 1, 3 and 5-year time periods.
The Program’s Venture portfolio has posted negative trailing 1 year and 3 year returns, and has significantly underperformed other strategies.
The three largest strategies by NAV (Buyouts, Growth/Expansion, Credit), which represent approximately 87% of the Program’s current value, have also generated the highest 10 year returns.
Credit investments have lagged over the previous 3 years, mostly due to the underperformance of a large managed account.
The CalPERS PE Program’s overall performance has lagged its Policy Benchmark for periods of ten years or less.
1 Source: State Street. All trailing returns included in this report are time-weighted.
Prepared by Meketa Investment Group
Item 6a, Attachment 3, Page 29 of 45
California Public Employees’ Retirement System Private Equity Program
Program Performance
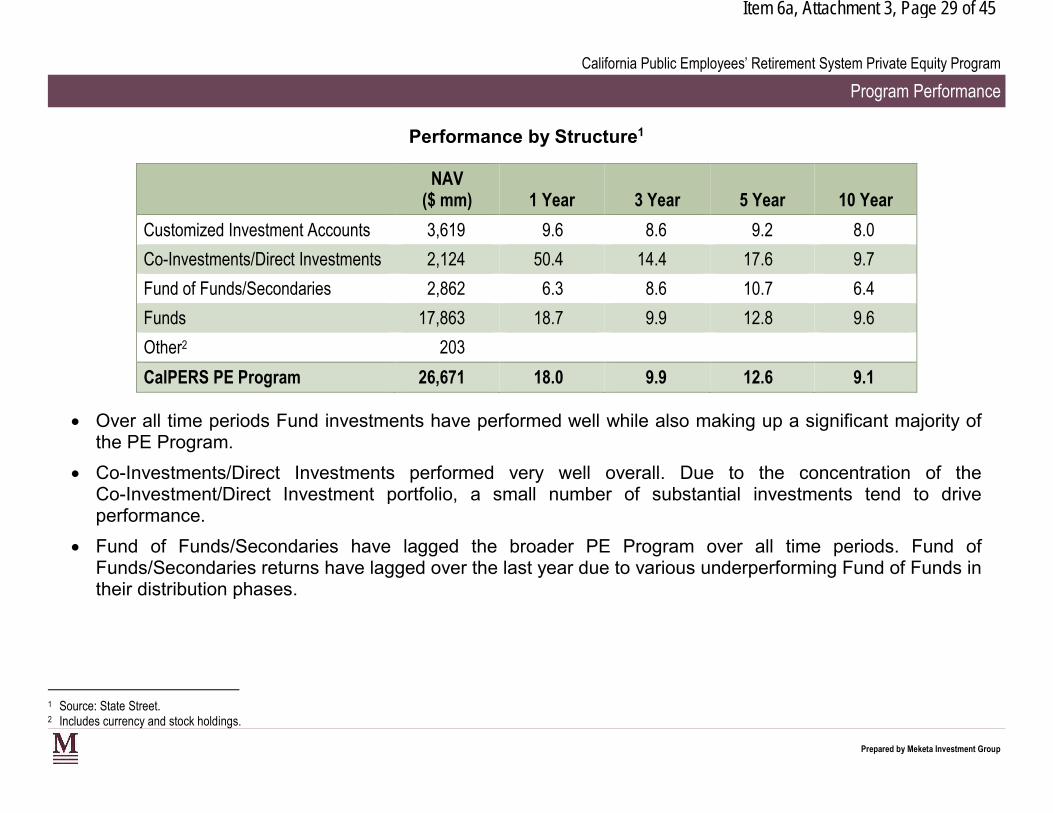
Performance by Structure1
NAV ($ mm) 1 Year 3 Year 5 Year 10 Year
Customized Investment Accounts 3,619 9.6 8.6 9.2 8.0
Co-Investments/Direct Investments 2,124 50.4 14.4 17.6 9.7
Fund of Funds/Secondaries 2,862 6.3 8.6 10.7 6.4
Funds 17,863 18.7 9.9 12.8 9.6
Other2 203
CalPERS PE Program 26,671 18.0 9.9 12.6 9.1
Over all time periods Fund investments have performed well while also making up a significant majority of the PE Program.
Co-Investments/Direct Investments performed very well overall. Due to the concentration of the Co-Investment/Direct Investment portfolio, a small number of substantial investments tend to drive performance.
Fund of Funds/Secondaries have lagged the broader PE Program over all time periods. Fund of Funds/Secondaries returns have lagged over the last year due to various underperforming Fund of Funds in their distribution phases.
1 Source: State Street. 2 Includes currency and stock holdings.
Prepared by Meketa Investment Group
Item 6a, Attachment 3, Page 30 of 45
California Public Employees’ Retirement System Private Equity Program
Program Performance
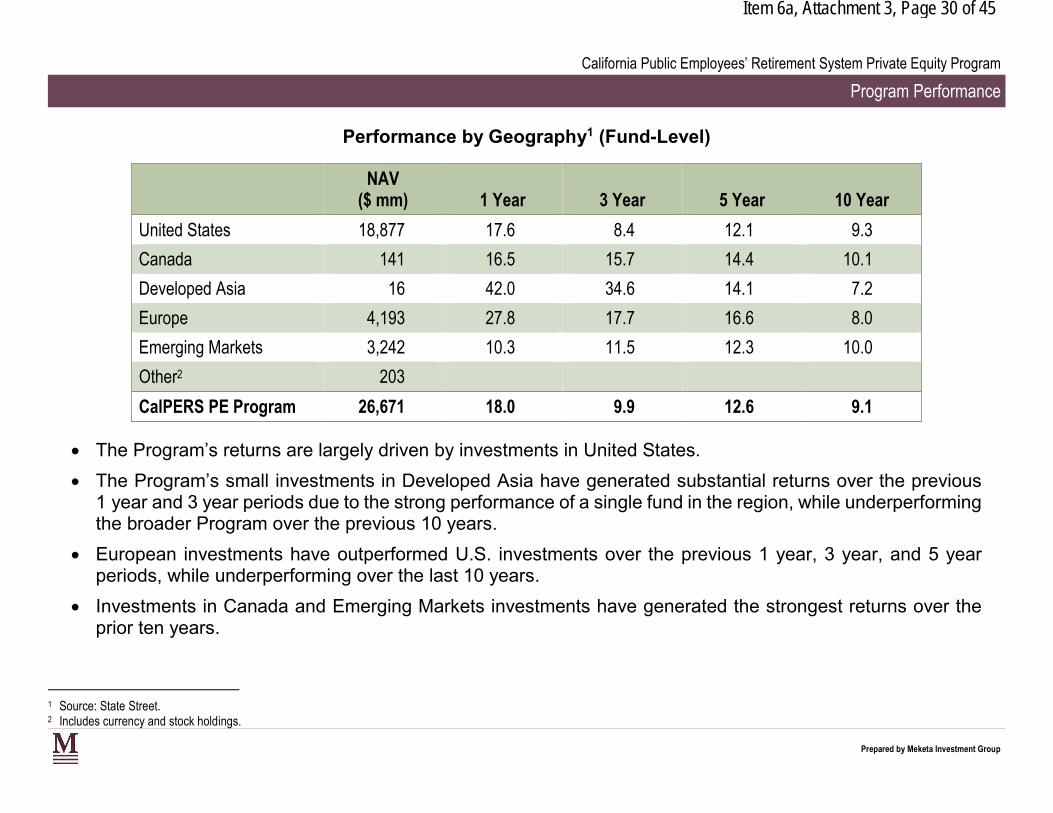
Performance by Geography1 (Fund-Level)
NAV ($ mm) 1 Year 3 Year 5 Year 10 Year
United States 18,877 17.6 8.4 12.1 9.3
Canada 141 16.5 15.7 14.4 10.1
Developed Asia 16 42.0 34.6 14.1 7.2
Europe 4,193 27.8 17.7 16.6 8.0
Emerging Markets 3,242 10.3 11.5 12.3 10.0
Other2 203
CalPERS PE Program 26,671 18.0 9.9 12.6 9.1
The Program’s returns are largely driven by investments in United States.
The Program’s small investments in Developed Asia have generated substantial returns over the previous 1 year and 3 year periods due to the strong performance of a single fund in the region, while underperforming the broader Program over the previous 10 years.
European investments have outperformed U.S. investments over the previous 1 year, 3 year, and 5 year periods, while underperforming over the last 10 years.
Investments in Canada and Emerging Markets investments have generated the strongest returns over the prior ten years.
1 Source: State Street. 2 Includes currency and stock holdings.
Prepared by Meketa Investment Group
Item 6a, Attachment 3, Page 31 of 45
California Public Employees’ Retirement System Private Equity Program
Program Activity
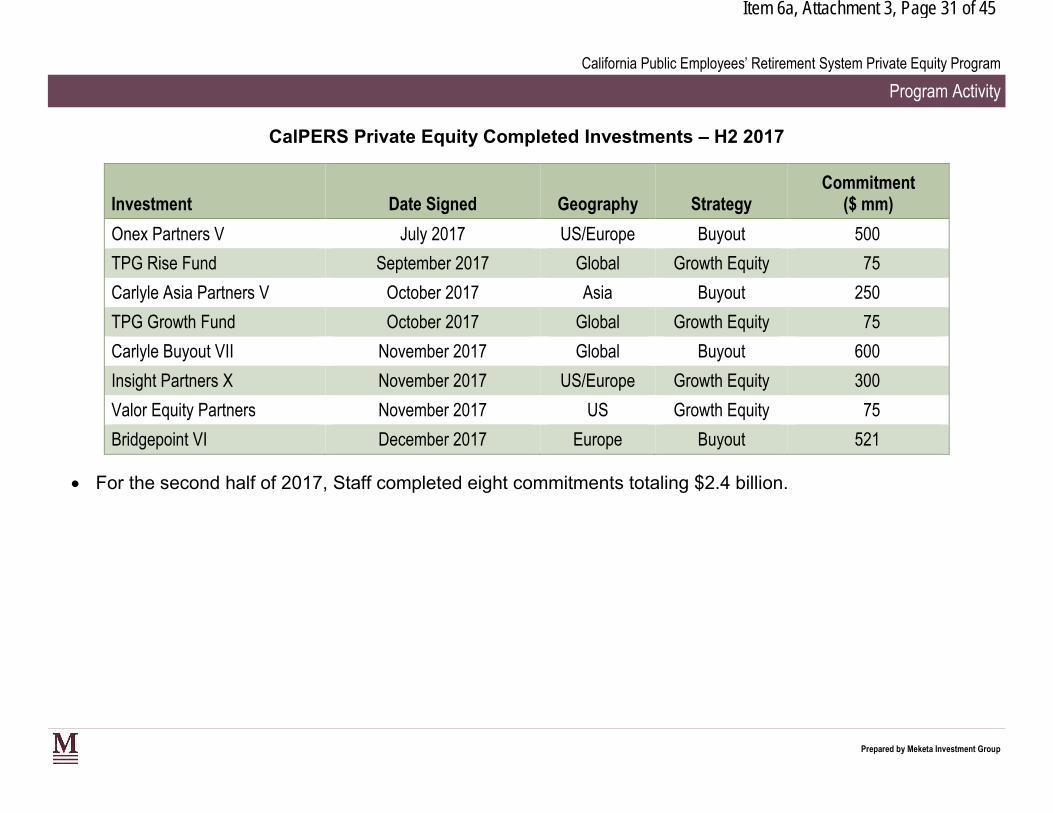
CalPERS Private Equity Completed Investments – H2 2017
Investment Date Signed Geography Strategy Commitment
($ mm)
Onex Partners V July 2017 US/Europe Buyout 500
TPG Rise Fund September 2017 Global Growth Equity 75
Carlyle Asia Partners V October 2017 Asia Buyout 250
TPG Growth Fund October 2017 Global Growth Equity 75
Carlyle Buyout VII November 2017 Global Buyout 600
Insight Partners X November 2017 US/Europe Growth Equity 300
Valor Equity Partners November 2017 US Growth Equity 75
Bridgepoint VI December 2017 Europe Buyout 521
For the second half of 2017, Staff completed eight commitments totaling $2.4 billion.
Prepared by Meketa Investment Group
Item 6a, Attachment 3, Page 32 of 45
California Public Employees’ Retirement System Private Equity Program
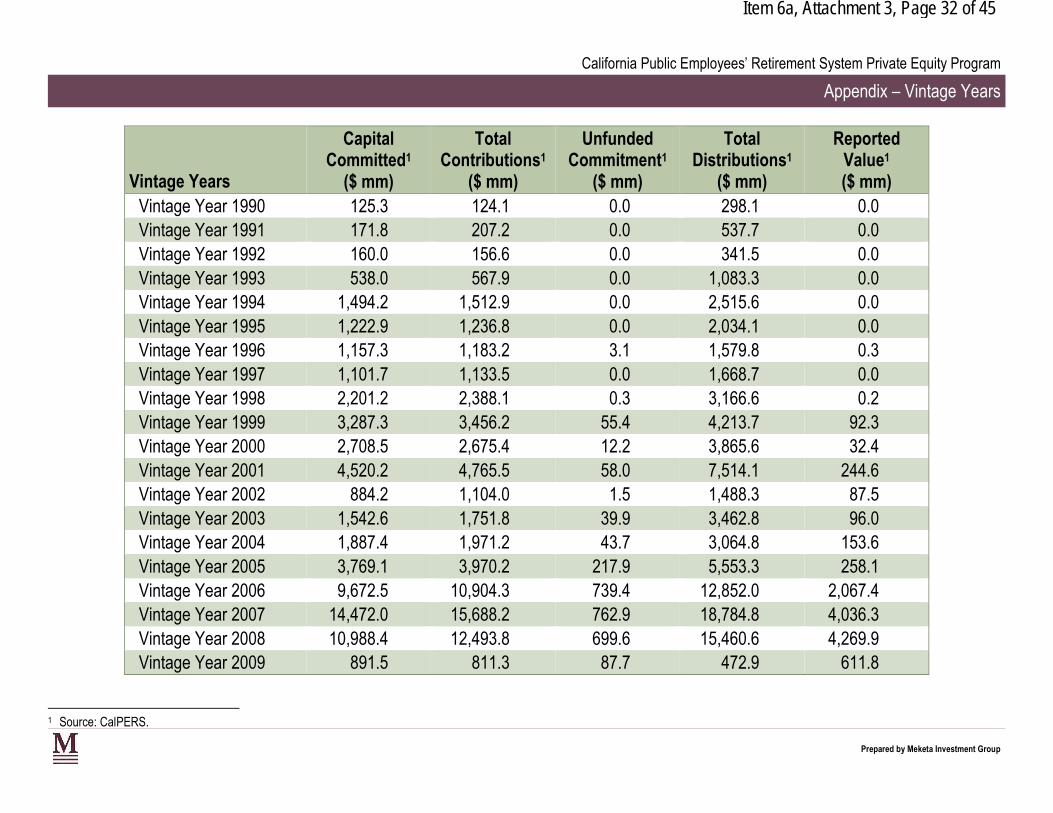
Appendix – Vintage Years
CapitalCommitted1
Total Contributions1
Unfunded Commitment1
Total Distributions1
ReportedValue1
Vintage Years ($ mm) ($ mm) ($ mm) ($ mm) ($ mm) Vintage Year 1990 125.3 124.1 0.0 298.1 0.0 Vintage Year 1991 171.8 207.2 0.0 537.7 0.0 Vintage Year 1992 160.0 156.6 0.0 341.5 0.0 Vintage Year 1993 538.0 567.9 0.0 1,083.3 0.0 Vintage Year 1994 1,494.2 1,512.9 0.0 2,515.6 0.0 Vintage Year 1995 1,222.9 1,236.8 0.0 2,034.1 0.0 Vintage Year 1996 1,157.3 1,183.2 3.1 1,579.8 0.3 Vintage Year 1997 1,101.7 1,133.5 0.0 1,668.7 0.0 Vintage Year 1998 2,201.2 2,388.1 0.3 3,166.6 0.2 Vintage Year 1999 3,287.3 3,456.2 55.4 4,213.7 92.3 Vintage Year 2000 2,708.5 2,675.4 12.2 3,865.6 32.4 Vintage Year 2001 4,520.2 4,765.5 58.0 7,514.1 244.6 Vintage Year 2002 884.2 1,104.0 1.5 1,488.3 87.5 Vintage Year 2003 1,542.6 1,751.8 39.9 3,462.8 96.0 Vintage Year 2004 1,887.4 1,971.2 43.7 3,064.8 153.6 Vintage Year 2005 3,769.1 3,970.2 217.9 5,553.3 258.1 Vintage Year 2006 9,672.5 10,904.3 739.4 12,852.0 2,067.4 Vintage Year 2007 14,472.0 15,688.2 762.9 18,784.8 4,036.3 Vintage Year 2008 10,988.4 12,493.8 699.6 15,460.6 4,269.9 Vintage Year 2009 891.5 811.3 87.7 472.9 611.8
1 Source: CalPERS.
Prepared by Meketa Investment Group
Item 6a, Attachment 3, Page 33 of 45
California Public Employees’ Retirement System Private Equity Program
Appendix – Vintage Years
Vintage Years (Continued)
CapitalCommitted1
($ mm)
Total Contributions1
($ mm)
Unfunded Commitment1
($ mm)
Total Distributions1
($ mm)
ReportedValue1
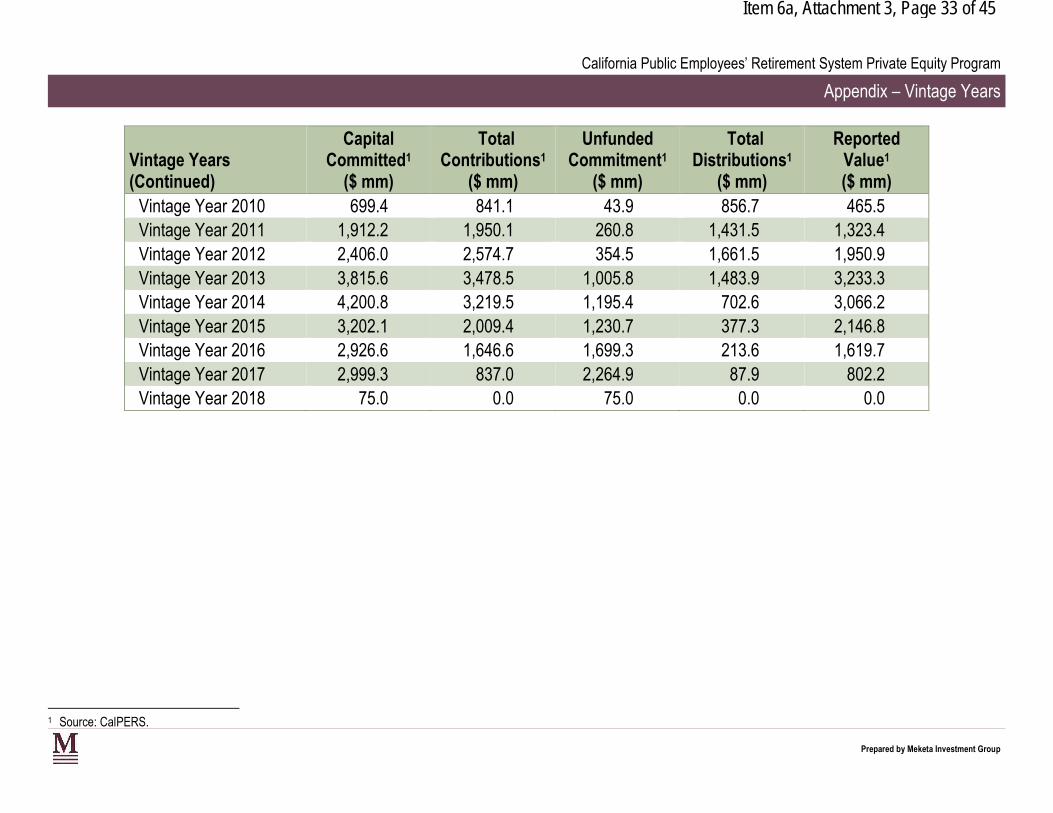
($ mm) Vintage Year 2010 699.4 841.1 43.9 856.7 465.5 Vintage Year 2011 1,912.2 1,950.1 260.8 1,431.5 1,323.4 Vintage Year 2012 2,406.0 2,574.7 354.5 1,661.5 1,950.9 Vintage Year 2013 3,815.6 3,478.5 1,005.8 1,483.9 3,233.3 Vintage Year 2014 4,200.8 3,219.5 1,195.4 702.6 3,066.2 Vintage Year 2015 3,202.1 2,009.4 1,230.7 377.3 2,146.8 Vintage Year 2016 2,926.6 1,646.6 1,699.3 213.6 1,619.7 Vintage Year 2017 2,999.3 837.0 2,264.9 87.9 802.2 Vintage Year 2018 75.0 0.0 75.0 0.0 0.0
1 Source: CalPERS.
Prepared by Meketa Investment Group
Item 6a, Attachment 3, Page 34 of 45
California Public Employees’ Retirement System Private Equity Program
Appendix – Strategy
CapitalCommitted1
Total Contributions1
Unfunded Commitment1
Total Distributions1
ReportedValue1
Strategies ($ mm) ($ mm) ($ mm) ($ mm) ($ mm)
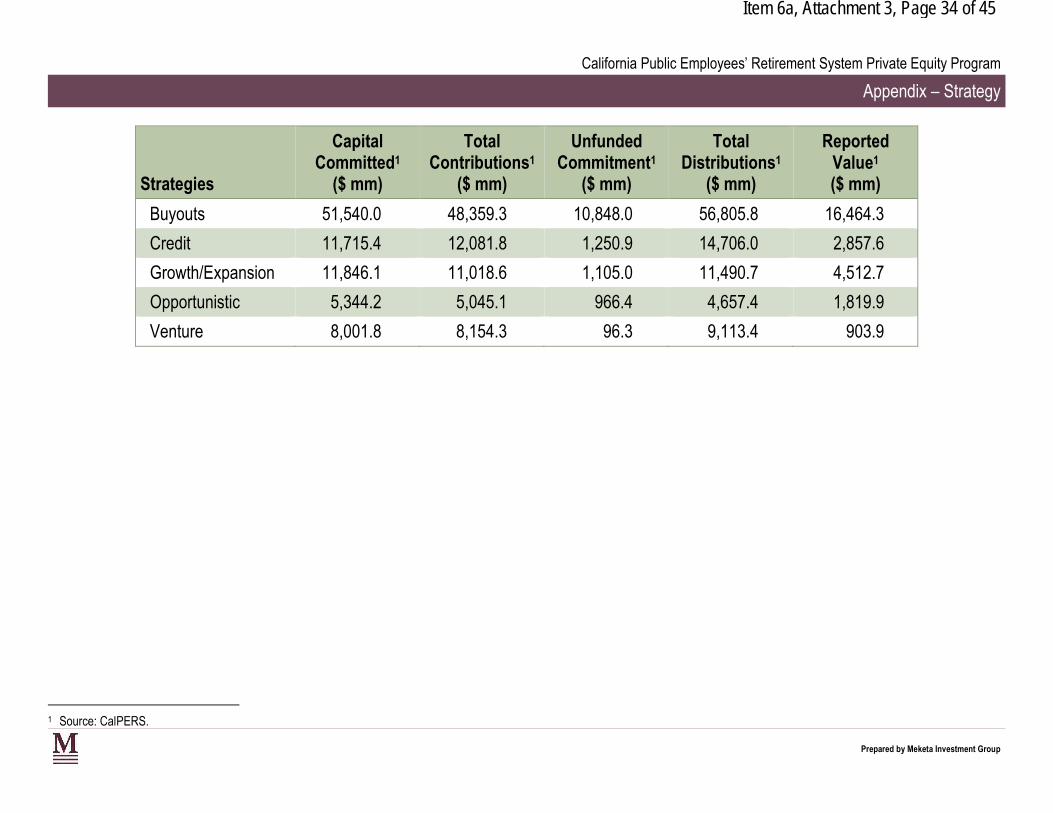
Buyouts 51,540.0 48,359.3 10,848.0 56,805.8 16,464.3
Credit 11,715.4 12,081.8 1,250.9 14,706.0 2,857.6
Growth/Expansion 11,846.1 11,018.6 1,105.0 11,490.7 4,512.7
Opportunistic 5,344.2 5,045.1 966.4 4,657.4 1,819.9
Venture 8,001.8 8,154.3 96.3 9,113.4 903.9
1 Source: CalPERS.
Prepared by Meketa Investment Group

Item 6a, Attachment 3, Page 35 of 45
Glossary of TermsAs of December 31, 2017
Item 6a, Attachment 3, Page 36 of 45
California Public Employees’ Retirement System Private Equity Program
Glossary of Terms
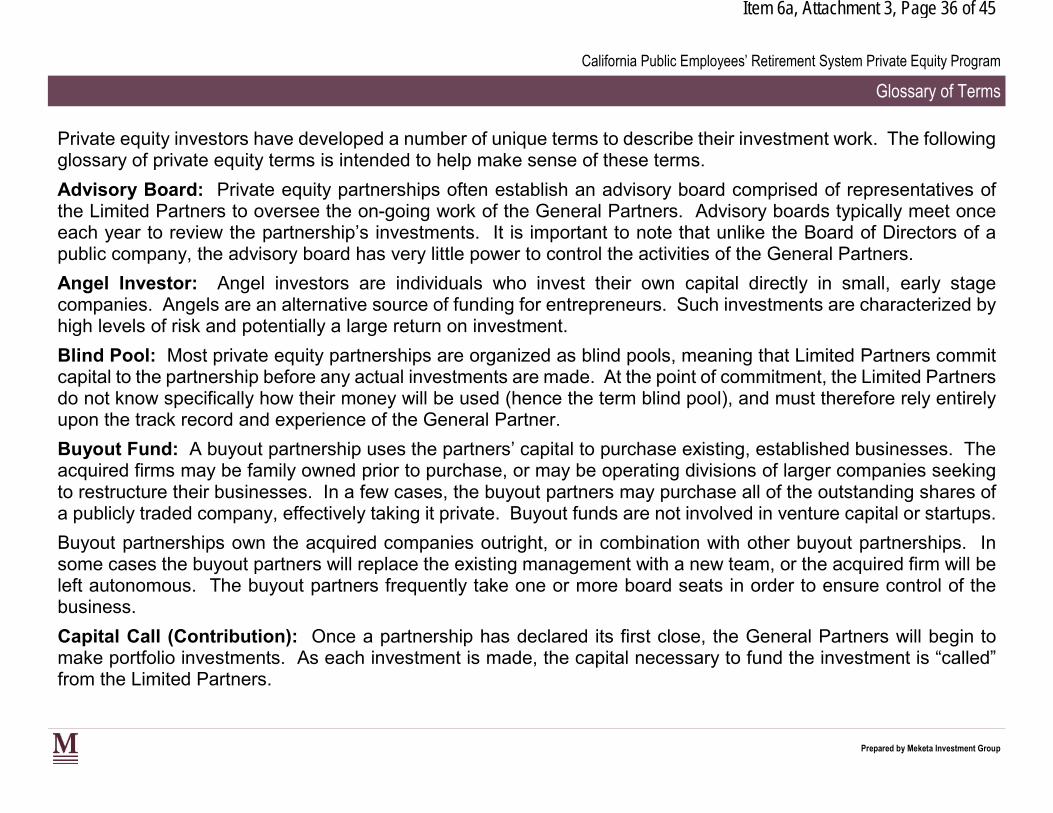
Private equity investors have developed a number of unique terms to describe their investment work. The following glossary of private equity terms is intended to help make sense of these terms.
Advisory Board: Private equity partnerships often establish an advisory board comprised of representatives of the Limited Partners to oversee the on-going work of the General Partners. Advisory boards typically meet once each year to review the partnership’s investments. It is important to note that unlike the Board of Directors of a public company, the advisory board has very little power to control the activities of the General Partners.
Angel Investor: Angel investors are individuals who invest their own capital directly in small, early stage companies. Angels are an alternative source of funding for entrepreneurs. Such investments are characterized by high levels of risk and potentially a large return on investment.
Blind Pool: Most private equity partnerships are organized as blind pools, meaning that Limited Partners commit capital to the partnership before any actual investments are made. At the point of commitment, the Limited Partners do not know specifically how their money will be used (hence the term blind pool), and must therefore rely entirely upon the track record and experience of the General Partner.
Buyout Fund: A buyout partnership uses the partners’ capital to purchase existing, established businesses. The acquired firms may be family owned prior to purchase, or may be operating divisions of larger companies seeking to restructure their businesses. In a few cases, the buyout partners may purchase all of the outstanding shares of a publicly traded company, effectively taking it private. Buyout funds are not involved in venture capital or startups.
Buyout partnerships own the acquired companies outright, or in combination with other buyout partnerships. In some cases the buyout partners will replace the existing management with a new team, or the acquired firm will be left autonomous. The buyout partners frequently take one or more board seats in order to ensure control of the business.
Capital Call (Contribution): Once a partnership has declared its first close, the General Partners will begin to make portfolio investments. As each investment is made, the capital necessary to fund the investment is “called” from the Limited Partners.
Prepared by Meketa Investment Group
Item 6a, Attachment 3, Page 37 of 45
California Public Employees’ Retirement System Private Equity Program
Glossary of Terms
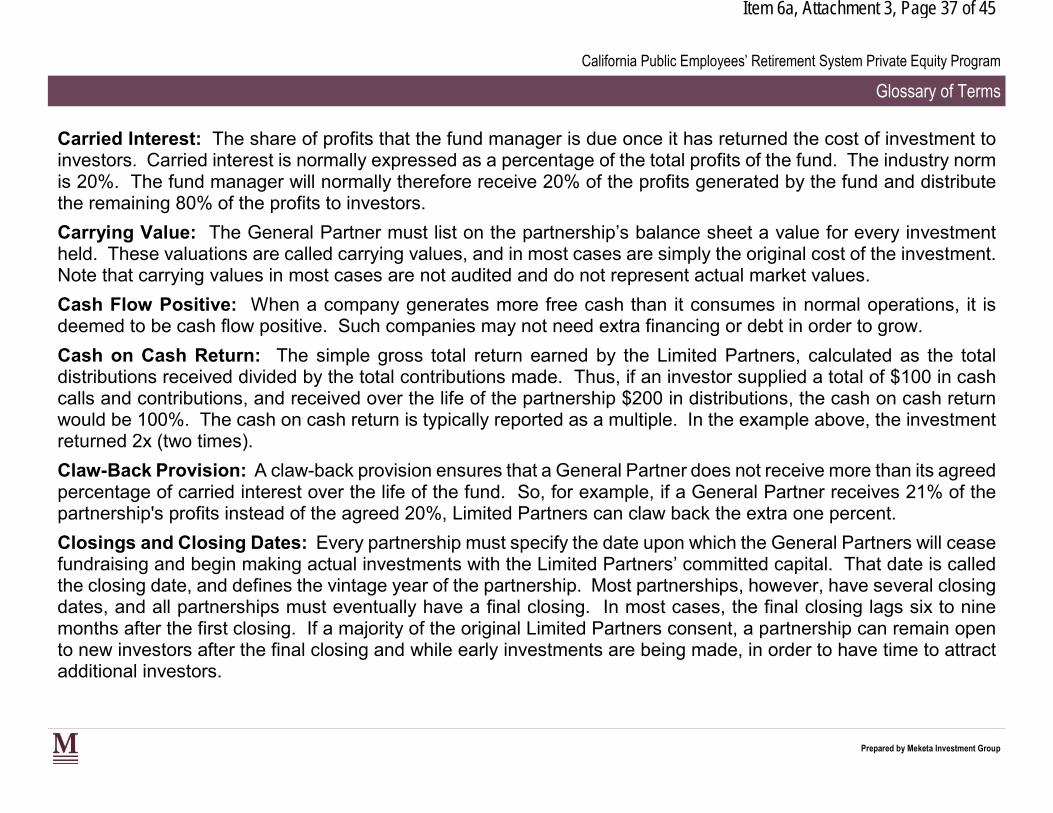
Carried Interest: The share of profits that the fund manager is due once it has returned the cost of investment to investors. Carried interest is normally expressed as a percentage of the total profits of the fund. The industry norm is 20%. The fund manager will normally therefore receive 20% of the profits generated by the fund and distribute the remaining 80% of the profits to investors.
Carrying Value: The General Partner must list on the partnership’s balance sheet a value for every investment held. These valuations are called carrying values, and in most cases are simply the original cost of the investment. Note that carrying values in most cases are not audited and do not represent actual market values.
Cash Flow Positive: When a company generates more free cash than it consumes in normal operations, it is deemed to be cash flow positive. Such companies may not need extra financing or debt in order to grow.
Cash on Cash Return: The simple gross total return earned by the Limited Partners, calculated as the total distributions received divided by the total contributions made. Thus, if an investor supplied a total of $100 in cash calls and contributions, and received over the life of the partnership $200 in distributions, the cash on cash return would be 100%. The cash on cash return is typically reported as a multiple. In the example above, the investment returned 2x (two times).
Claw-Back Provision: A claw-back provision ensures that a General Partner does not receive more than its agreed percentage of carried interest over the life of the fund. So, for example, if a General Partner receives 21% of the partnership's profits instead of the agreed 20%, Limited Partners can claw back the extra one percent.
Closings and Closing Dates: Every partnership must specify the date upon which the General Partners will cease fundraising and begin making actual investments with the Limited Partners’ committed capital. That date is called the closing date, and defines the vintage year of the partnership. Most partnerships, however, have several closing dates, and all partnerships must eventually have a final closing. In most cases, the final closing lags six to nine months after the first closing. If a majority of the original Limited Partners consent, a partnership can remain open to new investors after the final closing and while early investments are being made, in order to have time to attract additional investors.
Prepared by Meketa Investment Group
Item 6a, Attachment 3, Page 38 of 45
California Public Employees’ Retirement System Private Equity Program
Glossary of Terms
Co-Investment: In some cases, Limited Partners want the right to make additional direct investments in one or more of the underlying companies purchased by the General Partner. If the partnership agreement gives co-investment rights to specific Limited Partners, then they may elect to invest additional monies “along side” the General Partner in various deals. In these cases, the co-investing Limited Partners would have two investments in an underlying property: their share of the partnership’s investment, and their direct additional co-investment on the side. Note that co-investment rights may be available only to the largest Limited Partners.
Co-investment rights are often negotiated by very large Limited Partners when they have strong convictions about the deal finding skills of the General Partners, because co-investment rights permit them to make even larger investments in the underlying properties than would otherwise be possible, without paying carried interest.
Committed Capital: When a private equity Limited Partnership is formed, each Limited Partner agrees to contribute a specific amount of capital to be invested over the life of the partnership. Once the agreement is signed, the Limited Partners are legally bound and committed to supply the agreed upon capital when it is called for by the General Partner.
Consolidation (Roll Up): Many industries in America are highly fragmented, as the market space is serviced by a large number of locally owned businesses. By consolidating fragmented industries (i.e., purchasing many local businesses), private equity firms can create a single larger company with greater market control, more attractive financial characteristics, and potentially, better pricing flexibility and lower costs.
Convertible Bonds: Some private equity partnerships, generally those that provide mezzanine financing, may take convertible bonds as part of their compensation for providing investment capital. The convertible bond pays interest like other bonds, but can be exchanged for shares of the company stock at a favorable price if certain conditions are met, hence the term convertible.
Direct Investment: Partnerships that invest in companies are said to make direct investments. The alternative is a partnership that invests in other partnerships, a fund of funds.
Prepared by Meketa Investment Group
Item 6a, Attachment 3, Page 39 of 45
California Public Employees’ Retirement System Private Equity Program
Glossary of Terms
EBITDA (Earnings Before Interest, Taxes, Depreciation, and Amortization): The “top line” profits of a private company are the monies earned before paying interest and taxes, and adding back depreciation and amortization. Unlike public companies, which are valued as the multiple of bottom line earnings to the stock price (P/E or price to earnings), private companies are valued as the multiple of EBITDA to the price of the stock.
There is no simple conversion factor that will convert an EBITDA multiple to a P/E for all companies, but in general, a factor of 2 is appropriate. Thus, a private company selling for an EBITDA multiple of 6 is priced about as richly as a public company with a P/E of 12.
EBITDA Multiples: The ratio of a private company’s top line earnings to the price of its shares. See EBITDA above.
Enterprise Value: A measure of a company's value, often used as an alternative to straightforward market capitalization. Enterprise Value is calculated as market cap plus debt, minority interest and preferred shares, minus total cash and cash equivalents.
Fee Income: The General Partners in a private equity partnership generally receive two types of compensation: fee income as payment for their portfolio management services, and a share of any profits (carried interest) as incentive compensation.
Fund of Funds: A private equity partnership that consists primarily of investments in other partnerships, as opposed to direct investments in individual companies and deals. The General Partners of a fund of funds thus act as a manager of managers to create a diversified portfolio of partnerships, each of which in turn consists of a portfolio of direct investment deals.
Although a fund of funds is a collection of partnerships, the fund of funds itself is a partnership, and therefore has a vintage year, a commitment period, a distribution phase, and a final end. Thus, fund of funds have finite lifetimes, just like their underlying partnerships.
The advantages of a fund of funds are high diversification and “one stop shopping,” i.e., the client has a single relationship with the fund of funds manager.
Prepared by Meketa Investment Group
Item 6a, Attachment 3, Page 40 of 45
California Public Employees’ Retirement System Private Equity Program
Glossary of Terms
The disadvantages of fund of funds are higher costs (another entire layer of management fees and carried interest), an additional loss of liquidity, and an additional loss of control by the Limited Partners. Just as with direct private equity funds, a fund of funds is organized as a blind pool. That is, when a new fund of funds is announced, and a subscription target set, early investors do not know what specific sub-funds will be selected by the manager. Generally, the Private Placement Memorandum gives the General Partner almost unlimited latitude in making subsequent investments.
General Partner: The control partner in private equity partnerships, analogous to the portfolio manager in a public stock portfolio. Under the IRS code, the General Partner must commit some personal capital to the partnership (a minimum of 1% of the partnership’s committed capital), and unlike the Limited Partners, is liable for leverage and other losses generated by the partnership.
Growth (Expansion Capital): A strategy that entails providing capital to a private company with the intention that the capital be used to expand operations. Generally, expansion capital strategies result in minority equity positions in companies, but with some degree of control over how the expansion capital is spent.
Hurdle Rate: The minimum rate of return that the Limited Partners must receive before the General Partners have a right to a share of any additional profits (carried interest) produced by the partnership’s investments. For example, the partnership may specify that once the Limited Partners have received distributions representing an 8% total return on their commitment (the hurdle rate), the General Partner will share in all future distributions until they have been allocated 80% to the Limited Partners, and 20% to the General Partners (their carried interest).
In-Kind Distribution: Most distributions from private equity partnerships are in cash. However, in some cases, a private deal will be taken public through an initial public offering (IPO), or through a trade sale for stock to a public company. In these cases, the Limited Partners will receive their distributions in the form of publicly traded common stocks and/or rights and warrants.
Investment Period: The period of time after the first closing during which the General Partner will call capital from the Limited Partners and make partnership investments. Legally, the investment period is usually six years. Practically, it is three to four years. Not to be confused with the term of the partnership, generally ten to twelve years.
Prepared by Meketa Investment Group
Item 6a, Attachment 3, Page 41 of 45
California Public Employees’ Retirement System Private Equity Program
Glossary of Terms
IPO (Initial Public Offering): When a private company issues publicly traded stock, it becomes known as a public company. The initial sale of publicly available stock is called the initial public offering, or IPO.
IRR (Internal Rate of Return): The annualized rate of return on capital that is generated or capable of being generated within an investment or portfolio over a period of time, assuming all cash flows can be reinvested at the same rate. Mathematically, the IRR of an investment is the discount rate applied to that investment such that the net present value of the investment is zero. IRR is commonly used to measure profitability by applying the calculation to the after tax cash flows to arrive at an after-tax equity yield rate.
J-Curve: Many private equity partnerships have small negative returns in their first years of operation as capital is invested. The negative returns result because the partnership’s investments have not matured and turned a profit, but the partnership has nevertheless experienced various operating costs. When early deals begin to mature and are liquidated at a profit, the partnership’s returns should become positive. Thus, the graph of the partnership’s returns versus time can resemble the capital letter “J.”
Later Stage Fund: A venture capital partnership that specializes in investing in startup companies that have already achieved at least some actual revenues, or a venture fund that provides subsequent rounds of venture financing after all of the capital provided in the first rounds has been consumed.
Lead Investor: Describes a General Partner who is the “lead” investor in a deal, as opposed to co-investors or follow-on investors. The term implies that the lead investor has taken the lead in sourcing, evaluating, and executing the deal.
Leverage: Many General Partners use both equity capital provided by the Limited Partners and money borrowed from banks or other lenders to finance their investments. Any borrowed money is called leverage. If a deal is successful, leverage can often enhance the returns of the Limited Partners substantially. On the other hand, too much leverage can cripple an investment with interest and financing costs. It is important to note that the Limited Partners are not responsible for the repayment of any borrowed money.
Leveraged Buyouts: The purchase of a private or public company wherein the bulk of the purchase price is paid using borrowed money.
Prepared by Meketa Investment Group
Item 6a, Attachment 3, Page 42 of 45
California Public Employees’ Retirement System Private Equity Program
Glossary of Terms
Limited Partner: All investors in a Limited Partnership other than the named General Partner are defined under the IRS code as Limited Partners. Limited Partners have only the control rights defined for them in the Private Placement Memorandum, and are generally passive investors in the partnership’s deals.
A very important point is that Limited Partner’s total liability for all deals made by the partnership are limited strictly by law to the Limited Partner’s committed capital. Thus, even if the General Partners borrow a great deal of money (leverage), and lose it all, the lenders have no recourse to the assets of the Limited Partners. In effect, a Limited Partner can lose no more than the amount of money invested.
Look-Back Provision: See Claw-Back Provision above.
Mezzanine Financing: An additional level of financing provided to a private company to expand sales, market share, or develop new products. Most mezzanine financing is structured as a package of high coupon bonds with equity “kickers,” i.e., rights to acquire the company’s stock at a favorable price at a future point. Companies seeking mezzanine financing often have substantial revenues, and if not actual profits, the expectation of imminent profitability.
Multiples and Multiple Expansion: Managers purchasing public common stocks often buy companies with low price to earnings multiples when they believe some factor will induce other investors to bid up the price of the stock without an increase in actual earnings, thus causing the price multiple to expand. In the same fashion, a General Partner may purchase a private company with a low EBITDA multiple, expecting to profit through an expansion of that multiple. A typical example of a multiple expansion plan is consolidation. Many small companies, operating independently, may each be priced at relatively low multiples. But if purchased and combined into a larger, cohesive entity, investors might be willing to pay a higher multiple for the aggregate than for any individual component. Placement Agent: Unlike public stock management companies, most of whom utilize an in-house sales force to market their services, private equity partnerships are generally marketed by third-party placement agents. These outside marketing firms and individuals are paid a commission by the General Partner.
Platform Company: Some private equity buyout funds attempt to add value by merging companies into larger, more cost efficient enterprises. This strategy generally begins with the acquisition of a platform company, often a market leader, to which other companies are added.
Prepared by Meketa Investment Group
Item 6a, Attachment 3, Page 43 of 45
California Public Employees’ Retirement System Private Equity Program
Glossary of Terms
PPM (Private Placement Memorandum): Because Limited Partnership interests are not registered with the SEC, private equity managers must distribute a comprehensive document to prospective investors that describes the broad investment thesis of the partnership, and highlights any risks involved in the partnership. This document is called a Private Placement Memorandum.
Public to Private: If a private partnership (or group of private partnerships) purchases all of the outstanding shares of a publicly traded company, the company’s shares may be de-listed from the stock exchange. The company is then said to have been “taken private.” For example, in June 1989, the private partnership Wings Holdings acquired the public stock of Northwest Airlines in a $3.65 billion-dollar leveraged buyout. Following this acquisition, Northwest became a privately held corporation for the first time since 1941.
Secondary Fund: Occasionally, a Limited Partner will wish to sell his interest in a partnership before the term of the partnership is completed. Any such sale is termed a secondary market sale. A secondary fund creates a portfolio of partnership interests from earlier partnerships purchased in the secondary market. The advantage of a secondary fund is that it gives investors an opportunity to invest in seasoned partnerships from closed funds of prior vintage years.
Sponsor: Every private equity opportunity that Meketa Investment Group evaluates is assigned to a sponsor. This individual, who is a member of Meketa Investment Group’s Private Equity Investment Committee, is responsible for the collection of information and the evaluation of the opportunity.
Take Down/Draw Down: A take down or a draw down is the same as a capital call.
Term: The term of a private equity partnership is its expected lifetime, and is specified in the Private Placement Memorandum. Most partnerships have a term of ten years, with the option to extend the term once or twice by an additional year if the Limited Partners approve.
The term of a partnership consists of several phases. After the final closing, no new commitments are accepted and the partnership enters the commitment phase or investment phase, legally lasting up to six years, but generally lasting three to four years, during which the individual investments are made. A distribution phase follows, during
Prepared by Meketa Investment Group
Item 6a, Attachment 3, Page 44 of 45
California Public Employees’ Retirement System Private Equity Program
Glossary of Terms
which mature investments are realized and profits distributed to the partners. The final phase is the liquidation phase, during which all remaining properties and assets are sold in order to terminate the partnership.
Trade Sale: The most prevalent exit strategy for many private equity managers involves selling a company in the private markets, usually through an auction process, to other private equity investors or to larger companies. This type of exit is termed a trade sale.
Turnaround: A turnaround strategy involves buying a troubled company, usually for a relatively low price, and making significant managerial or organizational changes to better the company’s operations and enhance profitability.
VCOC (Venture Capital Operating Company): The IRS code defines one category of private partnerships to be venture capital operating companies for tax purposes. The General Partners of VCOCs are not required to register with the SEC as investment advisors. The name venture capital operating company relates only to the partnership’s legal and tax structure, and does not imply that the partnership will invest in venture capital deals. For example, a middle market buyout fund, which invests only in mature companies with enterprise values of between $200 million and $1 billion, may be structured as a venture capital operating company.
Venture Capital: Money supplied to entrepreneurs to create new businesses is called venture capital. It is the first stage of financing for any new venture.
Traditionally, the recipient of the venture capital was a small group of entrepreneurs with an idea and a business plan, but no management team, corporate structure, revenues or profits. In the 1990s, however, venture capital was often used to seed established teams of entrepreneurs with well-defined products and in-place corporate structures. Thus, there is great variability in the meaning of venture capital and in the types of deals financed with venture capital money.
Vintage Year: The calendar year in which the first cash flow to a partnership occurred. This cash flow can be intended for management fees or investment capital. Vintage year can be used to differentiate the partnerships established over time by a General Partner, to track portfolio commitment pacing, and to benchmark portfolio performance.
Prepared by Meketa Investment Group
Item 6a, Attachment 3, Page 45 of 45
California Public Employees’ Retirement System Private Equity Program
Glossary of Terms
Warrants: Just like publicly traded companies, private companies may issue warrants to their shareholders or to other groups providing some form of financing. A warrant is the right to purchase shares of the company’s stock at a future date at a predetermined price, called the exercise price. Warrants become valuable if the exercise price is below the market price of the stock.
Prepared by Meketa Investment Group


![SERV1 06E Symbolic [Compatibility Mode]](https://img.pdfslide.net/doc/110x75/5695d4571a28ab9b02a11fb0/serv1-06e-symbolic-compatibility-mode.jpg)
![PRO1 06E [읽기 전용]](https://img.pdfslide.net/doc/110x75/6298598c4a10556af974ac8a/pro1-06e-.jpg)
![[Ex 3303-06e] Jahar Searches for Boston Exp](https://img.pdfslide.net/doc/110x75/56d6bf811a28ab3016968169/ex-3303-06e-jahar-searches-for-boston-exp.jpg)