Embed Size (px)
Citation preview

SEM
I-AN
NUA
L RE
PORT
&
AC
CO
UN
TS
Janus Henderson Global Select Funds
For the half year ended 31 December 2017 (Unaudited)

General Managers Henderson Global Investors (Singapore) Limited Company Registration Number 199700782N Registered Address One Marina Boulevard #28-00
Singapore 018989 Operating Address 138 Market Street #34-03/04
CapitaGreen Singapore 048946
Directors of Henderson Global Investors (Singapore) Limited
Alexander Jonathan Henderson Robert William Adams Timothy Alan Gibson Sophia Sally Rahmani
Trustee BNP Paribas Trust Services Singapore Limited
20 Collyer Quay, #01-01, Singapore 049319
Auditors PricewaterhouseCoopers LLP
7 Straits View, Marina One East Tower Level 12 Singapore 018936

Janus Henderson Global Select Funds (previously known as Henderson Global Select Funds)
Contents Page Managers’ report 1 Financial Statements
Statements of Total Return 18 Statements of Financial Position 21 Statements of Movements of Unitholders' Funds 23 Statements of Portfolio 26
Other Information 34

Janus Henderson Global Select Funds -
1
Janus Henderson Asian Growth Fund (previously known as Henderson Global Select Funds - Henderson Pacific Dragon Fund) Manager's Report* For the six months from 1 July 2017 to 31 December 2017 Investment Fund Manager Andrew Gillan and Mervyn Koh The fund gained 11.3% in US dollar terms during the six months under review, against the MSCI All Countries Asia Pacific ex Japan Index’s rise of 14.3%. There were no major global macroeconomic shocks, as conditions remain conducive for growth. Economic data pointed to a very healthy global economy as unemployment rates reached historical lows in G3 economies. While central banks around the world continued to indicate that the level of monetary policy stimulus will be gradually reduced, the US Federal Reserve hiked the benchmark lending rate by 25 basis points in December, in line with market expectations. Against this backdrop, Asian markets posted steady gains throughout the period on the back of strong economic growth, underpinned by strong export numbers and positive purchasing managers’ indices. Within the region, October 2017 witnessed the 19
th National Congress of the Communist
Party of China, where President Xi Jinping expectedly retained his top position in the Party, and a new guiding ideology was written into the Party’s Constitution. Meanwhile in India, economic reforms continued gathering pace with the implementation of a nationwide goods and services tax regime, following the controversial demonetisation policy in November 2016. Despite posting healthy gains, the fund lagged the index over the six months, with the bulk of the underperformance coming from the quarter ending September. The main driver of underperformance was our overweight position and stock selection in Taiwan, as there were heavy profit taking on names such as Largan Precision and Hon Hai Precision Industry following the latest iPhone launch. We maintained our positions in both companies and believe they can continue to deliver good earnings growth despite the noise around monthly numbers. Stock selection in India also detracted from performance, with ITC and Power Grid particularly weak. Shares of the former took a hit after the Indian government went back on its earlier decision of not raising taxes on cigarettes, while there were some concerns on the visibility of orders over the medium term for the latter. However, the fund continues to hold positions in both. On a sector level, the underweight position and strong stock selection in financials contributed positively, led by strong performance of our holdings in conglomerate Ayala Corporation in the Philippines and HDFC Bank in India. The fund’s lack of holdings in Australian banks also helped as shares of the big four banks were particularly weak. The underweight position to the telecommunications sector contributed to performance as well. There were quite a number of changes to the fund during the period under review. Within China and Hong Kong, we added new positions in Midea, ENN, BOC Hong Kong and Yum China, all of which we believe offer attractive value relative to their growth prospects. In Korea, we initiated a position in Coway, a well-known manufacturer of water purifiers and other environmentally friendly household products with a strong domestic market share and a highly profitable business model. Treasury Wine Estates, an Australian-listed wine company, was another new position – although admittedly trading on a higher earnings multiple than the other new positions. We believe that the long term growth opportunity is significant and that the management team’s execution to date on margin expansion can be continued in the coming years. In addition to our sale of Universal Robina, where operating performance deteriorated, we also exited our positions in Tech Mahindra and Raffles Medical. Tech Mahindra suffered weaker results in line with the Indian IT Services sector and we feel more comfortable in larger peers, Infosys and Tata Consultancy Services as the industry transitions to more digital business. Raffles Medical is undertaking an exciting expansion in China that will impact its earnings in the short term, and therefore we view the current multiple as too expensive to maintain the position given this impact to its profits. Other positions which the fund exited included Astra International in Indonesia, SK Hynix in Korea, President Chain Store in Taiwan and Aurobindo Pharma in India.

Janus Henderson Global Select Funds -
2
Janus Henderson Asian Growth Fund (previously known as Henderson Global Select Funds - Henderson Pacific Dragon Fund) Manager's Report* (continued) For the six months from 1 July 2017 to 31 December 2017 The six months under review capped an extremely strong 2017 for Asian markets but, encouragingly, this was accompanied by significantly stronger earnings growth relative to the previous few years. Despite the stellar performance, valuations remain reasonable both relative to their own history for the region and relative to developed markets given the superior growth outlook for Asia. China remains the focal point for the region, and with President Xi Jinping consolidating his position post the National Congress, there will be renewed emphasis on the balance between reform and growth. The elevated debt levels will also continue to come under close scrutiny. While the old economy may continue to chug along, we continue to favour the new economy, private sector businesses in China. In the longer term, we believe there is every reason to be positive on Asia with attractive demographics, increasing consumption and innovation, as well as significant economic development potential providing an ideal backdrop for companies to thrive. *Information relates to the Janus Henderson Horizon Fund - Asian Growth Fund (Luxembourg Fund)

Janus Henderson Global Select Funds -
3
Janus Henderson Asian Growth Fund (previously known as Henderson Global Select Funds - Henderson Pacific Dragon Fund) Performance
3 6 1 3 5 10 Since
months months year years years years inception
(p.a.) (p.a.) (p.a.) (p.a.)
Janus Henderson Asian Growth Fund 5.5% 7.4% 27.2% 9.0% 9.4% 2.0% 5.8%
MSCI AC Asia ex Japan Index 6.2% 11.0% 27.8% 10.2% 9.5% 3.3% 8.3%
Performance chart since launch to 31 December 2017 (S$)
Source: Henderson Global Investors (Singapore) Limited / Morningstar, gross income
reinvested at NAV price, NAV to NAV, in Singapore dollars, performance based on average annual compounded return to 31 December 2017. There has been no dividend distribution since the Fund was launched in September 2000.
Note: Past performance of the Fund is not necessarily indicative of the future or likely
performance of the Fund.
Janus Henderson Global Select Funds -
4
Janus Henderson Pan European Equity Fund (previously known as Henderson Global Select Funds - Henderson European Fund) Manager's Report* For the six months from 1 July 2017 to 31 December 2017 Investment Fund Manager Tim Stevenson and James Ross The fund returned 1.2%, compared with the FTSE World Europe Index return of 3.7% in Euro Terms over the period. The second half of the year was positive for European equity markets, despite the drag of a strengthening euro, which appreciated by over 5% against the US dollar. Energy, materials and information technology were the strongest sectors, while consumer healthcare, telecommunications and utilities were the worst performing areas of the market.
The strongest contributors to performance were Deutsche Post, Amundi, Infineon Technologies and Amadeus IT. Deutsche Post benefited from a strong and improving volume environment across its key franchises and traded on a reasonable multiple. Amundi was structurally well positioned (best-in-class distribution and cost structure) performed well as investors priced in the significant advantages of the recent Pioneer deal. Infineon was geared into the increasingly fashionable area of electric vehicles. In addition, Amadeus benefited from its market-leading global distribution system, as well as a dominant position in airline (and increasingly airport and hotel) information technology.
The biggest detractors included Merlin Entertainments, BIC and Fresenius. Merlin suffered from short term demand weakness, especially in and around London and partly related to high levels of terrorist activity. The company remains well placed to deploy large amounts of capital at high returns over the coming years but the near term uncertainty caused us to exit our position. BIC suffered from tough trading conditions in all three divisions, most notably in shavers, where there is an ongoing price war in the US market led by the disruptive ‘shaving club model’. Again, we sold our holding. Fresenius underperformed due to a series of profit warnings by companies involved in the production and distribution of generic drugs in the US, to which Fresenius is involved via its Kabi business.
During the period, we initiated positions in Bayer, Novo Nordisk, UniCredit, Rolls Royce and BAWAG. We saw an opportunity to invest in Bayer after the recent profit warning, which was mainly driven by one-off, transient issues. We believe the long term future of the company looks attractive, especially when considering Monsanto's assets, and the opportunity that the merger will provide for a potential recovery in agricultural markets. We initiated a small position in Novo Nordisk as we feel that a little more clarity is starting to emerge on the pricing environment for its insulin products in the US. UniCredit is a low price-to-book bank that should be a prime beneficiary of the slowly improving economic environment in Italy, a consolidating national banking system and falling loan impairments. We see Rolls Royce as a long-cycle industrial holding with strong end markets and a material improvement in free cash flow coming through. Finally, BAWAG, a recent initial public offering, is an Austrian bank with a high return business as well as a credible merger and acquisition (M&A) strategy that should add value over the longer term.
We sold positions in Essilor, Publicis and Reckitt Benckiser. Essilor has been a longstanding position in the fund, offering great opportunity in attractive demographic themes, but is now seeing in its core US market. Publicis is suffering from increasing structural pressures and a recent meeting with the company did little to assuage our concerns. Finally, Reckitt Benckiser is suffering from structural growth headwinds in its consumer healthcare business. The recent acquisition of Mead Johnson also brought some near term pressures.
2017 was a tough year for the fund, even though it ended with a marginally positive fourth quarter. Our 2017 underperformance was accentuated by a small number of stock-specific issues in the opening months of the year. With these now behind us, we are confident of a better 2018. We remain of the view that European equities continue to offer significant attractions when compared to other asset classes.
*Information relates to the Janus Henderson Horizon Fund - Pan European Equity Fund (Luxembourg Fund)

Janus Henderson Global Select Funds -
5
Janus Henderson Pan European Equity Fund (previously known as Henderson Global Select Funds - Henderson European Fund) Performance
3 6 1 3 5 10 Since
months months year years years years inception
(p.a.) (p.a.) (p.a.) (p.a.)
Janus Henderson Pan European Equity Fund 0.8% 3.2% 12.7% 6.2% 9.6% -0.7% 0.9%
FTSE World Europe Index 0.8% 5.9% 17.3% 7.8% 10.0% 1.2% 3.3%
Performance chart since launch to 31 December 2017 (S$)
Source: Henderson Global Investors (Singapore) Limited / Morningstar, gross income
reinvested at NAV price, NAV to NAV, in Singapore dollars, performance based on average annual compounded return to 31 December 2017. There has been no dividend distribution since the Fund was launched in April 2000.
Note : Past performance of the Fund is not necessarily indicative of the future or likely
performance of the Fund.

Janus Henderson Global Select Funds -
6
Janus Henderson Global Property Equities Fund (previously known as Henderson Global Select Funds - Henderson Global Property Equities Fund) Manager's Report* For the six months from 1 July 2017 to 31 December 2017 Investment Fund Manager Guy Barnard and Tim Gibson The total return for the fund during the six month period was 5.6% in US Dollar terms. The FTSE EPRA NAREIT Developed Index rose 5.3%. Global equity markets made further gains over the period, with accelerating global gross domestic product and long-awaited progress on US tax reform trumping heightened geopolitical tensions surrounding North Korea and political uncertainty in Europe. Central bank policies diverged, with hikes from the US Federal Reserve and Bank of England, while in Europe and Japan quantitative easing (QE) policies (central bank liquidity measures) were reinforced. Long-dated government bond yields remained range bound, with yield curves flattening, reflecting ongoing low levels of inflation and medium-term growth concerns. In the property market, conditions remained robust, with transaction volumes globally showing a small increase on 2016. Transactional evidence shows strong demand from both domestic and global equity investors who are typically seeking long-term secure income. We saw a number of record breaking property transactions over the period, most notably in Hong Kong and London, reflecting investor demand for trophy assets. As a result, property yields saw further modest compression in many markets (prices move inversely to yields), although quality differentials in pricing are again widening. Additionally, an improving economic backdrop is translating into a pickup in rental growth in many cities and sectors, as vacancy levels are generally low; the caveat being markets where we’ve seen increased supply in recent years, such as coastal apartment markets in the US and self-storage. Retail landlords globally are also seeing a decline in rental growth as ecommerce pressures are leading many retailers to reduce their store count; this is particularly prevalent among ‘secondary’ malls in the US. Overall, listed real estate stocks made gains in the period, but lagged wider equity markets where earnings growth was stronger. However, we saw significant differentials by country and sector. European stocks proved the strongest, with healthy gains in Germany, France, Sweden and Spain. Stocks in Asia Pacific also made gains, driven by strong returns in Singapore and Hong Kong where fundamentals improved, most notably in the residential sector. US real estate investment trusts (REITs) made little progress, as positive performance from hotel and industrial stocks was offset by weakness in healthcare and apartment landlords given supply concerns. Retail REITs rallied strongly to end the period, following Mergers and Acquisitions (M&A) activity, most notably Brookfield’s bid for GGP, which reversed year-to-date declines. M&A in the retail space was not limited to the US, with Hammerson bidding for peer Intu in the UK and Continental European retail landlord Unibail-Rodamco taking over Westfield, which will see it enter the US and the UK. The fund marginally outperformed its index (net of fees). An overweight to industrial landlords globally added value, through positions in DCT, Goodman, Segro and VGP. Datacentre landlords NEXTDC and Interxion also performed strongly. An overweight to Europe was also beneficial, most notably through Aroundtown in Germany. In Asia, Sun Hung Kai and Kerry Properties in Hong Kong, and City Developments in Singapore, also added alpha. Conversely, our US retail position detracted following M&A activity, with an absence of GGP detrimental. Japanese developer Mitsui Fudosan also lagged. From a positioning perspective, while we continue to maintain a fairly neutral regional stance, we further reduced holdings in the US where growth expectations continue to moderate. Conversely, we increased our position in Continental Europe through logistics developer VGP and German commercial landlord Aroundtown. We also increased our holdings in the UK, adding retail landlord Hammerson following weakness, switching out of Unibail.

Janus Henderson Global Select Funds -
7
Janus Henderson Global Property Equities Fund (previously known as Henderson Global Select Funds - Henderson Global Property Equities Fund) Manager's Report* (continued) For the six months from 1 July 2017 to 31 December 2017 In the US, we continued to focus on areas of structural growth and those companies best placed to demonstrate ongoing cash flow growth, even in the mature phase of the cycle. Changes over the period included new positions in global cell tower owner American Tower Corporation and Canadian landlord Pure Industrial. We also added healthcare landlord Sabra. Conversely, we further reduced our retail position, selling GGP (unfortunate timing with hindsight) and Urban Edge. We also switched from Empire State REIT to Brandywine in the office space, and Avalonbay to UDR in the apartment space. In Asia Pacific, we consolidated our holdings in the Japanese developers, selling Mitsubishi Estate and adding to Mitsui Fudosan. We also added public REIT Daiwa Office, given its access to the attractive Shibuya area in Tokyo. Finally, we reduced our Australian retail position, given weak leasing spreads and likely structural pressures from Amazon entering the market, selling Scentre Group and adding to diversified landlord Mirvac. Looking ahead, we still expect investor demand for physical real estate, a real asset with an attractive and growing income stream, to remain robust. While we are likely to see further rises in interest rates and bond yields as QE is tapered (reduced) and eventually reversed, the current spread between property and long-dated bond yields remains wider than historical averages, providing a buffer. An improving economic backdrop will also benefit landlords, through the ability to increase rents, particularly in those markets where new construction was limited. Additionally, while we are getting later in the property cycle in some parts of the world, there remain countries, cities and sectors where trends look set for further improvement which we can target. We will continue to play to our strengths, reducing macroeconomic risks and focusing on bottom up stock selection to drive returns through a concentrated, high conviction portfolio. We have increasingly targeted those markets, sectors and companies that we believe are capable of growing income and dividends, even in a lower growth environment. Also, as market-wide growth slows, we place greater emphasis on quality assets and management teams; in our experience the value of these factors always comes to the fore. *Information relates to the Janus Henderson Horizon Fund - Global Property Equities Fund (Luxembourg Fund)
Janus Henderson Global Select Funds -
8
Janus Henderson Global Property Equities Fund (previously known as Henderson Global Select Funds - Henderson Global Property Equities Fund) Performance
3 6 1 3 5 10 Since
months months year years years years inception
(p.a.) (p.a.) (p.a.) (p.a.)
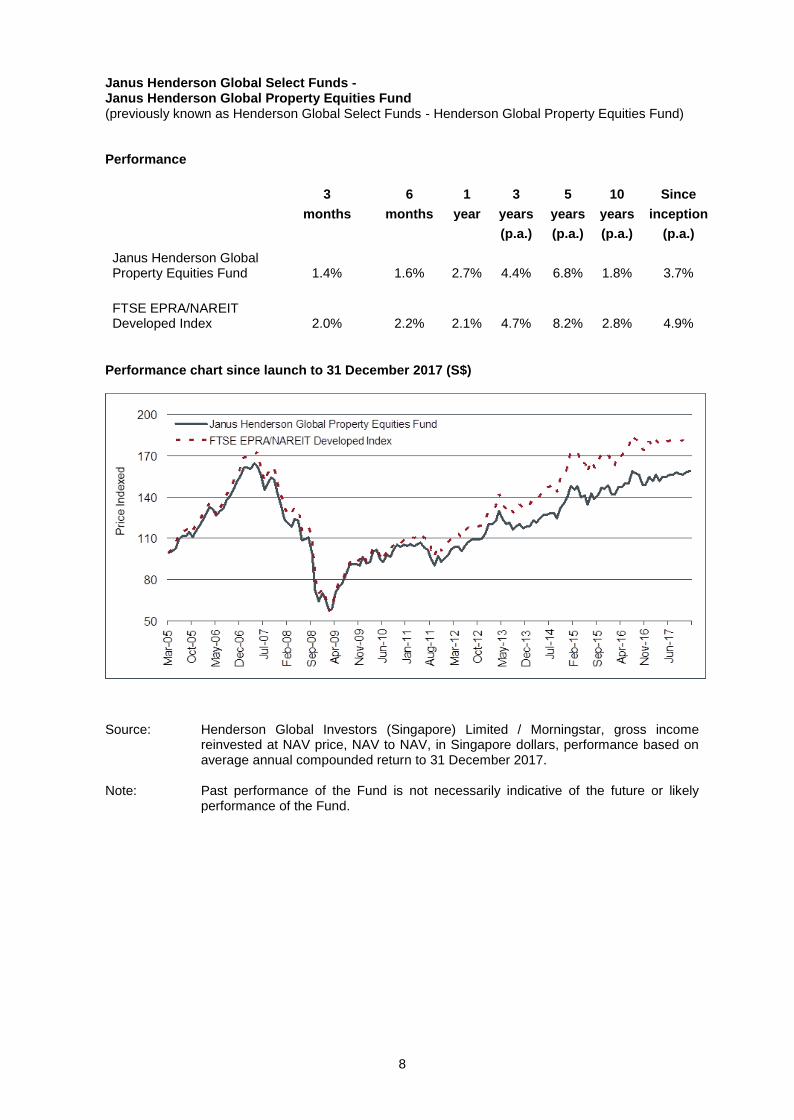
Janus Henderson Global Property Equities Fund 1.4% 1.6% 2.7% 4.4% 6.8% 1.8% 3.7%
FTSE EPRA/NAREIT
Developed Index 2.0% 2.2% 2.1% 4.7% 8.2% 2.8% 4.9%
Performance chart since launch to 31 December 2017 (S$)
Source: Henderson Global Investors (Singapore) Limited / Morningstar, gross income
reinvested at NAV price, NAV to NAV, in Singapore dollars, performance based on average annual compounded return to 31 December 2017.
Note: Past performance of the Fund is not necessarily indicative of the future or likely
performance of the Fund.

Janus Henderson Global Select Funds -
9
Janus Henderson Asia-Pacific Property Equities Fund (previously known as Henderson Global Select Funds - Asia-Pacific Property Equities Fund) Manager's Report* For the six months from 1 July 2017 to 31 December 2017 Investment Fund Manager Tim Gibson The fund returned 7.9% in US Dollar Terms over the period outperforming the FTSE EPRA NAREIT Pure Asia Index which returned 7.0%. Asian property equities had another strong half, ending the period up +15.9%. Hong Kong (+16.7%) was the star performer as volumes and prices in the residential market continued to achieve new record highs and commercial assets remained supported by tighter cap rates. Companies were more proactive in enhancing shareholder value over the period, which saw many developers raising dividends and the demerger of Wharf Holdings. Singapore (+14.3%) also had a stellar half as residential property prices finally rose quarter on quarter in the third quarter of the year – the first quarterly increase after fifteen consecutive quarters of decline. Aggressive land bids by developers and a hot en-bloc market were supportive of real estate values. Strengthening rental growth and transactions in the commercial sector also boosted the office market. Australian real estate investment trusts (REITs) (+11.8%) posted positive performance as 10-year bond yields tightened (prices move inversely to yields) and an unexpected bid from Unibail-Rodamco for Westfield (outside of the custom index) in December provided some relief for retail landlords, which was weighed down by negative sentiments for most of the period. Although the macroeconomic outlook in Japan remains muted, Japanese developers (+2.9%) climbed as companies reported healthy results over the period, with generally positive earnings guidance. On the other hand, public REITs (+0.1%) had a difficult year, mainly due to continuing fund outflows from Japanese investment trusts. Our position in NEXTDC was the standout performer as the data centre industry continued to benefit from strong demand. Other key contributors included our overweight positions in Singapore developer City Developments, which was supported by the strong residential market; Japanese developer Hulic, which raised its guidance on the back of better than expected sales activities; and Link REIT, which completed the sale of a portfolio of assets in Hong Kong at robust prices. However, our overweight in Aveo Group detracted over the period. At the start of the period, we initiated a position in Australian data centre operator NEXTDC, one of the leading players in a sector which we expect will benefit from strong demand for the coming years. We reduced our position in Scentre Group because of structural and cyclical concerns over Australian retail. In Hong Kong, we exited our position in Hongkong Land on lower expected returns, and rotated into Wharf Holdings on the back of strengthening retail sales numbers in Hong Kong and China. In Japan, we rotated from Nippon Building Fund to MCUBS Midcity, reducing our exposure to Tokyo office which is getting later in the cycle and preferring to increase our exposure to Osaka which offers better rental growth potential. In November, we added a new position in diversified Japanese REIT Star Asia Investment as we like its growth story, with potential access to a new asset class (student accommodation) as well as attractive valuations. This was funded with profits from outperformers including NETDC and CapitaLand Commercial Trust, as well as by trimming our existing stakes in other public REITs.
Janus Henderson Global Select Funds -
10
Janus Henderson Asia-Pacific Property Equities Fund (previously known as Henderson Global Select Funds - Asia-Pacific Property Equities Fund) Manager's Report* (continued) For the six months from 1 July 2017 to 31 December 2017 We believe global growth will continue to pick up this year, which is positive for company earnings. Overall financial conditions remain supportive of the recovery, as tightening by the US Federal Reserve remains in its early stages and monetary policy elsewhere in the world is still relatively easy, and rates remain low. Although we believe we will likely see further rises in interest rates and bond yields, we expect the pace of such increases to be gradual. Looking ahead, we still expect investor demand for physical real estate, a real asset with an attractive and growing income stream, to remain robust. Strengthening macroeconomic growth will continue to drive markets and is beneficial for real estate. Physical fundamentals across Asia Pacific remain robust, driven by end-user demand and healthy household balance sheets. However, in certain markets, we are getting later in the property cycle and therefore expect more modest income-led returns from here. We maintain our preference to limit top-down investing and focus on bottom-up stock selection to generate returns, identifying and investing in companies with top quality management teams, solid capital structures, and the ability to generate income and dividend growth even against a backdrop of lower growth. *Information relates to the Janus Henderson Horizon Fund - Asia-Pacific Property Equities Fund (Luxembourg Fund)

Janus Henderson Global Select Funds -
11
Janus Henderson Asia-Pacific Property Equities Fund (previously known as Henderson Global Select Funds - Asia-Pacific Property Equities Fund) Performance
3 6 1 3 5 10 Since
months months year years years years inception
(p.a.) (p.a.) (p.a.) (p.a.)
Janus Henderson Asia-Pacific Property Equities Fund 4.8% 4.4% 6.2% 3.5% 3.8% 0.0% 0.9%
FTSE EPRA/NAREIT Pure
Asia total return net dividend Index (Capital constrained) 3.3% 3.9% 7.1% 4.8% 5.8% 0.7% 2.7%
Performance chart since launch to 31 December 2017 (S$)
Source: Henderson Global Investors (Singapore) Limited / Morningstar, gross income
reinvested at NAV price, NAV to NAV, in Singapore dollars, performance based on average annual compounded return to 31 December 2017.
Note: Past performance of the Fund is not necessarily indicative of the future or likely
performance of the Fund.

Janus Henderson Global Select Funds -
12
Janus Henderson Pan European Property Equities Fund (previously known as Henderson Global Select Funds - Henderson European Property Securities Fund) Manager's Report* For the six months from 1 July 2017 to 31 December 2017 Investment Fund Manager Guy Barnard The total return for the six month period was 12.1% in Euro terms. The FTSE EPRA/NAREIT Europe Capped Index gained 7.2% in Euro terms over the period. European economic indicators strengthened throughout the period, with euro area gross domestic product growth running at its fastest pace for six years, consumer confidence reaching a 16-year high and unemployment falling below 9%, an eight-year low. However, political uncertainty remained prominent in Europe, with an unexpected German election result, Catalan separatists calling for independence in Spain and the UK burdened by its exit from the European Union (known as ‘Brexit’). In terms of monetary policy, the European Central Bank announced a continuation of its quantitative easing programme (central bank liquidity measures) at a reduced pace, to at least September 2018. Conversely, the Bank of England announced the first interest rate rise in a decade, given inflation pressures. Property equities made gains over the period and outperformed wider equity markets. Physical property markets continued to highlight further growth in most markets, with transactional evidence showing strong demand from both domestic and global equity investors. As a result, property yields saw further modest compression in many markets (prices move inversely to yields). Additionally, an improving economic backdrop is translating into rental growth in many cities and sectors, most notably in Germany, Spain and Sweden. There were clear winners at a sector level too, with logistics landlords generating strong returns as rental growth accelerated given increased tenant demand as a result of ecommerce. However, retail landlords lagged, as moderating consumer spending, combined with the rising trend to online sales, led investors to avoid the sector. A flurry of mergers and aquisitions deals late in the period saw companies looking to drive future growth from operating synergies as well as taking advantage of discounted valuations. The fund significantly outperformed its index over the period, driven by stock selection. Notable value was added in the UK, where our preference for areas of structural growth, such as Segro and Hansteen in the industrial/logistics space, Unite in student accommodation and self-storage company Safestore all made gains. Our overweight in Germany also proved fruitful, with commercial landlord Aroundtown generating significant returns as it continues to demonstrate impressive cash flow growth, boosted by an opportunistic approach to acquisitions. In France, our overweight in office landlords Gecina and Icade was beneficial, as well as our underweight in retail names. Swedish stock Hemfosa also rallied strongly on news it would split its business into two parts in an effort to maximise value. Finally, an absence of any Swiss stocks added value given the currency weakness.
From a top down perspective, we made no significant changes and continued to adopt a fairly
neutral stance at a country level, focusing on bottom up stock selection to drive alpha. We remain
overweight German commercial, UK alternatives and Spain, and underweight retail, London office
and Switzerland. At a stock level, new positions included Gecina in the French office space, given
improving fundamentals and share price weakness during a rights issue. We also added VGP, a
Belgian listed developer and owner of big box logistics parks in several European countries. We rate
the management team highly given their record of securing land and development margins have
been outstanding.

Janus Henderson Global Select Funds -
13
Janus Henderson Pan European Property Equities Fund (previously known as Henderson Global Select Funds - Henderson European Property Securities Fund) Manager's Report* (continued) For the six months from 1 July 2017 to 31 December 2017
In the UK, we added Hammerson toward the end of the period. While challenges remain in physical
retail, we felt more than compensated for the uncertainty. We also added a holding in the healthcare
sector through GP surgery owner Assura, which offers a highly secure and growing long-term
income stream. We sold out of several positions that performed well and we felt a further re-rating
(stock reassessment by the market) was unlikely; Hansteen and St Modwen in the UK and Aedfica
and Nexity on the continent. In Sweden, we re-introduced a position in Balder, which offers a strong
cash flow growth story from a high quality portfolio, including a high proportion of defensive rental
residential apartments. This was partly funded through profit taking in peers Hemfosa and Wihlborgs.
Finally, we added to Austrian-listed residential owner/developer BUWOG on valuation, which proved
well-timed ahead of a takeover approach from German peer Vonovia late in the period.
Looking ahead, we enter 2018 with strong economic momentum in most parts of Europe and a supportive monetary backdrop. This, coupled with real estate’s offer of an attractive income yield with predictable growth characteristics, should deliver attractive returns, even as bond yields begin to rise. While we may see greater volatility (sharper fluctuations in prices) in equity markets in 2018 compared to 2017 as stimulus is gradually unwound, we expect the long-term structural trends which are driving investors to seek secure income to continue to lead to healthy demand for real estate assets. We continue to believe that the stocks held in our concentrated fund offer attractive prospects, either from a growth, value or income standpoint. With listed real estate stocks continuing to trade at a discount to net asset value, it remains less expensive for investors to buy property through shares than physical real estate. While growth is moderating, we still forecast further asset value growth this year, albeit with wide divergence by country and sector. More importantly, the income streams of the property sector remain incredibly robust, with the sector’s current dividend yield of almost 4% forecast to grow by c.7% per annum for the next two years. *Information relates to the Janus Henderson Horizon Fund - Pan European Property Equities Fund (Luxembourg Fund)

Janus Henderson Global Select Funds -
14
Janus Henderson Pan European Property Equities Fund (previously known as Henderson Global Select Funds - Henderson European Property Securities Fund) Performance
3 6 1 3 5 10 Since
months months year years years years inception
(p.a.) (p.a.) (p.a.) (p.a.)
Janus Henderson Pan European Property Equities Fund 6.5% 14.0% 25.3% 9.8% 14.3% 1.6% 6.6%
FTSE EPRA/NAREIT Developed Europe Capped NR Index 5.9% 9.5% 18.5% 8.0% 11.7% 2.5% 8.3%
Performance chart since launch to 31 December 2017 (S$)
Source: Henderson Global Investors (Singapore) Limited / Morningstar, gross income
reinvested at NAV price, NAV to NAV, in Singapore dollars, performance based on average annual compounded return to 31 December 2017. There has been no dividend distribution since the Fund was launched in June 1999.
Note : Past performance of the Fund is not necessarily indicative of the future or likely
performance of the Fund.
Janus Henderson Global Select Funds -
15
Janus Henderson Global Property Income Fund (previously known as Henderson Global Select Funds - Henderson Global Property Income Fund) Manager's Report For the six months from 1 July 2017 to 31 December 2017 Investment Fund Manager Tim Gibson and Guy Barnard Overview Global equity markets made further gains over the period, with accelerating global GDP and long awaited progress on US tax reform trumping heightened geopolitical tensions surrounding North Korea and political uncertainty in Europe. Central bank policy also saw divergence, with hikes from the FED and Bank of England, while in Europe and Japan QE policies were reinforced. Long dated government bond yields have remained range bound, with yield curves flattening, reflecting ongoing low levels of inflation and medium term growth concerns. In the property market, conditions have remained robust with transaction volumes globally showing a small increase on 2016. Transactional evidence shows strong demand from both domestic and global equity investors who are typically seeking long-term secure income. We saw a number of record breaking property transactions over the period, most notably in Hong Kong and London, reflecting investor demand for trophy assets. As a result property yields have seen further modest compression in many markets, although quality differentials in pricing are again widening. Additionally, an improving economic backdrop is translating into a pickup in rental growth in many cities and sectors, as vacancy levels are generally low. The caveat being markets where we’ve seen increased supply in recent years, such as coastal apartment markets in the US and self-storage. Retail landlords globally are also seeing a decline in rental growth as ecommerce pressures are leading many retailers to reduce their store count; this is particularly prevalent among ‘secondary’ malls in the US. Overall, listed real estate stocks made gains in the period, but lagged wider equity markets where earnings growth has been stronger. However we saw significant differentials by country and sector. Stocks in Asia Pacific were outperformers, driven by strong returns in Singapore and Hong Kong where fundamentals continued to improve. European stocks also turned in positive performance led by healthy gains in Germany, Italy and Ireland. US REITs made little progress, as positive performance from hotel and industrial stocks was offset by weakness in healthcare and apartment landlords given supply concerns. Retail REITs rallied strongly to end the year following M&A activity, most notably Brookfield’s bid for GGP, which reversed year-to-date declines. Mergers and Acquisitions (M&A) in the retail space was not limited to the US, with Hammerson bidding for peer Intu in the UK and Continental European retail landlord Unibail-Rodamco taking over Westfield, which will see it enter the US and the UK. Overall, the customised FTSE EPRA/NAREIT Net Total Return Index (25% Singapore REITs + 75% Global ex-Singapore REITs in S$) rose 3.7% over the period. Performance The fund outperformed its index by over the period and stock selection was the key contributor to outperformance. Performance in Europe was strong, particularly in the UK, Germany and France, where our holdings in German commercial landlord Aroundtown, French commercial owner Gecina and UK industrial landlord SEGRO led to strong gains. Asia also turned in positive performance with notable contribution from Japan and Australia, particularly Osaka centric landlord Keihanshin Building and Perth focused landlord GDI Property. Meanwhile, our holdings in North America detracted given a drag from retail landlord CBL & Associates who cut its dividend post a poor set of results as well as healthcare REITs LTC Properties and Physicians Realty Trust which underperformed alongside the healthcare sector in general.

Janus Henderson Global Select Funds -
16
Janus Henderson Global Property Income Fund (previously known as Henderson Global Select Funds - Henderson Global Property Income Fund) Manager's Report (continued) For the six months from 1 July 2017 to 31 December 2017 Activity The fund is investing in-line with our stated strategy. We are seeing good opportunities to invest in REITs backed by high quality real estate assets, with sound balance sheets, at valuations we believe offer good medium-term growth potential and attractive income yields today. We added several new positions during the period. In Australia, we added GDI Property for its exposure to the Perth office market and Frasers Logistics Trust which we funded through taking profit from existing holdings in Singapore REITs. We also added a Japanese landlord Keihanshin Building which we like for its exposure to the Kansai region where demand and supply dynamics remain favourable as well as its ownership of data centres and took down our position in Invincible Investment. In addition, we bought into diversified Japanese REIT Star Asia Investment given its attractive yield and upside potential from internal growth. In the US, we added Brandywine, a Philadelphia based office REIT, which we expect will see stronger earnings growth after repositioning its portfolio to higher quality assets and funded this with the sale of STORE Capital based on less attractive relative value following the Warren Buffett induced run-up in the shares. Towards the end of the period, we also added Sabra Healthcare as valuations look attractive post its significant underperformance and funded this by trimming our existing holdings in Physicians Realty and MGM Growth Properties. Through equity deals in the Americas, we added new holdings in Canadian REIT Pure Industrial and Mexican Fibra Hotel. We also added Belgian listed logistics developer VGP through a secondary offering as we like its large development exposure which we expect will benefit from accelerating demand. We funded this by taking profit from Hansteen post its outperformance and dilution from its return of capital. Given relative share price performance, we made several switches within our Continental Europe holdings. We switch between our Spanish holdings from Inmobiliaria Colonial to Merlin Properties and our French office landlord position from Icade to peer Gecina. We also took profit from Fonciere des Regions and added a new position in retail landlord Eurocommercial. Towards the end of the period post the payment of its annual dividend, we exited Eurocommercial and added a new position in Hammerson given relative value particularly for its diversified and quality portfolio.

Janus Henderson Global Select Funds -
17
Janus Henderson Global Property Income Fund (previously known as Henderson Global Select Funds - Henderson Global Property Income Fund) Performance
3 6 1 3 Since
months months year years inception
(p.a.) (p.a.)
Janus Henderson Global Property Income Fund 2.1% 3.7% 8.6% 6.1% 6.1%
FTSE EPRA/NAREIT net
total return 3.3% 3.6% 5.3% 5.6% 7.4%
Performance chart since launch to 31 December 2017 (S$)
Source: Henderson Global Investors (Singapore) Limited / Morningstar, gross income
reinvested at NAV price, NAV to NAV, in Singapore dollars, performance based on average annual compounded return to 31 December 2017.
Note: Past performance of the Fund is not necessarily indicative of the future or likely
performance of the Fund.

Janus Henderson Global Select Funds (previously known as Henderson Global Select Funds) STATEMENTS OF TOTAL RETURN For the half year ended 31 December 2017 (unaudited)
18
Janus Henderson
Asian Growth Fund Janus Henderson Pan European Equity Fund
31 December
2017
31 December
2016
31 December
2017
31 December
2016 $ $ $ $ Income Interest on deposit with banks 2 - 2 -
2 - 2 - Less: Expenses Audit fee 5,343 3,643 8,814 7,381 Management fee 3,402 3,827 15,398 21,013 Registrar fee 3,427 4,996 6,527 9,115 Trustee fee 1,285 3,502 5,808 8,082 Valuation fee 2,278 2,393 5,808 8,082 Transaction cost - 510 - 1,590 Other expenses 7,917 5,307 13,527 12,661
23,652 24,178 55,882 67,924
Net expenses (23,650) (24,178) (55,880) (67,924)
Net gains or losses on value of
investments Net gains on investments 407,826 443,983 776,845 3,101,550 Net foreign exchange losses (658) (532) (34) (4,863)
407,168 443,451 776,811 3,096,687
Total return for the period before
income tax 383,518 419,273 720,931 3,028,763 Less: Income tax - - - -
Total return for the period after income tax 383,518 419,273 720,931 3,028,763

Janus Henderson Global Select Funds (previously known as Henderson Global Select Funds) STATEMENTS OF TOTAL RETURN (continued) For the half year ended 31 December 2017 (unaudited)
19
Janus Henderson Global Property Equities Fund
Janus Henderson Asia-Pacific Property
Equities Fund
31 December
2017
31 December
2016
31 December
2017
31 December
2016 $ $ $ $ Income Dividends 141,958 155,892 344,143 281,730 Interest on deposit with banks 10 - 20 -
141,968 155,892 344,163 281,730 Less: Expenses Audit fee 6,333 4,935 9,476 7,717 Management fee 7,222 8,263 19,842 23,446 Registrar fee 8,297 7,783 11,936 12,568 Trustee fee 2,729 3,729 7,497 9,018 Valuation fee 2,729 3,178 7,497 9,018 Transaction cost - 840 - 750 Other expenses 10,676 8,834 13,763 10,942
37,986 37,562 70,011 73,459
Net income 103,982 118,330 274,152 208,271
Net gains or losses on value of
investments Net gains on investments 131,400 186,122 1,016,015 609,677 Net foreign exchange (losses)/gains (2,163) 3,516 (5,724) (476)
129,237 189,638 1,010,291 609,201
Total return for the period before
income tax 233,219 307,968 1,284,443 817,472 Less: Income tax - - - -
Total return for the period after income tax
233,219
307,968
1,284,443
817,472

Janus Henderson Global Select Funds (previously known as Henderson Global Select Funds) STATEMENTS OF TOTAL RETURN (continued) For the half year ended 31 December 2017 (unaudited)
20
Janus Henderson Pan European Property
Equities Fund Janus Henderson Global
Property Income Fund
31 December
2017
31 December
2016
31 December
2017
31 December
2016 $ $ $ $ Income Dividends - - 238,623 258,963 Interest on deposit with banks 2 - 8 3
2 - 238,631 258,966 Less: Expenses Audit fee 8,374 6,631 9,896 7,990 Custody fee - - 985 1,563 Management fee 14,132 14,738 75,438 73,878 Registrar fee 6,459 8,350 3,899 7,411 Trustee fee 5,349 5,668 2,476 3,790 Valuation fee 5,349 5,668 2,476 2,463 Transaction cost - 870 9,057 16,903 Other expenses 12,409 10,200 16,150 12,534
52,072 52,125 120,377 126,532
Net (expenses)/income (52,070) (52,125) 118,254 132,434
Net gains or losses on value of
investments Net gains/(losses) on investments 2,891,143 562,326 286,791 (168,250) Net foreign exchange gains/(losses) 4 (2,089) 417 (71)
2,891,147 560,237 287,208 (168,321)
Total return/(deficit) for the period
before income tax 2,839,077 508,112 405,462 (35,887) Less: Income tax - - (45,047) (68,455)
Total return/(deficit) for the period after income tax
2,839,077
508,112
360,415
(104,342)

Janus Henderson Global Select Funds (previously known as Henderson Global Select Funds) STATEMENTS OF FINANCIAL POSITION (continued) As at 31 December 2017 (unaudited)
21
Janus Henderson
Asian Growth Fund Janus Henderson Pan European Equity Fund
31 December
2017 30 June
2017 31 December
2017 30 June
2017 $ $ $ $ ASSETS Portfolio of investments 4,803,522 5,771,290 21,310,282 25,336,844 Sales awaiting settlement - - 243,048 - Receivables 2,000 27,004 8,299 68,461 Cash and bank balances 94,978 50,782 313,272 259,660
Total assets 4,900,500 5,849,076 21,874,901 25,664,965
LIABILITIES Payables 46,686 13,113 223,118 187,091
Total liabilities 46,686 13,113 223,118 187,091
EQUITY Net assets attributable to unitholders 4,853,814 5,835,963 21,651,783 25,477,874
Janus Henderson Global Property Equities Fund
Janus Henderson Asia-Pacific Property
Equities Fund
31 December
2017 30 June
2017 31 December
2017 30 June
2017 $ $ $ $ ASSETS Portfolio of investments 10,458,464 11,421,943 29,776,177 30,832,950 Receivables - - 30,340 9,032 Cash and bank balances 182,105 103,470 337,296 356,898
Total assets 10,640,569 11,525,413 30,143,813 31,198,880
LIABILITIES Payables 24,877 35,673 32,217 102,753
Total liabilities 24,877 35,673 32,217 102,753
EQUITY Net assets attributable to unitholders 10,615,692 11,489,740 30,111,596 31,096,127

Janus Henderson Global Select Funds (previously known as Henderson Global Select Funds) STATEMENTS OF FINANCIAL POSITION (continued) As at 31 December 2017 (unaudited)
22
Janus Henderson Pan European Property
Equities Fund Janus Henderson Global
Property Income Fund
31 December
2017 30 June
2017 31 December
2017 30 June
2017 $ $ $ $ ASSETS Portfolio of investments 22,109,461 21,007,874 10,039,154 9,610,288 Sales awaiting settlement - 382,380 395 - Receivables 34,000 1,507 89,742 67,954 Cash and bank balances 365,131 156,474 196,459 387,332
Total assets 22,508,592 21,548,235 10,325,750 10,065,574
LIABILITIES Payables 27,898 414,711 29,785 65,970 Purchases awaiting settlement - - - 217,900 Distribution payable - - 99,095 158,353
Total liabilities 27,898 414,711 128,880 442,223
EQUITY Net assets attributable to unitholders 22,480,694 21,133,524 10,196,870 9,623,351

Janus Henderson Global Select Funds (previously known as Henderson Global Select Funds) STATEMENTS OF MOVEMENTS OF UNITHOLDERS' FUNDS For the half year ended 31 December 2017 (unaudited)
23
Janus Henderson
Asian Growth Fund Janus Henderson Pan European Equity Fund
31 December 2017
30 June 2017
31 December 2017
30 June 2017
$ $ $ $ Net assets attributable to unitholders
at the beginning of the financial period/year 5,835,963 5,624,251 25,477,874 37,320,175
Operations Change in net assets attributable to
unitholders resulting from operations
383,518
1,380,094
720,931
5,528,718 Unitholders' contributions/
(withdrawals)
Creation of units 68,038 144,156 445,048 2,799,147 Cancellation of units (1,433,705) (1,312,538) (4,992,070) (20,170,166)
Change in net assets attributable to
unitholders resulting from net creation and cancellation of units
(1,365,667)
(1,168,382)
(4,547,022)
(17,371,019) Total (decrease)/increase in net assets
attributable to unitholders
(982,149)
211,712
(3,826,091)
(11,842,301)
Net assets attributable to unitholders at the end of the financial period/year
4,853,814
5,835,963
21,651,783
25,477,874

Janus Henderson Global Select Funds (previously known as Henderson Global Select Funds) STATEMENTS OF MOVEMENTS OF UNITHOLDERS' FUNDS (continued) For the half year ended 31 December 2017 (unaudited)
24
Janus Henderson Global Property Equities Fund
Janus Henderson Asia-Pacific Property
Equities Fund
31 December 2017
30 June 2017
31 December 2017
30 June 2017
$ $ $ $ Net assets attributable to unitholders
at the beginning of the financial period/year 11,489,740 15,517,327 31,096,127 36,495,961
Operations Change in net assets attributable to
unitholders resulting from operations
233,219
483,004
1,284,443
1,470,487 Unitholders' contributions/
(withdrawals)
Creation of units 244,211 1,371,664 727,901 616,176 Cancellation of units (1,210,459) (5,726,427) (2,656,928) (7,204,903)
Change in net assets attributable to
unitholders resulting from net creation and cancellation of units
(966,248)
(4,354,763)
(1,929,027)
(6,588,727) Distributions (141,019) (155,828) (339,947) (281,594) Total decrease in net assets attributable
to unitholders
(874,048)
(4,027,587)
(984,531)
(5,399,834)
Net assets attributable to unitholders at the end of the financial period/year
10,615,692
11,489,740
30,111,596
31,096,127
Janus Henderson Global Select Funds (previously known as Henderson Global Select Funds) STATEMENTS OF MOVEMENTS OF UNITHOLDERS' FUNDS (continued) For the half year ended 31 December 2017 (unaudited)
25
Janus Henderson Pan European Property
Equities Fund Janus Henderson Global
Property Income Fund
31 December 2017
30 June 2017
31 December 2017
30 June 2017
$ $ $ $ Net assets attributable to unitholders
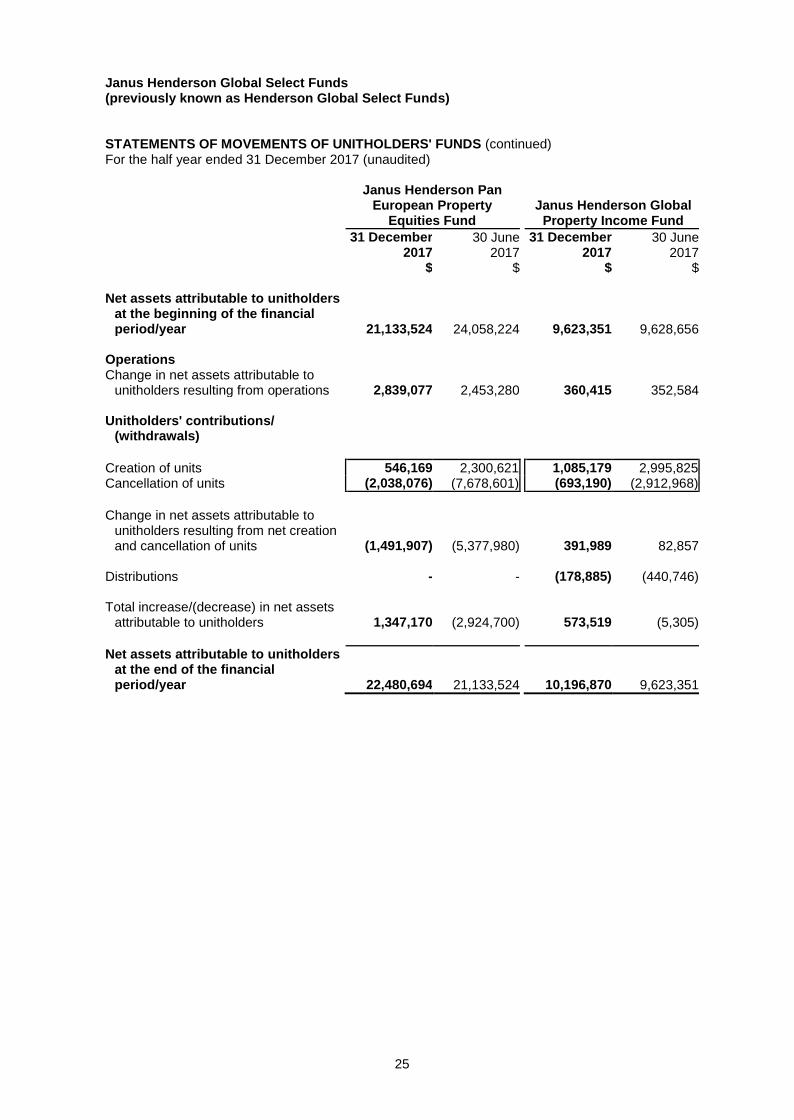
at the beginning of the financial period/year 21,133,524 24,058,224 9,623,351 9,628,656
Operations Change in net assets attributable to
unitholders resulting from operations
2,839,077
2,453,280
360,415
352,584 Unitholders' contributions/
(withdrawals)
Creation of units 546,169 2,300,621 1,085,179 2,995,825 Cancellation of units (2,038,076) (7,678,601) (693,190) (2,912,968)
Change in net assets attributable to
unitholders resulting from net creation and cancellation of units
(1,491,907)
(5,377,980)
391,989
82,857 Distributions - - (178,885) (440,746) Total increase/(decrease) in net assets
attributable to unitholders
1,347,170
(2,924,700)
573,519
(5,305)
Net assets attributable to unitholders at the end of the financial period/year
22,480,694
21,133,524
10,196,870
9,623,351

Janus Henderson Global Select Funds (previously known as Henderson Global Select Funds)
STATEMENTS OF PORTFOLIO As at 31 December 2017 (unaudited)
26
Janus Henderson Asian Growth Fund
Holdings at 31 December
2017
Fair value at 31 December
2017
Percentage of total net assets
attributable to unitholders at 31 December
2017
Percentage of total net assets
attributable to unitholders at 30 June 2017
$ % % Unit trust Janus Henderson Horizon Fund -
Asian Growth Fund
29,090
4,803,522
98.96
98.89
Portfolio of investments 4,803,522 98.96 98.89 Other net assets 50,292 1.04 1.11
Net assets attributable to unitholders
4,853,814
100.00
100.00
As the Fund invests wholly into the Janus Henderson Horizon Fund - Asian Growth Fund which is registered in Luxembourg, it is not meaningful to classify the investments into industry or geographical segments. Janus Henderson Pan European Equity Fund
Holdings at 31 December
2017
Fair value at 31 December
2017
Percentage of total net assets
attributable to unitholders at 31 December
2017
Percentage of total net assets
attributable to unitholders at 30 June 2017
$ % % Unit trust Janus Henderson Horizon Fund -
Pan European Equity Fund
459,022
21,310,282
98.42
99.45
Portfolio of investments 21,310,282 98.42 99.45 Other net assets 341,501 1.58 0.55
Net assets attributable to unitholders
21,651,783
100.00
100.00
As the Fund invests wholly into the Janus Henderson Horizon Fund - Pan European Equity Fund which is registered in Luxembourg, it is not meaningful to classify the investments into industry or geographical segments.

Janus Henderson Global Select Funds (previously known as Henderson Global Select Funds)
STATEMENTS OF PORTFOLIO (continued) As at 31 December 2017 (unaudited)
27
Janus Henderson Global Property Equities Fund
Holdings at 31 December
2017
Fair value at 31 December
2017 $
Percentage of total net assets
attributable to unitholders at 31 December
2017 %
Percentage of total net assets
attributable to unitholders at 30 June 2017
% Unit trust Janus Henderson Horizon Fund -
Global Property Equities Fund
445,156
10,458,464
98.52
99.41
Portfolio of investments 10,458,464 98.52 99.41 Other net assets 157,228 1.48 0.59
Net assets attributable to unitholders
10,615,692
100.00
100.00
As the Fund invests wholly into the Janus Henderson Horizon Fund - Global Property Equities Fund which is registered in Luxembourg, it is not meaningful to classify the investments into industry or geographical segments. Janus Henderson Asia-Pacific Property Equities Fund
Holdings at 31 December
2017
Fair value at 31 December
2017 $
Percentage of total net assets
attributable to unitholders at 31 December
2017 %
Percentage of total net assets
attributable to unitholders at 30 June 2017
% Unit trust Janus Henderson Horizon Fund -
Asia Pacific Property Equities Fund
1,463,920
29,776,177
98.89
99.15
Portfolio of investments 29,776,177 98.89 99.15 Other net assets 335,419 1.11 0.85
Net assets attributable to unitholders
30,111,596
100.00
100.00
As the Fund invests wholly into the Janus Henderson Horizon Fund - Asia-Pacific Property Equities Fund which is registered in Luxembourg, it is not meaningful to classify the investments into industry or geographical segments.

Janus Henderson Global Select Funds (previously known as Henderson Global Select Funds)
STATEMENTS OF PORTFOLIO (continued) As at 31 December 2017 (unaudited)
28
Janus Henderson Pan European Property Equities Fund
Holdings at 31 December
2017
Fair value at 31 December
2017 $
Percentage of total net assets
attributable to unitholders at 31 December
2017 %
Percentage of total net assets
attributable to unitholders at 30 June 2017
% Unit trust Janus Henderson Horizon Fund -
Pan European Property Equities Fund
301,214
22,109,461
98.35
99.41
Portfolio of investments 22,109,461 98.35 99.41 Other net assets 371,233 1.65 0.59
Net assets attributable to unitholders
22,480,694
100.00
100.00
As the Fund invests wholly into the Janus Henderson Horizon Fund - Pan European Property Equities Fund which is registered in Luxembourg, it is not meaningful to classify the investments into industry or geographical segments.

Janus Henderson Global Select Funds (previously known as Henderson Global Select Funds)
STATEMENTS OF PORTFOLIO (continued) As at 31 December 2017 (unaudited)
29
Primary Janus Henderson Global Property Income
Fund
Holdings at 31 December
2017
Fair value at 31 December
2017
Percentage of total net assets
attributable to unitholders at 31 December
2017 By Geography $ % Quoted Equities
GERMANY Aroundtown Property Holdings Public Listed
Company 19,000 194,589 1.91 Deutsche Wohnen 2,100 122,499 1.20
317,088 3.11
SINGAPORE City Developments Limited 21,900 273,531 2.68
JAPAN Keihanshin Building Company Limited 20,500 215,716 2.12
UNITED STATES OF AMERICA Brookfield Property Partners LP 6375 188,367 1.85
BELGIUM VGP NV 1,293 128,750 1.26
SWEDEN Hemfosa Fastigheter 4,500 80,503 0.79
Total Quoted Equities 1,203,955 11.81

Janus Henderson Global Select Funds (previously known as Henderson Global Select Funds)
STATEMENTS OF PORTFOLIO (continued) As at 31 December 2017 (unaudited)
30
Primary (continued) Janus Henderson Global Property Income
Fund
Holdings at 31 December
2017
Fair value at 31 December
2017
Percentage of total net assets
attributable to unitholders at 31 December
2017 By Geography (continued) $ % Quoted Real Estate Investment Trusts
UNITED STATES OF AMERICA Simon Property Group Incorporated 2,038 468,048 4.59 Alexandria Real Estate Equities Incorporated 1,963 342,584 3.36 MGM Growth Properties LLC 8,317 323,998 3.18 Cousins Properties Incorporated 25,014 309,216 3.03 Equity Residential 3,611 307,786 3.02 Kite Realty Group Trust 10,884 285,090 2.79 Brandywine Realty Trust 11,564 281,111 2.76 LTC Properties Incorporated 4,590 267,139 2.62 Rexford Industrial Realty Incorporated 6,685 260,511 2.55 Sabra Health Care Realty Incorporated 10,273 257,691 2.53 Cyrusone Incorporated 2,698 214,642 2.10 Omega Healthcare Investors Incorporated 5,752 211,700 2.08 Physicians Realty Trust 8,281 199,091 1.95 CBL & Associates Properties Incorporated 18,897 142,938 1.40
3,871,545 37.96
SINGAPORE Mapletree Commercial Trust 382,491 619,635 6.08 Capitaland Commercial Trust 304,205 587,116 5.76 Mapletree Industrial Trust 153,600 311,808 3.06 Frasers Logistics & Industrial Trust 230,300 267,148 2.62 Capitaland Mall Trust 115,500 246,015 2.41 Mapletree Greater China Commercial Trust 158,300 194,709 1.91 AIMS AMP Capital Industrial REIT 95,700 130,152 1.27
2,356,583 23.11
BRITAIN Hammerson Public Listed Company 16,000 158,224 1.55 Segro Public Listed Company 14,139 150,045 1.47 British Land Company Public Listed Company 10,400 130,014 1.28 Assura Public Listed Company 108,601 125,459 1.23
563,742 5.53
CANADA Dream Global Real Estate Investment Trust 25,155 327,877 3.22 Pure Industrial Real Estate Trust 30,000 216,633 2.12 544,510 5.34

Janus Henderson Global Select Funds (previously known as Henderson Global Select Funds)
STATEMENTS OF PORTFOLIO (continued) As at 31 December 2017 (unaudited)
31
Primary (continued) Janus Henderson Global Property Income
Fund
Holdings at 31 December
2017
Fair value at 31 December
2017
Percentage of total net assets
attributable to unitholders at 31 December
2017 By Geography (continued) $ % Quoted Real Estate Investment Trusts (continued)
AUSTRALIA GDI Property Group 208,563 272,506 2.67 Mirvac Group 98,993 243,165 2.39
515,671 5.06
JAPAN Star Asia Investment Corporation 140 186,183 1.83 Invincible Investment Corporation 300 170,654 1.67
356,837 3.50
MEXICO Prologis Property Mexico 68,628 159,330 1.56 Concentradora Fibra Hotelera Mexicana 190,000 151,191 1.48
310,521 3.04
FRANCE Gecina 750 185,228 1.82
SPAIN Merlin Properties Socimi 7,200 130,562 1.28
Total Quoted Real Estate Investment Trusts 8,835,199 86.64
Portfolio of investments 10,039,154 98.45 Other net assets 157,716 1.55
Net assets attributable to unitholders 10,196,870 100.00
Janus Henderson Global Select Funds (previously known as Henderson Global Select Funds)
STATEMENTS OF PORTFOLIO (continued) As at 31 December 2017 (unaudited)
32
Janus Henderson Global
Property Income Fund
Percentage of total net assets
attributable to unitholders at 31 December
2017
Percentage of total net assets
attributable to unitholders at
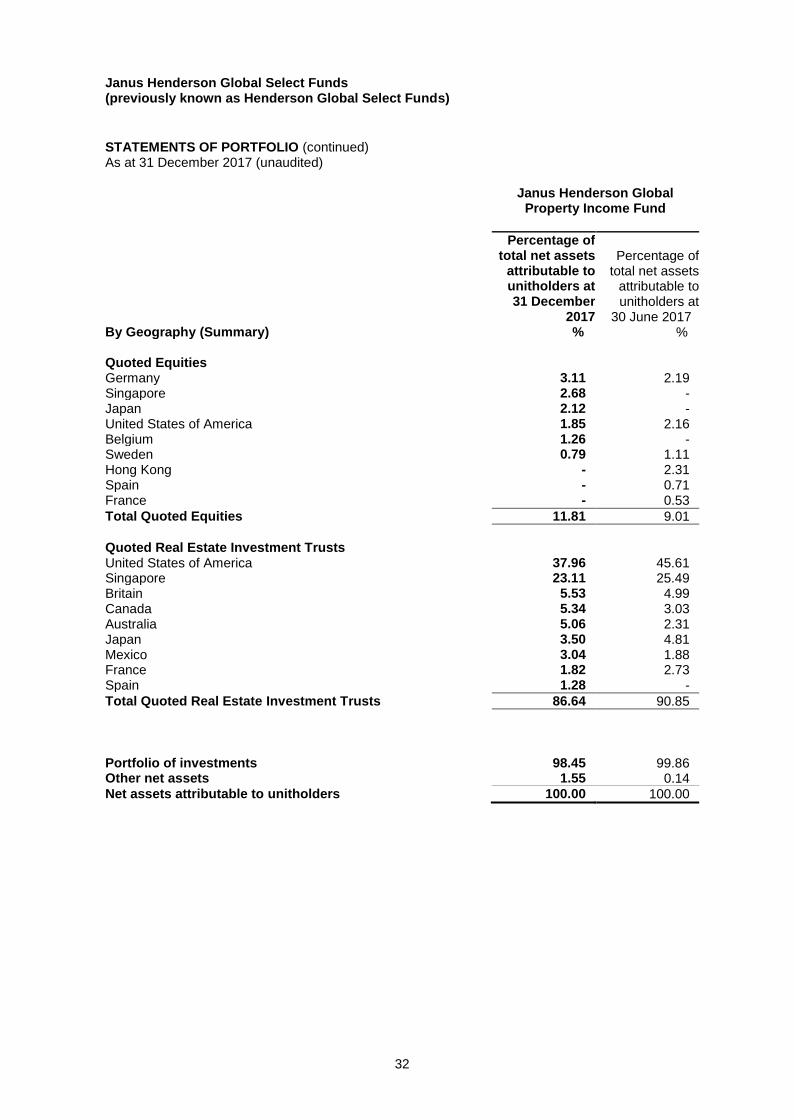
30 June 2017 By Geography (Summary) % % Quoted Equities Germany 3.11 2.19 Singapore 2.68 - Japan 2.12 - United States of America 1.85 2.16 Belgium 1.26 - Sweden 0.79 1.11 Hong Kong - 2.31 Spain - 0.71 France - 0.53
Total Quoted Equities 11.81 9.01
Quoted Real Estate Investment Trusts United States of America 37.96 45.61 Singapore 23.11 25.49 Britain 5.53 4.99 Canada 5.34 3.03 Australia 5.06 2.31 Japan 3.50 4.81 Mexico 3.04 1.88 France 1.82 2.73 Spain 1.28 -
Total Quoted Real Estate Investment Trusts 86.64 90.85
Portfolio of investments 98.45 99.86 Other net assets 1.55 0.14 Net assets attributable to unitholders 100.00 100.00
Janus Henderson Global Select Funds (previously known as Henderson Global Select Funds)
STATEMENTS OF PORTFOLIO (continued) As at 31 December 2017 (unaudited)
33
Janus Henderson Global Property Income
Fund
Fair value at 31 December
2017
Percentage of total net assets
attributable to unitholders at 31 December
2017
Percentage of total net assets
attributable to unitholders at
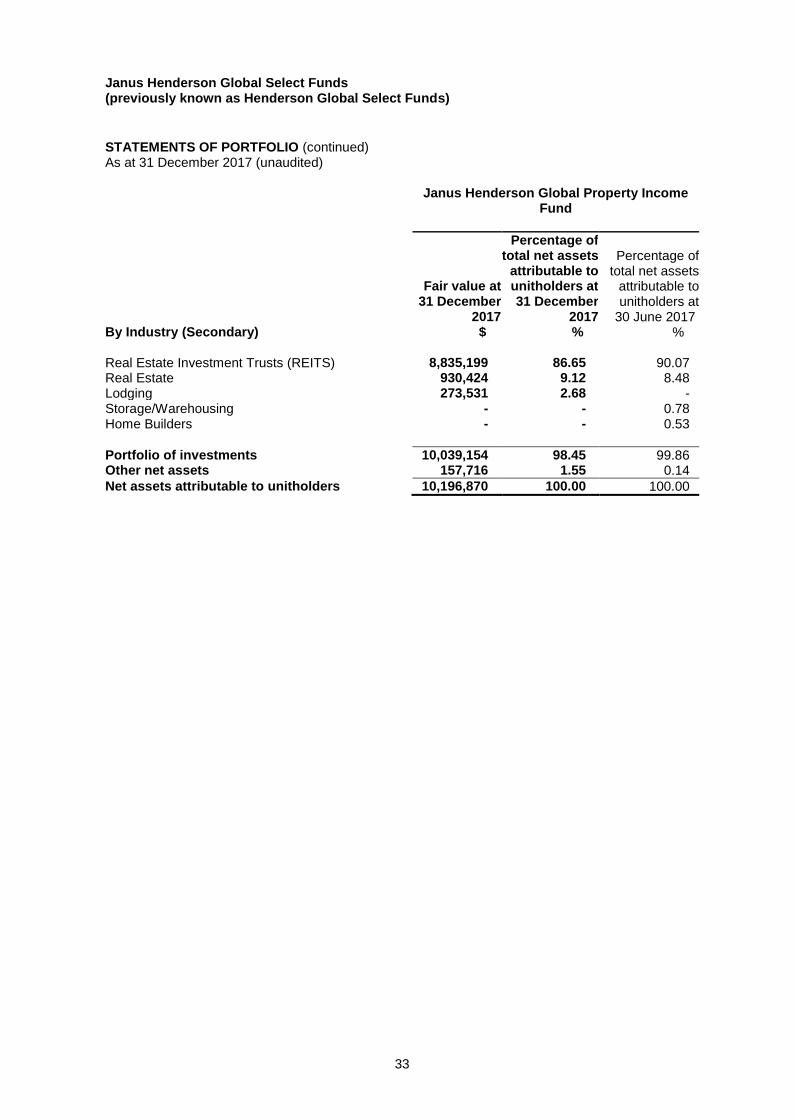
30 June 2017 By Industry (Secondary) $ % % Real Estate Investment Trusts (REITS) 8,835,199 86.65 90.07 Real Estate 930,424 9.12 8.48 Lodging 273,531 2.68 - Storage/Warehousing - - 0.78 Home Builders - - 0.53
Portfolio of investments 10,039,154 98.45 99.86 Other net assets 157,716 1.55 0.14
Net assets attributable to unitholders 10,196,870 100.00 100.00

Janus Henderson Global Select Funds (previously known as Henderson Global Select Funds) OTHER INFORMATION For the half year ended 31 December 2017 (unaudited)
34
The following contains additional information relating to the Fund. 1. Distribution of investments
Please refer to the Statement of Portfolio.
2. Top 10 holdings
Janus Henderson Asian Growth Fund As at 31 December 2017
Fair value $
Percentage of total net assets
attributable to unitholders
%
Janus Henderson Horizon Fund - Asian Growth Fund (previously known as Henderson Horizon Fund - Asian Growth Fund) 4,803,522 98.96 As at 31 December 2016
Fair value $
Percentage of total net assets
attributable to unitholders
%
Henderson Horizon Fund - Asian Growth Fund 5,490,788 98.49 Janus Henderson Pan European Equity Fund As at 31 December 2017
Fair value $
Percentage of total net assets
attributable to unitholders
%
Janus Henderson Horizon Fund - Pan European Equity Fund (previously known as Henderson Horizon Fund - Pan European Equity Fund) 21,310,282 98.42 As at 31 December 2016
Fair value $
Percentage of total net assets
attributable to unitholders
%
Henderson Horizon Fund - Pan European Equity Fund 30,196,832 99.40

Janus Henderson Global Select Funds (previously known as Henderson Global Select Funds) OTHER INFORMATION For the half year ended 31 December 2017 (unaudited) 2. Top 10 holding (continued)
35
Janus Henderson Global Property Equities Fund As at 31 December 2017
Fair value $
Percentage of total net assets
attributable to unitholders
%
Janus Henderson Horizon Fund - Global Property Equities Fund (previously known as Henderson Horizon Fund - Global Property Equities Fund) 10,458,464 98.52 As at 31 December 2016
Fair value $
Percentage of total net assets
attributable to unitholders
%
Henderson Horizon Fund - Global Property Equities Fund 12,242,770 99.31 Janus Henderson Asia-Pacific Property Equities Fund As at 31 December 2017
Fair value $
Percentage of total net assets
attributable to unitholders
%
Janus Henderson Horizon Fund - Asia-Pacific Property Equities Fund (previously known as Henderson Horizon Fund - Asia-Pacific Property Equities Fund) 29,776,177 98.89 As at 31 December 2016
Fair value $
Percentage of total net assets
attributable to unitholders
%
Henderson Horizon Fund - Asia-Pacific Property Equities Fund 33,970,694 99.31
Janus Henderson Global Select Funds (previously known as Henderson Global Select Funds) OTHER INFORMATION For the half year ended 31 December 2017 (unaudited) 2. Top 10 holding (continued)
36
Janus Henderson Pan European Property Equities Fund As at 31 December 2017
Fair value $
Percentage of total net assets
attributable to unitholders
%
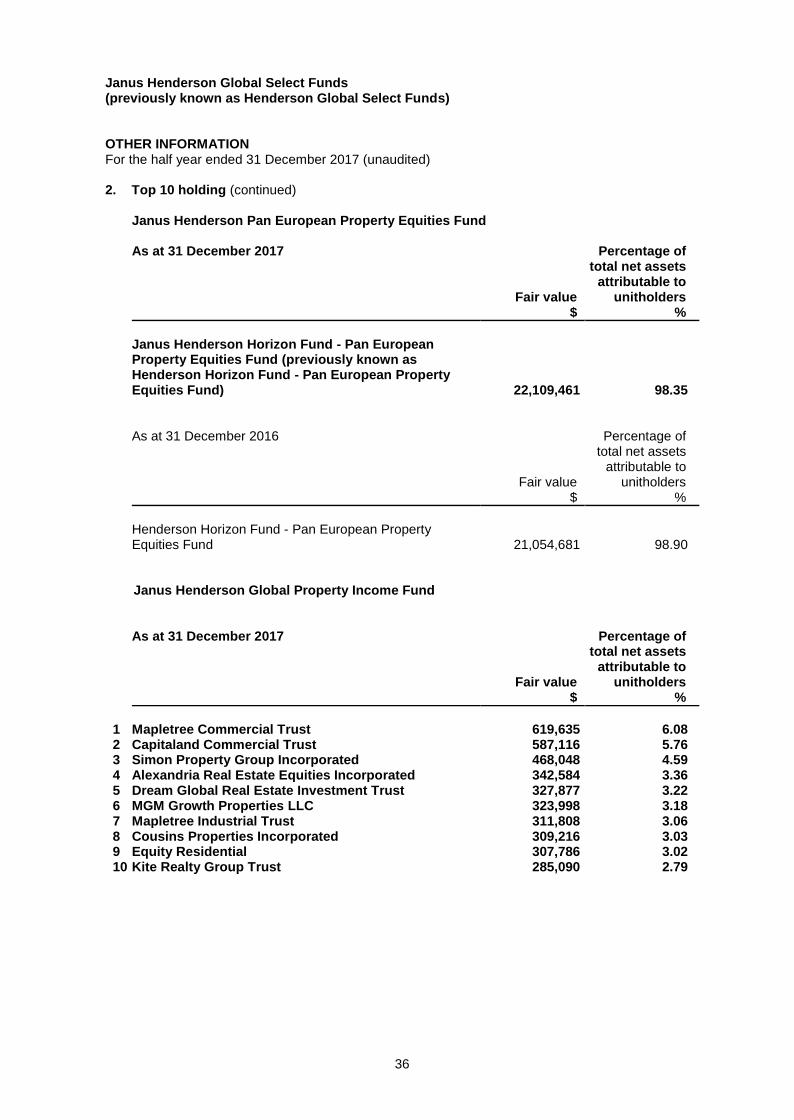
Janus Henderson Horizon Fund - Pan European Property Equities Fund (previously known as Henderson Horizon Fund - Pan European Property Equities Fund) 22,109,461 98.35 As at 31 December 2016
Fair value $
Percentage of total net assets
attributable to unitholders
%
Henderson Horizon Fund - Pan European Property Equities Fund 21,054,681 98.90
Janus Henderson Global Property Income Fund
As at 31 December 2017
Fair value $
Percentage of total net assets
attributable to unitholders
%
1 Mapletree Commercial Trust 619,635 6.08 2 Capitaland Commercial Trust 587,116 5.76 3 Simon Property Group Incorporated 468,048 4.59 4 Alexandria Real Estate Equities Incorporated 342,584 3.36 5 Dream Global Real Estate Investment Trust 327,877 3.22 6 MGM Growth Properties LLC 323,998 3.18 7 Mapletree Industrial Trust 311,808 3.06 8 Cousins Properties Incorporated 309,216 3.03 9 Equity Residential 307,786 3.02 10 Kite Realty Group Trust 285,090 2.79
Janus Henderson Global Select Funds (previously known as Henderson Global Select Funds) OTHER INFORMATION For the half year ended 31 December 2017 (unaudited) 2. Top 10 holding (continued)
37
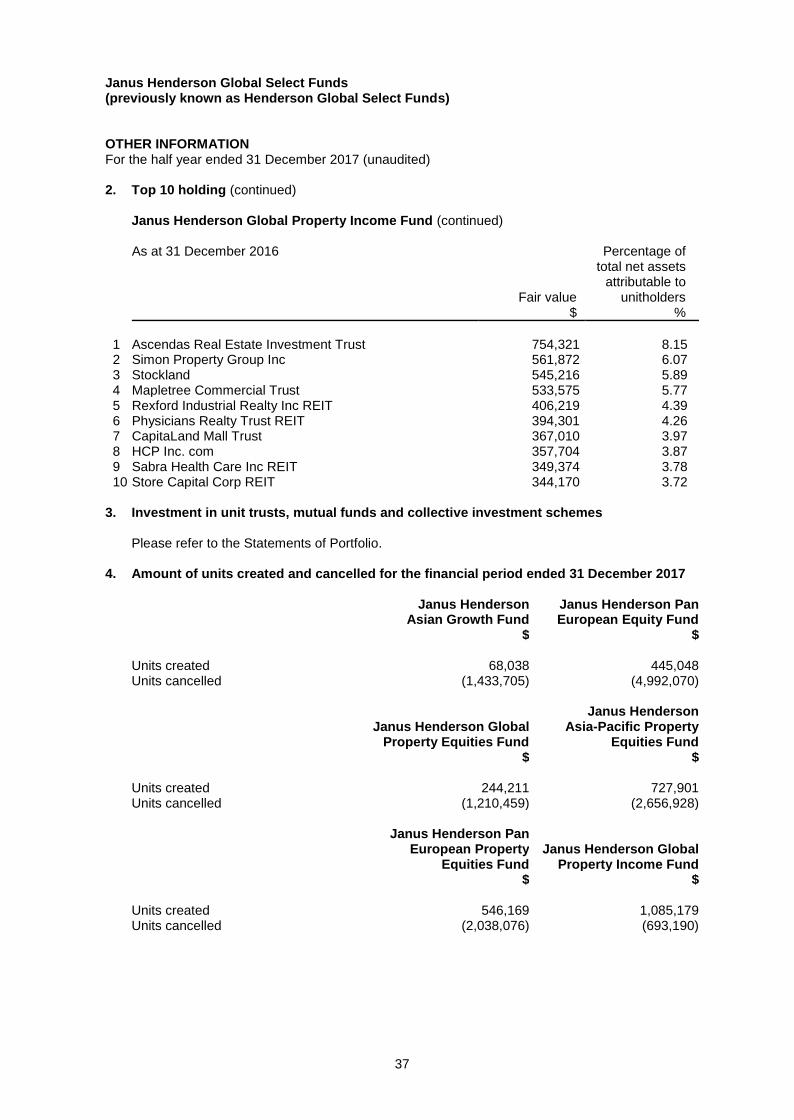
Janus Henderson Global Property Income Fund (continued)
As at 31 December 2016
Fair value $
Percentage of total net assets
attributable to unitholders
%
1 Ascendas Real Estate Investment Trust 754,321 8.15 2 Simon Property Group Inc 561,872 6.07 3 Stockland 545,216 5.89 4 Mapletree Commercial Trust 533,575 5.77 5 Rexford Industrial Realty Inc REIT 406,219 4.39 6 Physicians Realty Trust REIT 394,301 4.26 7 CapitaLand Mall Trust 367,010 3.97 8 HCP Inc. com 357,704 3.87 9 Sabra Health Care Inc REIT 349,374 3.78 10 Store Capital Corp REIT 344,170 3.72
3. Investment in unit trusts, mutual funds and collective investment schemes Please refer to the Statements of Portfolio.
4. Amount of units created and cancelled for the financial period ended 31 December 2017
Janus Henderson Asian Growth Fund
Janus Henderson Pan European Equity Fund
$ $ Units created 68,038 445,048 Units cancelled (1,433,705) (4,992,070)
Janus Henderson Global Property Equities Fund
Janus Henderson Asia-Pacific Property
Equities Fund $ $ Units created 244,211 727,901 Units cancelled (1,210,459) (2,656,928)
Janus Henderson Pan European Property
Equities Fund Janus Henderson Global
Property Income Fund $ $ Units created 546,169 1,085,179 Units cancelled (2,038,076) (693,190)

Janus Henderson Global Select Funds (previously known as Henderson Global Select Funds) OTHER INFORMATION For the half year ended 31 December 2017 (unaudited)
38
5. Turnover ratio
Janus Henderson Asian Growth Fund 31 December
2017 31 December
2016 Lower of total value of purchases or sales $ Nil 18,173 Average daily net asset value $ 5,195,406 5,844,299 Total turnover ratio
Note % Nil 0.31
Janus Henderson Pan European Equity Fund Lower of total value of purchases or sales $ Nil Nil Average daily net asset value $ 23,513,248 31,998,967 Total turnover ratio
Note % Nil Nil
Janus Henderson Global Property Equities Fund Lower of total value of purchases or sales $ Nil 539,109 Average daily net asset value $ 11,020,625 12,606,019 Total turnover ratio
Note % Nil 4.28
Janus Henderson Asia-Pacific Property Equities Fund Lower of total value of purchases or sales $ Nil 237,378 Average daily net asset value $ 30,267,437 35,773,089 Total turnover ratio
Note % Nil 0.66
Janus Henderson Pan European Property Equities Fund Lower of total value of purchases or sales $ Nil Nil Average daily net asset value $ 21,546,208 22,467,986 Total turnover ratio
Note % Nil Nil
Janus Henderson Global Property Income Fund Lower of total value of purchases or sales $ 3,201,764 4,390,049 Average daily net asset value $ 9,966,799 9,763,907 Total turnover ratio
Note % 32.12 44.96
Note: The portfolio turnover ratios are calculated in accordance with the formula stated in the Code on Collective
Investment Schemes. The calculation of the portfolio turnover ratio was based on the lower of total value of purchases or sales of the underlying investments divided by the average daily net asset value.

Janus Henderson Global Select Funds (previously known as Henderson Global Select Funds) OTHER INFORMATION For the half year ended 31 December 2017 (unaudited)
39
6. Expense ratio Janus Henderson Asian Growth Fund 31 December
2017 31 December
2016 Total operating expenses $ 45,350 26,909 Average daily net asset value $ 5,439,798 5,913,609 Total expense ratio
Note (including Investee Fund's
expense ratio) % 2.83 2.42 Weighted average of the Investee Fund's unaudited
expense ratio % 2.00 1.97
Janus Henderson Pan European Equity Fund 31 December
2017 31 December
2016 Total operating expenses $ 113,604 15,203 Average daily net asset value $ 24,960,892 35,340,230 Total expense ratio
Note (including Investee Fund's
expense ratio) % 2.32 1.91 Weighted average of the Investee Fund's unaudited
expense ratio % 1.86 1.87
Janus Henderson Global Property Equities Fund 31 December
2017 31 December
2016 Total operating expenses $ 69,769 20,456 Average daily net asset value $ 11,488,677 13,548,913 Total expense ratio
Note (including Investee Fund's
expense ratio) % 2.48 2.03 Weighted average of the Investee Fund's unaudited
expense ratio % 1.87 1.88
Janus Henderson Global Select Funds (previously known as Henderson Global Select Funds) OTHER INFORMATION For the half year ended 31 December 2017 (unaudited) 6. Expense ratio (continued)
40
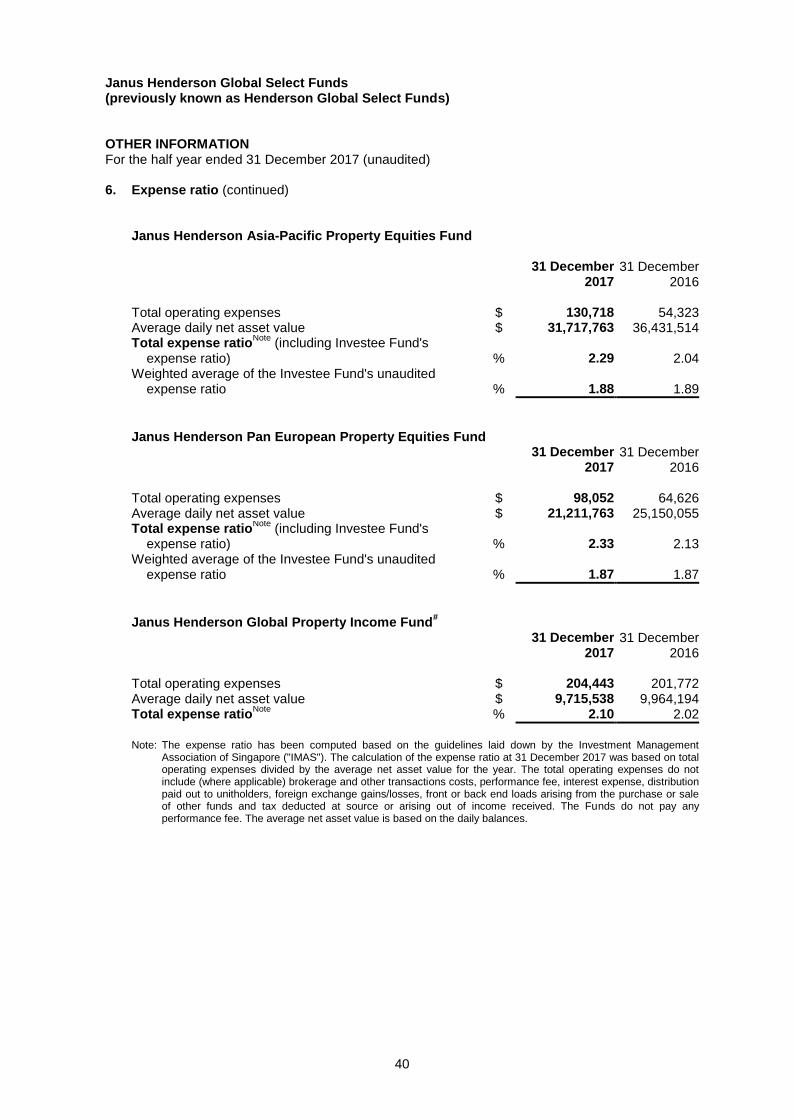
Janus Henderson Asia-Pacific Property Equities Fund 31 December
2017 31 December
2016 Total operating expenses $ 130,718 54,323 Average daily net asset value $ 31,717,763 36,431,514 Total expense ratio
Note (including Investee Fund's
expense ratio) % 2.29 2.04 Weighted average of the Investee Fund's unaudited
expense ratio % 1.88 1.89
Janus Henderson Pan European Property Equities Fund 31 December
2017 31 December
2016 Total operating expenses $ 98,052 64,626 Average daily net asset value $ 21,211,763 25,150,055 Total expense ratio
Note (including Investee Fund's
expense ratio) % 2.33 2.13 Weighted average of the Investee Fund's unaudited
expense ratio % 1.87 1.87
Janus Henderson Global Property Income Fund#
31 December 2017
31 December 2016
Total operating expenses $ 204,443 201,772 Average daily net asset value $ 9,715,538 9,964,194 Total expense ratio
Note % 2.10 2.02
Note: The expense ratio has been computed based on the guidelines laid down by the Investment Management
Association of Singapore ("IMAS"). The calculation of the expense ratio at 31 December 2017 was based on total operating expenses divided by the average net asset value for the year. The total operating expenses do not include (where applicable) brokerage and other transactions costs, performance fee, interest expense, distribution paid out to unitholders, foreign exchange gains/losses, front or back end loads arising from the purchase or sale of other funds and tax deducted at source or arising out of income received. The Funds do not pay any performance fee. The average net asset value is based on the daily balances.
Janus Henderson Global Select Funds (previously known as Henderson Global Select Funds) OTHER INFORMATION For the half year ended 31 December 2017 (unaudited)
41
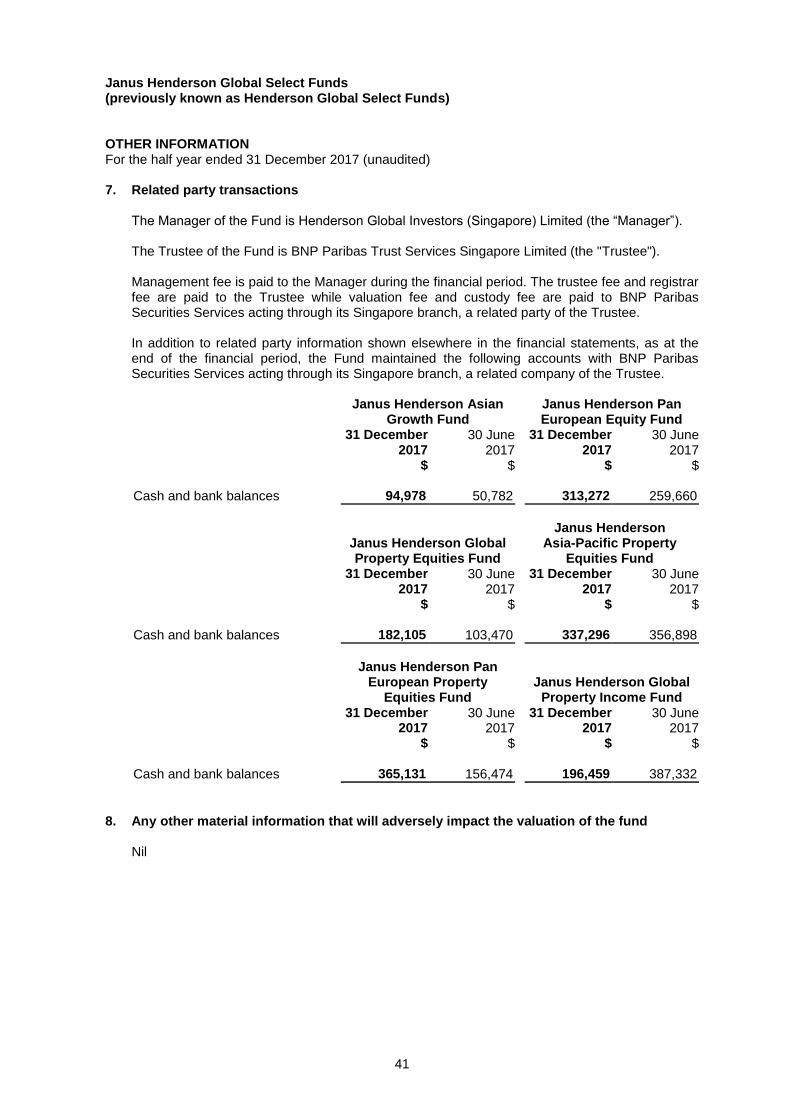
7. Related party transactions The Manager of the Fund is Henderson Global Investors (Singapore) Limited (the “Manager”). The Trustee of the Fund is BNP Paribas Trust Services Singapore Limited (the "Trustee"). Management fee is paid to the Manager during the financial period. The trustee fee and registrar fee are paid to the Trustee while valuation fee and custody fee are paid to BNP Paribas Securities Services acting through its Singapore branch, a related party of the Trustee. In addition to related party information shown elsewhere in the financial statements, as at the end of the financial period, the Fund maintained the following accounts with BNP Paribas Securities Services acting through its Singapore branch, a related company of the Trustee.
Janus Henderson Asian
Growth Fund Janus Henderson Pan European Equity Fund
31 December 2017
$
30 June 2017
$
31 December 2017
$
30 June 2017
$ Cash and bank balances 94,978 50,782 313,272 259,660
Janus Henderson Global Property Equities Fund
Janus Henderson Asia-Pacific Property
Equities Fund
31 December 2017
$
30 June 2017
$
31 December 2017
$
30 June 2017
$ Cash and bank balances 182,105 103,470 337,296 356,898
Janus Henderson Pan European Property
Equities Fund Janus Henderson Global
Property Income Fund
31 December 2017
$
30 June 2017
$
31 December 2017
$
30 June 2017
$ Cash and bank balances 365,131 156,474 196,459 387,332
8. Any other material information that will adversely impact the valuation of the fund
Nil

Janus Henderson Global Select Funds (previously known as Henderson Global Select Funds) OTHER INFORMATION For the half year ended 31 December 2017 (unaudited)
42
The details which follow make reference to the investments within Janus Henderson Horizon Fund - Asian Growth Fund unless stated otherwise.
1. Top 10 Holdings
As at 31 December 2017 Market Value USD % of Net Assets*
1 Samsung Electronics Preference Shares 2,078,628 6.94 2 Taiwan Semiconductor Manufacturing 1,818,069 6.07 3 Tencent Holdings 1,693,925 5.67 4 Alibaba Holdings ADS 1,478,980 4.95 5 Housing Development Finance 1,417,806 4.73 6 HDFC Bank 1,156,121 3.86 7 AIA 953,066 3.18 8 Uni-President Enterprises 909,751 3.04 9 Ayala 866,349 2.89 10 LG Household & Healthcare 803,768 2.68
As at 31 December 2016 Market Value USD % of Net Assets*
1 Samsung Electronics Preference Shares 1,898,852 8.39 2 Taiwan Semiconductor Manufacturing 1,619,658 7.16 3 Tencent Holdings 1,463,275 6.47 4 Housing Development Finance 1,236,112 5.47 5 AIA 1,147,078 5.08 6 Largan Precision 822,628 3.64 7 ITC 747,063 3.30 8 Ayala 692,935 3.07 9 Lupin 672,207 2.98 10 HDFC Bank 669,324 2.96
* Any differences in the percentage of net asset figures are the result of rounding.
2. Financial Ratios
2017 2016 % % Expense Ratio 2.02 2.00 Turnover Ratio 31.68 67.56

Janus Henderson Global Select Funds (previously known as Henderson Global Select Funds) OTHER INFORMATION For the half year ended 31 December 2017 (unaudited)
43
The details which follow make reference to the investments within Janus Henderson Horizon Fund - Pan European Equity Fund unless stated otherwise.
1. Top 10 Holdings
As at 31 December 2017 Market Value EUR % of Net Assets*
1 Deutsche Post 81,838,519 3.63 2 ING 68,392,114 3.04 3 Amundi 67,433,859 3.00 4 BP 66,748,594 2.96 5 Total 65,792,781 2.92 6 Allianz 64,378,475 2.86 7 Vodafone 61,755,329 2.74 8 RELX 61,442,927 2.73 9 SAP 60,857,392 2.70 10 Royal Dutch Shell 'B' 60,114,568 2.67
As at 31 December 2016 Market Value EUR % of Net Assets*
1 SAP 137,621,890 3.67 2 Fresenius 116,352,790 3.10 3 Deutsche Post 111,516,110 2.97 4 Fresenius Medical Care 109,551,806 2.92 5 ING 103,989,471 2.77 6 Royal Dutch Shell 'B' 97,388,742 2.60 7 Deutsche Telekom 93,263,151 2.49 8 BP 92,297,812 2.46 9 RELX 90,013,544 2.40 10 Novartis 88,616,952 2.36
* Any differences in the percentage of net asset figures are the result of rounding.
2. Financial Ratios
2017 2016 % % Expense Ratio 1.89 1.88 Turnover Ratio 6.72 22.48

Janus Henderson Global Select Funds (previously known as Henderson Global Select Funds) OTHER INFORMATION For the half year ended 31 December 2017 (unaudited)
44
The details which follow make reference to the investments within Janus Henderson Horizon Fund - Global Property Equities Fund unless stated otherwise.
1. Top 10 Holdings
As at 31 December 2017 Market Value USD % of Net Assets*
1 Simon Property 18,449,681 5.32 2 Deutsche Wohnen 13,518,319 3.89 3 Mitsui Fudosan 12,997,757 3.75 4 Alexandria Real Estate Equities REIT 12,940,614 3.73 5 Sun Hung Kai Properties 12,216,064 3.52 6 Public Storage 11,362,516 3.27 7 Invitation Homes REIT 10,201,147 2.94 8 Hang Lung Properties 8,346,231 2.40 9 Goodman 8,123,577 2.34 10 United Dominion Realty Trust 8,042,121 2.32
As at 31 December 2016 Market Value USD % of Net Assets*
1 Simon Property 22,439,710 5.51 2 Mitsui Fudosan 16,951,148 4.18 3 AvalonBay Communities 16,819,789 4.14 4 General Growth Properties REIT 13,145,442 3.23 5 Deutsche Wohnen 12,913,315 3.18 6 Scentre 12,238,898 3.01 7 Rexford Industrial Realty 12,233,733 3.01 8 Sun Hung Kai Properties 11,728,910 2.88 9 Hudson Pacific Properties 10,940,968 2.69 10 Physicians Realty Trust 10,803,125 2.66
* Any differences in the percentage of net asset figures are the result of rounding.
2. Financial Ratios
2017 2016 % % Expense Ratio 1.90 1.89 Turnover Ratio 73.43 73.00

Janus Henderson Global Select Funds (previously known as Henderson Global Select Funds) OTHER INFORMATION For the half year ended 31 December 2017 (unaudited)
45
The details which follow make reference to the investments within Janus Henderson Horizon Fund - Asia-Pacific Property Equities Fund unless stated otherwise.
1. Top 10 Holdings
As at 31 December 2017 Market Value USD % of Net Assets*
1 Sun Hung Kai Properties 26,422,008 8.59 2 Mitsui Fudosan 25,914,744 8.42 3 Link REIT 23,535,804 7.65 4 Goodman 15,339,447 4.98 5 Hang Lung Properties 13,381,103 4.35 6 CK Asset 13,183,769 4.28 7 Scentre 13,106,290 4.26 8 Sumitomo Realty & Development 12,871,741 4.18 9 Hulic 12,145,813 3.95 10 City Developments 11,805,853 3.83
As at 31 December 2016 Market Value USD % of Net Assets*
1 Scentre 26,858,785 9.72 2 Mitsui Fudosan 22,216,112 8.05 3 Sun Hung Kai Properties 21,532,868 7.79 4 Cheung Kong Property 20,840,955 7.54 5 Link REIT 15,823,302 5.73 6 Activia Properties 13,387,677 4.84 7 Goodman 12,972,051 4.69 8 Orix Jreit 12,788,870 4.63 9 Mitsubishi Estate 12,591,527 4.56 10 Stockland Trust REIT 12,417,582 4.49
* Any differences in the percentage of net asset figures are the result of rounding.
2. Financial Ratios
2017 2016 % % Expense Ratio 1.90 1.90 Turnover Ratio 90.78 92.53
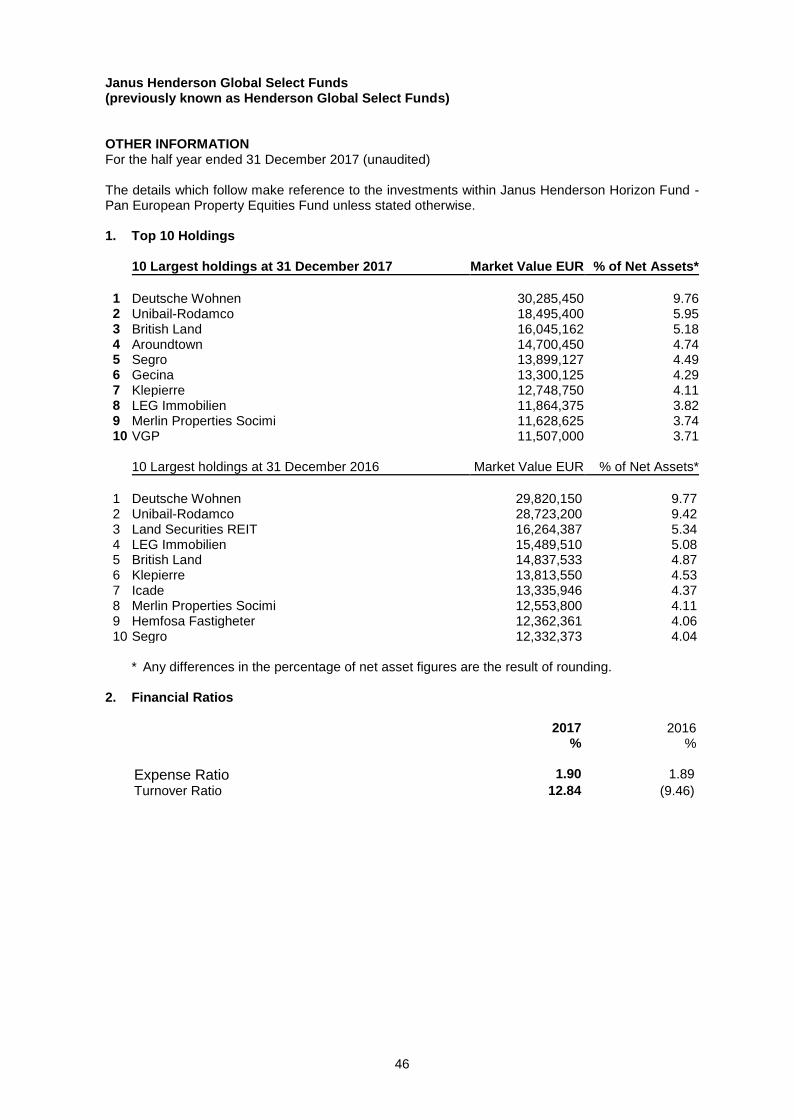
Janus Henderson Global Select Funds (previously known as Henderson Global Select Funds) OTHER INFORMATION For the half year ended 31 December 2017 (unaudited)
46
The details which follow make reference to the investments within Janus Henderson Horizon Fund - Pan European Property Equities Fund unless stated otherwise.
1. Top 10 Holdings
10 Largest holdings at 31 December 2017 Market Value EUR % of Net Assets*
1 Deutsche Wohnen 30,285,450 9.76 2 Unibail-Rodamco 18,495,400 5.95 3 British Land 16,045,162 5.18 4 Aroundtown 14,700,450 4.74 5 Segro 13,899,127 4.49 6 Gecina 13,300,125 4.29 7 Klepierre 12,748,750 4.11 8 LEG Immobilien 11,864,375 3.82 9 Merlin Properties Socimi 11,628,625 3.74 10 VGP 11,507,000 3.71
10 Largest holdings at 31 December 2016 Market Value EUR % of Net Assets*
1 Deutsche Wohnen 29,820,150 9.77 2 Unibail-Rodamco 28,723,200 9.42 3 Land Securities REIT 16,264,387 5.34 4 LEG Immobilien 15,489,510 5.08 5 British Land 14,837,533 4.87 6 Klepierre 13,813,550 4.53 7 Icade 13,335,946 4.37 8 Merlin Properties Socimi 12,553,800 4.11 9 Hemfosa Fastigheter 12,362,361 4.06 10 Segro 12,332,373 4.04
* Any differences in the percentage of net asset figures are the result of rounding.
2. Financial Ratios
2017 2016 % %
Expense Ratio 1.90 1.89
Turnover Ratio 12.84 (9.46)

For further information, please contact your local distributor, or Henderson Global Investors (Singapore) Limited, 138 Market Street, #34-03/04, CapitaGreen, Singapore 048946. Tel: (65) 6813 1000 Website: http://www.janushenderson.com/sgCompany Registration No. 199700782N
Important InformationThe prospectus and Product Highlights Sheets of the Janus Henderson Global Select Funds (the “Fund”) is available and may be obtained from the manager’s office and the participating distributors’ offices. Investors should read the prospectus and Product Highlights Sheets before deciding whether to invest in the units of the Fund. All applications for units in the Fund must be made on the application forms accompanying the prospectus. The information on the Fund and the sub-funds of the Janus Henderson Horizon Fund (Luxembourg fund) is strictly for information purposes only and should not be construed as an offer or solicitation to deal in the Fund. Investors should note that the Luxembourg fund may make use of financial derivative instruments for efficient portfolio management and/or hedging purposes. Reference to individual companies is for the purpose of illustration only and should not be construed as a recommendation to buy or sell. An investment in unit trusts, and/or other investment products is subject to investment risks, including the possible loss of the principal amount invested. Past performance and any forecast made are not necessarily indicative of future performance. The value of the units and the income from the Fund may fall as well as rise. Henderson Global Investors (Singapore) Limited’s unit trusts and investment products are not obligations of, deposits in, or guaranteed by Henderson Global Investors (Singapore) Limited or any of its affiliates. Investors may wish to seek advice from a financial adviser before making a commitment to invest in units of the Fund. In the event an investor chooses not to seek advice from a financial adviser, the investor should consider whether the Fund is suitable for him. Whilst Henderson Global Investors (Singapore) Limited believes that the information contained in this report is correct at the date of print, it is subject to changes by Janus Henderson Horizon Fund (Luxembourg SICAV).
© 2018, Janus Henderson Investors. Janus Henderson is a trademark of Janus Henderson Investors. The name Janus Henderson Investors includes HGI Group Limited, Henderson Global Investors (Brand Management) Sarl and Janus International Holding LLC.
Date of publication: February 2018
H033702/0118