Embed Size (px)
Citation preview
Semi-annual Report
as at June 30, 2016

Semi-annual Reportas at June 30, 2016
Consolidated management report 5
Consolidated financial statements 21

Consolidated management reportCorporate governance 6
Business Review and Results 1. Highlights of first half 2016 8 2. Consolidated statement of income and consolidated balance sheet 9 3. Outlook 13
Risk Management 1. Key events of 2016 14 2. Credit risk 14 3. Market risk 18 4. Asset quality 19 5. Solvency monitoring 19
Cons
olid
ated
m
anag
emen
t re
port
Cons
olid
ated
fin
anci
al s
tate
men
ts
6 BIL | Semi-annual Report 2016
Corporate governance (as at June 30, 2016)
Board of DirectorsChairman
Luc Frieden
Vice-Chairman
George Nasra CEO, Precision Capital SA
Members
Hugues Delcourt CEO, Banque Internationale à Luxembourg SAFrank Wagener Honorary ChairmanNicholas Harvey Deputy CEO, Precision Capital SAMaurice Lam Owner, Lam & Partners SàrlPascale Toussing 1er Conseiller de Gouvernement, Ministry of FinanceAlbert Wildgen LawyerChristophe Zeeb-Ichter Conseiller de Gouvernement 1re classe, Ministry of FinanceMichel Scharff Employees’ Delegation, BILSerge Schimoff Employees’ Delegation, BILDonny Wagner Employees’ Delegation, BILFernand Welschbillig Employees’ Delegation, BIL
Board Strategy CommitteeChairman Members
George Nasra Luc Frieden Pascale Toussing
Board Audit and Compliance CommitteeChairman Members
Maurice Lam Nicholas Harvey Christophe Zeeb-Ichter

Cons
olid
ated
m
anag
emen
t re
port
Cons
olid
ated
fin
anci
al s
tate
men
ts
BIL | Semi-annual Report 2016 7
Board Risk CommitteeChairman Vice-Chairman Members
Frank Wagener George Nasra Luc Frieden Pascale Toussing Albert Wildgen
Board Remuneration and Nominations CommitteeChairman Members
George Nasra Nicholas Harvey Pascale Toussing Fernand Welschbillig (remuneration sub-meeting)
Management BoardChairman
Hugues Delcourt Chief Executive Officer
Vice-Chairman
Pierre Malevez Chief Financial and Risks Officer
Members
Yves Baguet Chief Operating Officer Hans-Peter Borgh Head of Wealth and Investment Management Olivier Debehogne Head of Retail and Digital BankingMarcel Leyers Head of Corporate and Institutional BankingBernard Mommens Secretary General and General CounselClaude Schon Head of Treasury and Financial Markets
Audit (Permanent Invitee)
Pia Haas Chief Internal Auditor
Cons
olid
ated
m
anag
emen
t re
port
Cons
olid
ated
fin
anci
al s
tate
men
ts
8 BIL | Semi-annual Report 2016
Business Review and Results
1. Highlights of first half 2016BIL’s announcement of a robust financial performance for 2015, with net income up 10% to EUR 134 million and a 15.2% increase in assets under management to EUR 35.5 billion, demonstrated that the Bank is profitable and progressing towards its objectives. During the first half of the year, this positive trend has continued with an encouraging net profit of EUR 45 million despite a challenging market environment.
The half-year featured the first anniversary of BIL’s current corporate strategy, entitled BIL2020, which was put into place in order to strengthen the Bank’s positioning over the next five years and ensure its long-term profitability.
This strategy puts an increased focus on innovation and client satisfaction in Luxembourg and in a defined number of international markets. It also has brought about a reinforced and focused corporate and social responsibility policy focusing on art and culture, education and innovation.
INNOVATION IS A KEY DRIVER FOR THE BANK
The Bank’s BIL2020 strategic framework puts a strong emphasis on increasing its role in promoting innovation. Many examples could be given to illustrate this focus on innovation. Two have been chosen here.
The Ignite program is one of the major initiatives that the Bank has undertaken in order to better prepare itself to support innovation, with an immediate goal of providing BIL with a first-class information technology (IT) infrastructure. In April, BIL’s Management Board selected the Temenos T24 package to serve as a basis for the Bank’s future core banking system. In May, BIL’s executive management decided that, in order to optimise the Bank’s target architecture and minimise the overall IT investment, the objective of the Loans project could be achieved through the selected core banking system.
Corporate and Institutional Banking (CIB) deployed an innovative financing solution in serving as the sole arranger of a EUR 79 million mixed format EURO Private Placement (EURO PP) on behalf of PRODWARE, a listed group. CIB structured this EURO PP financing in order to align the interests of the investors with those of the bank lenders, which included BIL. The transaction was made up of a EUR 50 million bond issue subscribed by institutional investors and a EUR 29 million bank loan underwritten by BIL and the Bank of China. The innovative aspect of this financing format is that the two funding sources are treated equally (pari passu), and share the same collateral.
A FOCUS ON IMPROVED CLIENT SERVICES
A key theme of the BIL2020 framework is an increased emphasis on finding new and better ways to serve BIL clients. The major client-focused project during the first half of 2016 was the launch of BIL Select, a new value proposition aimed at clients with assets of between EUR 125,000 and EUR 500,000 held at BIL. BIL Select includes a range of special services tailored to meet the needs and wants of this increasingly discerning, high potential client base in Luxembourg, as well as those in the border areas of surrounding countries.
The banking needs of these clients have been identified through qualitative research. BIL Select meets these needs by offering a special and stable relationship with a dedicated personal client relationship manager, an appropriate level of easily-accessible advice and the opportunity for clients to take part in financial information events to help them better understand the financial world and financial products.
The development of BIL’s international wealth management strategy has led to the identification of target markets in which the Bank has real expertise and an attractive value proposition for clients. A key development in this regard is the opening early in January in Stockholm of a representation office. This decision reinforces BIL’s setup to serve the Nordic markets with a clear focus for the Bank’s Wealth Management activities.
AN ONGOING SEARCH FOR EXCELLENCE
BIL, through its corporate strategy, is continually engaged in the pursuit of the highest standards, finding ways to progressively improve the products and services it offers. One significant example of this is the impressive performance of BIL Nordic Invest, the BIL Denmark investment fund that was ranked #1 by Morningstar in January. The fund delivered the best one-year performance among funds sold within Denmark with a net EUR based absolute return of 63.9%.
In May, BIL Dubai was awarded ‘Best Wealth Manager’ by ‘The Banker Middle East’.
CORPORATE SOCIAL RESPONSIBILITY – BIL’S NEW APPROACH
In March, in connection with BIL’s 160th anniversary, the Bank unveiled its new Corporate Social Responsibility (CSR) policy, which it had strengthened by integrating it into its strategic framework through a focus on three well-defined areas: art and culture, education and innovation, in line with the Bank’s strong roots in the Luxembourg economy, its strong sense of purpose and its commitment to innovation.
Cons
olid
ated
m
anag
emen
t re
port
Cons
olid
ated
fin
anci
al s
tate
men
ts
BIL | Semi-annual Report 2016 9
An example of this new CSR approach in action was the Art2Cure exhibition held during June in BIL’s Galerie L'Indépendance. More than 1000 guests came to see artworks from 28 artists which were on sale to raise funds for research into Parkinson’s and Alzheimer’s diseases at the University of Luxembourg’s Luxembourg Centre for Systems Biomedicine.
STRENGTH OF COMMERCIAL FRANCHISES
The “Retail, Corporate and Wealth Management” activities have once more turned in a robust performance during the first half of 2016 despite macro-economic turbulence.• In spite of adopting a selective pricing policy whereby
negative interest rates were applied to some clients, customer deposits were up by 6.4% to reach 16.0 billion (versus 15.0 billion at year-end 2015).
• Customer funds (Assets under Management - AuM) increased by 0.8% to EUR 35.8 billion, compared to EUR 35.5 billion at the end of 2015. This change resulted from net new inflows amounting to EUR 1.0 billion (especially thanks to Wealth Management activities) and a negative market effect of EUR 0.7 billion due to the market conditions.
• Customer loans saw an increase of 5.7% to EUR 12.0 billion compared with EUR 11.4 billion at year-end 2015. BIL has once again confirmed its support to the Luxembourg economy, particularly for corporate and individual customers.
PROFITABILITY CONFIRMED
BIL reported a net income after tax of EUR 45 million in June 2016, compared with EUR 108 million at end of June 2015. This evolution was mainly due to the exceptional items in 2015 as explained hereafter.
The 2015 income included exceptional results generated by the sale of Luxempart in January 2015 (EUR 67 million) reduced, to a small extent by non-recurring expenses following the decision to end the activities in Singapore. 2016 included non-recurring items (write-off investments) related to the decision to switch the Loans project to Temenos T24 in order to optimise the future IT architecture. These non-recurring expenses are to some extent mitigated by impairments write-backs consequently to Madoff loans recoveries.
The core operating net income before tax (excluding non-recurring items and capital gains generated by “Treasury and Financial Markets”) reached EUR 60 million, slightly lower than in 2015 (EUR 66 million).
However, unlike in 2015, where only EUR 3.8 million was charged in the first half for the Deposit Guarantee Scheme (DGS) and the Resolution funds1 , the first half of 2016 saw the
full-year impact of these contributions with a negative impact of EUR 11.7 million recorded as negative revenues.
Adjusted for DGS and Resolution funds, the core operating net income before tax increased by 2.5% compared with June 2015 and 7.1% after integration of KBL Switzerland for 6 months in 2015.
LONG-TERM COUNTERPARTY CREDIT RATINGS
On April 2016, Fitch has confirmed Banque Internationale à Luxembourg ratings at BBB+/Stable/F2. Moody’s and Standard & Poor’s ratings remain unchanged (A3/Positive/P-2 and A-/Stable/A-2).
2. Consolidated statement of income and consolidated balance sheet 2
INTERIM CONSOLIDATED FINANCIAL STATEMENTS
The consolidated financial statements of BIL group for the first half of 2016 were prepared in accordance with International Financial Reporting Standards (IFRS), as adopted by the European Union. The main accounting principles are described in Note 1 to the consolidated financial statements. Unless stated otherwise, all amounts are expressed in euro (EUR).
On December 18, 2015, Luxembourg passed the law on the resolution, recovery and liquidation measures of credit institutions and some investment firms and on deposit guarantee and investor compensation schemes (the “Law”), transposing into Luxembourg law Directive 2014/59/EU establishing a framework for the recovery and resolution of credit institutions and investment firms, as well as Directive 2014/49/EU on deposit guarantee and investor compensation schemes.
The Law replaces Luxembourg's deposit guarantee and investor compensation scheme, implemented by the AGDL (Association pour la Garantie des Dépôts, Luxembourg), with a new contribution-based deposit guarantee and investor compensation scheme. The new scheme will cover all eligible deposits by a single depositor up to EUR 100,000 and investments up to EUR 20,000. In addition, the Law requires that deposits arising from specific transactions, fulfilling a social objective, or relating to particular life events be covered above the limit of EUR 100,000 for a 12-month period.
1 See explanations section 2 – Interim consolidated financial statements.2 Rounding differences and percentages calculated on exact numbers.
Cons
olid
ated
m
anag
emen
t re
port
Cons
olid
ated
fin
anci
al s
tate
men
ts
10 BIL | Semi-annual Report 2016
The new “Fonds de Garantie des Dépôts Luxembourg” (FGDL) target funding level is set at 0.8% of member institutions’ covered deposits (as defined in Article 163(8) of the Law) and will have to be reached by the end of 2018. Contributions are to be made annually between 2016 and 2018. For 2015, a 0.2% provision of covered deposits was established in anticipation of these contributions.
In April 2016, credit institutions and investment firms received their invoice and appendix for the collection of the first tranche of the contributions to the FGDL with an invitation to pay within two weeks. Individual risk-based contributions were determined pursuant to the methodology presented in Annex 1 to the Circular CSSF-CPDI 16/01 of April 6, 2016. Said Circular specifies that from 2016 to 2018, credit institutions and investment firms will pay yearly contributions equal to one third of the 0.8% target level of covered deposits to the FGDL.
Article 179 of the Law of December 18, 2015 states that contributions will be collected on a regular basis.
In order to ensure consistency of the contributions’ impact on the income statement between the years 2015 and 2018, the 2015 0.2% provision of covered deposits will be written off progressively by one third each year from 2016 to 2018. The first write-off has been accounted for as of June 30, 2016.
When the 0.8% target level is reached in 2018, Luxembourg credit institutions and investment firms will continue to contribute for another eight years to provide an additional cushion of 0.8% of covered deposits as defined in Article 163(8) of the Law.
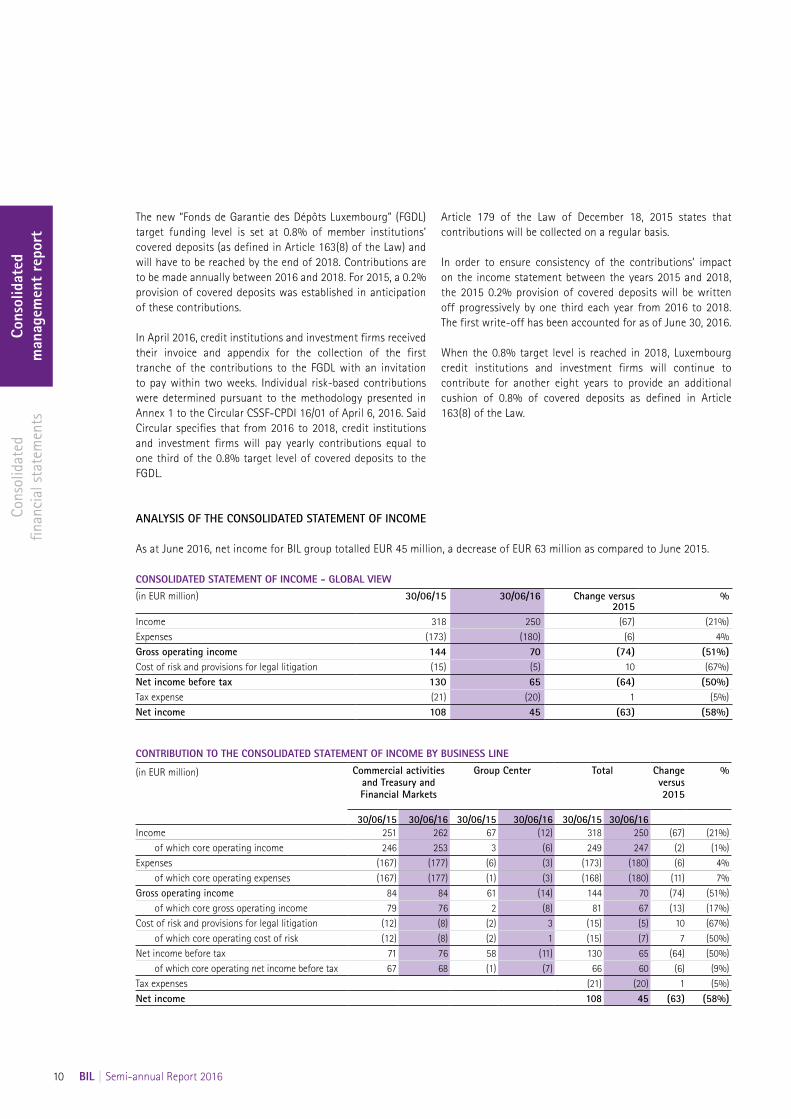
As at June 2016, net income for BIL group totalled EUR 45 million, a decrease of EUR 63 million as compared to June 2015.
CONSOLIDATED STATEMENT OF INCOME - GLOBAL VIEW
(in EUR million) 30/06/15 30/06/16 Change versus2015
%
Income 318 250 (67) (21%)Expenses (173) (180) (6) 4%Gross operating income 144 70 (74) (51%)Cost of risk and provisions for legal litigation (15) (5) 10 (67%)Net income before tax 130 65 (64) (50%)Tax expense (21) (20) 1 (5%)Net income 108 45 (63) (58%)
CONTRIBUTION TO THE CONSOLIDATED STATEMENT OF INCOME BY BUSINESS LINE
(in EUR million) Commercial activities and Treasury and Financial Markets
Group Center Total Change versus 2015
%
30/06/15 30/06/16 30/06/15 30/06/16 30/06/15 30/06/16Income 251 262 67 (12) 318 250 (67) (21%)
of which core operating income 246 253 3 (6) 249 247 (2) (1%)Expenses (167) (177) (6) (3) (173) (180) (6) 4%
of which core operating expenses (167) (177) (1) (3) (168) (180) (11) 7%Gross operating income 84 84 61 (14) 144 70 (74) (51%)
of which core gross operating income 79 76 2 (8) 81 67 (13) (17%)Cost of risk and provisions for legal litigation (12) (8) (2) 3 (15) (5) 10 (67%)
of which core operating cost of risk (12) (8) (2) 1 (15) (7) 7 (50%)Net income before tax 71 76 58 (11) 130 65 (64) (50%)
of which core operating net income before tax 67 68 (1) (7) 66 60 (6) (9%)Tax expenses (21) (20) 1 (5%)Net income 108 45 (63) (58%)
ANALYSIS OF THE CONSOLIDATED STATEMENT OF INCOME
Cons
olid
ated
m
anag
emen
t re
port
Cons
olid
ated
fin
anci
al s
tate
men
ts
BIL | Semi-annual Report 2016 11
Income
Income totalled EUR 250 million at end of June 2016, compared with EUR 318 million at end of June 2015. As already mentioned, this decrease was fueled by the 2015 exceptional items especially at Group Center level.
The slight decrease of the core activities’ operating income (EUR 2 million) is mainly due to the DGS and Resolution funds contributions (“Group Center”) partly offset by the “commercial activities” and “Treasury and Financial Markets” growth (EUR 7 million).
“Commercial activities” were sustained at a suitable level and resisted with a limited decrease of EUR 3 million compared to June 2015 (EUR 13 million including KBL Switzerland contribution for the first half 2015). Income is affected by both pressure on deposits’ margin related to the low long-term interest rates and a fees’ decrease mainly in Wealth Management and Retail Banking. Despite the pressure on margins, net interest income increased by EUR 5 million due to the strong volume growth in term of loans (5.7%) and deposits (6.4%) during the first half 2016. The Assets under Management have increased by 0.8% during the first half of 2016 and 9% compared to June 2015 (EUR 2.9 billion); nevertheless, the fees’ contribution decreased by EUR 7 million compared to June 2015 due to clients’ low level of activity in volatile markets.
“Treasury and Financial Markets” income generated a positive contribution to core operating income, up EUR 10 million as compared to June 2015. All the desks contributed positively to this performance. Assets and Liabilities Management’s income improved by EUR 4 million due to interest margin. Investment Portfolio increased by EUR 3 million due to the nominal outstanding evolution (EUR 6.7 billion versus EUR 5.8 billion). “Treasury and Financial Markets” contributed by EUR 3 million through the active management of the Bank’s liquidity surplus, Forex and Correspondent Banking activities.
“Group Center" activities generated a core operating income of EUR -6 million in June 2016, EUR -9 million compared to June 2015 mainly impacted by the DGS and Resolution funds contributions. Other net income comprises an amount equal to the 2016 contribution to the FGDL minus the write-off of one third of the 2015 provision recognised for future contributions to the FGDL. Indeed, the Bank had recorded a provision of 0.2% of the covered deposits in 2015 in accordance with IAS 37§14 as well as the European directive 2014/49/EU and the Luxembourgish law dated December 18, 2015. The CSSF-CPDI circular 16/01 issued on April 25, 2016, specifies that banks will pay from 2016 to 2018 yearly contributions equal to one third of 0.8% of covered deposits to the FGDL. Therefore, the 2015 provision will be written-off progressively from 2016 to 2018.
Expenses
General expenses totalled EUR 180 million, up 4% compared with June 2015 (EUR 6 million) or 7% limited to the core operating expenses (EUR 11 million excluding the 2015 restructuring costs related to Singapore).
The core operating expenses increased mainly due to BIL Switzerland (EUR 7 million) following the integration of KBL Switzerland in November 2015 and BIL Luxembourg (EUR 4 million) to support the BIL2020 program. Several initiatives have been launched in this context as personal expenditures to reinforce the skills to conduct the strategic program, the new IT strategy (Ignite program) and marketing campaigns (e.g. BIL Select).
Gross operating income
Gross operating income amounted to EUR 70 million, EUR 74 million below the first half of 2015. Non-recurring items contribute EUR 60 million less than last year.
Core gross operating income amounted to EUR 67 million, EUR 13 million below the first half of 2015. DGS and Resolution funds contributions of EUR 12 million in 2016 versus EUR 4 million in 2015 impact negatively the year over year comparison. Corrected for the 2015 contribution of KBL Switzerland (EUR -3 million) and DGS, the 2015 underlying core gross operating income establishes at EUR 81 compared with EUR 79 million at the end of June 2016. The income contraction of EUR 4 million due to the challenging economic environment is to a large extent offset by substantial cost containment efforts (EUR +2 million) limiting the impact of core gross operating income to EUR -2 million compared to 2015.
Cost of risk and impairments
BIL group recorded net provisions on loans and advances for EUR 5 million (EUR 7 million limited for the core operating cost of risk) compared with EUR 15 million in June 2015.
In 2016, specific value adjustments on loans reached EUR 8 million (EUR 12 million in June 2015) in accordance with the Bank’s cautious provisioning policy. A EUR 1 million collective impairment reversal was posted during the first half 2016 (compared to a EUR 3 million allocation in June 2015). Impaired loans as a percentage of total loans outstanding amounted to 2.79% in June 2016 versus 2.95% in December 2015 and 2.94% in June 2015, proving the high quality of the Bank’s assets.
Cons
olid
ated
m
anag
emen
t re
port
Cons
olid
ated
fin
anci
al s
tate
men
ts
12 BIL | Semi-annual Report 2016
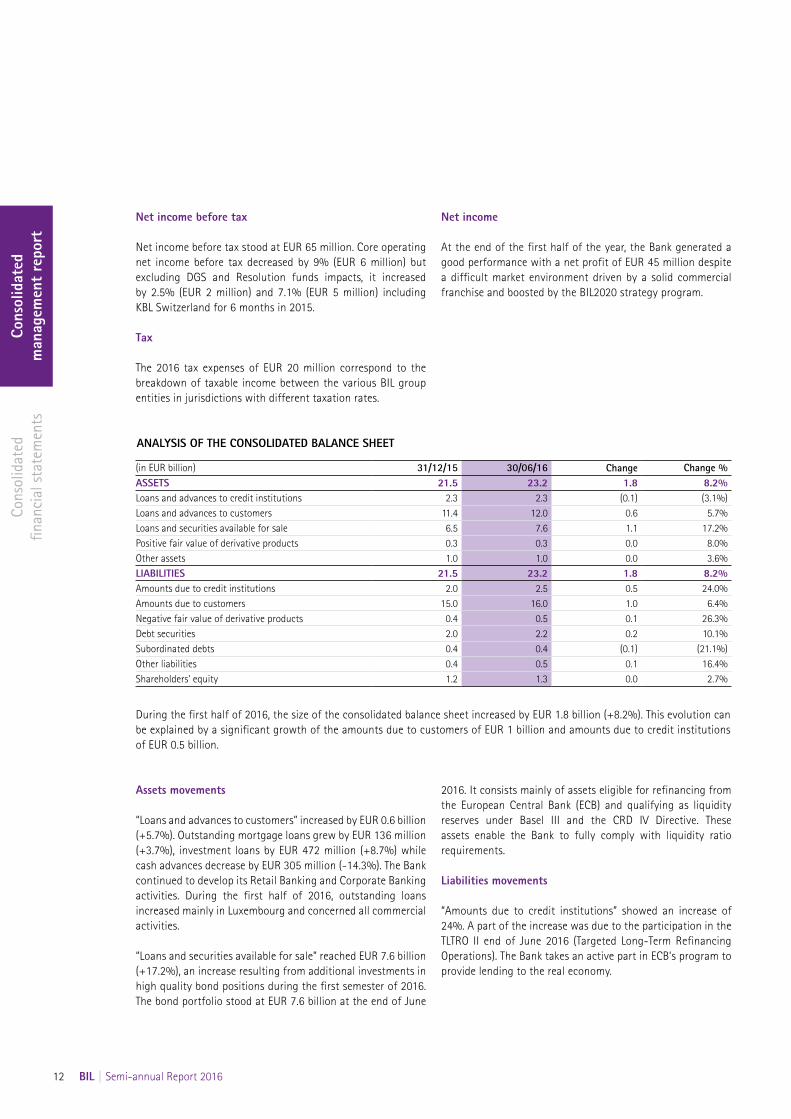
(in EUR billion) 31/12/15 30/06/16 Change Change %ASSETS 21.5 23.2 1.8 8.2%Loans and advances to credit institutions 2.3 2.3 (0.1) (3.1%)Loans and advances to customers 11.4 12.0 0.6 5.7%Loans and securities available for sale 6.5 7.6 1.1 17.2%Positive fair value of derivative products 0.3 0.3 0.0 8.0%Other assets 1.0 1.0 0.0 3.6%LIABILITIES 21.5 23.2 1.8 8.2%Amounts due to credit institutions 2.0 2.5 0.5 24.0%Amounts due to customers 15.0 16.0 1.0 6.4%Negative fair value of derivative products 0.4 0.5 0.1 26.3%Debt securities 2.0 2.2 0.2 10.1%Subordinated debts 0.4 0.4 (0.1) (21.1%)Other liabilities 0.4 0.5 0.1 16.4%Shareholders' equity 1.2 1.3 0.0 2.7%
Net income before tax
Net income before tax stood at EUR 65 million. Core operating net income before tax decreased by 9% (EUR 6 million) but excluding DGS and Resolution funds impacts, it increased by 2.5% (EUR 2 million) and 7.1% (EUR 5 million) including KBL Switzerland for 6 months in 2015.
Tax
The 2016 tax expenses of EUR 20 million correspond to the breakdown of taxable income between the various BIL group entities in jurisdictions with different taxation rates.
Net income
At the end of the first half of the year, the Bank generated a good performance with a net profit of EUR 45 million despite a difficult market environment driven by a solid commercial franchise and boosted by the BIL2020 strategy program.
ANALYSIS OF THE CONSOLIDATED BALANCE SHEET
During the first half of 2016, the size of the consolidated balance sheet increased by EUR 1.8 billion (+8.2%). This evolution can be explained by a significant growth of the amounts due to customers of EUR 1 billion and amounts due to credit institutions of EUR 0.5 billion.
Assets movements
“Loans and advances to customers” increased by EUR 0.6 billion (+5.7%). Outstanding mortgage loans grew by EUR 136 million (+3.7%), investment loans by EUR 472 million (+8.7%) while cash advances decrease by EUR 305 million (-14.3%). The Bank continued to develop its Retail Banking and Corporate Banking activities. During the first half of 2016, outstanding loans increased mainly in Luxembourg and concerned all commercial activities.
“Loans and securities available for sale” reached EUR 7.6 billion (+17.2%), an increase resulting from additional investments in high quality bond positions during the first semester of 2016. The bond portfolio stood at EUR 7.6 billion at the end of June
2016. It consists mainly of assets eligible for refinancing from the European Central Bank (ECB) and qualifying as liquidity reserves under Basel III and the CRD IV Directive. These assets enable the Bank to fully comply with liquidity ratio requirements.
Liabilities movements
“Amounts due to credit institutions” showed an increase of 24%. A part of the increase was due to the participation in the TLTRO II end of June 2016 (Targeted Long-Term Refinancing Operations). The Bank takes an active part in ECB’s program to provide lending to the real economy.
Cons
olid
ated
m
anag
emen
t re
port
Cons
olid
ated
fin
anci
al s
tate
men
ts
BIL | Semi-annual Report 2016 13
“Amounts due to customers” showed a robust increase of EUR 1 billion (+6.4%) mainly represented by a surge of demand deposits (+ EUR 0.7 billion). In an uncertain market environment characterised by high volatility, clients preferred to keep some of their assets as deposits.
“Debt securities” issued under the Euro Medium Term Note (EMTN) program to Institutional, Retail and Wealth Management activities increased by EUR 200 million (+10.1%) as Structured Products offer clients an attractive alternative to short term cash products in a very low short term interest rate environment.
“Subordinated debts” decreased by 21% over December 2015. The Bank issued EUR 50 million on May 2016 which permitted to mitigate maturing debts (EUR 140 million).
“Shareholders’ equity” rose by EUR 33 million (+2.7%). This increase was due to the 2016 net profit of EUR 45 million and EUR 58 million change of the revaluation reserves on assets available for sale. The payment of dividend of EUR 70 million in April 2016 negatively impacted the shareholders’ equity.
3. OutlookDuring the first half of 2016, the Bank continued to successfully implement its corporate strategy intended to take it to 2020, while showing satisfactory financial results. This strategy will continue to guide the Bank with an approach designed to ensure its long term stability and profitability.
The Bank continues to face a challenging economic, financial and regulatory context. The low level of interest rates and the flat yield curve as well as the relatively high level of volatility in financial markets associated with increased costs of regulatory developments have an impact on the Bank’s contemplated profitability development.
The Bank’s business model (combining Retail, Corporate, Wealth Management and Financial Markets activities) is helping to weather these challenging times. We should note that the Bank benefited from having an extremely limited exposure to the British economy and the pound sterling during the strong market volatility brought about by the UK Brexit vote.
Cons
olid
ated
m
anag
emen
t re
port
Cons
olid
ated
fin
anci
al s
tate
men
ts
14 BIL | Semi-annual Report 2016
1. Key events of 2016Corporate structure and risk profile
Since end 2014, important strategic initiatives have been undertaken at a group-wide level, impacting thus naturally BIL group’s corporate structure and risk profile. All those initiatives have been carefully followed by the Bank’s Risk Management department whose main objective is to guide their implementation by ensuring, on an on-going basis, that the related risks are under control and compatible with the institution’s risk appetite.
Main events having impacted the Bank’s risk profile evolution during the first semester of 2016 are described in the management report in section “Business Review and Results”.
Regulatory environment
During the first half of 2016, BIL continued to invest time and resources in making sure that it is and will always be compliant with regulatory standards.
In this context, the Bank has realised several Stress Tests:• Among others, it is important to highlight the following
ones: the Pillar II Stress Tests (also called Capital & Liquidity Planning) which is an essential element of the Internal Capital Adequacy Assessment Process (ICAAP). The aims of those Stress Tests are to assess the risks on the Bank’s solvency, liquidity and profitability;
• The second important ones are the European Central Bank/ Supervisory Review and Evaluation Process (ECB/SREP) Stress Tests. The objectives are to assess the resilience of the Bank to adverse market developments and contribute to the overall SREP ensuring institutions’ capital and liquidity adequacy, as well as sound risk coverage and internal processes.
Moreover, in the context of the Bank Recovery and Resolution Directive (BRRD), BIL has participated to several requests from regulators, including the Single Resolution Board (SRB) data collection in May for resolution planning and determining the Minimum Requirement for own funds and Eligible Liabilities (MREL).
Along with the evolution of the regulatory framework, and especially the Basel IV requirements, BIL has started to assess the expected impacts in order to fully implement the requirements by 2019.
Another important project for the Bank concerns the new IFRS 9 accounting principles. Effectively, the IFRS 9 “Financial Instruments” principles will replace the IAS 39 “Financial Instruments: Recognition and Measurement” from
January 1, 2018. This IFRS 9 sets out the requirements for classifying and measuring financial instruments, introduces a new impairment methodology and defines requirements related to hedge accounting. In this context, the Bank has set up a dedicated project in order to implement all the requirements on time.
Finally, it is also worth mentioning that the Bank has participated to various ad-hoc regulatory exercises among which the Benchmarking Portfolios Exercise or the Quantitative Impact Study (QIS) on the Definition of Default.
2. Credit risk In this report, credit risk exposure is measured using the internal Maximum Credit Risk Exposure (MCRE) metric, which comprises:• The net carrying value of balance sheet assets other than
derivative products (i.e. the carrying value after deduction of specific provisions);
• The mark-to-market valuation of derivative products;• Total off-balance sheet commitments. The total commitment
corresponds to unused lines of liquidity or to the maximum amount that BIL is committed to as a result of guarantees issued to third parties.
Are excluded from the scope of this report, equity exposures, tangible/intangible assets and deferred tax assets.
The substitution principle applies where the credit risk exposure is guaranteed by a third party whose risk weighting is lower. Therefore, counterparts presented hereafter are final counterparts, i.e. after taking into account the eligible guarantees.
As at end June 2016, the Bank’s total credit risk exposure amounted to EUR 24.6 billion, compared to EUR 22.2 billion at the end of 2015. The overall exposure increase is observed on all the segments of the Bank’s portfolio; the main contributors are the Financial Institutions (+ EUR 0.9 billion), the Central Governments (+ EUR 0.5 billion) and the Individual, Small and Medium Enterprises (SME) and Self-Employed (+ EUR 0.4 billion) portfolios.
The tables below illustrate those exposure evolutions, broken down through both counterparty type and geographic axes.
Risk Management
Cons
olid
ated
m
anag
emen
t re
port
Cons
olid
ated
fin
anci
al s
tate
men
ts
BIL | Semi-annual Report 2016 15
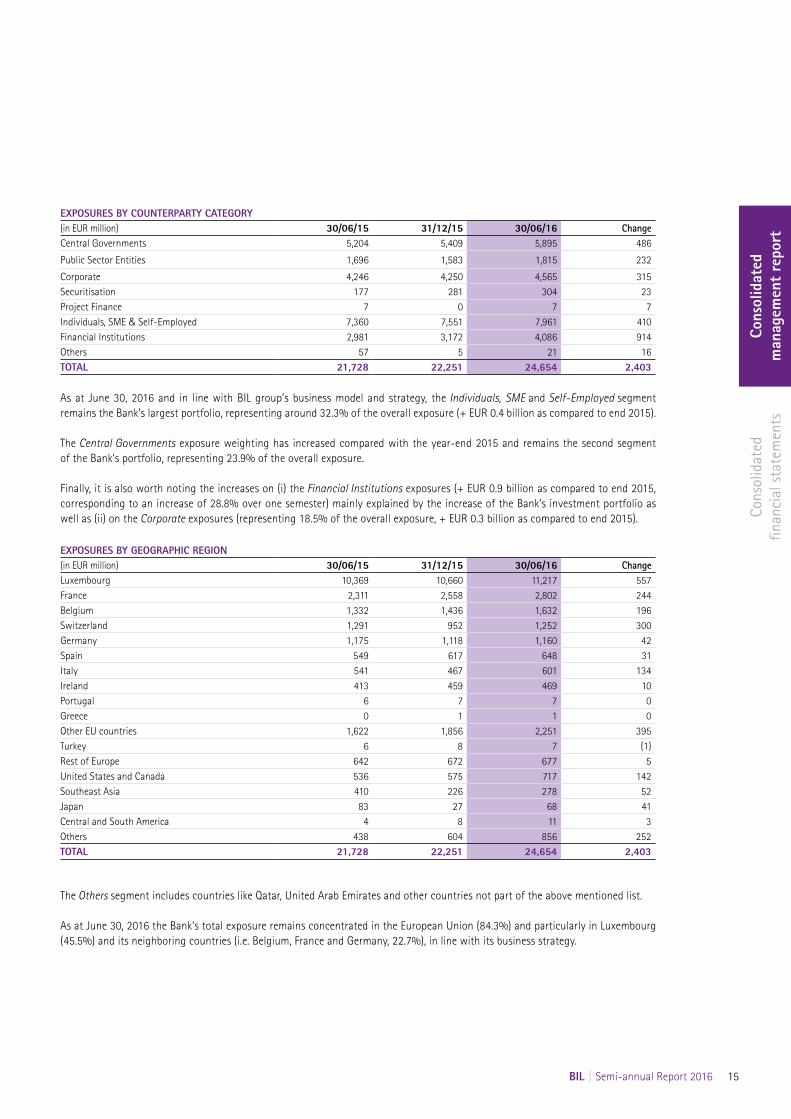
EXPOSURES BY COUNTERPARTY CATEGORY(in EUR million) 30/06/15 31/12/15 30/06/16 ChangeCentral Governments 5,204 5,409 5,895 486
Public Sector Entities 1,696 1,583 1,815 232
Corporate 4,246 4,250 4,565 315Securitisation 177 281 304 23Project Finance 7 0 7 7Individuals, SME & Self-Employed 7,360 7,551 7,961 410Financial Institutions 2,981 3,172 4,086 914Others 57 5 21 16TOTAL 21,728 22,251 24,654 2,403
As at June 30, 2016 and in line with BIL group’s business model and strategy, the Individuals, SME and Self-Employed segment remains the Bank’s largest portfolio, representing around 32.3% of the overall exposure (+ EUR 0.4 billion as compared to end 2015).
The Central Governments exposure weighting has increased compared with the year-end 2015 and remains the second segment of the Bank’s portfolio, representing 23.9% of the overall exposure.
Finally, it is also worth noting the increases on (i) the Financial Institutions exposures (+ EUR 0.9 billion as compared to end 2015, corresponding to an increase of 28.8% over one semester) mainly explained by the increase of the Bank’s investment portfolio as well as (ii) on the Corporate exposures (representing 18.5% of the overall exposure, + EUR 0.3 billion as compared to end 2015).
EXPOSURES BY GEOGRAPHIC REGION(in EUR million) 30/06/15 31/12/15 30/06/16 ChangeLuxembourg 10,369 10,660 11,217 557France 2,311 2,558 2,802 244Belgium 1,332 1,436 1,632 196Switzerland 1,291 952 1,252 300Germany 1,175 1,118 1,160 42Spain 549 617 648 31Italy 541 467 601 134Ireland 413 459 469 10Portugal 6 7 7 0Greece 0 1 1 0Other EU countries 1,622 1,856 2,251 395Turkey 6 8 7 (1)Rest of Europe 642 672 677 5United States and Canada 536 575 717 142Southeast Asia 410 226 278 52Japan 83 27 68 41Central and South America 4 8 11 3Others 438 604 856 252TOTAL 21,728 22,251 24,654 2,403
The Others segment includes countries like Qatar, United Arab Emirates and other countries not part of the above mentioned list.
As at June 30, 2016 the Bank’s total exposure remains concentrated in the European Union (84.3%) and particularly in Luxembourg (45.5%) and its neighboring countries (i.e. Belgium, France and Germany, 22.7%), in line with its business strategy.
Cons
olid
ated
m
anag
emen
t re
port
Cons
olid
ated
fin
anci
al s
tate
men
ts
16 BIL | Semi-annual Report 2016
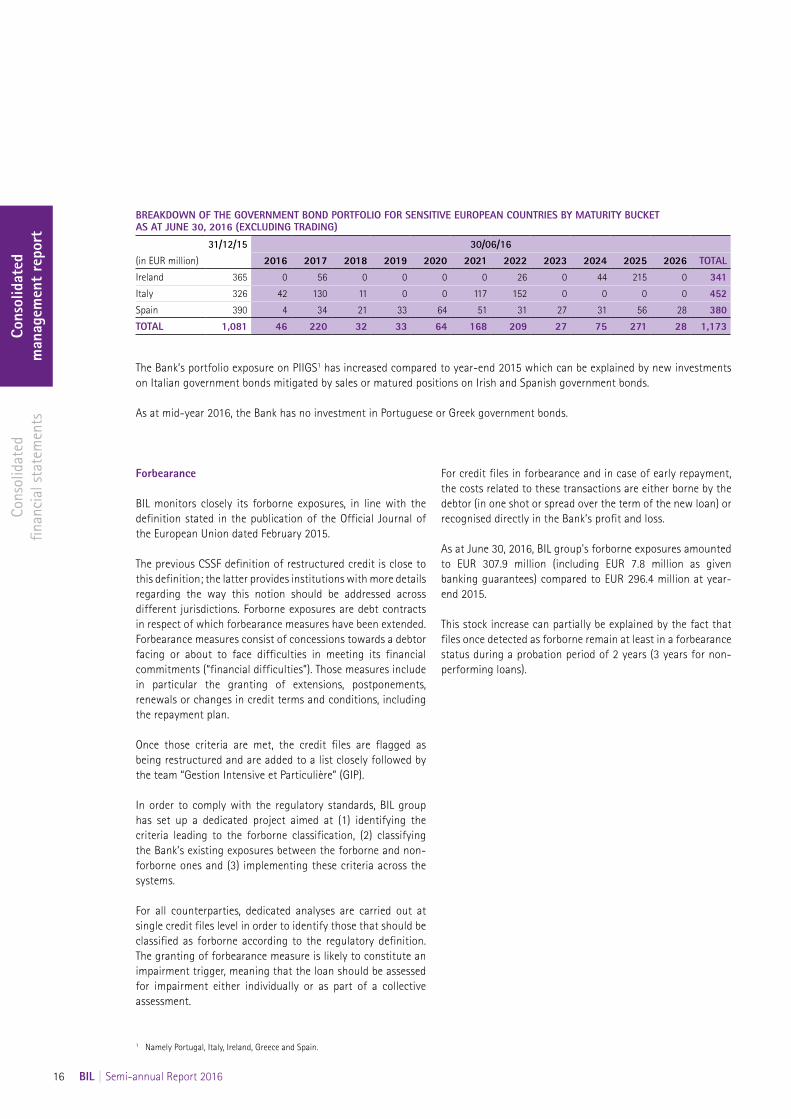
BREAKDOWN OF THE GOVERNMENT BOND PORTFOLIO FOR SENSITIVE EUROPEAN COUNTRIES BY MATURITY BUCKET AS AT JUNE 30, 2016 (EXCLUDING TRADING)
31/12/15 30/06/16(in EUR million) 2016 2017 2018 2019 2020 2021 2022 2023 2024 2025 2026 TOTALIreland 365 0 56 0 0 0 0 26 0 44 215 0 341Italy 326 42 130 11 0 0 117 152 0 0 0 0 452Spain 390 4 34 21 33 64 51 31 27 31 56 28 380TOTAL 1,081 46 220 32 33 64 168 209 27 75 271 28 1,173
The Bank’s portfolio exposure on PIIGS1 has increased compared to year-end 2015 which can be explained by new investments on Italian government bonds mitigated by sales or matured positions on Irish and Spanish government bonds.
As at mid-year 2016, the Bank has no investment in Portuguese or Greek government bonds.
Forbearance
BIL monitors closely its forborne exposures, in line with the definition stated in the publication of the Official Journal of the European Union dated February 2015.
The previous CSSF definition of restructured credit is close to this definition; the latter provides institutions with more details regarding the way this notion should be addressed across different jurisdictions. Forborne exposures are debt contracts in respect of which forbearance measures have been extended. Forbearance measures consist of concessions towards a debtor facing or about to face difficulties in meeting its financial commitments (“financial difficulties”). Those measures include in particular the granting of extensions, postponements, renewals or changes in credit terms and conditions, including the repayment plan.
Once those criteria are met, the credit files are flagged as being restructured and are added to a list closely followed by the team “Gestion Intensive et Particulière” (GIP).
In order to comply with the regulatory standards, BIL group has set up a dedicated project aimed at (1) identifying the criteria leading to the forborne classification, (2) classifying the Bank’s existing exposures between the forborne and non-forborne ones and (3) implementing these criteria across the systems.
For all counterparties, dedicated analyses are carried out at single credit files level in order to identify those that should be classified as forborne according to the regulatory definition. The granting of forbearance measure is likely to constitute an impairment trigger, meaning that the loan should be assessed for impairment either individually or as part of a collective assessment.
For credit files in forbearance and in case of early repayment, the costs related to these transactions are either borne by the debtor (in one shot or spread over the term of the new loan) or recognised directly in the Bank’s profit and loss.
As at June 30, 2016, BIL group's forborne exposures amounted to EUR 307.9 million (including EUR 7.8 million as given banking guarantees) compared to EUR 296.4 million at year-end 2015.
This stock increase can partially be explained by the fact that files once detected as forborne remain at least in a forbearance status during a probation period of 2 years (3 years for non-performing loans).
1 Namely Portugal, Italy, Ireland, Greece and Spain.
Cons
olid
ated
m
anag
emen
t re
port
Cons
olid
ated
fin
anci
al s
tate
men
ts
BIL | Semi-annual Report 2016 17
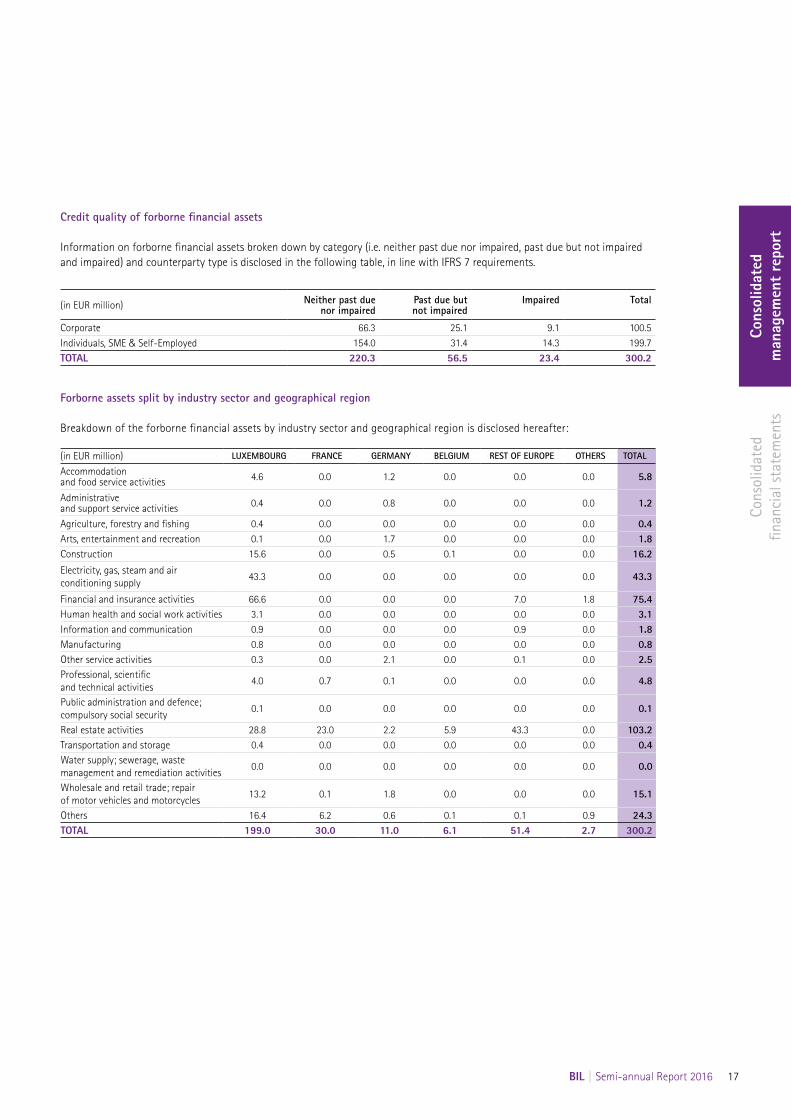
Credit quality of forborne financial assets
Information on forborne financial assets broken down by category (i.e. neither past due nor impaired, past due but not impaired and impaired) and counterparty type is disclosed in the following table, in line with IFRS 7 requirements.
(in EUR million) Neither past due nor impaired
Past due but not impaired
Impaired Total
Corporate 66.3 25.1 9.1 100.5 Individuals, SME & Self-Employed 154.0 31.4 14.3 199.7 TOTAL 220.3 56.5 23.4 300.2
Forborne assets split by industry sector and geographical region
Breakdown of the forborne financial assets by industry sector and geographical region is disclosed hereafter:
(in EUR million) LUXEMBOURG FRANCE GERMANY BELGIUM REST OF EUROPE OTHERS TOTAL
Accommodation and food service activities 4.6 0.0 1.2 0.0 0.0 0.0 5.8
Administrative and support service activities 0.4 0.0 0.8 0.0 0.0 0.0 1.2
Agriculture, forestry and fishing 0.4 0.0 0.0 0.0 0.0 0.0 0.4Arts, entertainment and recreation 0.1 0.0 1.7 0.0 0.0 0.0 1.8Construction 15.6 0.0 0.5 0.1 0.0 0.0 16.2Electricity, gas, steam and air conditioning supply
43.3 0.0 0.0 0.0 0.0 0.0 43.3
Financial and insurance activities 66.6 0.0 0.0 0.0 7.0 1.8 75.4Human health and social work activities 3.1 0.0 0.0 0.0 0.0 0.0 3.1Information and communication 0.9 0.0 0.0 0.0 0.9 0.0 1.8Manufacturing 0.8 0.0 0.0 0.0 0.0 0.0 0.8Other service activities 0.3 0.0 2.1 0.0 0.1 0.0 2.5Professional, scientific and technical activities
4.0 0.7 0.1 0.0 0.0 0.0 4.8
Public administration and defence; compulsory social security
0.1 0.0 0.0 0.0 0.0 0.0 0.1
Real estate activities 28.8 23.0 2.2 5.9 43.3 0.0 103.2Transportation and storage 0.4 0.0 0.0 0.0 0.0 0.0 0.4Water supply; sewerage, waste management and remediation activities
0.0 0.0 0.0 0.0 0.0 0.0 0.0
Wholesale and retail trade; repair of motor vehicles and motorcycles
13.2 0.1 1.8 0.0 0.0 0.0 15.1
Others 16.4 6.2 0.6 0.1 0.1 0.9 24.3TOTAL 199.0 30.0 11.0 6.1 51.4 2.7 300.2
Cons
olid
ated
m
anag
emen
t re
port
Cons
olid
ated
fin
anci
al s
tate
men
ts
18 BIL | Semi-annual Report 2016
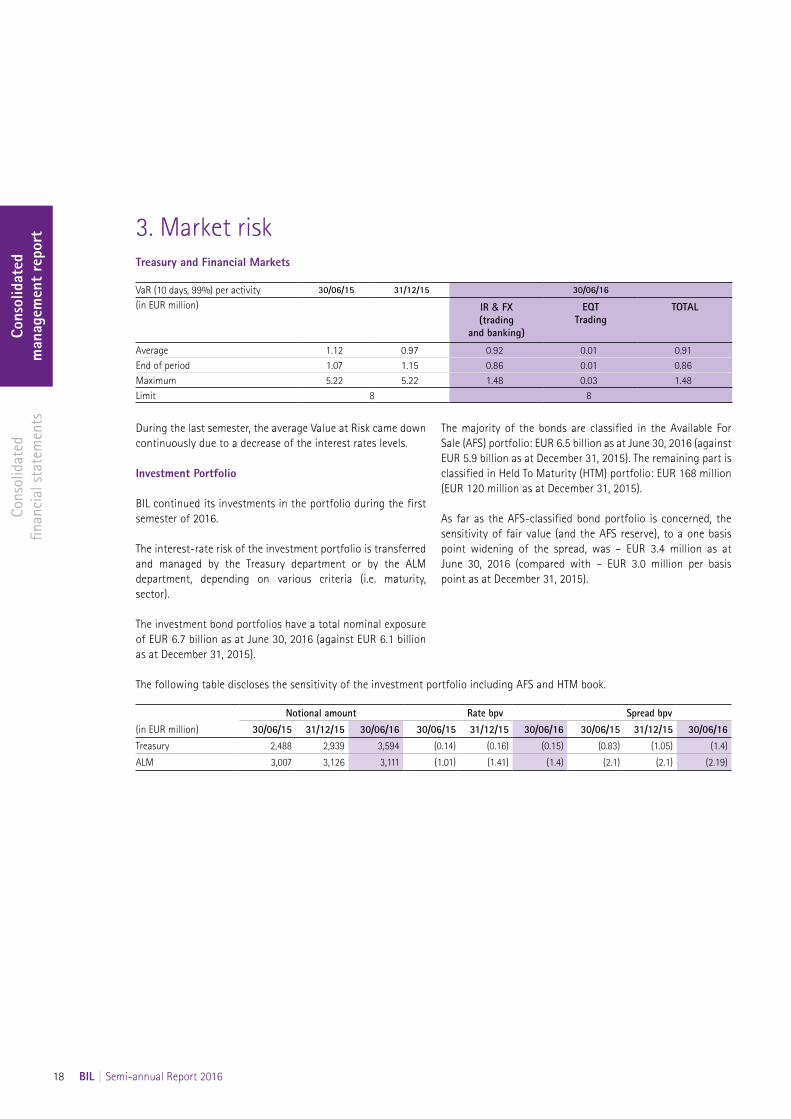
3. Market risk Treasury and Financial Markets
VaR (10 days, 99%) per activity 30/06/15 31/12/15 30/06/16
(in EUR million) IR & FX(trading
and banking)
EQT Trading
TOTAL
Average 1.12 0.97 0.92 0.01 0.91End of period 1.07 1.15 0.86 0.01 0.86Maximum 5.22 5.22 1.48 0.03 1.48Limit 8 8
During the last semester, the average Value at Risk came down continuously due to a decrease of the interest rates levels.
Investment Portfolio
BIL continued its investments in the portfolio during the first semester of 2016.
The interest-rate risk of the investment portfolio is transferred and managed by the Treasury department or by the ALM department, depending on various criteria (i.e. maturity, sector).
The investment bond portfolios have a total nominal exposure of EUR 6.7 billion as at June 30, 2016 (against EUR 6.1 billion as at December 31, 2015).
The majority of the bonds are classified in the Available For Sale (AFS) portfolio: EUR 6.5 billion as at June 30, 2016 (against EUR 5.9 billion as at December 31, 2015). The remaining part is classified in Held To Maturity (HTM) portfolio: EUR 168 million (EUR 120 million as at December 31, 2015).
As far as the AFS-classified bond portfolio is concerned, the sensitivity of fair value (and the AFS reserve), to a one basis point widening of the spread, was – EUR 3.4 million as at June 30, 2016 (compared with – EUR 3.0 million per basis point as at December 31, 2015).
The following table discloses the sensitivity of the investment portfolio including AFS and HTM book.
Notional amount Rate bpv Spread bpv(in EUR million) 30/06/15 31/12/15 30/06/16 30/06/15 31/12/15 30/06/16 30/06/15 31/12/15 30/06/16Treasury 2,488 2,939 3,594 (0.14) (0.16) (0.15) (0.83) (1.05) (1.4)
ALM 3,007 3,126 3,111 (1.01) (1.41) (1.4) (2.1) (2.1) (2.19)
Cons
olid
ated
m
anag
emen
t re
port
Cons
olid
ated
fin
anci
al s
tate
men
ts
BIL | Semi-annual Report 2016 19
1 Percentages calculated on exact numbers.2 Impaired loans as a percentage of total loans outstanding.3 The coverage ratio measures specific provisions recognised for loans and receivables in relation to total outstanding impaired loans
and advances to customers.
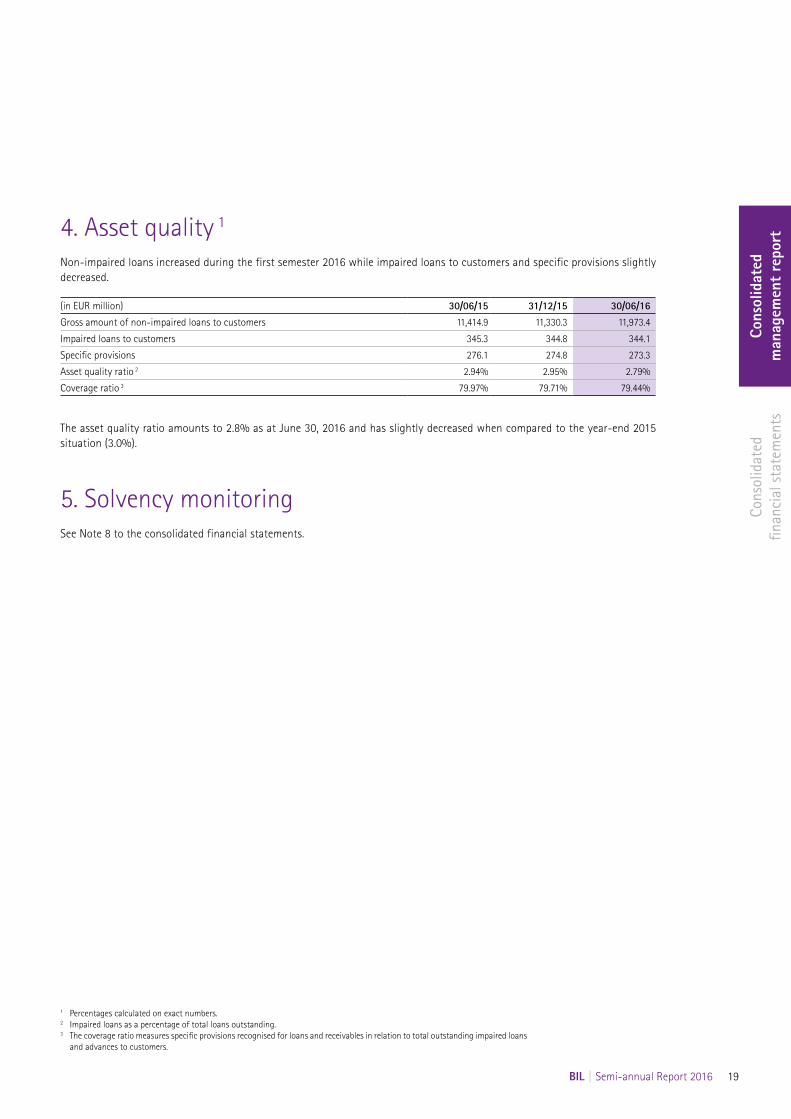
4. Asset quality 1
Non-impaired loans increased during the first semester 2016 while impaired loans to customers and specific provisions slightly decreased.
(in EUR million) 30/06/15 31/12/15 30/06/16Gross amount of non-impaired loans to customers 11,414.9 11,330.3 11,973.4
Impaired loans to customers 345.3 344.8 344.1
Specific provisions 276.1 274.8 273.3
Asset quality ratio 2 2.94% 2.95% 2.79%
Coverage ratio 3 79.97% 79.71% 79.44%
The asset quality ratio amounts to 2.8% as at June 30, 2016 and has slightly decreased when compared to the year-end 2015 situation (3.0%).
5. Solvency monitoring See Note 8 to the consolidated financial statements.

Consolidated financial statements(unaudited)Consolidated balance sheet 22
Consolidated statement of income 24
Consolidated statement of comprehensive income 25
Consolidated statement of changes in equity 26
Consolidated cash flow statement 28
Notes to the consolidated financial statements 29
Cons
olid
ated
m
anag
emen
t rep
ort
Cons
olid
ated
fin
anci
al s
tate
men
ts
22 BIL | Semi-annual Report 2016
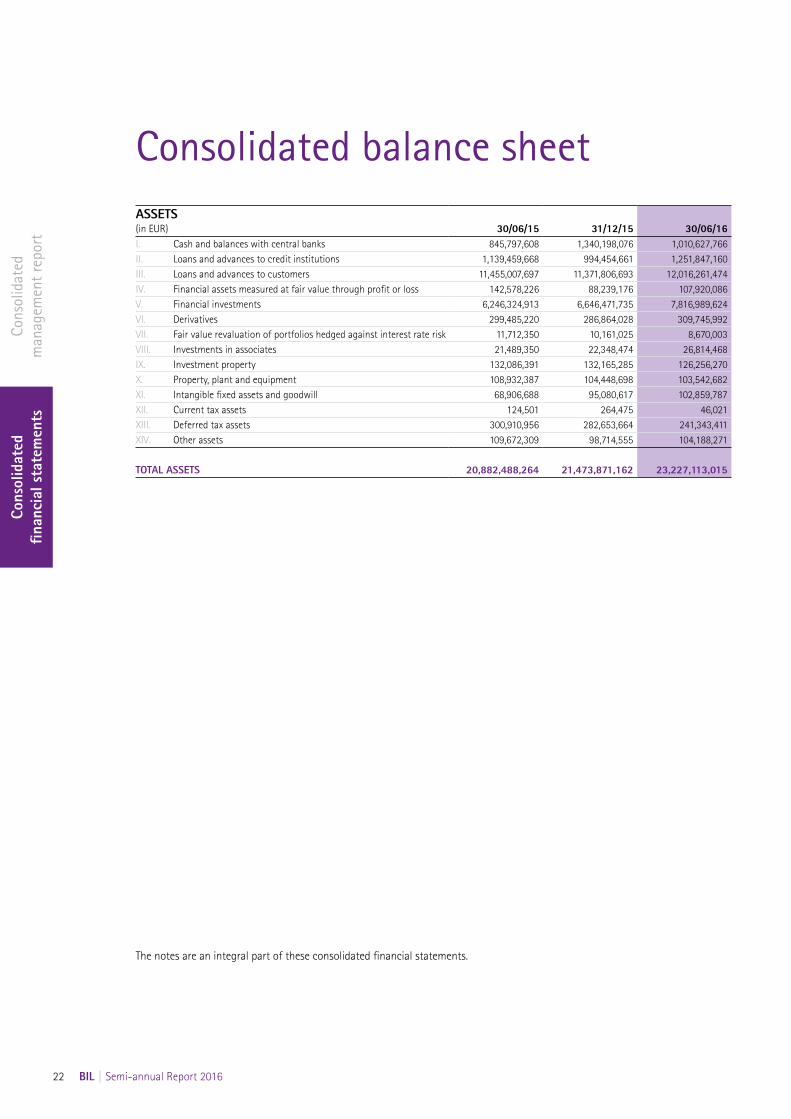
Consolidated balance sheetASSETS(in EUR) 30/06/15 31/12/15 30/06/16I. Cash and balances with central banks 845,797,608 1,340,198,076 1,010,627,766II. Loans and advances to credit institutions 1,139,459,668 994,454,661 1,251,847,160III. Loans and advances to customers 11,455,007,697 11,371,806,693 12,016,261,474IV. Financial assets measured at fair value through profit or loss 142,578,226 88,239,176 107,920,086V. Financial investments 6,246,324,913 6,646,471,735 7,816,989,624VI. Derivatives 299,485,220 286,864,028 309,745,992VII. Fair value revaluation of portfolios hedged against interest rate risk 11,712,350 10,161,025 8,670,003VIII. Investments in associates 21,489,350 22,348,474 26,814,468IX. Investment property 132,086,391 132,165,285 126,256,270X. Property, plant and equipment 108,932,387 104,448,698 103,542,682XI. Intangible fixed assets and goodwill 68,906,688 95,080,617 102,859,787XII. Current tax assets 124,501 264,475 46,021XIII. Deferred tax assets 300,910,956 282,653,664 241,343,411XIV. Other assets 109,672,309 98,714,555 104,188,271
TOTAL ASSETS 20,882,488,264 21,473,871,162 23,227,113,015
The notes are an integral part of these consolidated financial statements.
Cons
olid
ated
m
anag
emen
t rep
ort
Cons
olid
ated
fin
anci
al s
tate
men
ts
BIL | Semi-annual Report 2016 23
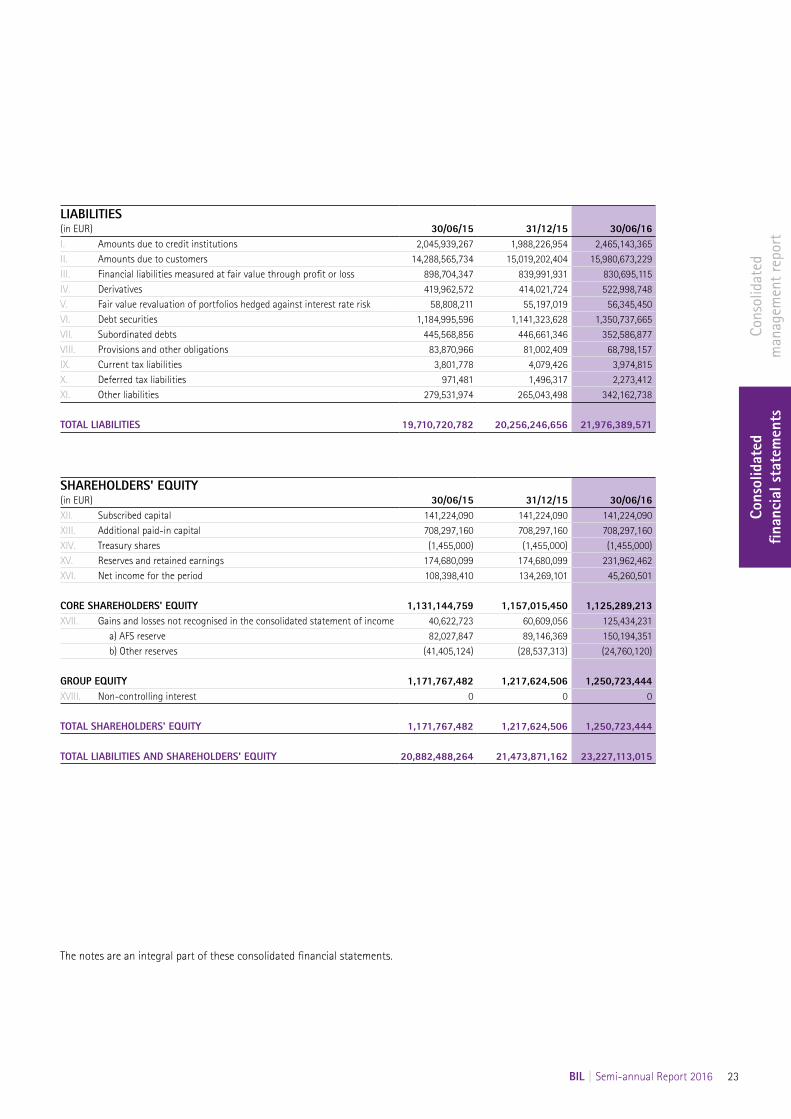
LIABILITIES(in EUR) 30/06/15 31/12/15 30/06/16I. Amounts due to credit institutions 2,045,939,267 1,988,226,954 2,465,143,365II. Amounts due to customers 14,288,565,734 15,019,202,404 15,980,673,229III. Financial liabilities measured at fair value through profit or loss 898,704,347 839,991,931 830,695,115IV. Derivatives 419,962,572 414,021,724 522,998,748V. Fair value revaluation of portfolios hedged against interest rate risk 58,808,211 55,197,019 56,345,450VI. Debt securities 1,184,995,596 1,141,323,628 1,350,737,665VII. Subordinated debts 445,568,856 446,661,346 352,586,877VIII. Provisions and other obligations 83,870,966 81,002,409 68,798,157IX. Current tax liabilities 3,801,778 4,079,426 3,974,815X. Deferred tax liabilities 971,481 1,496,317 2,273,412XI. Other liabilities 279,531,974 265,043,498 342,162,738
TOTAL LIABILITIES 19,710,720,782 20,256,246,656 21,976,389,571
The notes are an integral part of these consolidated financial statements.
SHAREHOLDERS' EQUITY(in EUR) 30/06/15 31/12/15 30/06/16XII. Subscribed capital 141,224,090 141,224,090 141,224,090XIII. Additional paid-in capital 708,297,160 708,297,160 708,297,160XIV. Treasury shares (1,455,000) (1,455,000) (1,455,000)XV. Reserves and retained earnings 174,680,099 174,680,099 231,962,462XVI. Net income for the period 108,398,410 134,269,101 45,260,501
CORE SHAREHOLDERS' EQUITY 1,131,144,759 1,157,015,450 1,125,289,213XVII. Gains and losses not recognised in the consolidated statement of income 40,622,723 60,609,056 125,434,231
a) AFS reserve 82,027,847 89,146,369 150,194,351b) Other reserves (41,405,124) (28,537,313) (24,760,120)
GROUP EQUITY 1,171,767,482 1,217,624,506 1,250,723,444XVIII. Non-controlling interest 0 0 0
TOTAL SHAREHOLDERS' EQUITY 1,171,767,482 1,217,624,506 1,250,723,444
TOTAL LIABILITIES AND SHAREHOLDERS' EQUITY 20,882,488,264 21,473,871,162 23,227,113,015
Cons
olid
ated
m
anag
emen
t rep
ort
Cons
olid
ated
fin
anci
al s
tate
men
ts
24 BIL | Semi-annual Report 2016
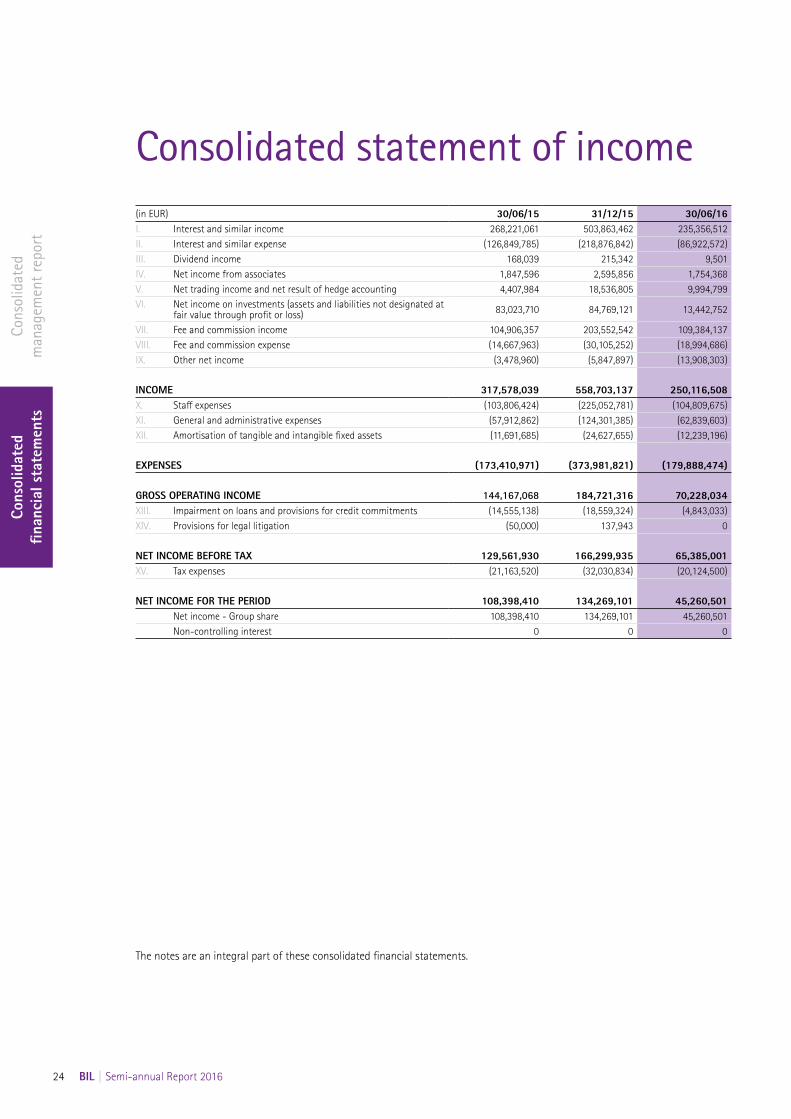
Consolidated statement of income(in EUR) 30/06/15 31/12/15 30/06/16I. Interest and similar income 268,221,061 503,863,462 235,356,512II. Interest and similar expense (126,849,785) (218,876,842) (86,922,572)III. Dividend income 168,039 215,342 9,501IV. Net income from associates 1,847,596 2,595,856 1,754,368V. Net trading income and net result of hedge accounting 4,407,984 18,536,805 9,994,799VI. Net income on investments (assets and liabilities not designated at fair value through profit or loss) 83,023,710 84,769,121 13,442,752
VII. Fee and commission income 104,906,357 203,552,542 109,384,137VIII. Fee and commission expense (14,667,963) (30,105,252) (18,994,686)IX. Other net income (3,478,960) (5,847,897) (13,908,303)
INCOME 317,578,039 558,703,137 250,116,508X. Staff expenses (103,806,424) (225,052,781) (104,809,675)XI. General and administrative expenses (57,912,862) (124,301,385) (62,839,603)XII. Amortisation of tangible and intangible fixed assets (11,691,685) (24,627,655) (12,239,196)
EXPENSES (173,410,971) (373,981,821) (179,888,474)
GROSS OPERATING INCOME 144,167,068 184,721,316 70,228,034XIII. Impairment on loans and provisions for credit commitments (14,555,138) (18,559,324) (4,843,033)XIV. Provisions for legal litigation (50,000) 137,943 0
NET INCOME BEFORE TAX 129,561,930 166,299,935 65,385,001XV. Tax expenses (21,163,520) (32,030,834) (20,124,500)
NET INCOME FOR THE PERIOD 108,398,410 134,269,101 45,260,501 Net income - Group share 108,398,410 134,269,101 45,260,501 Non-controlling interest 0 0 0
The notes are an integral part of these consolidated financial statements.
Cons
olid
ated
m
anag
emen
t rep
ort
Cons
olid
ated
fin
anci
al s
tate
men
ts
BIL | Semi-annual Report 2016 25
(in EUR) 30/06/15 31/12/15 30/06/16
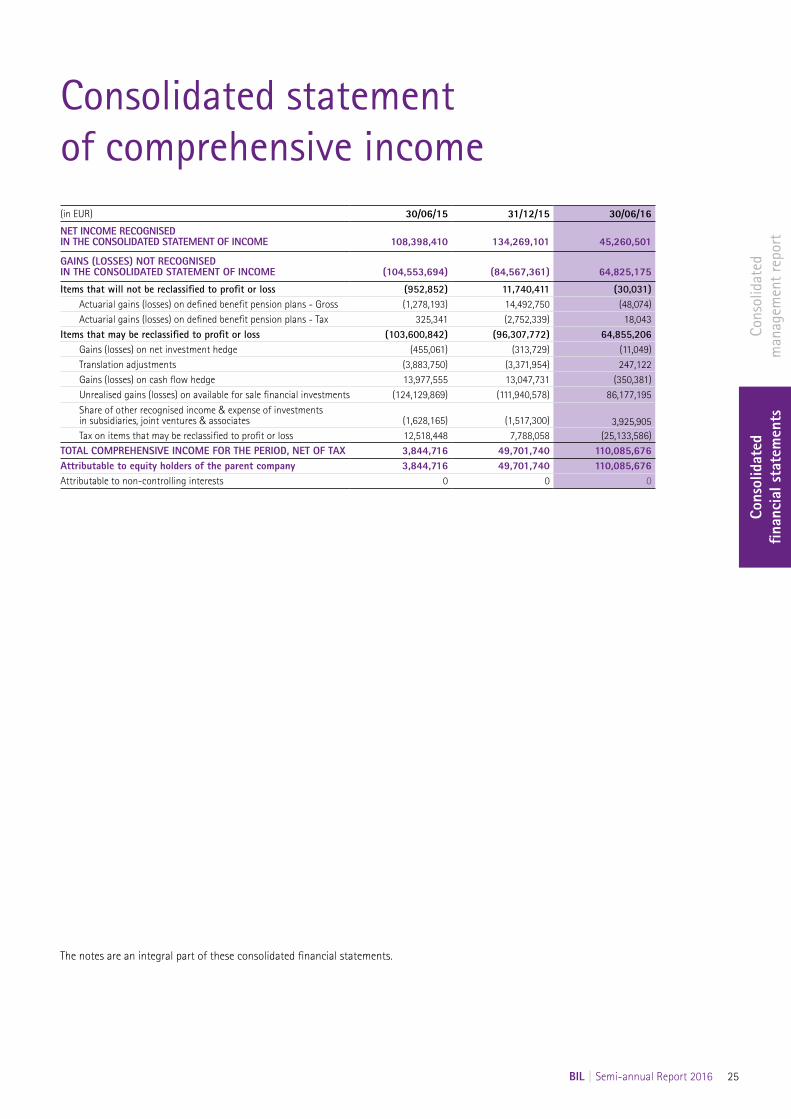
NET INCOME RECOGNISED IN THE CONSOLIDATED STATEMENT OF INCOME 108,398,410 134,269,101 45,260,501
GAINS (LOSSES) NOT RECOGNISED IN THE CONSOLIDATED STATEMENT OF INCOME (104,553,694) (84,567,361) 64,825,175
Items that will not be reclassified to profit or loss (952,852) 11,740,411 (30,031)Actuarial gains (losses) on defined benefit pension plans - Gross (1,278,193) 14,492,750 (48,074)Actuarial gains (losses) on defined benefit pension plans - Tax 325,341 (2,752,339) 18,043
Items that may be reclassified to profit or loss (103,600,842) (96,307,772) 64,855,206Gains (losses) on net investment hedge (455,061) (313,729) (11,049)Translation adjustments (3,883,750) (3,371,954) 247,122Gains (losses) on cash flow hedge 13,977,555 13,047,731 (350,381)Unrealised gains (losses) on available for sale financial investments (124,129,869) (111,940,578) 86,177,195Share of other recognised income & expense of investments in subsidiaries, joint ventures & associates (1,628,165) (1,517,300) 3,925,905Tax on items that may be reclassified to profit or loss 12,518,448 7,788,058 (25,133,586)
TOTAL COMPREHENSIVE INCOME FOR THE PERIOD, NET OF TAX 3,844,716 49,701,740 110,085,676Attributable to equity holders of the parent company 3,844,716 49,701,740 110,085,676Attributable to non-controlling interests 0 0 0
Consolidated statement of comprehensive income
The notes are an integral part of these consolidated financial statements.
Cons
olid
ated
m
anag
emen
t rep
ort
Cons
olid
ated
fin
anci
al s
tate
men
ts
26 BIL | Semi-annual Report 2016
Consolidated statement of changes in equityCORE SHAREHOLDERS' EQUITY, GROUP (in EUR)
Subscribed capital
Additional paid-in capital
Treasury shares
Reserves and retained
earnings
Net income for the period
Core shareholders'
equity
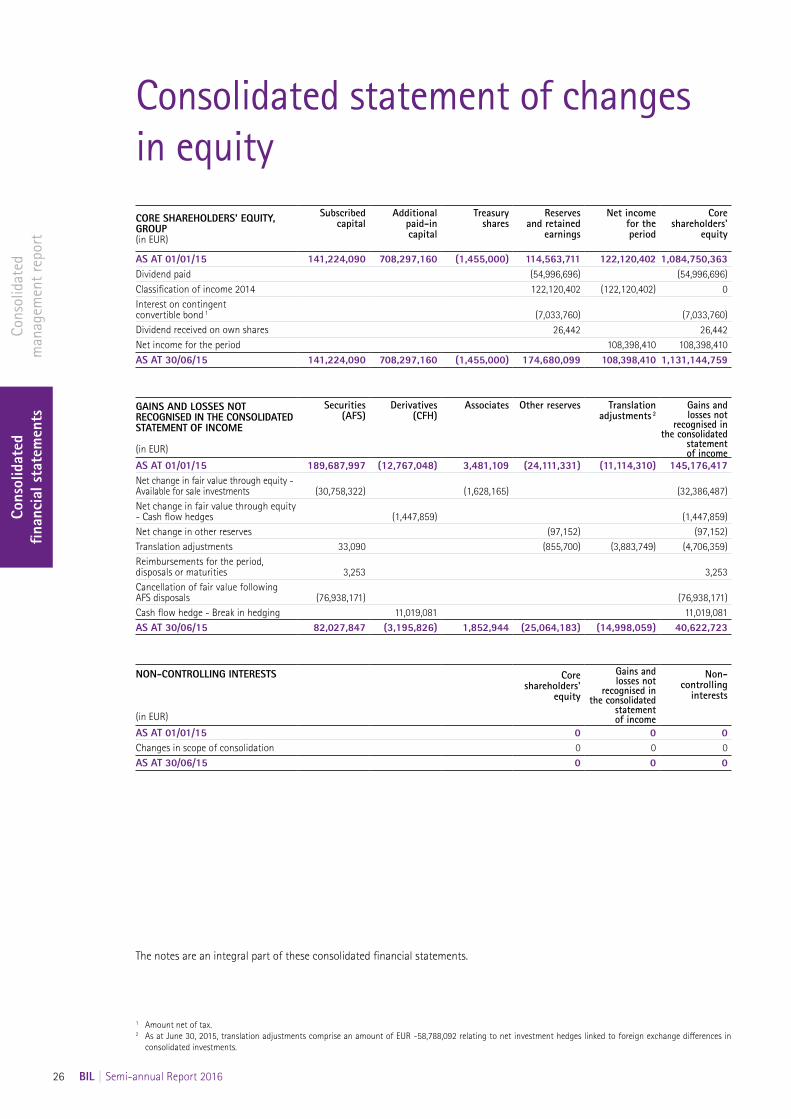
AS AT 01/01/15 141,224,090 708,297,160 (1,455,000) 114,563,711 122,120,402 1,084,750,363Dividend paid (54,996,696) (54,996,696)Classification of income 2014 122,120,402 (122,120,402) 0Interest on contingent convertible bond 1 (7,033,760) (7,033,760)Dividend received on own shares 26,442 26,442Net income for the period 108,398,410 108,398,410AS AT 30/06/15 141,224,090 708,297,160 (1,455,000) 174,680,099 108,398,410 1,131,144,759
GAINS AND LOSSES NOT RECOGNISED IN THE CONSOLIDATED STATEMENT OF INCOME (in EUR)
Securities (AFS)
Derivatives (CFH)
Associates Other reserves Translationadjustments 2
Gains and losses not
recognised in the consolidated
statement of income
AS AT 01/01/15 189,687,997 (12,767,048) 3,481,109 (24,111,331) (11,114,310) 145,176,417Net change in fair value through equity - Available for sale investments (30,758,322) (1,628,165) (32,386,487)Net change in fair value through equity - Cash flow hedges (1,447,859) (1,447,859)Net change in other reserves (97,152) (97,152)Translation adjustments 33,090 (855,700) (3,883,749) (4,706,359)Reimbursements for the period, disposals or maturities 3,253 3,253Cancellation of fair value following AFS disposals (76,938,171) (76,938,171)Cash flow hedge - Break in hedging 11,019,081 11,019,081AS AT 30/06/15 82,027,847 (3,195,826) 1,852,944 (25,064,183) (14,998,059) 40,622,723
NON-CONTROLLING INTERESTS
(in EUR)
Core shareholders'
equity
Gains and losses not
recognised in the consolidated
statement of income
Non-controlling
interests
AS AT 01/01/15 0 0 0Changes in scope of consolidation 0 0 0AS AT 30/06/15 0 0 0
The notes are an integral part of these consolidated financial statements.
1 Amount net of tax.2 As at June 30, 2015, translation adjustments comprise an amount of EUR -58,788,092 relating to net investment hedges linked to foreign exchange differences in
consolidated investments.
Cons
olid
ated
m
anag
emen
t rep
ort
Cons
olid
ated
fin
anci
al s
tate
men
ts
BIL | Semi-annual Report 2016 27
CORE SHAREHOLDERS' EQUITY GROUP
(in EUR)
Subscribed capital
Additional paid-in capital
Treasury shares
Reserves and retained
earnings
Net income for the period
Core shareholders'
equity
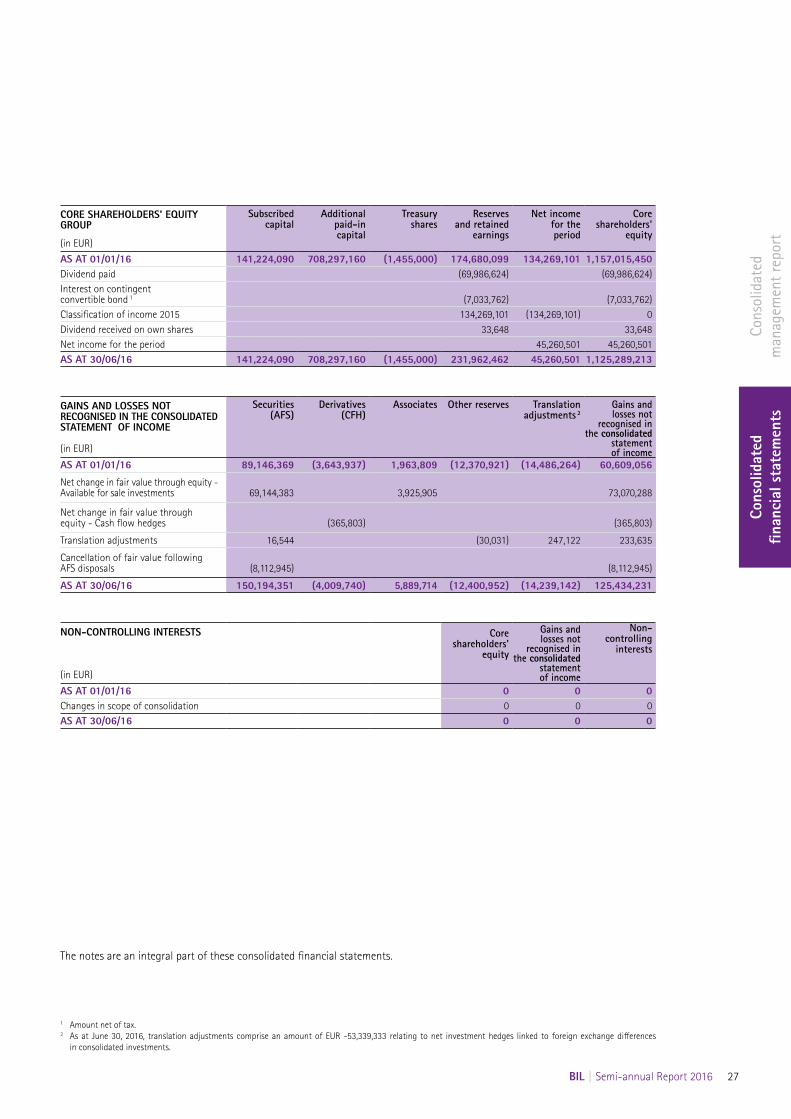
AS AT 01/01/16 141,224,090 708,297,160 (1,455,000) 174,680,099 134,269,101 1,157,015,450Dividend paid (69,986,624) (69,986,624)Interest on contingent convertible bond 1 (7,033,762) (7,033,762)Classification of income 2015 134,269,101 (134,269,101) 0Dividend received on own shares 33,648 33,648Net income for the period 45,260,501 45,260,501AS AT 30/06/16 141,224,090 708,297,160 (1,455,000) 231,962,462 45,260,501 1,125,289,213
GAINS AND LOSSES NOT RECOGNISED IN THE CONSOLIDATED STATEMENT OF INCOME (in EUR)
Securities (AFS)
Derivatives (CFH)
Associates Other reserves Translationadjustments 2
Gains and losses not
recognised in the consolidated
statement of income
AS AT 01/01/16 89,146,369 (3,643,937) 1,963,809 (12,370,921) (14,486,264) 60,609,056
Net change in fair value through equity - Available for sale investments 69,144,383 3,925,905 73,070,288
Net change in fair value through equity - Cash flow hedges (365,803) (365,803)
Translation adjustments 16,544 (30,031) 247,122 233,635
Cancellation of fair value following AFS disposals (8,112,945) (8,112,945)
AS AT 30/06/16 150,194,351 (4,009,740) 5,889,714 (12,400,952) (14,239,142) 125,434,231
NON-CONTROLLING INTERESTS
(in EUR)
Core shareholders'
equity
Gains and losses not
recognised in the consolidated
statement of income
Non-controlling
interests
AS AT 01/01/16 0 0 0Changes in scope of consolidation 0 0 0AS AT 30/06/16 0 0 0
The notes are an integral part of these consolidated financial statements.
1 Amount net of tax.2 As at June 30, 2016, translation adjustments comprise an amount of EUR -53,339,333 relating to net investment hedges linked to foreign exchange differences
in consolidated investments.
Cons
olid
ated
m
anag
emen
t rep
ort
Cons
olid
ated
fin
anci
al s
tate
men
ts
28 BIL | Semi-annual Report 2016
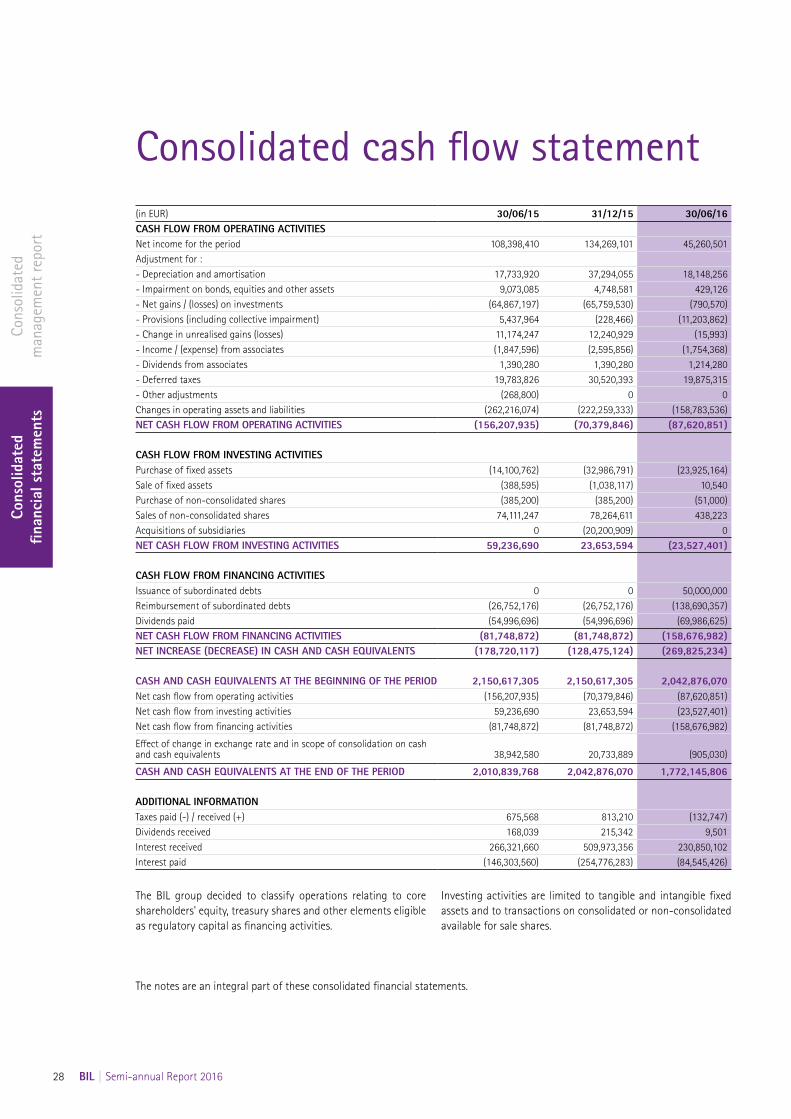
(in EUR) 30/06/15 31/12/15 30/06/16CASH FLOW FROM OPERATING ACTIVITIESNet income for the period 108,398,410 134,269,101 45,260,501Adjustment for :- Depreciation and amortisation 17,733,920 37,294,055 18,148,256- Impairment on bonds, equities and other assets 9,073,085 4,748,581 429,126- Net gains / (losses) on investments (64,867,197) (65,759,530) (790,570)- Provisions (including collective impairment) 5,437,964 (228,466) (11,203,862)- Change in unrealised gains (losses) 11,174,247 12,240,929 (15,993)- Income / (expense) from associates (1,847,596) (2,595,856) (1,754,368)- Dividends from associates 1,390,280 1,390,280 1,214,280- Deferred taxes 19,783,826 30,520,393 19,875,315- Other adjustments (268,800) 0 0Changes in operating assets and liabilities (262,216,074) (222,259,333) (158,783,536)NET CASH FLOW FROM OPERATING ACTIVITIES (156,207,935) (70,379,846) (87,620,851)
CASH FLOW FROM INVESTING ACTIVITIESPurchase of fixed assets (14,100,762) (32,986,791) (23,925,164)Sale of fixed assets (388,595) (1,038,117) 10,540Purchase of non-consolidated shares (385,200) (385,200) (51,000)Sales of non-consolidated shares 74,111,247 78,264,611 438,223Acquisitions of subsidiaries 0 (20,200,909) 0NET CASH FLOW FROM INVESTING ACTIVITIES 59,236,690 23,653,594 (23,527,401)
CASH FLOW FROM FINANCING ACTIVITIESIssuance of subordinated debts 0 0 50,000,000Reimbursement of subordinated debts (26,752,176) (26,752,176) (138,690,357)Dividends paid (54,996,696) (54,996,696) (69,986,625)NET CASH FLOW FROM FINANCING ACTIVITIES (81,748,872) (81,748,872) (158,676,982)NET INCREASE (DECREASE) IN CASH AND CASH EQUIVALENTS (178,720,117) (128,475,124) (269,825,234)
CASH AND CASH EQUIVALENTS AT THE BEGINNING OF THE PERIOD 2,150,617,305 2,150,617,305 2,042,876,070Net cash flow from operating activities (156,207,935) (70,379,846) (87,620,851)Net cash flow from investing activities 59,236,690 23,653,594 (23,527,401)Net cash flow from financing activities (81,748,872) (81,748,872) (158,676,982)
Effect of change in exchange rate and in scope of consolidation on cash and cash equivalents 38,942,580 20,733,889 (905,030)
CASH AND CASH EQUIVALENTS AT THE END OF THE PERIOD 2,010,839,768 2,042,876,070 1,772,145,806
ADDITIONAL INFORMATIONTaxes paid (-) / received (+) 675,568 813,210 (132,747)Dividends received 168,039 215,342 9,501Interest received 266,321,660 509,973,356 230,850,102Interest paid (146,303,560) (254,776,283) (84,545,426)
Consolidated cash flow statement
The BIL group decided to classify operations relating to core shareholders' equity, treasury shares and other elements eligible as regulatory capital as financing activities.
Investing activities are limited to tangible and intangible fixed assets and to transactions on consolidated or non-consolidated available for sale shares.
The notes are an integral part of these consolidated financial statements.

Cons
olid
ated
m
anag
emen
t rep
ort
Cons
olid
ated
fin
anci
al s
tate
men
ts
BIL | Semi-annual Report 2016 29
Notes to the consolidated financial statementsPreliminary note:Presentation of the consolidated financial statements
If the balance of an item is nil for the period under review as well as for the comparative period, this item is not included in the consolidated financial statements. This rule applies to the presentation of the consolidated balance sheet, the consolidated statement of income, the consolidated statement of comprehensive income, the consolidated statement of changes in equity, the consolidated cash flow statement as well as to the notes to the consolidated financial statements.
Note 1Accounting principles and rules of the consolidated financial statements
Note 2Material changes in scope of consolidation from July 1, 2015 to June 30, 2016
Note 3Business reporting
Note 4Subordinated debts and debt securities
Note 5Exchange rates
Note 6Material items in the statement of income
Note 7Post-balance sheet events
Note 8Solvency ratios
Note 9Litigation
Note 10Fair value
Cons
olid
ated
m
anag
emen
t rep
ort
Cons
olid
ated
fin
anci
al s
tate
men
ts
30 BIL | Semi-annual Report 2016
Note 1: Accounting principles and rules of the consolidated financial statementsGENERAL INFORMATION
The parent company of BIL group is Banque Internationale à Luxembourg, a Luxembourg public limited company (hereafter "BIL" or "the Bank"). Its registered office is situated at 69, route d’Esch, L-2953 Luxembourg.
The BIL group is integrated in the consolidated financial statements of Pioneer Holding SA, comprising the largest body of undertakings of which BIL forms part as a subsidiary. The registered office of Pioneer Holding SA is located in Luxembourg at 15, Boulevard Franklin Roosevelt, L-2450 Luxembourg. The BIL group is integrated in the consolidated financial statements of Precision Capital SA, comprising the smallest body of undertakings of which BIL forms part as a subsidiary. The registered office of Precision Capital SA is located in Luxembourg at 15, Boulevard Franklin Roosevelt, L-2450 Luxembourg and its consolidated accounts are available at the same address.
The object of BIL is to undertake all banking and financial operations, for its own account or for the account of third parties, in Luxembourg or abroad – including the establishment of subsidiaries, branches and representative offices – and to carry out all financial, industrial and commercial operations, as well as to take deposits of funds and to hold items of value on deposit. These financial statements were approved for publication by the Management Board which has been mandated by the Board of Directors on August 1, 2016, and signed by Hugues Delcourt, Chairman of the Management Board of the BIL group and Chief Executive Officer.
These consolidated statements cover the period beginning July 1, 2015 and ending June 30, 2016.
NOTES TO THE CONSOLIDATED FINANCIAL STATEMENTS
The principal accounting policies adopted in the preparation of these consolidated financial statements are set out below.
The common used abbreviations below are:• IASB: International Accounting Standards Board• IFRIC: International Financial Reporting Interpretations
Committee• IFRS: International Financial Reporting Standards
1. ACCOUNTING RULES AND METHODS
1.1 Basis of accounting
1.1.1 Statement of compliance
BIL’s consolidated financial statements are prepared in accordance with the IFRS, as adopted by the European Union (EU) and endorsed by the European Commission (EC) up to June 30, 2016.
The consolidated financial statements are prepared on a “going-concern basis” and are presented in euro (EUR) unless otherwise stated.
A summary of the main accounting policies is provided in the annual report as at December 31, 2015.
Since then, no changes in content were made in those accounting policies that had a material impact on the results.
1.1.2 Accounting estimates and judgements
In preparing the consolidated financial statements, management is required to make estimates and assumptions that affect the amounts reported. To make these assumptions and estimates, management uses information available at the date of preparation of the consolidated financial statements and exercises its judgement. While management believes that it has considered all available information in developing these estimates, actual results may differ from the estimates and the differences could be material to the consolidated financial statements.
Judgements are made principally in the following areas:• Classification of financial instruments into the appropriate
category ("loans and receivables", "held to maturity", "available for sale", "held for trading" and "fair value option") for measurement purposes based on the instrument’s characteristics and BIL’s intention;
Cons
olid
ated
m
anag
emen
t rep
ort
Cons
olid
ated
fin
anci
al s
tate
men
ts
BIL | Semi-annual Report 2016 31
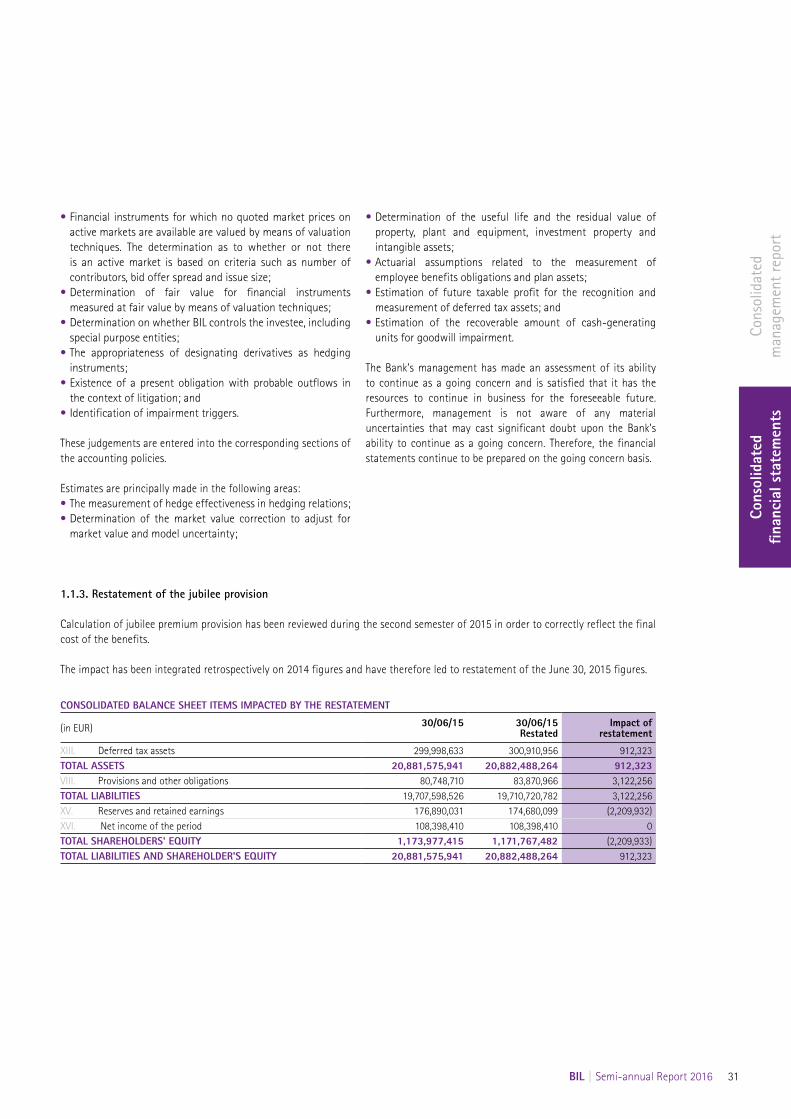
CONSOLIDATED BALANCE SHEET ITEMS IMPACTED BY THE RESTATEMENT
(in EUR) 30/06/15 30/06/15Restated
Impact of restatement
XIII. Deferred tax assets 299,998,633 300,910,956 912,323TOTAL ASSETS 20,881,575,941 20,882,488,264 912,323VIII. Provisions and other obligations 80,748,710 83,870,966 3,122,256TOTAL LIABILITIES 19,707,598,526 19,710,720,782 3,122,256XV. Reserves and retained earnings 176,890,031 174,680,099 (2,209,932)XVI. Net income of the period 108,398,410 108,398,410 0TOTAL SHAREHOLDERS' EQUITY 1,173,977,415 1,171,767,482 (2,209,933)TOTAL LIABILITIES AND SHAREHOLDER'S EQUITY 20,881,575,941 20,882,488,264 912,323
• Financial instruments for which no quoted market prices on active markets are available are valued by means of valuation techniques. The determination as to whether or not there is an active market is based on criteria such as number of contributors, bid offer spread and issue size;
• Determination of fair value for financial instruments measured at fair value by means of valuation techniques;
• Determination on whether BIL controls the investee, including special purpose entities;
• The appropriateness of designating derivatives as hedging instruments;
• Existence of a present obligation with probable outflows in the context of litigation; and
• Identification of impairment triggers.
These judgements are entered into the corresponding sections of the accounting policies.
Estimates are principally made in the following areas:• The measurement of hedge effectiveness in hedging relations;• Determination of the market value correction to adjust for
market value and model uncertainty;
• Determination of the useful life and the residual value of property, plant and equipment, investment property and intangible assets;
• Actuarial assumptions related to the measurement of employee benefits obligations and plan assets;
• Estimation of future taxable profit for the recognition and measurement of deferred tax assets; and
• Estimation of the recoverable amount of cash-generating units for goodwill impairment.
The Bank’s management has made an assessment of its ability to continue as a going concern and is satisfied that it has the resources to continue in business for the foreseeable future. Furthermore, management is not aware of any material uncertainties that may cast significant doubt upon the Bank’s ability to continue as a going concern. Therefore, the financial statements continue to be prepared on the going concern basis.
1.1.3. Restatement of the jubilee provision
Calculation of jubilee premium provision has been reviewed during the second semester of 2015 in order to correctly reflect the final cost of the benefits.
The impact has been integrated retrospectively on 2014 figures and have therefore led to restatement of the June 30, 2015 figures.
Cons
olid
ated
m
anag
emen
t rep
ort
Cons
olid
ated
fin
anci
al s
tate
men
ts
32 BIL | Semi-annual Report 2016
1.2 Changes in accounting policies since the previous annual publication that may impact BIL group
The overview of the texts below is made up to the reporting date of June 30, 2016.
1.2.1 IASB and IFRIC texts endorsed by the European Commission and applied as from January 1, 2016
The following standards, interpretations or amendments have been endorsed by the European Commission and are applied as from January 1, 2016: • IFRS 14, “Regulatory Deferral Accounts” (issued on
January 1, 2014) provides first-time adopters of IFRS with relief from derecognising rate-regulated assets and liabilities until a comprehensive project on accounting for such assets and liabilities is completed by the IASB. No impact on BIL financial reporting.
• Amendments to IFRS 11, “Accounting for Acquisitions of Interests in Joint Operations” (issued on May 6, 2014). No impact on BIL financial reporting.
• Amendment to IAS 16, "Property, plant and equipment" and IAS 38, "Intangible assets", on depreciation and amortisation (issued on May 12, 2014). These amendments provide additional guidance on how the depreciation or amortisation of property, plant and equipment and intangible assets should be calculated. No impact on BIL financial reporting.
• Amendments to IAS 16, "Property, plant and equipment" and IAS 41, "Agriculture" on bearer plants (issued on June 30, 2014). The amendments bring bearer plants, which are used solely to grow produce, into the scope of IAS 16 so that they are accounted for in the same way as property, plant and equipment. No impact on BIL financial reporting.
• Amendments to IAS 27, “Equity Method in Separate Financial Statements” (issued on August 12, 2014). The amendments reinstate the equity method as an accounting option for investments in subsidiaries, joint ventures and associates in an entity's separate financial statements. No impact on BIL financial reporting.
• Annual Improvements to IFRSs 2012–2014 Cycle (issued on September 25, 2014).
• Amendments to IAS 1: Disclosure Initiative (issued on December 18, 2014).
1.2.2 IASB and IFRIC texts endorsed by the European Commission during the current period but not yet applicable as from January 1, 2016
There has been no standard, interpretation or amendment endorsed by the European Commission and not yet applicable as from January 1, 2016.
1.2.3 New IFRS standards, IFRIC interpretations and amendments issued during the current period but not yet endorsed by the European Commission
• IFRS 16, “Leases” (issued on January 13, 2016). IFRS 16 supersedes IAS 17 Leases (and related Interpretations) and is effective from 1 January 2019. IFRS 16 sets out the principles for the recognition, measurement, presentation and disclosure of leases for both parties to a contract, i.e. the customer (‘lessee’) and the supplier (‘lessor’). This new standard could impact the Bank.
• Clarifications to IFRS 15 Revenue from Contracts with Customers (issued on April 12, 2016). IFRS 15 is effective as from January 1, 2018 and establishes the principles that an entity applies when reporting information about the nature, amount, timing and uncertainty of revenue and cash flows from a contract with a customer. The standard could impact the Bank.
• Amendments to IAS 12, “Recognition of Deferred Tax Assets for Unrealised Losses” (issued on January 19, 2016). The amendment is effective as from January 1, 2017 and aims to clarify the recognition of deferred tax assets for unrealised losses related to debt instruments measured at fair value. The amended standard is not expected to have a significant impact of the Bank’s financial statements.
• Amendments to IAS 7, “Disclosure Initiative” (issued on January 29, 2016). The amendments are effective as from January 1, 2017 and are intended to clarify IAS 7 to improve information provided to users of financial statements about an entity's financing activities.
Cons
olid
ated
m
anag
emen
t rep
ort
Cons
olid
ated
fin
anci
al s
tate
men
ts
BIL | Semi-annual Report 2016 33
Note 2: Material changes in scope of consolidation from July 1, 2015 to June 30, 2016
A. Companies consolidated for the first time or no longer consolidated
Companies fully consolidated for the first timePrivagest SA (acquired on November 2, 2015)Red Sky SA (incorporated on December 22, 2015)
Companies no longer fully consolidatedN/A
Companies proportionally consolidated for the first timeN/A
Companies no longer proportionally consolidatedN/A
Companies accounted for by the equity method for the first timeN/A
Companies no longer accounted for by the equity methodN/A
B. Main changes in the Group's interest percentage
N / A
C. Changes in corporate namesN/A
Cons
olid
ated
m
anag
emen
t rep
ort
Cons
olid
ated
fin
anci
al s
tate
men
ts
34 BIL | Semi-annual Report 2016
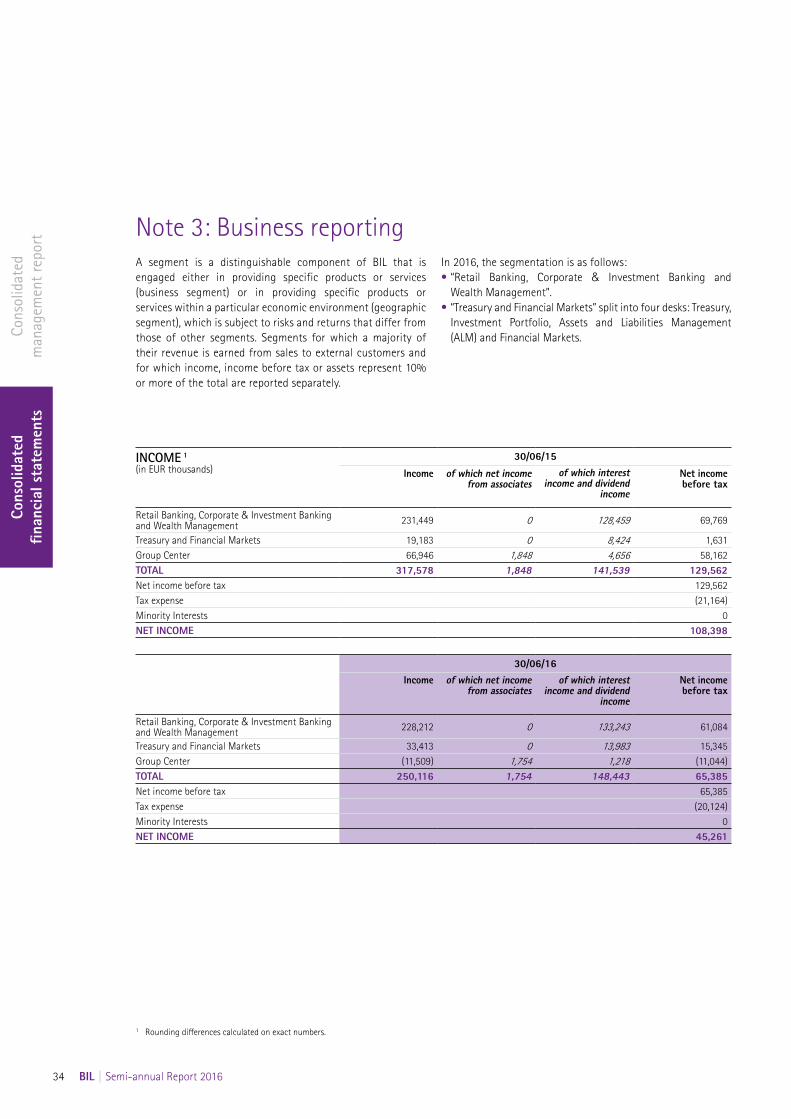
Note 3: Business reportingA segment is a distinguishable component of BIL that is engaged either in providing specific products or services (business segment) or in providing specific products or services within a particular economic environment (geographic segment), which is subject to risks and returns that differ from those of other segments. Segments for which a majority of their revenue is earned from sales to external customers and for which income, income before tax or assets represent 10% or more of the total are reported separately.
In 2016, the segmentation is as follows:• “Retail Banking, Corporate & Investment Banking and
Wealth Management”.• “Treasury and Financial Markets” split into four desks: Treasury,
Investment Portfolio, Assets and Liabilities Management (ALM) and Financial Markets.
INCOME 1 (in EUR thousands)
30/06/15
Income of which net income from associates
of which interest income and dividend
income
Net income before tax
Retail Banking, Corporate & Investment Banking and Wealth Management 231,449 0 128,459 69,769
Treasury and Financial Markets 19,183 0 8,424 1,631Group Center 66,946 1,848 4,656 58,162TOTAL 317,578 1,848 141,539 129,562Net income before tax 129,562Tax expense (21,164)Minority Interests 0NET INCOME 108,398
30/06/16Income of which net income
from associatesof which interest
income and dividend income
Net income before tax
Retail Banking, Corporate & Investment Banking and Wealth Management 228,212 0 133,243 61,084
Treasury and Financial Markets 33,413 0 13,983 15,345Group Center (11,509) 1,754 1,218 (11,044)TOTAL 250,116 1,754 148,443 65,385Net income before tax 65,385Tax expense (20,124)Minority Interests 0NET INCOME 45,261
1 Rounding differences calculated on exact numbers.
Cons
olid
ated
m
anag
emen
t rep
ort
Cons
olid
ated
fin
anci
al s
tate
men
ts
BIL | Semi-annual Report 2016 35
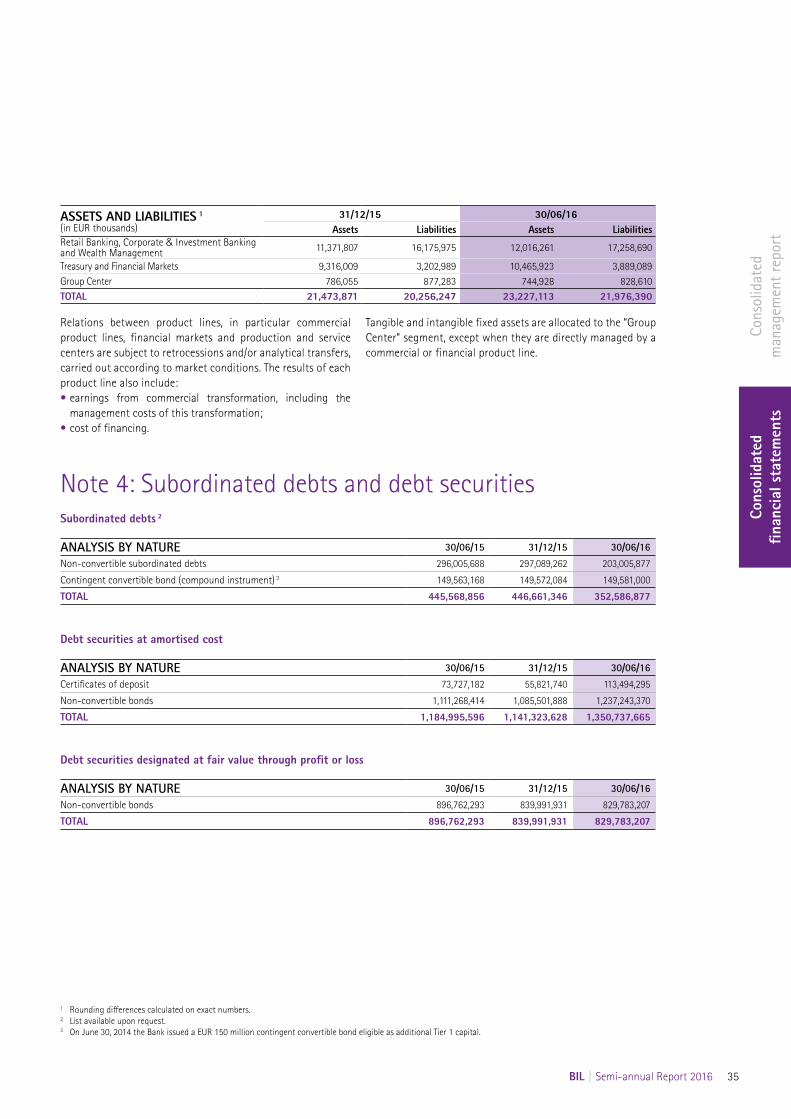
1 Rounding differences calculated on exact numbers.2 List available upon request. 3 On June 30, 2014 the Bank issued a EUR 150 million contingent convertible bond eligible as additional Tier 1 capital.
Relations between product lines, in particular commercial product lines, financial markets and production and service centers are subject to retrocessions and/or analytical transfers, carried out according to market conditions. The results of each product line also include:• earnings from commercial transformation, including the
management costs of this transformation;• cost of financing.
Tangible and intangible fixed assets are allocated to the “Group Center” segment, except when they are directly managed by a commercial or financial product line.
ASSETS AND LIABILITIES 1 (in EUR thousands)
31/12/15 30/06/16Assets Liabilities Assets Liabilities
Retail Banking, Corporate & Investment Banking and Wealth Management 11,371,807 16,175,975 12,016,261 17,258,690
Treasury and Financial Markets 9,316,009 3,202,989 10,465,923 3,889,089Group Center 786,055 877,283 744,928 828,610TOTAL 21,473,871 20,256,247 23,227,113 21,976,390
Note 4: Subordinated debts and debt securitiesSubordinated debts 2
ANALYSIS BY NATURE 30/06/15 31/12/15 30/06/16Non-convertible subordinated debts 296,005,688 297,089,262 203,005,877
Contingent convertible bond (compound instrument) 3 149,563,168 149,572,084 149,581,000
TOTAL 445,568,856 446,661,346 352,586,877
Debt securities at amortised cost
ANALYSIS BY NATURE 30/06/15 31/12/15 30/06/16Certificates of deposit 73,727,182 55,821,740 113,494,295
Non-convertible bonds 1,111,268,414 1,085,501,888 1,237,243,370
TOTAL 1,184,995,596 1,141,323,628 1,350,737,665
Debt securities designated at fair value through profit or loss
ANALYSIS BY NATURE 30/06/15 31/12/15 30/06/16Non-convertible bonds 896,762,293 839,991,931 829,783,207
TOTAL 896,762,293 839,991,931 829,783,207
Cons
olid
ated
m
anag
emen
t rep
ort
Cons
olid
ated
fin
anci
al s
tate
men
ts
36 BIL | Semi-annual Report 2016
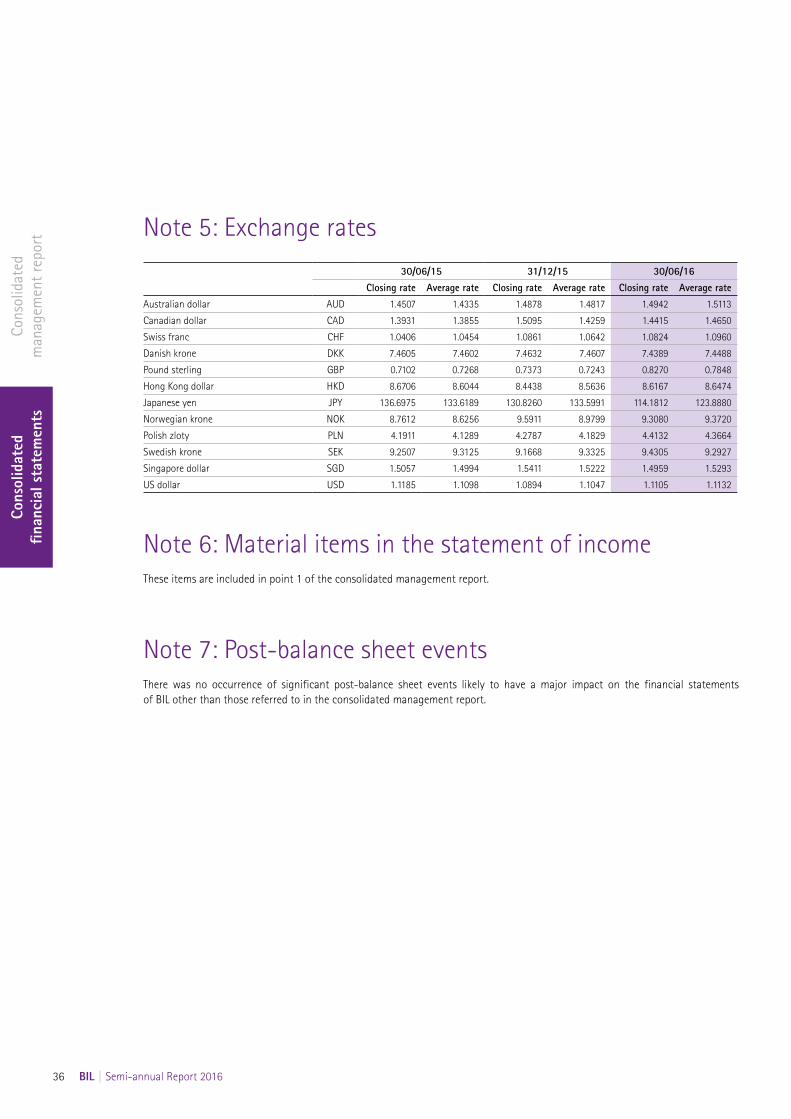
Note 5: Exchange rates30/06/15 31/12/15 30/06/16
Closing rate Average rate Closing rate Average rate Closing rate Average rateAustralian dollar AUD 1.4507 1.4335 1.4878 1.4817 1.4942 1.5113
Canadian dollar CAD 1.3931 1.3855 1.5095 1.4259 1.4415 1.4650
Swiss franc CHF 1.0406 1.0454 1.0861 1.0642 1.0824 1.0960
Danish krone DKK 7.4605 7.4602 7.4632 7.4607 7.4389 7.4488
Pound sterling GBP 0.7102 0.7268 0.7373 0.7243 0.8270 0.7848
Hong Kong dollar HKD 8.6706 8.6044 8.4438 8.5636 8.6167 8.6474
Japanese yen JPY 136.6975 133.6189 130.8260 133.5991 114.1812 123.8880
Norwegian krone NOK 8.7612 8.6256 9.5911 8.9799 9.3080 9.3720
Polish zloty PLN 4.1911 4.1289 4.2787 4.1829 4.4132 4.3664
Swedish krone SEK 9.2507 9.3125 9.1668 9.3325 9.4305 9.2927
Singapore dollar SGD 1.5057 1.4994 1.5411 1.5222 1.4959 1.5293
US dollar USD 1.1185 1.1098 1.0894 1.1047 1.1105 1.1132
Note 6: Material items in the statement of incomeThese items are included in point 1 of the consolidated management report.
Note 7: Post-balance sheet eventsThere was no occurrence of significant post-balance sheet events likely to have a major impact on the financial statements of BIL other than those referred to in the consolidated management report.
Cons
olid
ated
m
anag
emen
t rep
ort
Cons
olid
ated
fin
anci
al s
tate
men
ts
BIL | Semi-annual Report 2016 37
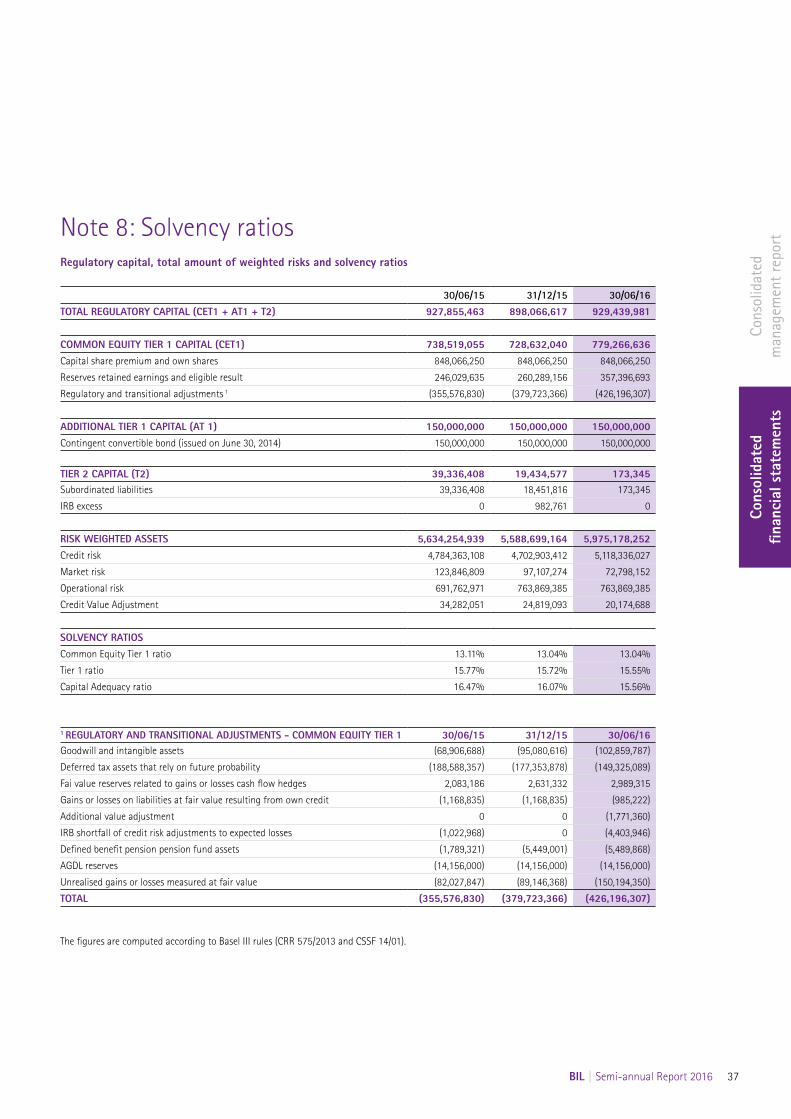
Note 8: Solvency ratiosRegulatory capital, total amount of weighted risks and solvency ratios
30/06/15 31/12/15 30/06/16TOTAL REGULATORY CAPITAL (CET1 + AT1 + T2) 927,855,463 898,066,617 929,439,981
COMMON EQUITY TIER 1 CAPITAL (CET1) 738,519,055 728,632,040 779,266,636Capital share premium and own shares 848,066,250 848,066,250 848,066,250
Reserves retained earnings and eligible result 246,029,635 260,289,156 357,396,693
Regulatory and transitional adjustments 1 (355,576,830) (379,723,366) (426,196,307)
ADDITIONAL TIER 1 CAPITAL (AT 1) 150,000,000 150,000,000 150,000,000Contingent convertible bond (issued on June 30, 2014) 150,000,000 150,000,000 150,000,000
TIER 2 CAPITAL (T2) 39,336,408 19,434,577 173,345Subordinated liabilities 39,336,408 18,451,816 173,345
IRB excess 0 982,761 0
RISK WEIGHTED ASSETS 5,634,254,939 5,588,699,164 5,975,178,252Credit risk 4,784,363,108 4,702,903,412 5,118,336,027
Market risk 123,846,809 97,107,274 72,798,152
Operational risk 691,762,971 763,869,385 763,869,385
Credit Value Adjustment 34,282,051 24,819,093 20,174,688
SOLVENCY RATIOSCommon Equity Tier 1 ratio 13.11% 13.04% 13.04%
Tier 1 ratio 15.77% 15.72% 15.55%
Capital Adequacy ratio 16.47% 16.07% 15.56%
1 REGULATORY AND TRANSITIONAL ADJUSTMENTS - COMMON EQUITY TIER 1 30/06/15 31/12/15 30/06/16Goodwill and intangible assets (68,906,688) (95,080,616) (102,859,787)
Deferred tax assets that rely on future probability (188,588,357) (177,353,878) (149,325,089)
Fai value reserves related to gains or losses cash flow hedges 2,083,186 2,631,332 2,989,315
Gains or losses on liabilities at fair value resulting from own credit (1,168,835) (1,168,835) (985,222)
Additional value adjustment 0 0 (1,771,360)
IRB shortfall of credit risk adjustments to expected losses (1,022,968) 0 (4,403,946)
Defined benefit pension pension fund assets (1,789,321) (5,449,001) (5,489,868)
AGDL reserves (14,156,000) (14,156,000) (14,156,000)
Unrealised gains or losses measured at fair value (82,027,847) (89,146,368) (150,194,350)
TOTAL (355,576,830) (379,723,366) (426,196,307)
The figures are computed according to Basel III rules (CRR 575/2013 and CSSF 14/01).
Cons
olid
ated
m
anag
emen
t rep
ort
Cons
olid
ated
fin
anci
al s
tate
men
ts
38 BIL | Semi-annual Report 2016
Note 9: Litigation9.1 Banque Internationale
à Luxembourg SA and Banque Internationale à Luxembourg (Suisse) SA
Following the bankruptcy of Bernard L. Madoff Investment Securities ("BLMIS"), the official receivers of BLMIS and certain investment funds linked to B. Madoff instituted legal proceedings against numerous financial institutions and institutional investors that had purchased Madoff securities and investment products linked to B. Madoff.
In accordance with the "clawback principle", they are claiming the return of profits and redemptions obtained on these investments over a period of several years until the discovery of the fraudulent set-up put in place by BLMIS that culminated in its collapse. Some of these clawback actions were brought against Banque Internationale à Luxembourg SA and its subsidiary Banque Internationale à Luxembourg (Suisse) SA, the plaintiffs claiming the reimbursement of an amount in principal estimated at approximately USD 68 million, most of which corresponds to investments made by Banque Internationale à Luxembourg SA on behalf of third parties.
At this time, Banque Internationale à Luxembourg SA is not able to express a reasonable opinion on the duration or outcome of actions sub judice or on any potential financial impact.
As at June 30, 2016, no provision for clawback actions had been made. Some clients who invested in products linked to Mr Madoff have also brought legal proceedings against Banque Internationale à Luxembourg SA.
9.2 Banque Internationale à Luxembourg Bank Danmark A/S
A Danish bank, EBH BANK, went bankrupt in the turbulent conditions of the 2008 crisis, and people connected with this bank were charged with fraud and market manipulation as part of transactions involving EBH BANK shares and those of other listed companies.
As part of this case, complaints were lodged with the police by the Danish regulator against Banque Internationale à Luxembourg Bank Danmark A/S ("BIL DK") and one of its traders for aiding EBH BANK in allegedly manipulating the market. This trader and, subsequently, BIL DK, were investigated for this alleged aid. The police investigation is still in progress and is likely to result in BIL DK and its former trader being charged. BIL DK denies any involvement or responsibility in connection with the actions targeted by the investigation.
Effective on December 18, 2013, BIL DK transferred its assets and obligations to a newly created branch of BIL in Denmark. BIL DK will however continue to exist until the foregoing investigation is closed or otherwise terminated; BIL DK has been renamed Selskabet af 18 December 2013 A/S.
The Bank is not involved in any other material litigation, where adequate provisions have not been funded, that readers may need to consider in evaluating the risks related to possible credit risks or current or potential litigation.
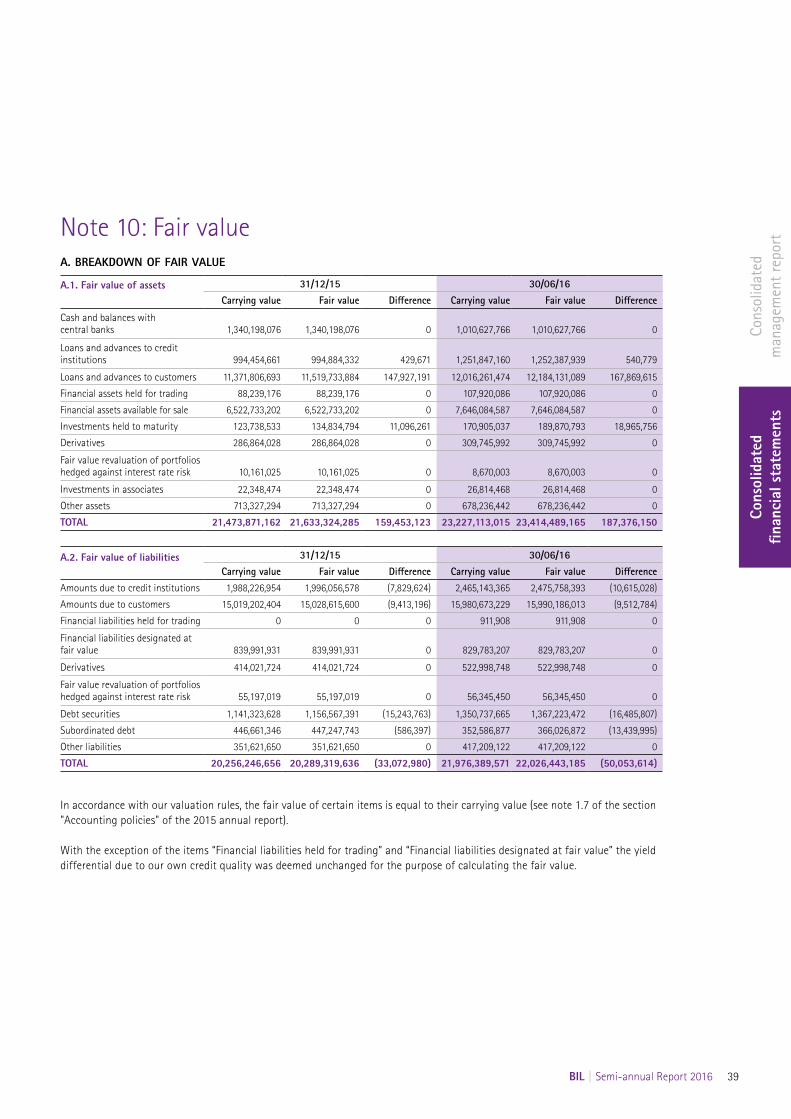
Cons
olid
ated
m
anag
emen
t rep
ort
Cons
olid
ated
fin
anci
al s
tate
men
ts
BIL | Semi-annual Report 2016 39
Note 10: Fair valueA. BREAKDOWN OF FAIR VALUE
A.1. Fair value of assets 31/12/15 30/06/16Carrying value Fair value Difference Carrying value Fair value Difference
Cash and balances with central banks 1,340,198,076 1,340,198,076 0 1,010,627,766 1,010,627,766 0
Loans and advances to credit institutions 994,454,661 994,884,332 429,671 1,251,847,160 1,252,387,939 540,779
Loans and advances to customers 11,371,806,693 11,519,733,884 147,927,191 12,016,261,474 12,184,131,089 167,869,615
Financial assets held for trading 88,239,176 88,239,176 0 107,920,086 107,920,086 0
Financial assets available for sale 6,522,733,202 6,522,733,202 0 7,646,084,587 7,646,084,587 0
Investments held to maturity 123,738,533 134,834,794 11,096,261 170,905,037 189,870,793 18,965,756
Derivatives 286,864,028 286,864,028 0 309,745,992 309,745,992 0
Fair value revaluation of portfolios hedged against interest rate risk 10,161,025 10,161,025 0 8,670,003 8,670,003 0
Investments in associates 22,348,474 22,348,474 0 26,814,468 26,814,468 0
Other assets 713,327,294 713,327,294 0 678,236,442 678,236,442 0
TOTAL 21,473,871,162 21,633,324,285 159,453,123 23,227,113,015 23,414,489,165 187,376,150
A.2. Fair value of liabilities 31/12/15 30/06/16Carrying value Fair value Difference Carrying value Fair value Difference
Amounts due to credit institutions 1,988,226,954 1,996,056,578 (7,829,624) 2,465,143,365 2,475,758,393 (10,615,028)
Amounts due to customers 15,019,202,404 15,028,615,600 (9,413,196) 15,980,673,229 15,990,186,013 (9,512,784)
Financial liabilities held for trading 0 0 0 911,908 911,908 0
Financial liabilities designated at fair value 839,991,931 839,991,931 0 829,783,207 829,783,207 0
Derivatives 414,021,724 414,021,724 0 522,998,748 522,998,748 0
Fair value revaluation of portfolios hedged against interest rate risk 55,197,019 55,197,019 0 56,345,450 56,345,450 0
Debt securities 1,141,323,628 1,156,567,391 (15,243,763) 1,350,737,665 1,367,223,472 (16,485,807)
Subordinated debt 446,661,346 447,247,743 (586,397) 352,586,877 366,026,872 (13,439,995)
Other liabilities 351,621,650 351,621,650 0 417,209,122 417,209,122 0
TOTAL 20,256,246,656 20,289,319,636 (33,072,980) 21,976,389,571 22,026,443,185 (50,053,614)
In accordance with our valuation rules, the fair value of certain items is equal to their carrying value (see note 1.7 of the section "Accounting policies" of the 2015 annual report).
With the exception of the items “Financial liabilities held for trading” and “Financial liabilities designated at fair value” the yield differential due to our own credit quality was deemed unchanged for the purpose of calculating the fair value.
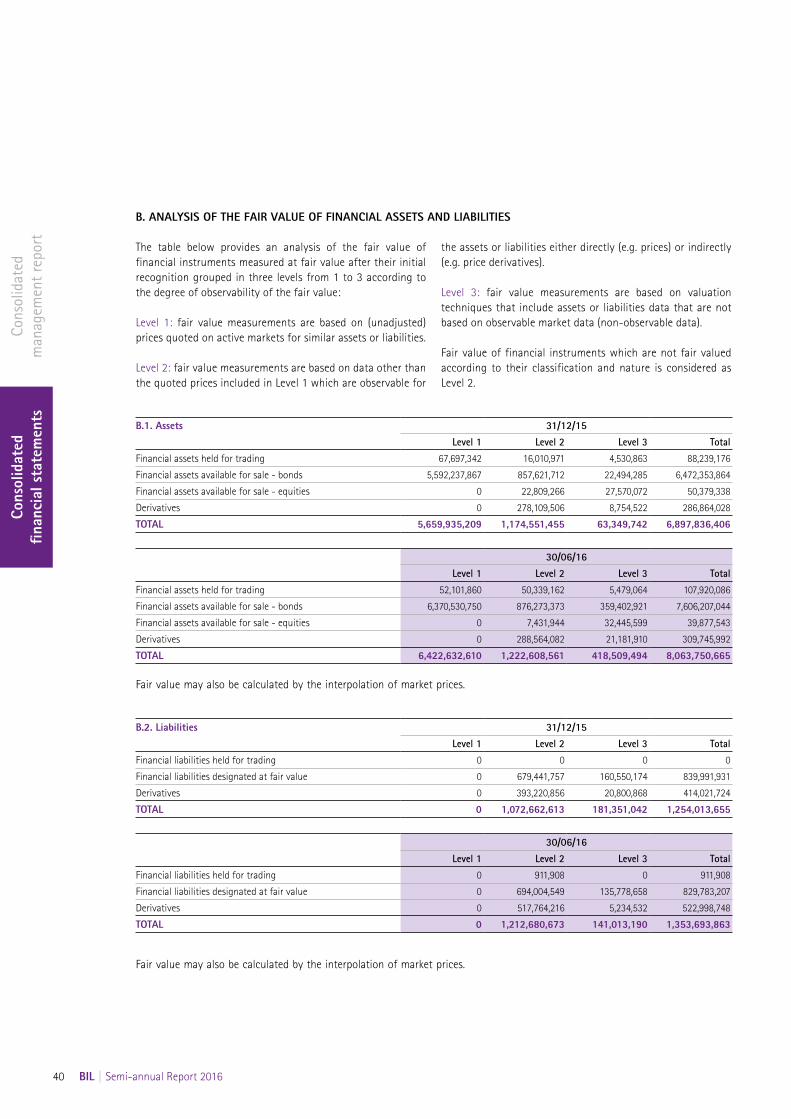
Cons
olid
ated
m
anag
emen
t rep
ort
Cons
olid
ated
fin
anci
al s
tate
men
ts
40 BIL | Semi-annual Report 2016
The table below provides an analysis of the fair value of financial instruments measured at fair value after their initial recognition grouped in three levels from 1 to 3 according to the degree of observability of the fair value:
Level 1: fair value measurements are based on (unadjusted) prices quoted on active markets for similar assets or liabilities.
Level 2: fair value measurements are based on data other than the quoted prices included in Level 1 which are observable for
the assets or liabilities either directly (e.g. prices) or indirectly (e.g. price derivatives).
Level 3: fair value measurements are based on valuation techniques that include assets or liabilities data that are not based on observable market data (non-observable data).
Fair value of financial instruments which are not fair valued according to their classification and nature is considered as Level 2.
B. ANALYSIS OF THE FAIR VALUE OF FINANCIAL ASSETS AND LIABILITIES
B.1. Assets 31/12/15Level 1 Level 2 Level 3 Total
Financial assets held for trading 67,697,342 16,010,971 4,530,863 88,239,176
Financial assets available for sale - bonds 5,592,237,867 857,621,712 22,494,285 6,472,353,864
Financial assets available for sale - equities 0 22,809,266 27,570,072 50,379,338
Derivatives 0 278,109,506 8,754,522 286,864,028
TOTAL 5,659,935,209 1,174,551,455 63,349,742 6,897,836,406
30/06/16Level 1 Level 2 Level 3 Total
Financial assets held for trading 52,101,860 50,339,162 5,479,064 107,920,086
Financial assets available for sale - bonds 6,370,530,750 876,273,373 359,402,921 7,606,207,044
Financial assets available for sale - equities 0 7,431,944 32,445,599 39,877,543
Derivatives 0 288,564,082 21,181,910 309,745,992
TOTAL 6,422,632,610 1,222,608,561 418,509,494 8,063,750,665
Fair value may also be calculated by the interpolation of market prices.
B.2. Liabilities 31/12/15Level 1 Level 2 Level 3 Total
Financial liabilities held for trading 0 0 0 0
Financial liabilities designated at fair value 0 679,441,757 160,550,174 839,991,931
Derivatives 0 393,220,856 20,800,868 414,021,724
TOTAL 0 1,072,662,613 181,351,042 1,254,013,655
30/06/16Level 1 Level 2 Level 3 Total
Financial liabilities held for trading 0 911,908 0 911,908
Financial liabilities designated at fair value 0 694,004,549 135,778,658 829,783,207
Derivatives 0 517,764,216 5,234,532 522,998,748
TOTAL 0 1,212,680,673 141,013,190 1,353,693,863
Fair value may also be calculated by the interpolation of market prices.
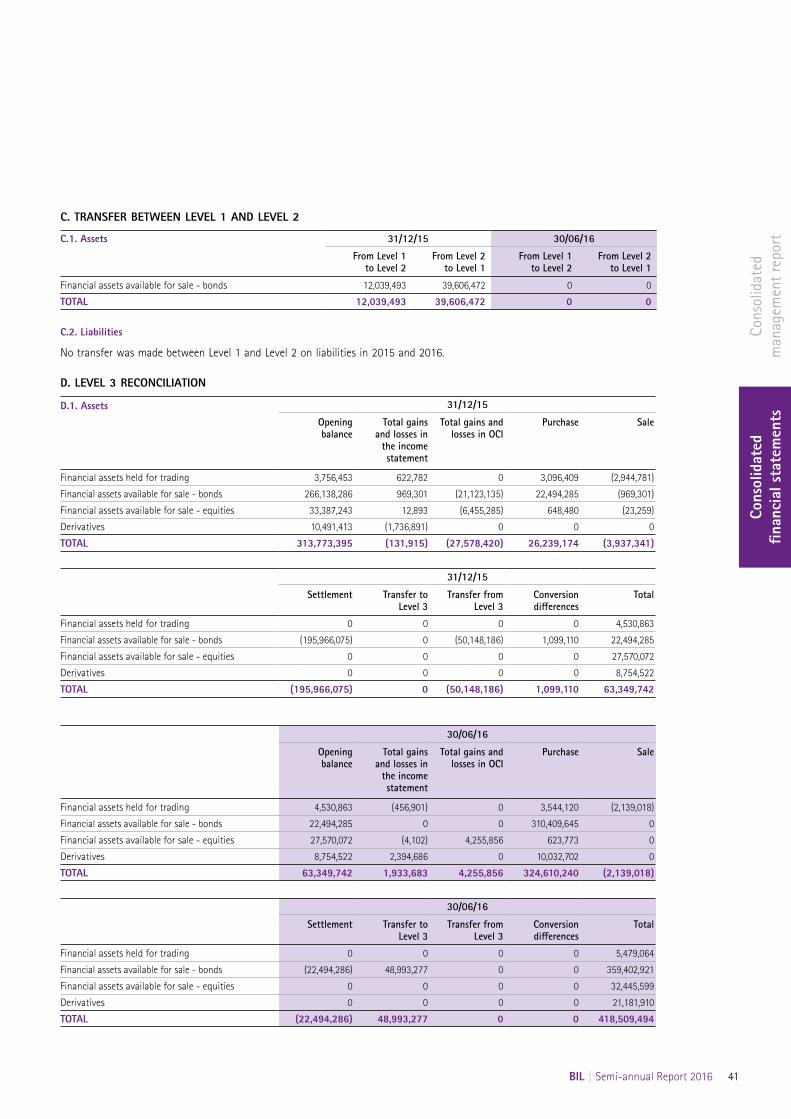
Cons
olid
ated
m
anag
emen
t rep
ort
Cons
olid
ated
fin
anci
al s
tate
men
ts
BIL | Semi-annual Report 2016 41
C. TRANSFER BETWEEN LEVEL 1 AND LEVEL 2
C.1. Assets 31/12/15 30/06/16
From Level 1 to Level 2
From Level 2 to Level 1
From Level 1 to Level 2
From Level 2 to Level 1
Financial assets available for sale - bonds 12,039,493 39,606,472 0 0
TOTAL 12,039,493 39,606,472 0 0
C.2. Liabilities
No transfer was made between Level 1 and Level 2 on liabilities in 2015 and 2016.
D. LEVEL 3 RECONCILIATION
D.1. Assets 31/12/15
Opening balance
Total gains and losses in
the income statement
Total gains and losses in OCI
Purchase Sale
Financial assets held for trading 3,756,453 622,782 0 3,096,409 (2,944,781)
Financial assets available for sale - bonds 266,138,286 969,301 (21,123,135) 22,494,285 (969,301)
Financial assets available for sale - equities 33,387,243 12,893 (6,455,285) 648,480 (23,259)
Derivatives 10,491,413 (1,736,891) 0 0 0
TOTAL 313,773,395 (131,915) (27,578,420) 26,239,174 (3,937,341)
31/12/15
Settlement Transfer to Level 3
Transfer from Level 3
Conversion differences
Total
Financial assets held for trading 0 0 0 0 4,530,863
Financial assets available for sale - bonds (195,966,075) 0 (50,148,186) 1,099,110 22,494,285
Financial assets available for sale - equities 0 0 0 0 27,570,072
Derivatives 0 0 0 0 8,754,522
TOTAL (195,966,075) 0 (50,148,186) 1,099,110 63,349,742
30/06/16
Opening balance
Total gains and losses in
the income statement
Total gains and losses in OCI
Purchase Sale
Financial assets held for trading 4,530,863 (456,901) 0 3,544,120 (2,139,018)
Financial assets available for sale - bonds 22,494,285 0 0 310,409,645 0
Financial assets available for sale - equities 27,570,072 (4,102) 4,255,856 623,773 0
Derivatives 8,754,522 2,394,686 0 10,032,702 0
TOTAL 63,349,742 1,933,683 4,255,856 324,610,240 (2,139,018)
30/06/16
Settlement Transfer to Level 3
Transfer from Level 3
Conversion differences
Total
Financial assets held for trading 0 0 0 0 5,479,064
Financial assets available for sale - bonds (22,494,286) 48,993,277 0 0 359,402,921
Financial assets available for sale - equities 0 0 0 0 32,445,599
Derivatives 0 0 0 0 21,181,910
TOTAL (22,494,286) 48,993,277 0 0 418,509,494
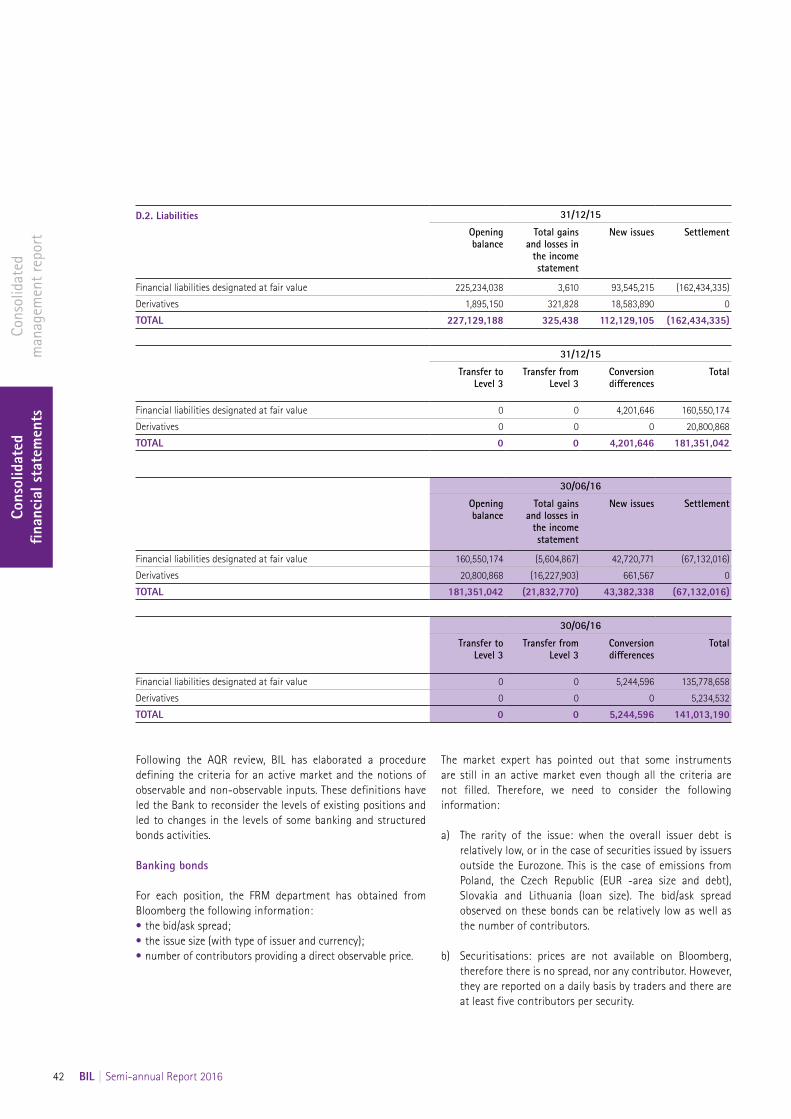
Cons
olid
ated
m
anag
emen
t rep
ort
Cons
olid
ated
fin
anci
al s
tate
men
ts
42 BIL | Semi-annual Report 2016
D.2. Liabilities 31/12/15
Opening balance
Total gains and losses in
the income statement
New issues Settlement
Financial liabilities designated at fair value 225,234,038 3,610 93,545,215 (162,434,335)
Derivatives 1,895,150 321,828 18,583,890 0
TOTAL 227,129,188 325,438 112,129,105 (162,434,335)
31/12/15
Transfer to Level 3
Transfer from Level 3
Conversion differences
Total
Financial liabilities designated at fair value 0 0 4,201,646 160,550,174
Derivatives 0 0 0 20,800,868
TOTAL 0 0 4,201,646 181,351,042
30/06/16
Opening balance
Total gains and losses in
the income statement
New issues Settlement
Financial liabilities designated at fair value 160,550,174 (5,604,867) 42,720,771 (67,132,016)
Derivatives 20,800,868 (16,227,903) 661,567 0
TOTAL 181,351,042 (21,832,770) 43,382,338 (67,132,016)
30/06/16
Transfer to Level 3
Transfer from Level 3
Conversion differences
Total
Financial liabilities designated at fair value 0 0 5,244,596 135,778,658
Derivatives 0 0 0 5,234,532
TOTAL 0 0 5,244,596 141,013,190
Following the AQR review, BIL has elaborated a procedure defining the criteria for an active market and the notions of observable and non-observable inputs. These definitions have led the Bank to reconsider the levels of existing positions and led to changes in the levels of some banking and structured bonds activities.
Banking bonds
For each position, the FRM department has obtained from Bloomberg the following information:• the bid/ask spread;• the issue size (with type of issuer and currency);• number of contributors providing a direct observable price.
The market expert has pointed out that some instruments are still in an active market even though all the criteria are not filled. Therefore, we need to consider the following information:
a) The rarity of the issue: when the overall issuer debt is relatively low, or in the case of securities issued by issuers outside the Eurozone. This is the case of emissions from Poland, the Czech Republic (EUR -area size and debt), Slovakia and Lithuania (loan size). The bid/ask spread observed on these bonds can be relatively low as well as the number of contributors.
b) Securitisations: prices are not available on Bloomberg, therefore there is no spread, nor any contributor. However, they are reported on a daily basis by traders and there are at least five contributors per security.
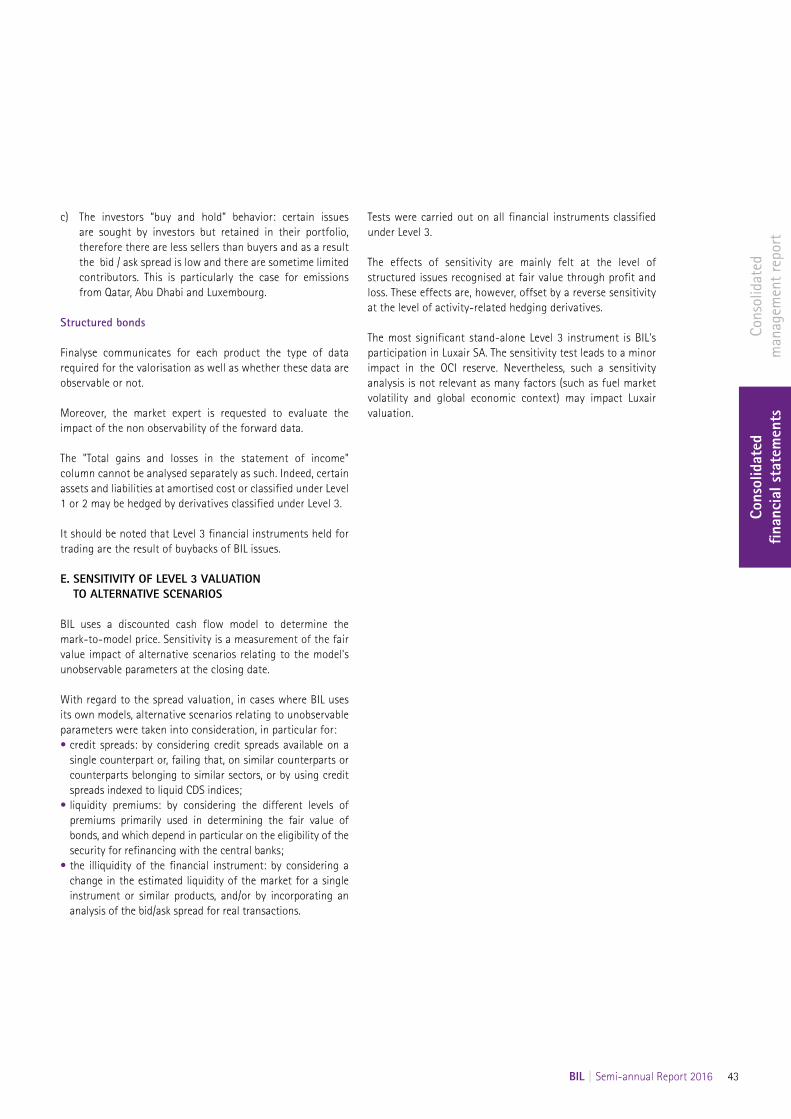
Cons
olid
ated
m
anag
emen
t rep
ort
Cons
olid
ated
fin
anci
al s
tate
men
ts
BIL | Semi-annual Report 2016 43
c) The investors “buy and hold” behavior: certain issues are sought by investors but retained in their portfolio, therefore there are less sellers than buyers and as a result the bid / ask spread is low and there are sometime limited contributors. This is particularly the case for emissions from Qatar, Abu Dhabi and Luxembourg.
Structured bonds
Finalyse communicates for each product the type of data required for the valorisation as well as whether these data are observable or not.
Moreover, the market expert is requested to evaluate the impact of the non observability of the forward data.
The "Total gains and losses in the statement of income" column cannot be analysed separately as such. Indeed, certain assets and liabilities at amortised cost or classified under Level 1 or 2 may be hedged by derivatives classified under Level 3.
It should be noted that Level 3 financial instruments held for trading are the result of buybacks of BIL issues.
E. SENSITIVITY OF LEVEL 3 VALUATION TO ALTERNATIVE SCENARIOS
BIL uses a discounted cash flow model to determine the mark-to-model price. Sensitivity is a measurement of the fair value impact of alternative scenarios relating to the model's unobservable parameters at the closing date.
With regard to the spread valuation, in cases where BIL uses its own models, alternative scenarios relating to unobservable parameters were taken into consideration, in particular for:• credit spreads: by considering credit spreads available on a
single counterpart or, failing that, on similar counterparts or counterparts belonging to similar sectors, or by using credit spreads indexed to liquid CDS indices;
• liquidity premiums: by considering the different levels of premiums primarily used in determining the fair value of bonds, and which depend in particular on the eligibility of the security for refinancing with the central banks;
• the illiquidity of the financial instrument: by considering a change in the estimated liquidity of the market for a single instrument or similar products, and/or by incorporating an analysis of the bid/ask spread for real transactions.
Tests were carried out on all financial instruments classified under Level 3.
The effects of sensitivity are mainly felt at the level of structured issues recognised at fair value through profit and loss. These effects are, however, offset by a reverse sensitivity at the level of activity-related hedging derivatives.
The most significant stand-alone Level 3 instrument is BIL's participation in Luxair SA. The sensitivity test leads to a minor impact in the OCI reserve. Nevertheless, such a sensitivity analysis is not relevant as many factors (such as fuel market volatility and global economic context) may impact Luxair valuation.

Banque Internationale à Luxembourg SA
69, route d’EschL-2953 LuxembourgRCS Luxembourg B-6307T: (+352) 4590-1F: (+352) 4590-2010
www.bil.com


![1.Introduction to Semi Conductors [EngineeringDuniya.com]](https://img.pdfslide.net/doc/110x75/577cdc691a28ab9e78aa79c3/1introduction-to-semi-conductors-engineeringduniyacom.jpg)