Embed Size (px)
Citation preview

Pi Global Portfolios
Semi–Annual Report Period ended 30 September 2017 (Unaudited)
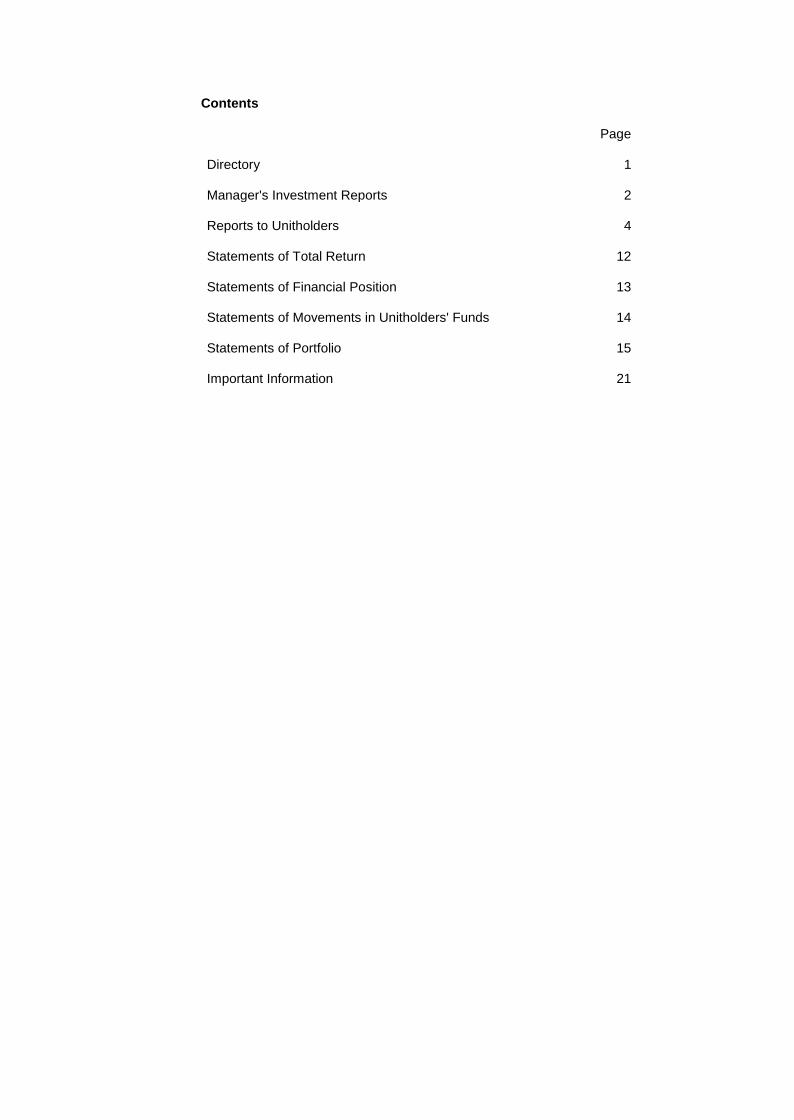
Contents Page Directory 1 Manager's Investment Reports 2 Reports to Unitholders 4 Statements of Total Return 12 Statements of Financial Position 13 Statements of Movements in Unitholders' Funds 14 Statements of Portfolio 15 Important Information 21
1
Pi Global Portfolios
MANAGER Phillip Capital Management (S) Ltd 250 North Bridge Road #06-00 Raffles City Tower Singapore 179101 (Company Registration No. 199905233W)
DIRECTORS OF THE MANAGER Lim Hua Min Jeffrey Lee Chay Khiong Linus Lim Wen Sheong Lee Ken Hoon Lim Wah Sai Louis Wong Wai Kit
TRUSTEE & REGISTRAR BNP Paribas Trust Services Singapore Limited 20 Collyer Quay, #01-01 Singapore 049319 (Company Registration No. 200800851W)
CUSTODIAN AND FUND ADMINISTRATOR BNP Paribas Securities Services Singapore Branch 20 Collyer Quay, #01-01 Singapore 049319 (Company Registration No. T08FC7287D) AUDITORS KPMG LLP 16 Raffles Quay #22-00 Hong Leong Building Singapore 048581 SOLICITORS TO THE MANAGER Chan & Goh LLP 50 Craig Road, #03-01 Singapore 089688
SOLICITORS TO THE TRUSTEE Dentons Rodyk & Davidson LLP 80 Raffles Place #33-00 UOB Plaza 1 Singapore 048624
Pi Global Portfolios
2
MANAGER'S INVESTMENT REPORTS Pi-5 Global Portfolio The Fund rose by 3.1% for the half year ending 30 September 2017, including distributions paid. The Fund paid out semi-annual distributions totaling 0.5 Singapore cents per unit within the half-year.
The half year period ending September 2017 saw a continuation of the strength across equity markets. Data from various key economies, such as the US and China but also including big exporters such as Japan and Germany, pointed to rebounding global demand and a broad-based economic recovery. The US Federal Reserve resumed its rate hike cycle, with three quarter-point hikes expected for 2017. Despite fears of market correction, markets were well-supported, which suggested that such rate hikes had been well-signalled and markets were therefore well-prepared already. Over this half-year period, equity markets posted broad-based returns, led by emerging markets, with developed markets less strong. Commodities were negative overall mainly due to weak oil prices. Bonds were mixed, with global bonds dragged by a weak US dollar (which had a negative currency effect when translated to Singapore dollar). Following a stellar performance by equity markets so far in 2017, we expect markets might be slightly more discriminating going forward. The overall economic environment still looks benign. While the “Trump rally” has largely faded and growth and inflation expectations are moderating (as shown by declining long-term bond yields), most economic data continue to indicate broad-based strength. The US Federal Reserve is now in a steady rate hike cycle, and the approach has been measured and gradual, hence soothing markets. We think the mood of cautious optimism in the markets is a positive indicator in itself. Policymakers are likely to tread carefully to avoid derailing the current global recovery, and we think any significant market downturn is unlikely. Further market catalysts may include success of tax reform in the US, continued success in transformation of the Chinese economy under Xi Jinping, and continued economic rebound in Europe. While the Trump effect has turned out to be relatively benign, there are other risks to look out for. The change in US Federal Reserve chairman to Jerome Powell means there is a risk of discontinuity in the central bank’s monetary policy, which has been the key underpinning behind economic recovery since the global financial crisis nearly a decade ago. The fact that he has been a governor in the central bank since 2012 gives some comfort though, that any abrupt or significant policy deviation is unlikely at least in the near term. A second risk is sharp price inflation in any key basic commodity, which may force the hands of central banks. Developments in the Middle East need watching, as political disruptions or war may send oil prices rocketing, for example. With regard to our positioning for the Fund, on the equities front, we are focused on having a bigger allocation to developed market equities for the Fund, with a big majority in US equities and a minority in Europe and Japan. Our belief is that this allocation lends stability to the portfolio, given that emerging market equities are susceptible to foreign fund flows which can be volatile. For bonds, we continue to like high-quality bond exposures as a cushion for the overall portfolio.
Pi Global Portfolios
3
MANAGER'S INVESTMENT REPORTS Pi-7 Global Portfolio The Fund rose by 4.4% for the half year ending 30 September 2017,
The half year period ending September 2017 saw a continuation of the strength across equity markets. Data from various key economies, such as the US and China but also including big exporters such as Japan and Germany, pointed to rebounding global demand and a broad-based economic recovery. The US Federal Reserve resumed its rate hike cycle, with three quarter-point hikes expected for 2017. Despite fears of market correction, markets were well-supported, which suggested that such rate hikes had been well-signalled and markets were therefore well-prepared already. Over this half-year period, equity markets posted broad-based returns, led by emerging markets, with developed markets less strong. Commodities were negative overall mainly due to weak oil prices. Bonds were mixed, with global bonds dragged by a weak US dollar (which had a negative currency effect when translated to Singapore dollar). Following a stellar performance by equity markets so far in 2017, we expect markets might be slightly more discriminating going forward. The overall economic environment still looks benign. While the “Trump rally” has largely faded and growth and inflation expectations are moderating (as shown by declining long-term bond yields), most economic data continue to indicate broad-based strength. The US Federal Reserve is now in a steady rate hike cycle, and the approach has been measured and gradual, hence soothing markets. We think the mood of cautious optimism in the markets is a positive indicator in itself. Policymakers are likely to tread carefully to avoid derailing the current global recovery, and we think any significant market downturn is unlikely. Further market catalysts may include success of tax reform in the US, continued success in transformation of the Chinese economy under Xi Jinping, and continued economic rebound in Europe. While the Trump effect has turned out to be relatively benign, there are other risks to look out for. The change in US Federal Reserve chairman to Jerome Powell means there is a risk of discontinuity in the central bank’s monetary policy, which has been the key underpinning behind economic recovery since the global financial crisis nearly a decade ago. The fact that he has been a governor in the central bank since 2012 gives some comfort though, that any abrupt or significant policy deviation is unlikely at least in the near term. A second risk is sharp price inflation in any key basic commodity, which may force the hands of central banks. Developments in the Middle East need watching, as political disruptions or war may send oil prices rocketing, for example.
With regard to our positioning for the Fund, on the equities front, we have a balanced allocation to developed market equities and emerging market equities for the Fund. Our belief is that this allocation lends stability to the portfolio. Emerging market equities are expected to have higher long-term potential growth but are susceptible to foreign fund flows which can be volatile. For bonds, we continue to like high-quality bond exposures as a cushion for the overall portfolio.
Pi Global Portfolios Report To Unitholders Period ended 30 September 2017 (unaudited)
4
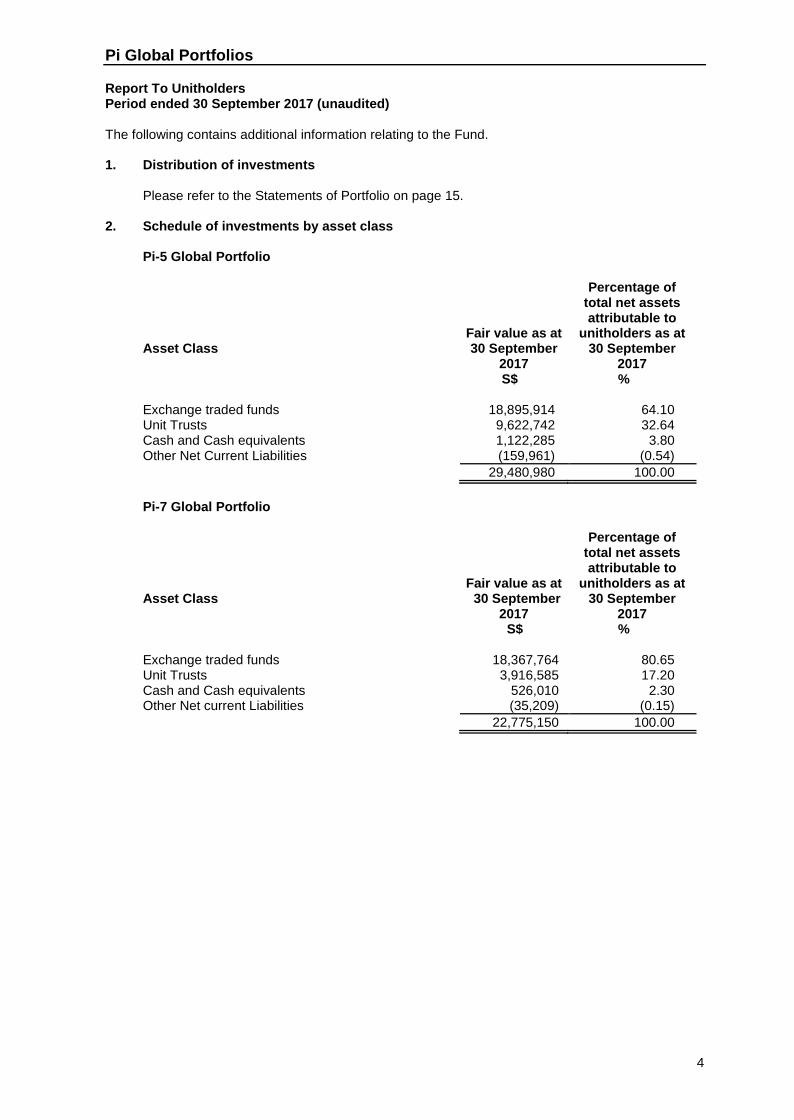
The following contains additional information relating to the Fund. 1. Distribution of investments
Please refer to the Statements of Portfolio on page 15. 2. Schedule of investments by asset class
Pi-5 Global Portfolio
Asset Class
Fair value as at 30 September
2017 S$
Percentage of total net assets attributable to
unitholders as at 30 September
2017 %
Exchange traded funds 18,895,914 64.10 Unit Trusts 9,622,742 32.64 Cash and Cash equivalents 1,122,285 3.80 Other Net Current Liabilities (159,961) (0.54)
29,480,980 100.00
Pi-7 Global Portfolio
Asset Class
Fair value as at 30 September
2017 S$
Percentage of total net assets attributable to
unitholders as at 30 September
2017 %
Exchange traded funds 18,367,764 80.65 Unit Trusts 3,916,585 17.20 Cash and Cash equivalents 526,010 2.30 Other Net current Liabilities (35,209) (0.15)
22,775,150 100.00
Pi Global Portfolios Report To Unitholders Period ended 30 September 2017 (unaudited)
5
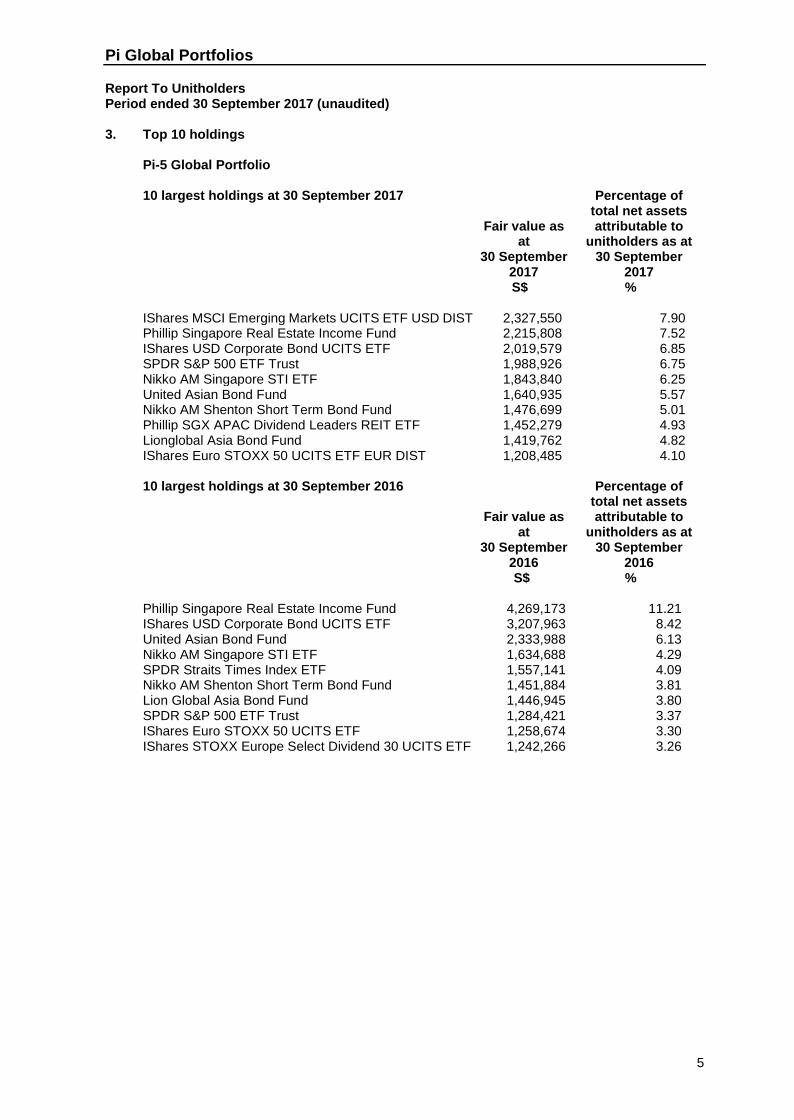
3. Top 10 holdings
Pi-5 Global Portfolio 10 largest holdings at 30 September 2017
Fair value as at
30 September 2017 S$
Percentage of total net assets attributable to
unitholders as at 30 September
2017 %
IShares MSCI Emerging Markets UCITS ETF USD DIST 2,327,550 7.90 Phillip Singapore Real Estate Income Fund 2,215,808 7.52 IShares USD Corporate Bond UCITS ETF 2,019,579 6.85 SPDR S&P 500 ETF Trust 1,988,926 6.75 Nikko AM Singapore STI ETF 1,843,840 6.25 United Asian Bond Fund 1,640,935 5.57 Nikko AM Shenton Short Term Bond Fund 1,476,699 5.01 Phillip SGX APAC Dividend Leaders REIT ETF 1,452,279 4.93 Lionglobal Asia Bond Fund 1,419,762 4.82 IShares Euro STOXX 50 UCITS ETF EUR DIST 1,208,485 4.10 10 largest holdings at 30 September 2016
Fair value as at
30 September 2016 S$
Percentage of total net assets attributable to
unitholders as at 30 September
2016 %
Phillip Singapore Real Estate Income Fund 4,269,173 11.21 IShares USD Corporate Bond UCITS ETF 3,207,963 8.42 United Asian Bond Fund 2,333,988 6.13 Nikko AM Singapore STI ETF 1,634,688 4.29 SPDR Straits Times Index ETF 1,557,141 4.09 Nikko AM Shenton Short Term Bond Fund 1,451,884 3.81 Lion Global Asia Bond Fund 1,446,945 3.80 SPDR S&P 500 ETF Trust 1,284,421 3.37 IShares Euro STOXX 50 UCITS ETF 1,258,674 3.30 IShares STOXX Europe Select Dividend 30 UCITS ETF 1,242,266 3.26
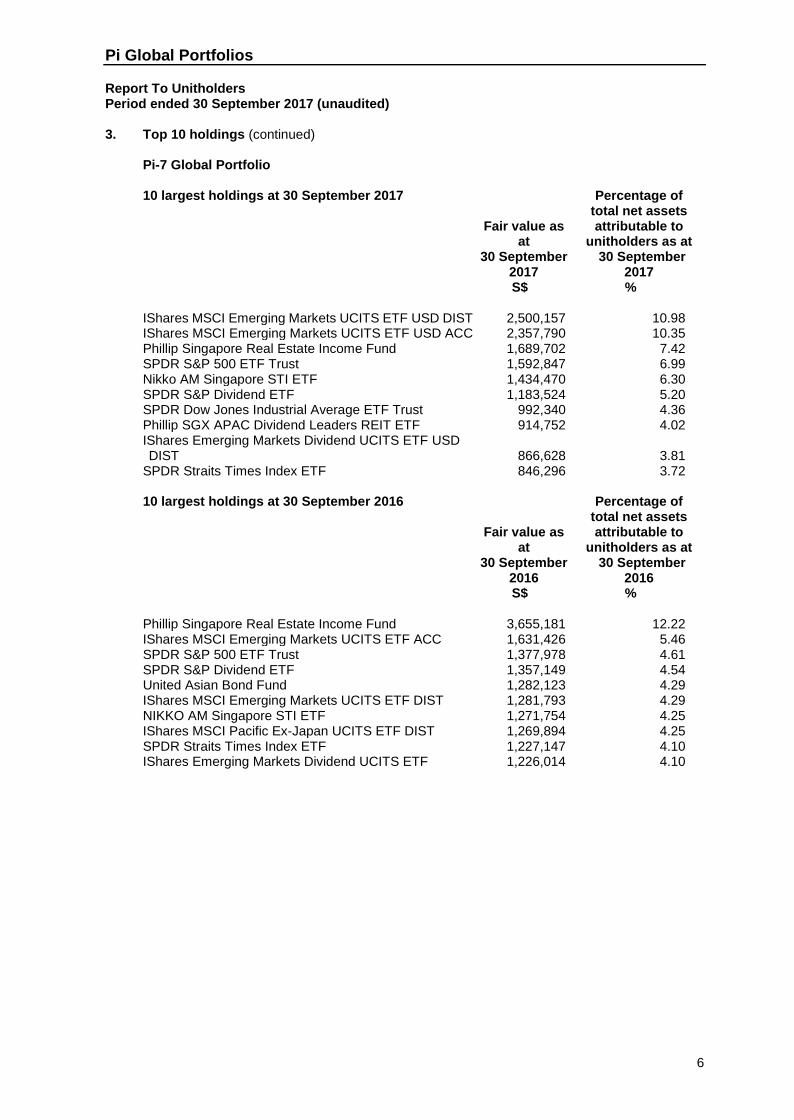
Pi Global Portfolios Report To Unitholders Period ended 30 September 2017 (unaudited) 3. Top 10 holdings (continued)
6
Pi-7 Global Portfolio 10 largest holdings at 30 September 2017
Fair value as at
30 September 2017 S$
Percentage of total net assets attributable to
unitholders as at 30 September
2017 %
IShares MSCI Emerging Markets UCITS ETF USD DIST 2,500,157 10.98 IShares MSCI Emerging Markets UCITS ETF USD ACC 2,357,790 10.35 Phillip Singapore Real Estate Income Fund 1,689,702 7.42 SPDR S&P 500 ETF Trust 1,592,847 6.99 Nikko AM Singapore STI ETF 1,434,470 6.30 SPDR S&P Dividend ETF 1,183,524 5.20 SPDR Dow Jones Industrial Average ETF Trust 992,340 4.36 Phillip SGX APAC Dividend Leaders REIT ETF 914,752 4.02 IShares Emerging Markets Dividend UCITS ETF USD DIST 866,628 3.81 SPDR Straits Times Index ETF 846,296 3.72 10 largest holdings at 30 September 2016
Fair value as at
30 September 2016 S$
Percentage of total net assets attributable to
unitholders as at 30 September
2016 %
Phillip Singapore Real Estate Income Fund 3,655,181 12.22 IShares MSCI Emerging Markets UCITS ETF ACC 1,631,426 5.46 SPDR S&P 500 ETF Trust 1,377,978 4.61 SPDR S&P Dividend ETF 1,357,149 4.54 United Asian Bond Fund 1,282,123 4.29 IShares MSCI Emerging Markets UCITS ETF DIST 1,281,793 4.29 NIKKO AM Singapore STI ETF 1,271,754 4.25 IShares MSCI Pacific Ex-Japan UCITS ETF DIST 1,269,894 4.25 SPDR Straits Times Index ETF 1,227,147 4.10 IShares Emerging Markets Dividend UCITS ETF 1,226,014 4.10
Pi Global Portfolios Report To Unitholders Period ended 30 September 2017 (unaudited)
7
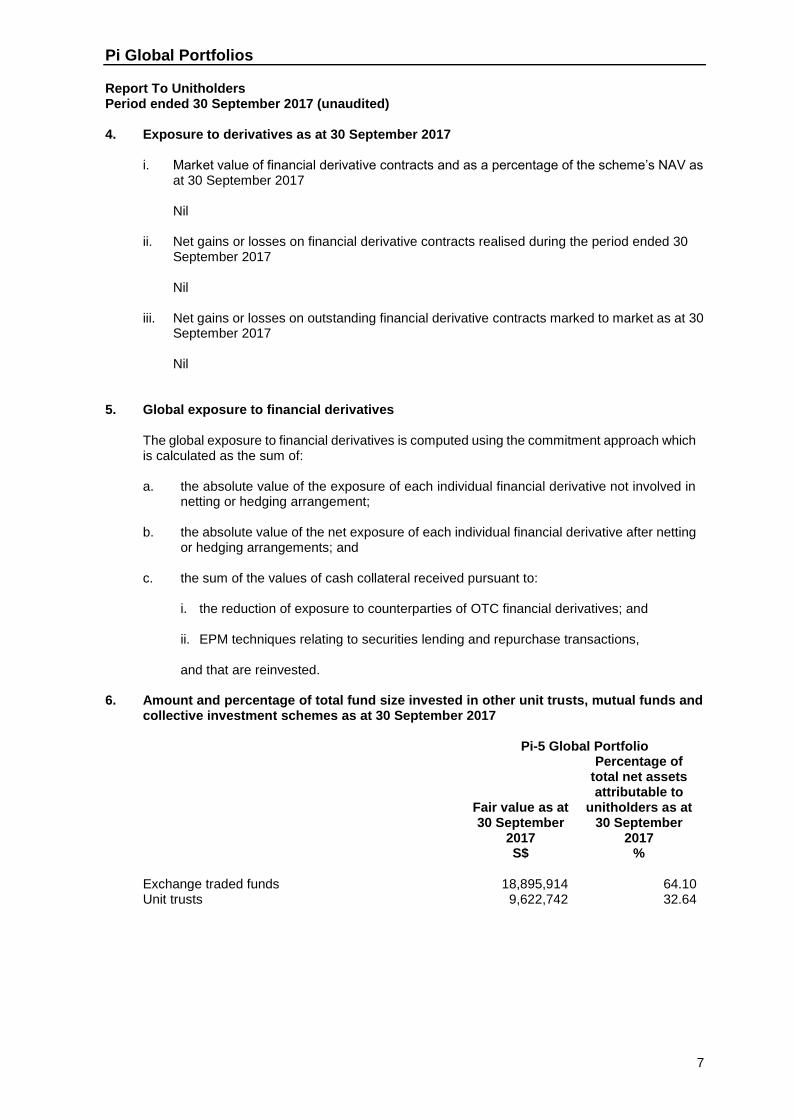
4. Exposure to derivatives as at 30 September 2017
i. Market value of financial derivative contracts and as a percentage of the scheme’s NAV as at 30 September 2017 Nil
ii. Net gains or losses on financial derivative contracts realised during the period ended 30 September 2017 Nil
iii. Net gains or losses on outstanding financial derivative contracts marked to market as at 30 September 2017 Nil
5. Global exposure to financial derivatives
The global exposure to financial derivatives is computed using the commitment approach which is calculated as the sum of: a. the absolute value of the exposure of each individual financial derivative not involved in
netting or hedging arrangement; b. the absolute value of the net exposure of each individual financial derivative after netting
or hedging arrangements; and c. the sum of the values of cash collateral received pursuant to:
i. the reduction of exposure to counterparties of OTC financial derivatives; and
ii. EPM techniques relating to securities lending and repurchase transactions, and that are reinvested.
6. Amount and percentage of total fund size invested in other unit trusts, mutual funds and
collective investment schemes as at 30 September 2017
Pi-5 Global Portfolio
Fair value as at 30 September
2017 S$
Percentage of total net assets attributable to
unitholders as at 30 September
2017 %
Exchange traded funds 18,895,914 64.10 Unit trusts 9,622,742 32.64
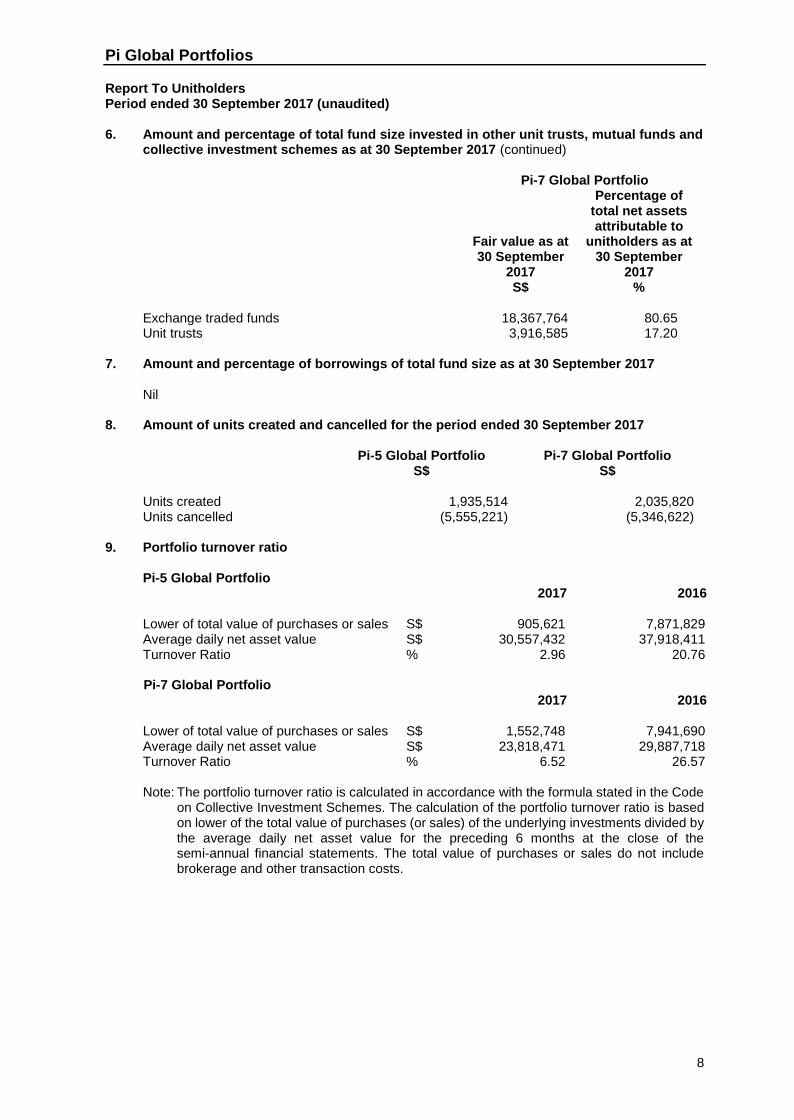
Pi Global Portfolios Report To Unitholders Period ended 30 September 2017 (unaudited) 6. Amount and percentage of total fund size invested in other unit trusts, mutual funds and
collective investment schemes as at 30 September 2017 (continued)
8
Pi-7 Global Portfolio
Fair value as at 30 September
2017 S$
Percentage of total net assets attributable to
unitholders as at 30 September
2017 %
Exchange traded funds 18,367,764 80.65 Unit trusts 3,916,585 17.20
7. Amount and percentage of borrowings of total fund size as at 30 September 2017
Nil
8. Amount of units created and cancelled for the period ended 30 September 2017
Pi-5 Global Portfolio S$
Pi-7 Global Portfolio S$
Units created 1,935,514 2,035,820 Units cancelled (5,555,221) (5,346,622)
9. Portfolio turnover ratio
Pi-5 Global Portfolio 2017 2016 Lower of total value of purchases or sales S$ 905,621 7,871,829 Average daily net asset value S$ 30,557,432 37,918,411 Turnover Ratio % 2.96 20.76
Pi-7 Global Portfolio 2017 2016 Lower of total value of purchases or sales S$ 1,552,748 7,941,690 Average daily net asset value S$ 23,818,471 29,887,718 Turnover Ratio % 6.52 26.57
Note: The portfolio turnover ratio is calculated in accordance with the formula stated in the Code
on Collective Investment Schemes. The calculation of the portfolio turnover ratio is based on lower of the total value of purchases (or sales) of the underlying investments divided by the average daily net asset value for the preceding 6 months at the close of the semi-annual financial statements. The total value of purchases or sales do not include brokerage and other transaction costs.
Pi Global Portfolios Report To Unitholders Period ended 30 September 2017 (unaudited)
9
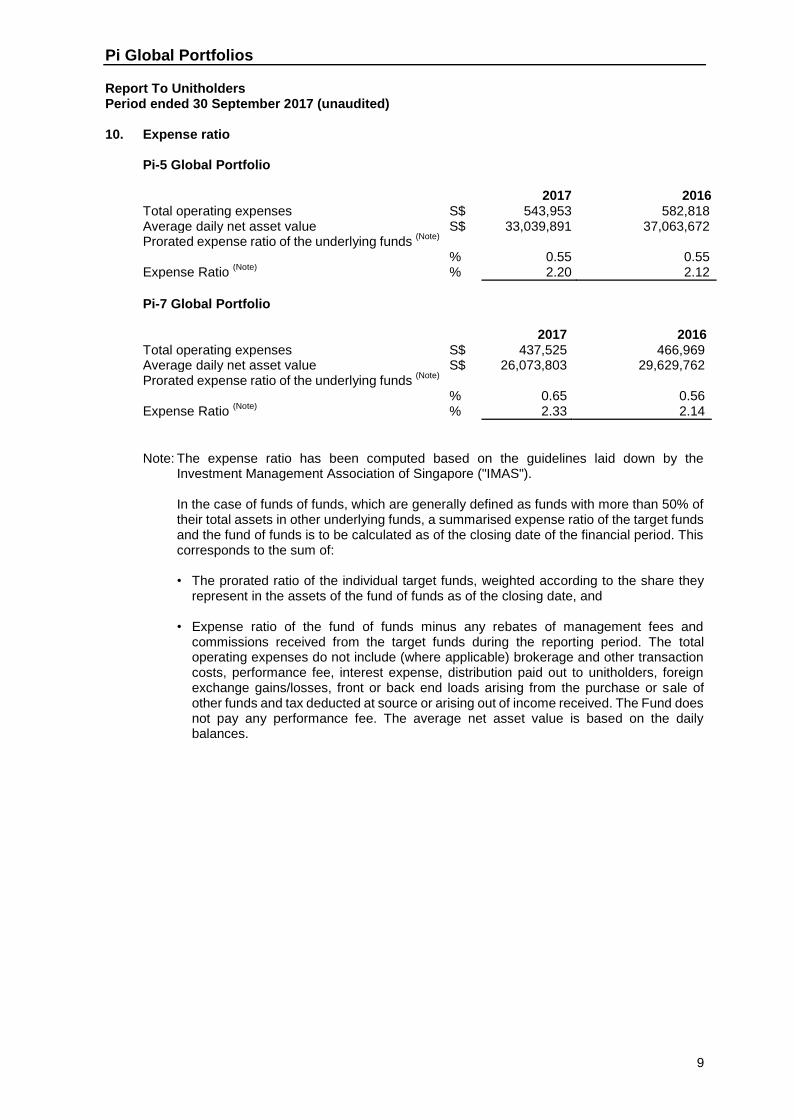
10. Expense ratio
Pi-5 Global Portfolio
2017 2016 Total operating expenses S$ 543,953 582,818 Average daily net asset value S$ 33,039,891 37,063,672 Prorated expense ratio of the underlying funds
(Note)
%
0.55
0.55 Expense Ratio
(Note) % 2.20 2.12
Pi-7 Global Portfolio
2017 2016 Total operating expenses S$ 437,525 466,969 Average daily net asset value S$ 26,073,803 29,629,762 Prorated expense ratio of the underlying funds
(Note)
%
0.65
0.56 Expense Ratio
(Note) % 2.33 2.14
Note: The expense ratio has been computed based on the guidelines laid down by the
Investment Management Association of Singapore ("IMAS").
In the case of funds of funds, which are generally defined as funds with more than 50% of their total assets in other underlying funds, a summarised expense ratio of the target funds and the fund of funds is to be calculated as of the closing date of the financial period. This corresponds to the sum of: • The prorated ratio of the individual target funds, weighted according to the share they
represent in the assets of the fund of funds as of the closing date, and • Expense ratio of the fund of funds minus any rebates of management fees and
commissions received from the target funds during the reporting period. The total operating expenses do not include (where applicable) brokerage and other transaction costs, performance fee, interest expense, distribution paid out to unitholders, foreign exchange gains/losses, front or back end loads arising from the purchase or sale of other funds and tax deducted at source or arising out of income received. The Fund does not pay any performance fee. The average net asset value is based on the daily balances.
Pi Global Portfolios Report To Unitholders Period ended 30 September 2017 (unaudited)
10
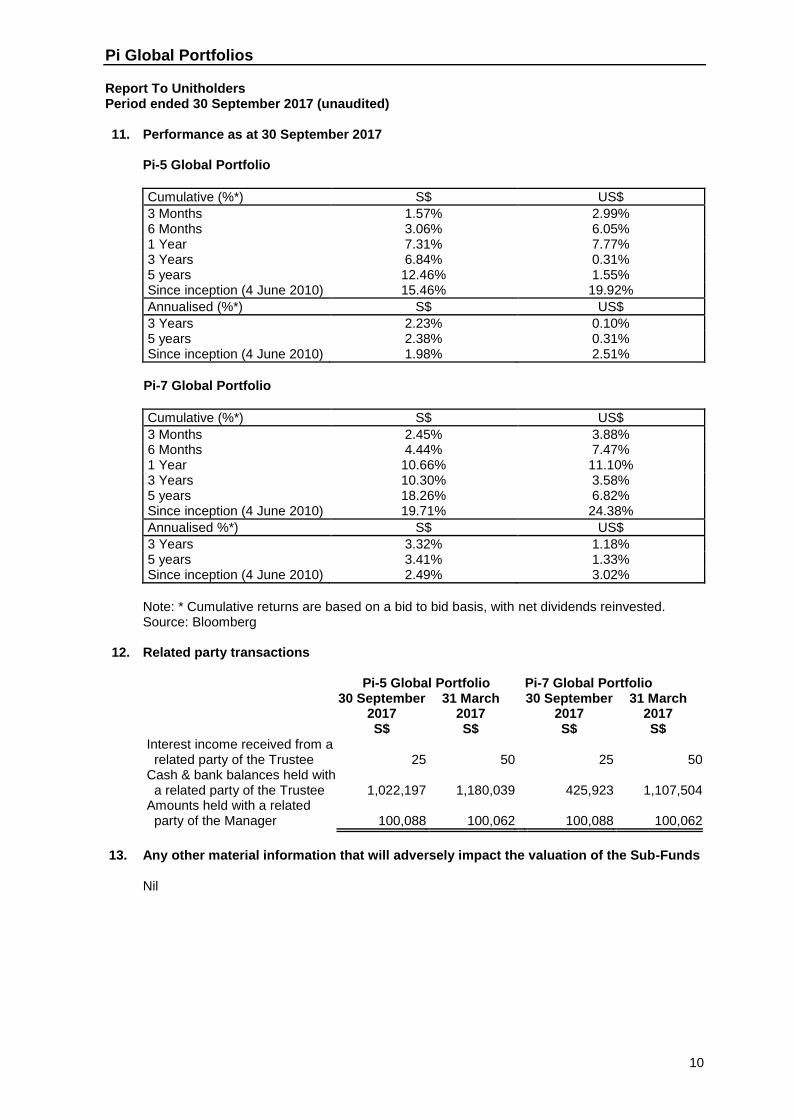
11. Performance as at 30 September 2017
Pi-5 Global Portfolio
Cumulative (%*) S$ US$
3 Months 1.57% 2.99% 6 Months 3.06% 6.05% 1 Year 7.31% 7.77% 3 Years 6.84% 0.31% 5 years 12.46% 1.55% Since inception (4 June 2010) 15.46% 19.92%
Annualised (%*) S$ US$
3 Years 2.23% 0.10% 5 years 2.38% 0.31% Since inception (4 June 2010) 1.98% 2.51%
Pi-7 Global Portfolio
Cumulative (%*) S$ US$
3 Months 2.45% 3.88% 6 Months 4.44% 7.47% 1 Year 10.66% 11.10% 3 Years 10.30% 3.58% 5 years 18.26% 6.82% Since inception (4 June 2010) 19.71% 24.38%
Annualised %*) S$ US$
3 Years 3.32% 1.18% 5 years 3.41% 1.33% Since inception (4 June 2010) 2.49% 3.02%
Note: * Cumulative returns are based on a bid to bid basis, with net dividends reinvested. Source: Bloomberg 12. Related party transactions
Pi-5 Global Portfolio Pi-7 Global Portfolio 30 September
2017 S$
31 March 2017 S$
30 September 2017 S$
31 March 2017 S$
Interest income received from a related party of the Trustee 25 50 25 50
Cash & bank balances held with a related party of the Trustee 1,022,197 1,180,039 425,923 1,107,504
Amounts held with a related party of the Manager 100,088 100,062 100,088 100,062
13. Any other material information that will adversely impact the valuation of the Sub-Funds
Nil
Pi Global Portfolios Report To Unitholders Period ended 30 September 2017 (unaudited)
11
14. Soft dollar commissions The Manager shall be entitled to and intends to receive or enter into soft-dollar commissions or arrangements. The Manager will comply with applicable regulatory and industry standards on soft-dollars. The soft-dollar commissions which the Manager may receive include research and advisory services, economic and political analyses, portfolio analyses including valuation and performance measurements, market analyses, data and quotation services, computer hardware and software or any other information facilities to the extent that they are used to support the investment decision making process, the giving of advice, or the conduct of research or analysis and custodial service in relation to the investments managed for clients. The soft dollar credits utilised are not allocated on a specific client basis. The brokers also execute trades for other funds managed by the Manager. The Manager will not accept or enter into soft dollar commissions/arrangements unless such soft-dollar commissions or arrangements would, in the opinion of the Manager, assist the Manager in its management of clients’ funds, provided that the Manager shall ensure at all times that transactions are executed on the best available terms taking into account the relevant market at the time for transactions of the kind and size concerned, and that no unnecessary trades are entered into in order to qualify for such soft-dollar commissions or arrangements. The Manager does not, and is not entitled to, retain cash rebates for its own account in respect of rebates earned when transacting in securities for account of the Sub-Funds. During the period, soft dollar services received from each broker were investment research and publications, data and quotation services. Soft dollar services were received from the Manager's panel of brokers which executed transactions for the Sub-Funds and other funds managed by the Manager.
Pi Global Portfolios Financial statements
Period ended 30 September 2017 (unaudited)
12
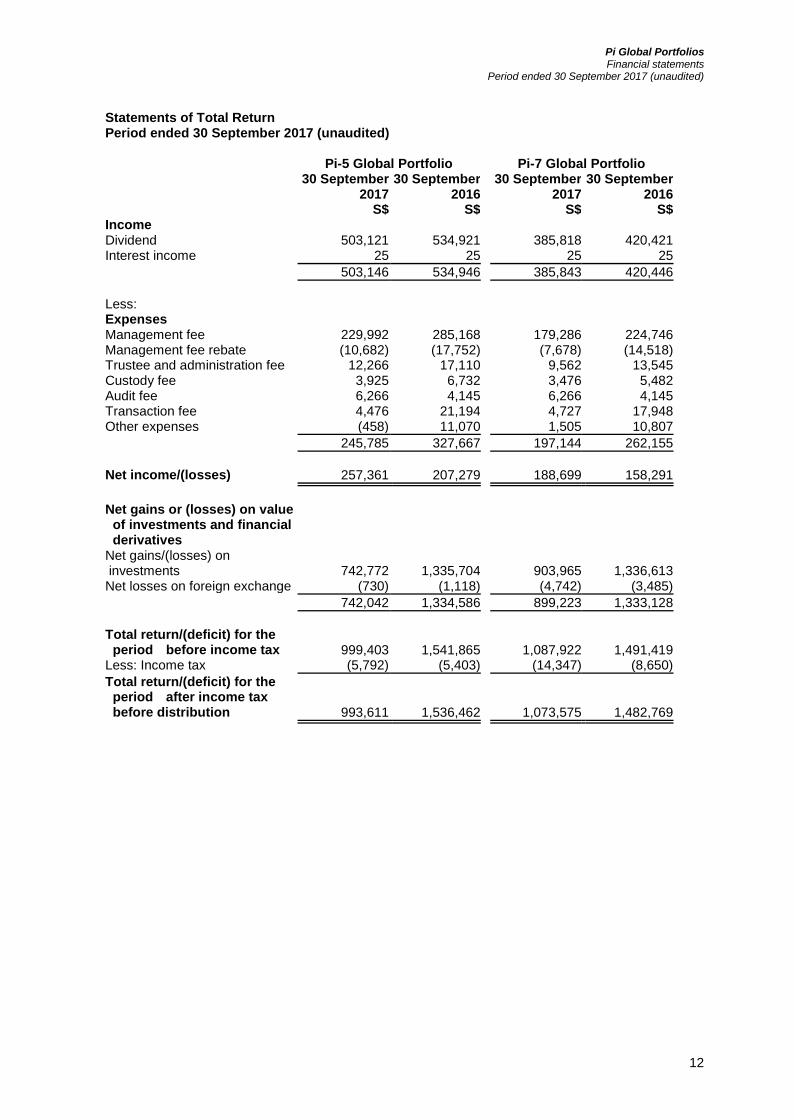
Statements of Total Return Period ended 30 September 2017 (unaudited) Pi-5 Global Portfolio Pi-7 Global Portfolio 30 September
2017 30 September
2016 30 September
2017 30 September
2016 S$ S$ S$ S$ Income Dividend 503,121 534,921 385,818 420,421 Interest income 25 25 25 25
503,146 534,946 385,843 420,446
Less: Expenses Management fee 229,992 285,168 179,286 224,746 Management fee rebate (10,682) (17,752) (7,678) (14,518) Trustee and administration fee 12,266 17,110 9,562 13,545 Custody fee 3,925 6,732 3,476 5,482 Audit fee 6,266 4,145 6,266 4,145 Transaction fee 4,476 21,194 4,727 17,948 Other expenses (458) 11,070 1,505 10,807
245,785 327,667 197,144 262,155
Net income/(losses) 257,361 207,279 188,699 158,291
Net gains or (losses) on value
of investments and financial derivatives
Net gains/(losses) on investments 742,772 1,335,704 903,965 1,336,613 Net losses on foreign exchange (730) (1,118) (4,742) (3,485)
742,042 1,334,586 899,223 1,333,128
Total return/(deficit) for the
period before income tax 999,403 1,541,865 1,087,922 1,491,419 Less: Income tax (5,792) (5,403) (14,347) (8,650)
Total return/(deficit) for the period after income tax before distribution
993,611
1,536,462
1,073,575
1,482,769
Pi Global Portfolios Financial statements
Period ended 30 September 2017 (unaudited)
13
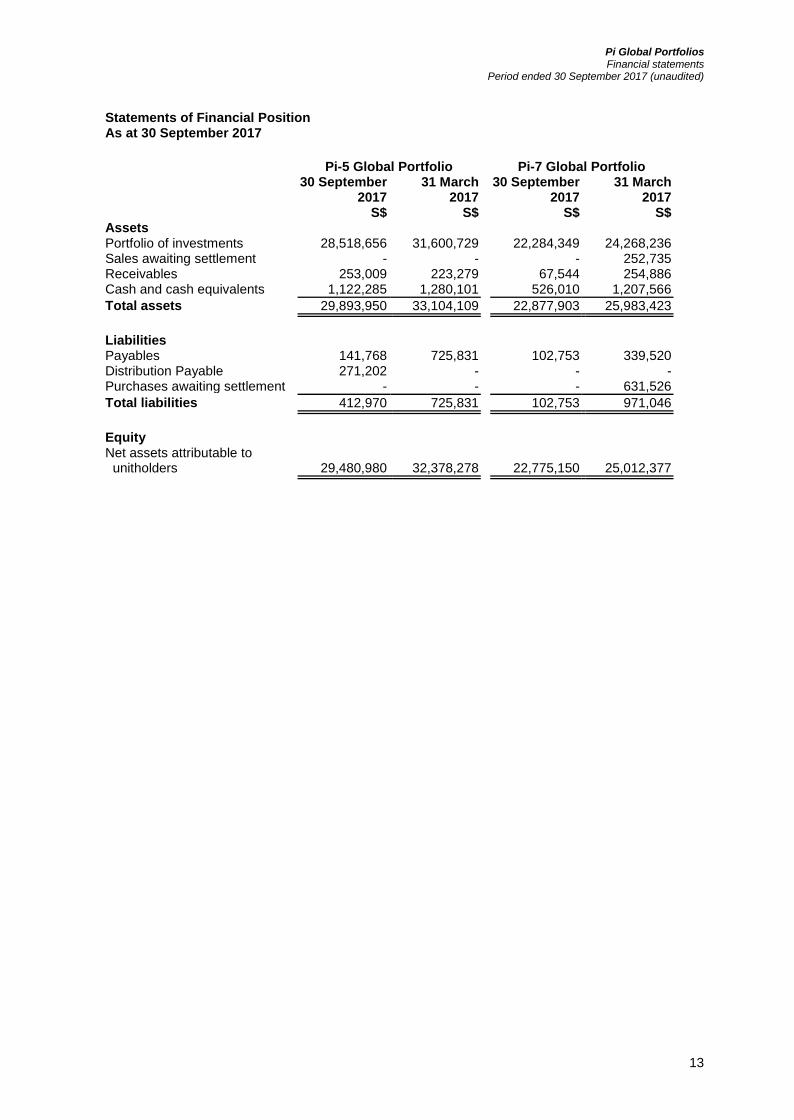
Statements of Financial Position As at 30 September 2017
Pi-5 Global Portfolio Pi-7 Global Portfolio
30 September
2017 31 March
2017 30 September
2017 31 March
2017 S$ S$ S$ S$ Assets Portfolio of investments 28,518,656 31,600,729 22,284,349 24,268,236 Sales awaiting settlement - - - 252,735 Receivables 253,009 223,279 67,544 254,886 Cash and cash equivalents 1,122,285 1,280,101 526,010 1,207,566
Total assets 29,893,950 33,104,109 22,877,903 25,983,423
Liabilities Payables 141,768 725,831 102,753 339,520 Distribution Payable 271,202 - - - Purchases awaiting settlement - - - 631,526
Total liabilities 412,970 725,831 102,753 971,046
Equity Net assets attributable to
unitholders 29,480,980 32,378,278 22,775,150 25,012,377
Pi Global Portfolios Financial statements
Period ended 30 September 2017 (unaudited)
14
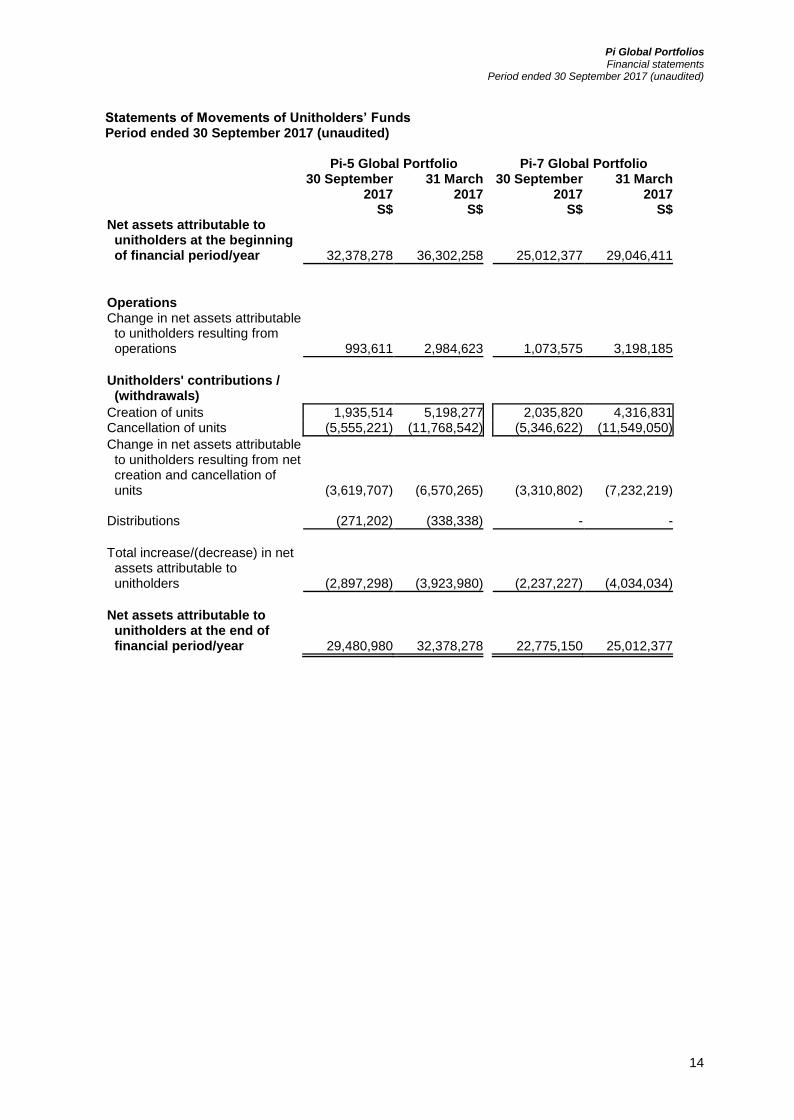
Statements of Movements of Unitholders’ Funds Period ended 30 September 2017 (unaudited) Pi-5 Global Portfolio Pi-7 Global Portfolio 30 September
2017 31 March
2017 30 September
2017 31 March
2017 S$ S$ S$ S$ Net assets attributable to
unitholders at the beginning of financial period/year 32,378,278 36,302,258 25,012,377 29,046,411
Operations Change in net assets attributable
to unitholders resulting from operations
993,611
2,984,623
1,073,575
3,198,185
Unitholders' contributions /
(withdrawals)
Creation of units 1,935,514 5,198,277 2,035,820 4,316,831 Cancellation of units (5,555,221) (11,768,542) (5,346,622) (11,549,050)
Change in net assets attributable to unitholders resulting from net creation and cancellation of units
(3,619,707)
(6,570,265)
(3,310,802)
(7,232,219) Distributions (271,202) (338,338) - -
Total increase/(decrease) in net
assets attributable to unitholders
(2,897,298)
(3,923,980)
(2,237,227)
(4,034,034)
Net assets attributable to
unitholders at the end of financial period/year
29,480,980
32,378,278
22,775,150
25,012,377
Pi Global Portfolios Financial statements
Period ended 30 September 2017 (unaudited)
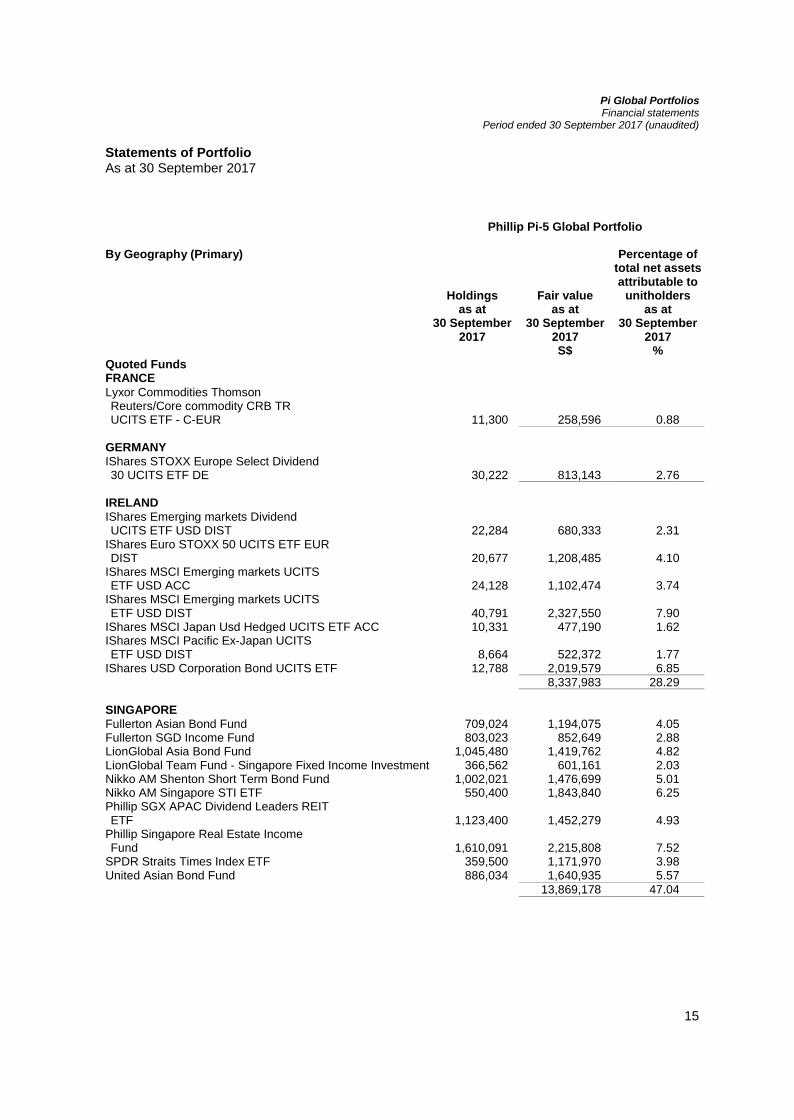
Statements of Portfolio As at 30 September 2017
Phillip Pi-5 Global Portfolio By Geography (Primary)
Holdings as at
30 September 2017
Fair value as at
30 September 2017
Percentage of total net assets attributable to
unitholders as at
30 September 2017
S$ % Quoted Funds
15
FRANCE Lyxor Commodities Thomson Reuters/Core commodity CRB TR UCITS ETF - C-EUR 11,300 258,596 0.88
GERMANY IShares STOXX Europe Select Dividend 30 UCITS ETF DE 30,222 813,143 2.76
IRELAND IShares Emerging markets Dividend UCITS ETF USD DIST 22,284 680,333 2.31 IShares Euro STOXX 50 UCITS ETF EUR DIST 20,677 1,208,485 4.10 IShares MSCI Emerging markets UCITS ETF USD ACC 24,128 1,102,474 3.74 IShares MSCI Emerging markets UCITS ETF USD DIST 40,791 2,327,550 7.90 IShares MSCI Japan Usd Hedged UCITS ETF ACC 10,331 477,190 1.62 IShares MSCI Pacific Ex-Japan UCITS ETF USD DIST 8,664 522,372 1.77 IShares USD Corporation Bond UCITS ETF 12,788 2,019,579 6.85
8,337,983 28.29
SINGAPORE Fullerton Asian Bond Fund 709,024 1,194,075 4.05 Fullerton SGD Income Fund 803,023 852,649 2.88 LionGlobal Asia Bond Fund 1,045,480 1,419,762 4.82 LionGlobal Team Fund - Singapore Fixed Income Investment 366,562 601,161 2.03 Nikko AM Shenton Short Term Bond Fund 1,002,021 1,476,699 5.01 Nikko AM Singapore STI ETF 550,400 1,843,840 6.25 Phillip SGX APAC Dividend Leaders REIT ETF 1,123,400 1,452,279 4.93 Phillip Singapore Real Estate Income Fund 1,610,091 2,215,808 7.52 SPDR Straits Times Index ETF 359,500 1,171,970 3.98 United Asian Bond Fund 886,034 1,640,935 5.57
13,869,178 47.04
Pi Global Portfolios Financial statements
Period ended 30 September 2017 (unaudited)
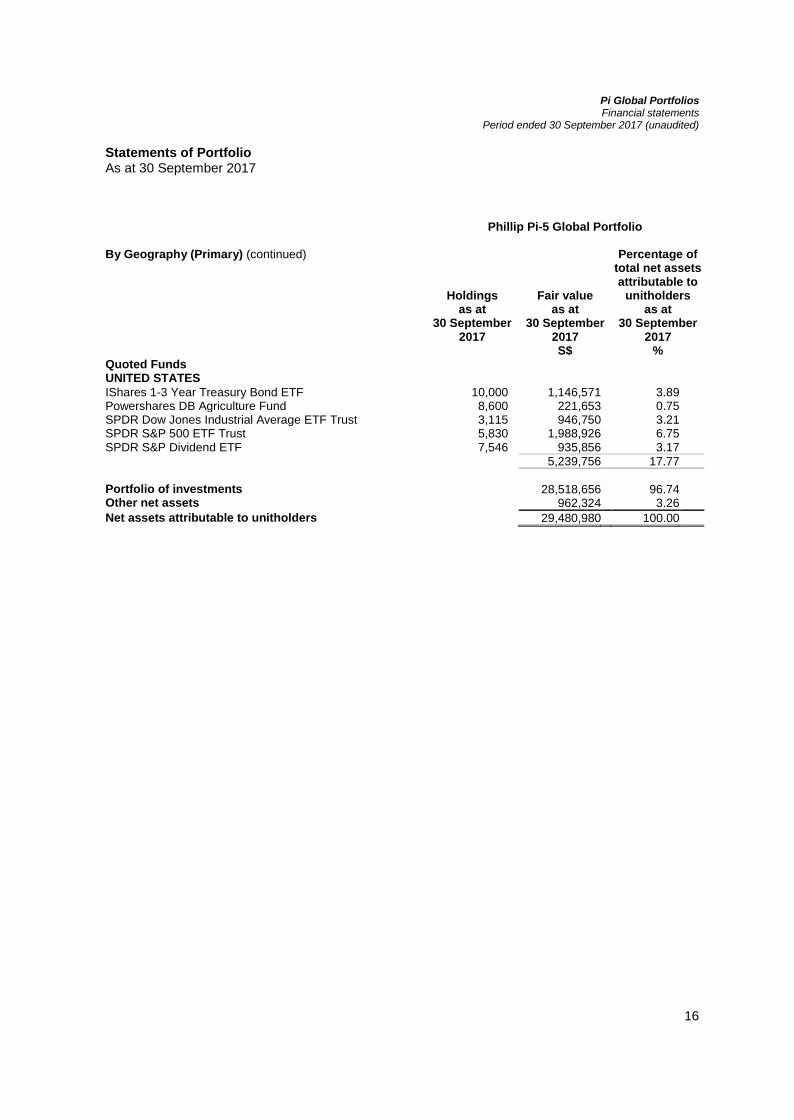
Statements of Portfolio As at 30 September 2017
Phillip Pi-5 Global Portfolio By Geography (Primary) (continued)
Holdings as at
30 September 2017
Fair value as at
30 September 2017
Percentage of total net assets attributable to
unitholders as at
30 September 2017
S$ % Quoted Funds
16
UNITED STATES IShares 1-3 Year Treasury Bond ETF 10,000 1,146,571 3.89 Powershares DB Agriculture Fund 8,600 221,653 0.75 SPDR Dow Jones Industrial Average ETF Trust 3,115 946,750 3.21 SPDR S&P 500 ETF Trust 5,830 1,988,926 6.75 SPDR S&P Dividend ETF 7,546 935,856 3.17
5,239,756 17.77
Portfolio of investments 28,518,656 96.74 Other net assets 962,324 3.26
Net assets attributable to unitholders 29,480,980 100.00
Pi Global Portfolios Financial statements
Period ended 30 September 2017 (unaudited)
Statements of Portfolio As at 30 September 2017
17
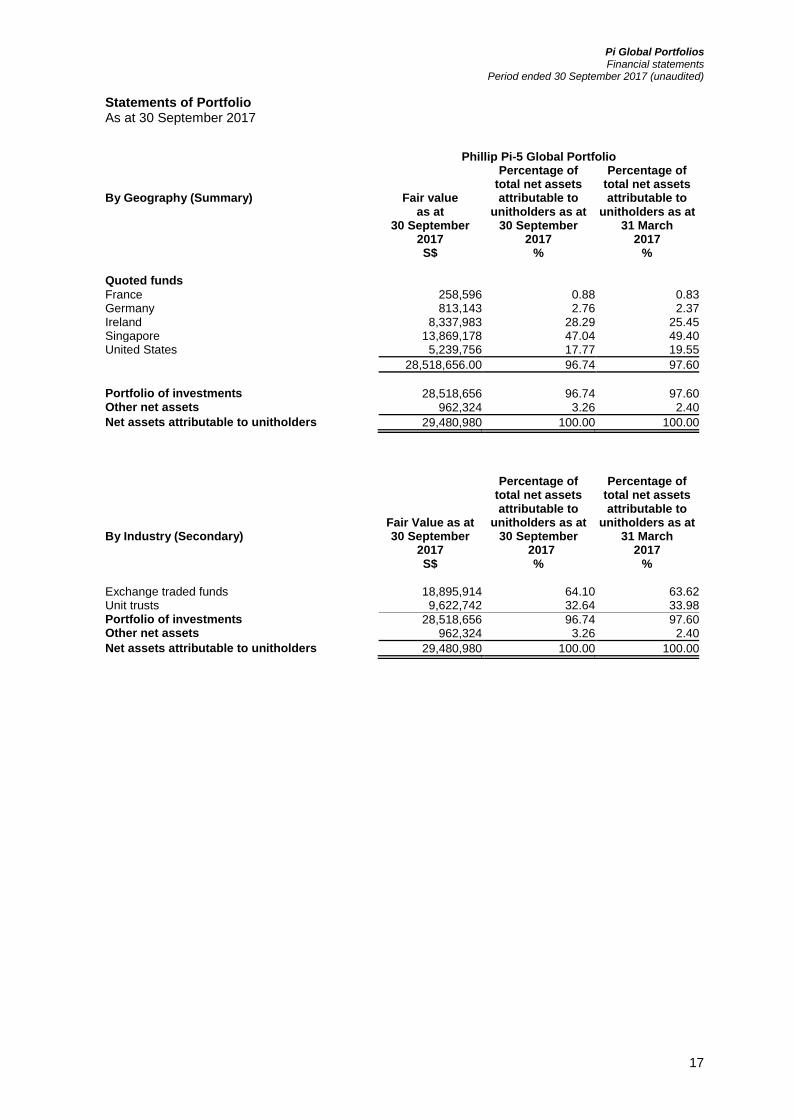
Phillip Pi-5 Global Portfolio
By Geography (Summary)
Fair value as at
30 September 2017
Percentage of total net assets attributable to
unitholders as at 30 September
2017
Percentage of total net assets attributable to
unitholders as at 31 March
2017 S$ % %
Quoted funds France 258,596 0.88 0.83 Germany 813,143 2.76 2.37 Ireland 8,337,983 28.29 25.45 Singapore 13,869,178 47.04 49.40 United States 5,239,756 17.77 19.55
28,518,656.00 96.74 97.60
Portfolio of investments 28,518,656 96.74 97.60 Other net assets 962,324 3.26 2.40
Net assets attributable to unitholders 29,480,980 100.00 100.00
By Industry (Secondary)
Fair Value as at 30 September
2017
Percentage of total net assets attributable to
unitholders as at 30 September
2017
Percentage of total net assets attributable to
unitholders as at 31 March
2017 S$ % %
Exchange traded funds 18,895,914 64.10 63.62 Unit trusts 9,622,742 32.64 33.98 Portfolio of investments 28,518,656 96.74 97.60 Other net assets 962,324 3.26 2.40
Net assets attributable to unitholders 29,480,980 100.00 100.00
Pi Global Portfolios Financial statements
Period ended 30 September 2017 (unaudited)
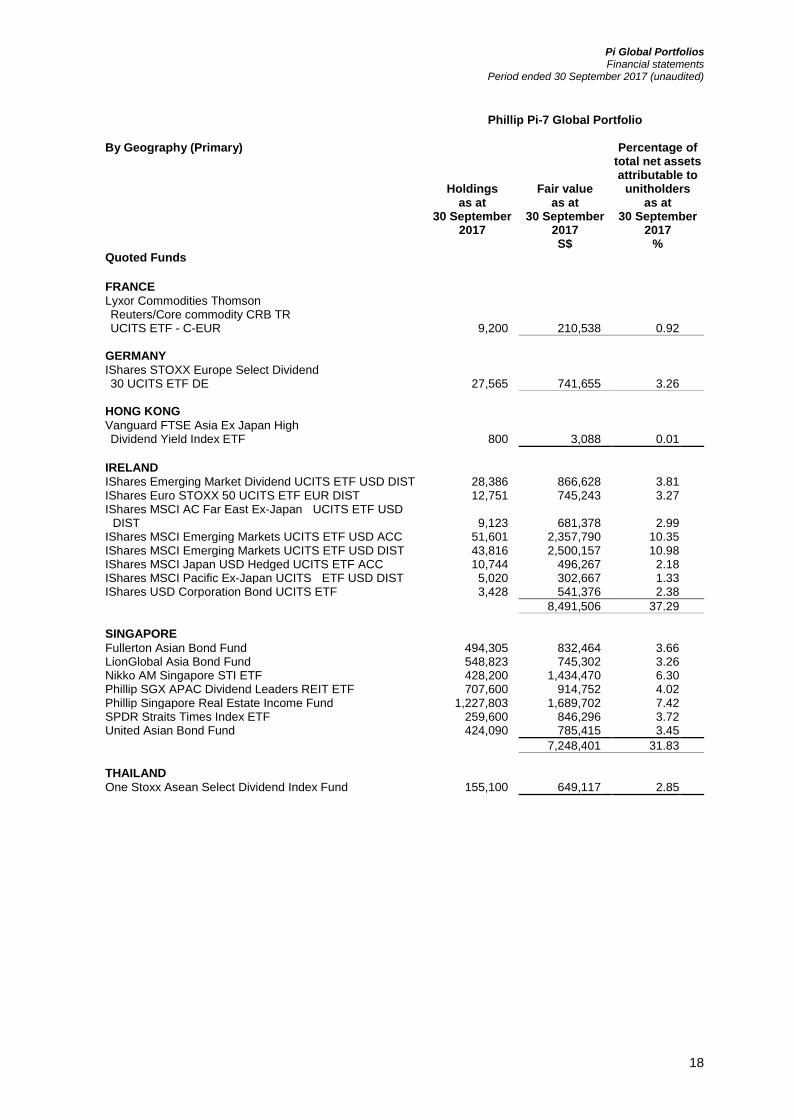
Phillip Pi-7 Global Portfolio By Geography (Primary)
Holdings as at
30 September 2017
Fair value as at
30 September 2017
Percentage of total net assets attributable to
unitholders as at
30 September 2017
S$ % Quoted Funds
18
FRANCE Lyxor Commodities Thomson Reuters/Core commodity CRB TR UCITS ETF - C-EUR 9,200 210,538 0.92
GERMANY IShares STOXX Europe Select Dividend 30 UCITS ETF DE 27,565 741,655 3.26
HONG KONG Vanguard FTSE Asia Ex Japan High Dividend Yield Index ETF 800 3,088 0.01
IRELAND IShares Emerging Market Dividend UCITS ETF USD DIST 28,386 866,628 3.81 IShares Euro STOXX 50 UCITS ETF EUR DIST 12,751 745,243 3.27 IShares MSCI AC Far East Ex-Japan UCITS ETF USD
DIST 9,123 681,378 2.99 IShares MSCI Emerging Markets UCITS ETF USD ACC 51,601 2,357,790 10.35 IShares MSCI Emerging Markets UCITS ETF USD DIST 43,816 2,500,157 10.98 IShares MSCI Japan USD Hedged UCITS ETF ACC 10,744 496,267 2.18 IShares MSCI Pacific Ex-Japan UCITS ETF USD DIST 5,020 302,667 1.33 IShares USD Corporation Bond UCITS ETF 3,428 541,376 2.38
8,491,506 37.29
SINGAPORE Fullerton Asian Bond Fund 494,305 832,464 3.66 LionGlobal Asia Bond Fund 548,823 745,302 3.26 Nikko AM Singapore STI ETF 428,200 1,434,470 6.30 Phillip SGX APAC Dividend Leaders REIT ETF 707,600 914,752 4.02 Phillip Singapore Real Estate Income Fund 1,227,803 1,689,702 7.42 SPDR Straits Times Index ETF 259,600 846,296 3.72 United Asian Bond Fund 424,090 785,415 3.45
7,248,401 31.83
THAILAND One Stoxx Asean Select Dividend Index Fund 155,100 649,117 2.85
Pi Global Portfolios Financial statements
Period ended 30 September 2017 (unaudited)
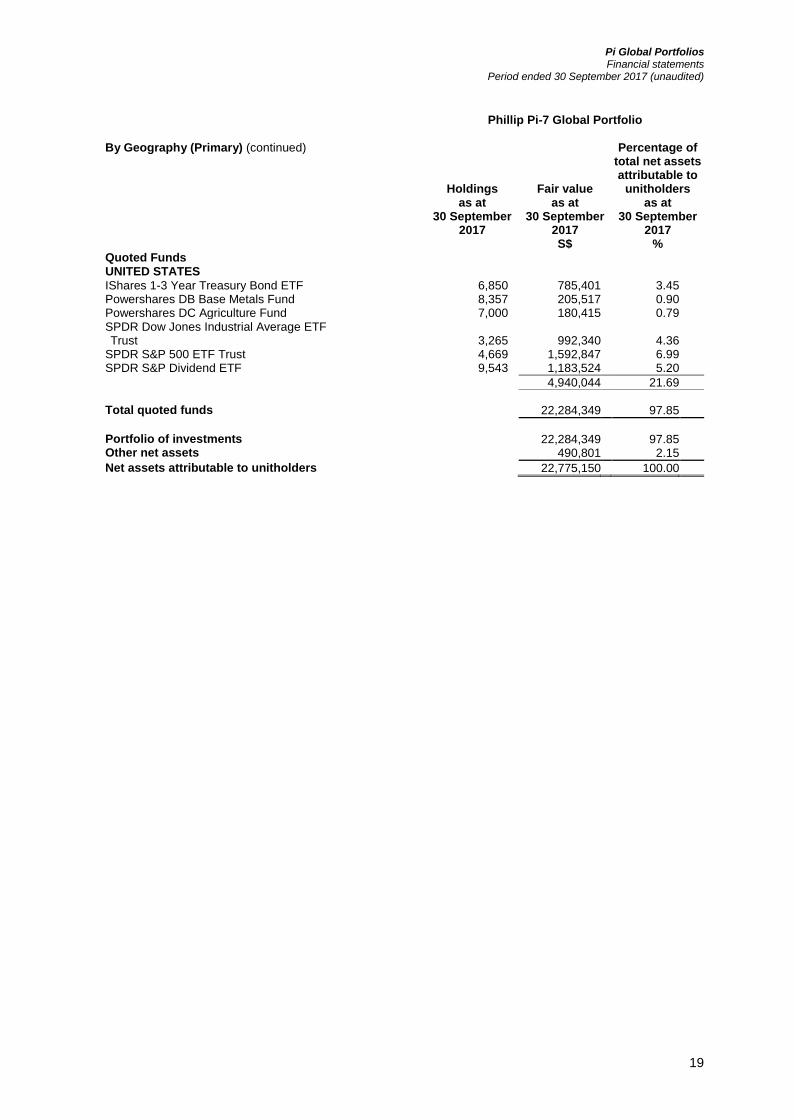
Phillip Pi-7 Global Portfolio By Geography (Primary) (continued)
Holdings as at
30 September 2017
Fair value as at
30 September 2017
Percentage of total net assets attributable to
unitholders as at
30 September 2017
S$ % Quoted Funds
19
UNITED STATES IShares 1-3 Year Treasury Bond ETF 6,850 785,401 3.45 Powershares DB Base Metals Fund 8,357 205,517 0.90 Powershares DC Agriculture Fund 7,000 180,415 0.79 SPDR Dow Jones Industrial Average ETF Trust 3,265 992,340 4.36 SPDR S&P 500 ETF Trust 4,669 1,592,847 6.99 SPDR S&P Dividend ETF 9,543 1,183,524 5.20
4,940,044 21.69
Total quoted funds 22,284,349 97.85
Portfolio of investments 22,284,349 97.85 Other net assets 490,801 2.15
Net assets attributable to unitholders 22,775,150 100.00
Pi Global Portfolios Financial statements
Period ended 30 September 2017 (unaudited)
Statements of Portfolio As at 30 September 2017
20
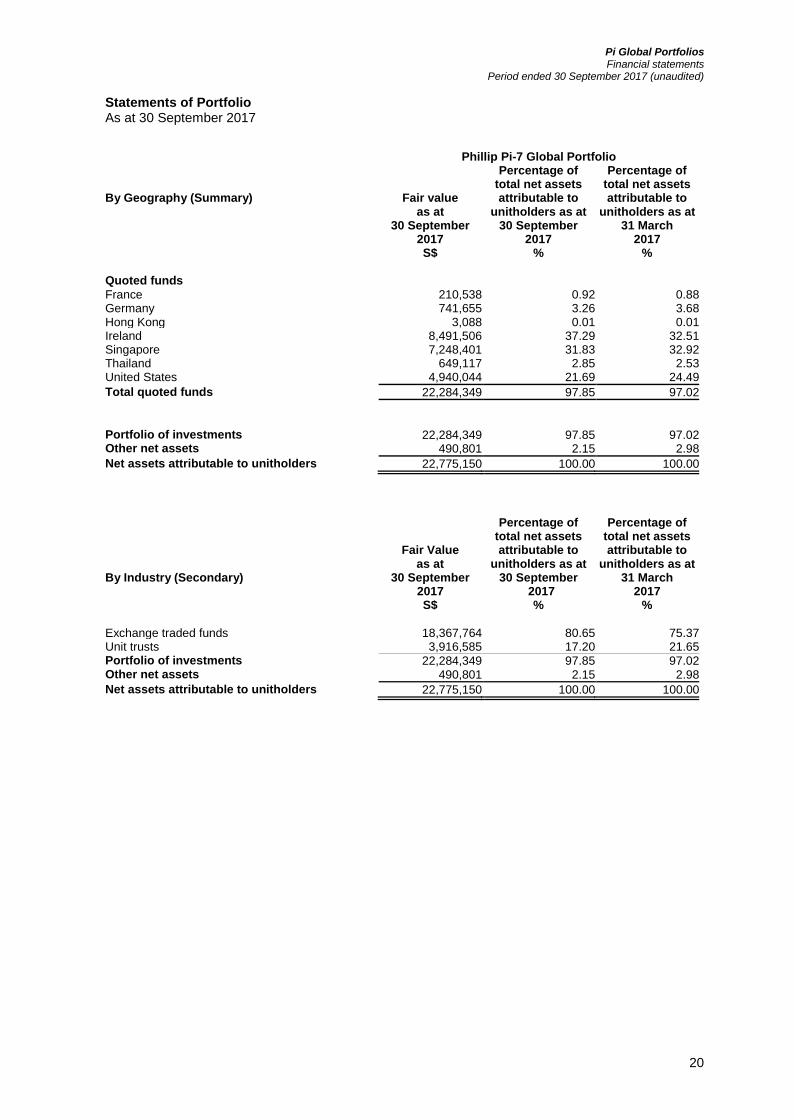
Phillip Pi-7 Global Portfolio
By Geography (Summary)
Fair value as at
30 September 2017
Percentage of total net assets attributable to
unitholders as at 30 September
2017
Percentage of total net assets attributable to
unitholders as at 31 March
2017 S$ % %
Quoted funds France 210,538 0.92 0.88 Germany 741,655 3.26 3.68 Hong Kong 3,088 0.01 0.01 Ireland 8,491,506 37.29 32.51 Singapore 7,248,401 31.83 32.92 Thailand 649,117 2.85 2.53 United States 4,940,044 21.69 24.49
Total quoted funds 22,284,349 97.85 97.02
Portfolio of investments 22,284,349 97.85 97.02 Other net assets 490,801 2.15 2.98
Net assets attributable to unitholders 22,775,150 100.00 100.00
By Industry (Secondary)
Fair Value as at
30 September 2017
Percentage of total net assets attributable to
unitholders as at 30 September
2017
Percentage of total net assets attributable to
unitholders as at 31 March
2017 S$ % %
Exchange traded funds 18,367,764 80.65 75.37 Unit trusts 3,916,585 17.20 21.65 Portfolio of investments 22,284,349 97.85 97.02 Other net assets 490,801 2.15 2.98
Net assets attributable to unitholders 22,775,150 100.00 100.00
Pi Global Portfolios Financial statements
Period ended 30 September 2017 (unaudited)
21
IMPORTANT INFORMATION
Pi-5 Global Portfolio and Pi-7 Global Portfolio (the “Sub-Funds”) are sub-funds of Pi Global Portfolios (the "Fund"), an open-ended umbrella unit trust authorised under the Securities and Futures Act, Chapter 289, by the Monetary Authority of Singapore. This document is published by Phillip Capital Management (S) Ltd, the manager of the Fund (the “Manager”), for information only and it does not constitute a prospectus nor form part of any offer or invitation to subscribe for or to purchase, or solicitation of any offer to subscribe for or to purchase, any units in the Sub-Funds. All applications for units in the Sub-Funds must be made on the application forms accompanying the latest prospectus of the Fund (the “Prospectus”). The information and opinions contained in this document have been obtained from public sources which the Manager believes to be reliable and accurate. However, no representation or warranty, express or implied, is made as to the fairness, accuracy, completeness or correctness of the information and it should not be relied upon as such. Opinions included herein constitute the judgement of the Manager at the time specified and may be subject to change without notice, they are not to be relied upon as authoritative or taken in substitution for the exercise of judgment by any recipient and are not intended to provide the sole basis of evaluation of any investment. Neither the Manager nor the Fund, nor any of their respective associates, directors, officers or employees, accepts any liability whatsoever for any loss arising directly or indirectly from any use of this document or any information contained herein. Given the economic and market risks, there can be no assurance that the Sub-Funds will achieve their investment objectives. Investments in the Sub-Funds are not deposits or other obligations of, or guaranteed, or insured by the Manager or the distributors or their affiliates and are subject to investment risks, including the possible loss of the full principal amount invested. Returns may be affected by, among other things, the investment strategies or objectives of the Sub-Funds and material market and economic conditions. The value of the units and the income from them can fall as well as rise. Past performance is not necessarily indicative of the future performance of the Sub-Funds. This document should not be taken as a recommendation to buy or sell since it does not take into account the specific investment objectives, financial situation and the particular needs of any particular recipient of this document. Investors should seek advice from a financial advisor before purchasing units in the Sub-Funds. In any case, investors should read the Prospectus and consider the risks as well as suitability of the Sub-Funds before deciding whether to subscribe for units in the Sub-Funds. Copies of the Prospectus are available and may be obtained from the Manager.