Embed Size (px)
DESCRIPTION
In the latest semi-annual report of Notenstein Private Bank you will find our key figures and explanatory notes on our business results.
Citation preview
2015
Semi-annual report
Review of business results
2
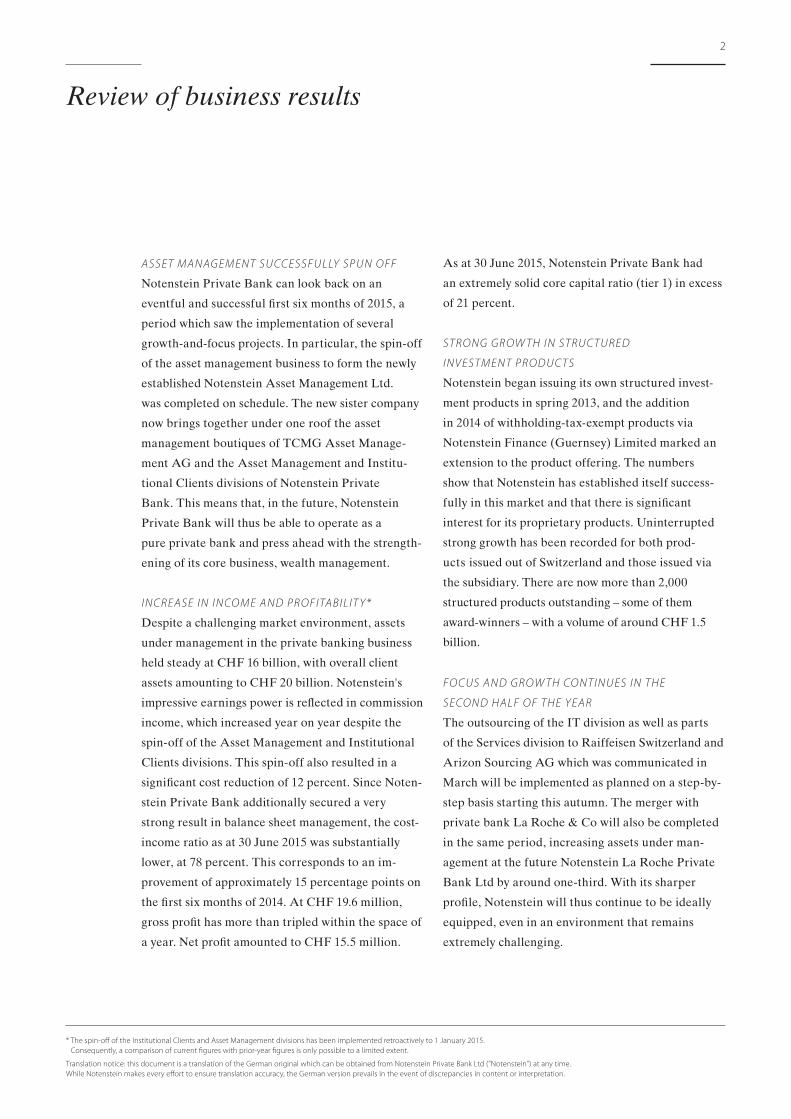
ASSET MAN AGE ME N T SU CC E SSFU LLY S PUN OFF
Notenstein Private Bank can look back on an
eventful and successful first six months of 2015, a
period which saw the implementation of several
growth-and-focus projects. In particular, the spin-off
of the asset management business to form the newly
established Notenstein Asset Management Ltd.
was completed on schedule. The new sister company
now brings together under one roof the asset
management boutiques of TCMG Asset Manage-
ment AG and the Asset Management and Institu-
tional Clients divisions of Notenstein Private
Bank. This means that, in the future, Notenstein
Private Bank will thus be able to operate as a
pure private bank and press ahead with the strength-
ening of its core business, wealth management.
INCRE ASE I N I N CO ME A N D PR O FI TABIL IT Y*
Despite a challenging market environment, assets
under management in the private banking business
held steady at CHF 16 billion, with overall client
assets amounting to CHF 20 billion. Notenstein's
impressive earnings power is reflected in commission
income, which increased year on year despite the
spin-off of the Asset Management and Institutional
Clients divisions. This spin-off also resulted in a
significant cost reduction of 12 percent. Since Noten-
stein Private Bank additionally secured a very
strong result in balance sheet management, the cost-
income ratio as at 30 June 2015 was substantially
lower, at 78 percent. This corresponds to an im-
provement of approximately 15 percentage points on
the first six months of 2014. At CHF 19.6 million,
gross profit has more than tripled within the space of
a year. Net profit amounted to CHF 15.5 million.
As at 30 June 2015, Notenstein Private Bank had
an extremely solid core capital ratio (tier 1) in excess
of 21 percent.
S TR ONG GR O W TH IN S TRUCTURED
INV ES TMENT PR ODUCT S
Notenstein began issuing its own structured invest-
ment products in spring 2013, and the addition
in 2014 of withholding-tax-exempt products via
Notenstein Finance (Guernsey) Limited marked an
extension to the product offering. The numbers
show that Notenstein has established itself success-
fully in this market and that there is significant
interest for its proprietary products. Uninterrupted
strong growth has been recorded for both prod-
ucts issued out of Switzerland and those issued via
the subsidiary. There are now more than 2,000
structured products outstanding – some of them
award-winners – with a volume of around CHF 1.5
billion.
FOCUS AND GR O W TH CONTINUES IN THE
S ECOND HALF OF THE YEAR
The outsourcing of the IT division as well as parts
of the Services division to Raiffeisen Switzerland and
Arizon Sourcing AG which was communicated in
March will be implemented as planned on a step-by-
step basis starting this autumn. The merger with
private bank La Roche & Co will also be completed
in the same period, increasing assets under man-
agement at the future Notenstein La Roche Private
Bank Ltd by around one-third. With its sharper
profile, Notenstein will thus continue to be ideally
equipped, even in an environment that remains
extremely challenging.
* The spin-off of the Institutional Clients and Asset Management divisions has been implemented retroactively to 1 January 2015. Consequently, a comparison of current figures with prior-year figures is only possible to a limited extent.
Translation notice: this document is a translation of the German original which can be obtained from Notenstein Private Bank Ltd ("Notenstein") at any time. While Notenstein makes every effort to ensure translation accuracy, the German version prevails in the event of discrepancies in content or interpretation.
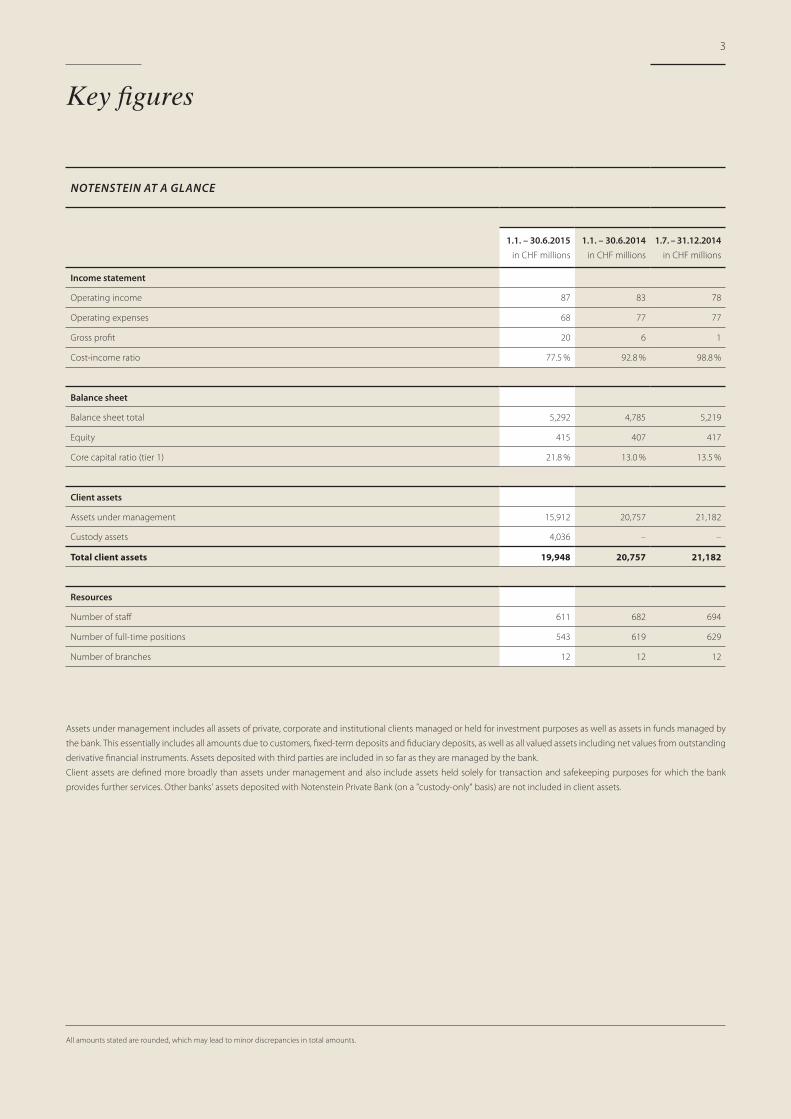
Key figures
NOTENSTEIN AT A GLANCE
1.1. – 30.6.2015
in CHF millions
1.1. – 30.6.2014
in CHF millions
1.7. – 31.12.2014
in CHF millions
Income statement
Operating income 87 83 78
Operating expenses 68 77 77
Gross profit 20 6 1
Cost-income ratio 77.5 % 92.8 % 98.8 %
Balance sheet
Balance sheet total 5,292 4,785 5,219
Equity 415 407 417
Core capital ratio (tier 1) 21.8 % 13.0 % 13.5 %
Client assets
Assets under management 15,912 20,757 21,182
Custody assets 4,036 – –
Total client assets 19,948 20,757 21,182
Resources
Number of staff 611 682 694
Number of full-time positions 543 619 629
Number of branches 12 12 12
3
All amounts stated are rounded, which may lead to minor discrepancies in total amounts.
Assets under management includes all assets of private, corporate and institutional clients managed or held for investment purposes as well as assets in funds managed by
the bank. This essentially includes all amounts due to customers, fixed-term deposits and fiduciary deposits, as well as all valued assets including net values from outstanding
derivative financial instruments. Assets deposited with third parties are included in so far as they are managed by the bank.
Client assets are defined more broadly than assets under management and also include assets held solely for transaction and safekeeping purposes for which the bank
provides further services. Other banks' assets deposited with Notenstein Private Bank (on a "custody-only" basis) are not included in client assets.
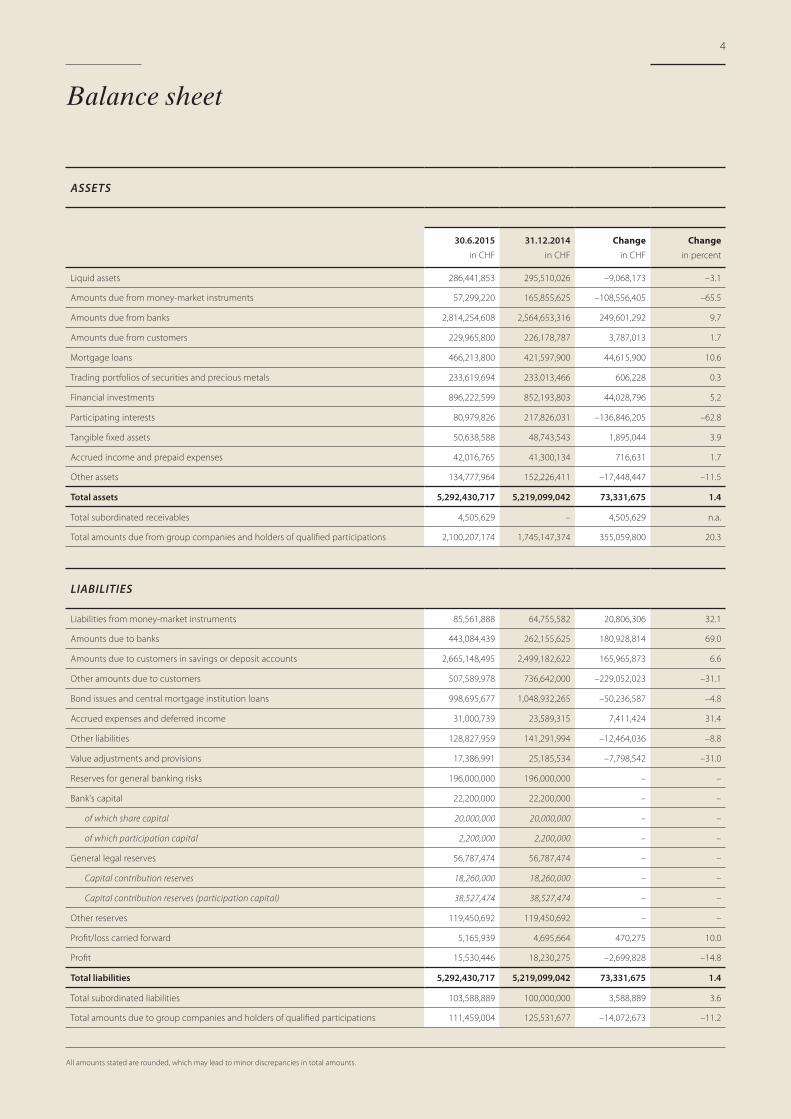
4
ASSETS
30.6.2015
in CHF
31.12.2014
in CHF
Changein CHF
Changein percent
Liquid assets 286,441,853 295,510,026 –9,068,173 –3.1
Amounts due from money-market instruments 57,299,220 165,855,625 –108,556,405 –65.5
Amounts due from banks 2,814,254,608 2,564,653,316 249,601,292 9.7
Amounts due from customers 229,965,800 226,178,787 3,787,013 1.7
Mortgage loans 466,213,800 421,597,900 44,615,900 10.6
Trading portfolios of securities and precious metals 233,619,694 233,013,466 606,228 0.3
Financial investments 896,222,599 852,193,803 44,028,796 5.2
Participating interests 80,979,826 217,826,031 –136,846,205 –62.8
Tangible fixed assets 50,638,588 48,743,543 1,895,044 3.9
Accrued income and prepaid expenses 42,016,765 41,300,134 716,631 1.7
Other assets 134,777,964 152,226,411 –17,448,447 –11.5
Total assets 5,292,430,717 5,219,099,042 73,331,675 1.4
Total subordinated receivables 4,505,629 – 4,505,629 n.a.
Total amounts due from group companies and holders of qualified participations 2,100,207,174 1,745,147,374 355,059,800 20.3
LIABILITIES
Liabilities from money-market instruments 85,561,888 64,755,582 20,806,306 32.1
Amounts due to banks 443,084,439 262,155,625 180,928,814 69.0
Amounts due to customers in savings or deposit accounts 2,665,148,495 2,499,182,622 165,965,873 6.6
Other amounts due to customers 507,589,978 736,642,000 –229,052,023 –31.1
Bond issues and central mortgage institution loans 998,695,677 1,048,932,265 –50,236,587 –4.8
Accrued expenses and deferred income 31,000,739 23,589,315 7,411,424 31.4
Other liabilities 128,827,959 141,291,994 –12,464,036 –8.8
Value adjustments and provisions 17,386,991 25,185,534 –7,798,542 –31.0
Reserves for general banking risks 196,000,000 196,000,000 – –
Bank's capital 22,200,000 22,200,000 – –
of which share capital 20,000,000 20,000,000 – –
of which participation capital 2,200,000 2,200,000 – –
General legal reserves 56,787,474 56,787,474 – –
Capital contribution reserves 18,260,000 18,260,000 – –
Capital contribution reserves (participation capital) 38,527,474 38,527,474 – –
Other reserves 119,450,692 119,450,692 – –
Profit/loss carried forward 5,165,939 4,695,664 470,275 10.0
Profit 15,530,446 18,230,275 –2,699,828 –14.8
Total liabilities 5,292,430,717 5,219,099,042 73,331,675 1.4
Total subordinated liabilities 103,588,889 100,000,000 3,588,889 3.6
Total amounts due to group companies and holders of qualified participations 111,459,004 125,531,677 –14,072,673 –11.2
Balance sheet
All amounts stated are rounded, which may lead to minor discrepancies in total amounts.
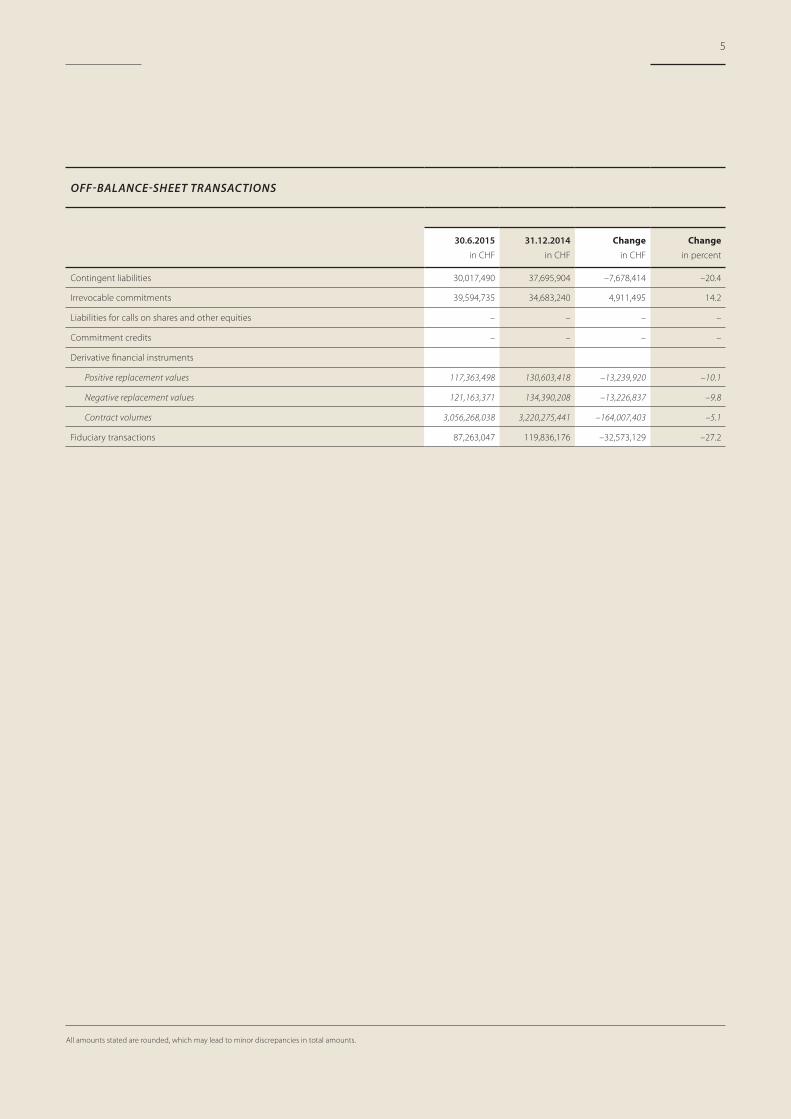
5
OFF-BALANCE-SHEET TRANSACTIONS
30.6.2015
in CHF
31.12.2014
in CHF
Changein CHF
Changein percent
Contingent liabilities 30,017,490 37,695,904 –7,678,414 –20.4
Irrevocable commitments 39,594,735 34,683,240 4,911,495 14.2
Liabilities for calls on shares and other equities – – – –
Commitment credits – – – –
Derivative financial instruments
Positive replacement values 117,363,498 130,603,418 –13,239,920 –10.1
Negative replacement values 121,163,371 134,390,208 –13,226,837 –9.8
Contract volumes 3,056,268,038 3,220,275,441 –164,007,403 –5.1
Fiduciary transactions 87,263,047 119,836,176 –32,573,129 –27.2
All amounts stated are rounded, which may lead to minor discrepancies in total amounts.
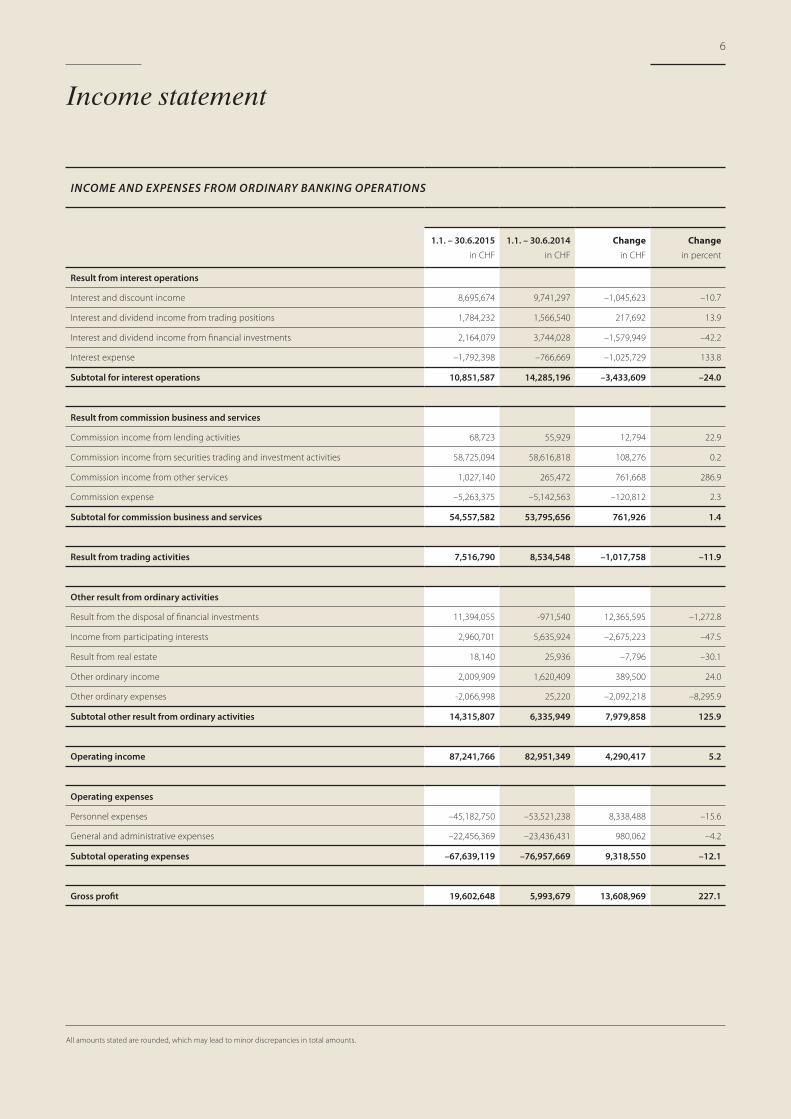
6
INCOME AND EXPENSES FROM ORDINARY BANKING OPERATIONS
1.1. – 30.6.2015
in CHF
1.1. – 30.6.2014
in CHF
Changein CHF
Changein percent
Result from interest operations
Interest and discount income 8,695,674 9,741,297 –1,045,623 –10.7
Interest and dividend income from trading positions 1,784,232 1,566,540 217,692 13.9
Interest and dividend income from financial investments 2,164,079 3,744,028 –1,579,949 –42.2
Interest expense –1,792,398 –766,669 –1,025,729 133.8
Subtotal for interest operations 10,851,587 14,285,196 –3,433,609 –24.0
Result from commission business and services
Commission income from lending activities 68,723 55,929 12,794 22.9
Commission income from securities trading and investment activities 58,725,094 58,616,818 108,276 0.2
Commission income from other services 1,027,140 265,472 761,668 286.9
Commission expense –5,263,375 –5,142,563 –120,812 2.3
Subtotal for commission business and services 54,557,582 53,795,656 761,926 1.4
Result from trading activities 7,516,790 8,534,548 –1,017,758 –11.9
Other result from ordinary activities
Result from the disposal of financial investments 11,394,055 -971,540 12,365,595 –1,272.8
Income from participating interests 2,960,701 5,635,924 –2,675,223 –47.5
Result from real estate 18,140 25,936 –7,796 –30.1
Other ordinary income 2,009,909 1,620,409 389,500 24.0
Other ordinary expenses -2,066,998 25,220 –2,092,218 –8,295.9
Subtotal other result from ordinary activities 14,315,807 6,335,949 7,979,858 125.9
Operating income 87,241,766 82,951,349 4,290,417 5.2
Operating expenses
Personnel expenses –45,182,750 –53,521,238 8,338,488 –15.6
General and administrative expenses –22,456,369 –23,436,431 980,062 –4.2
Subtotal operating expenses –67,639,119 –76,957,669 9,318,550 –12.1
Gross profit 19,602,648 5,993,679 13,608,969 227.1
Income statement
All amounts stated are rounded, which may lead to minor discrepancies in total amounts.
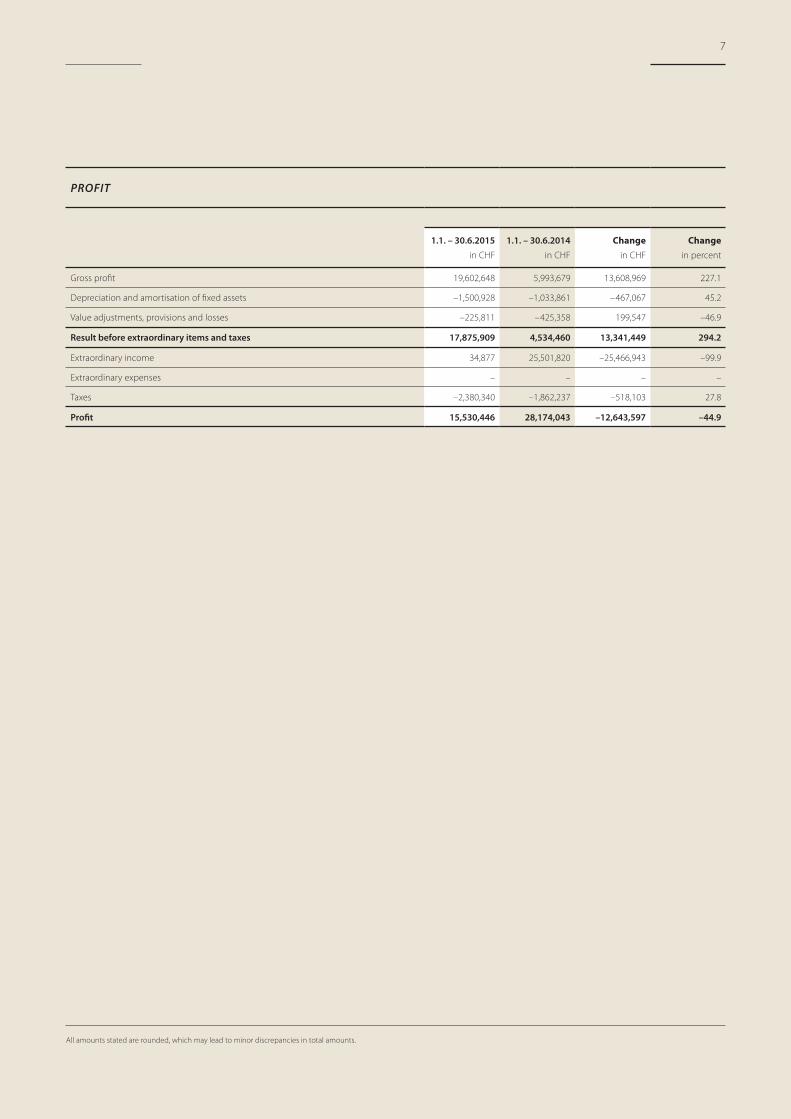
7
PROFIT
1.1. – 30.6.2015
in CHF
1.1. – 30.6.2014
in CHF
Changein CHF
Changein percent
Gross profit 19,602,648 5,993,679 13,608,969 227.1
Depreciation and amortisation of fixed assets –1,500,928 –1,033,861 –467,067 45.2
Value adjustments, provisions and losses –225,811 –425,358 199,547 –46.9
Result before extraordinary items and taxes 17,875,909 4,534,460 13,341,449 294.2
Extraordinary income 34,877 25,501,820 –25,466,943 –99.9
Extraordinary expenses – – – –
Taxes –2,380,340 –1,862,237 –518,103 27.8
Profit 15,530,446 28,174,043 –12,643,597 –44.9
All amounts stated are rounded, which may lead to minor discrepancies in total amounts.

8
B A S E L , 4051
Freie Strasse 90
Telephone +41 (0)61 201 17 17
B E R N E , 3 0 1 1
Spitalgasse 3
Telephone +41 (0)31 321 14 14
C H U R , 7 0 0 2
Aquasanastrasse 8
Telephone +41 (0)81 287 15 15
G E N E VA , 1 2 1 1
Bd Georges-Favon 5
Telephone +41 (0)22 307 21 21
L A U S A N N E , 1 0 0 1
Av. du Théâtre 1
Telephone +41 (0)21 313 26 26
LO C A R N O, 6 6 0 0
Lungolago Motta 2
Telephone +41 (0)91 756 12 12
N O T E N S T E I N P R I VAT E B A N k LT D
Bohl 17, 9004 St.Gallen, telephone +41 (0)71 242 50 00, fax +41 (0)71 242 50 50
[email protected], www.notenstein.ch
LU G A N O, 6 9 0 0
Via Canova 12
Telephone +41 (0)91 912 11 11
LU C E R N E , 6 0 0 4
Mühlenplatz 9
Telephone +41 (0)41 227 16 16
S C H A F F H A U S E N , 8 2 0 1
Fronwagplatz 22
Telephone +41 (0)52 630 18 18
W I N T E R T H U R , 8 4 0 1
Turnerstrasse 1
Telephone +41 (0)52 742 24 24
Z U R I C H , 8 0 2 2
Rennweg 57/Fraumünsterstrasse 27
Telephone +41 (0)44 218 13 13
Contact

N O T E N S T E I N P R I VAT E B A N K LT D
S T. G A L L E N B A S E L B E R N E C H U R G E N E VA L A U S A N N E L O C A R N O
L U C E R N E L U G A N O S C H A F F H A U S E N W I N T E R T H U R Z U R I C H