Embed Size (px)
Citation preview
David Roland-Holst
University of California Berkeley
4 July 2014, 2:00 pm–3:30 pm
ADB Headquarters
Seminar Series on
Regional Economic Integration
Assessing the Impact of Regional
Integration on Productivity and
Income Inequality
Roland-Holst 2
A Schematic “Atlas” of World Trade
Source: WTO, EUR=EU27, ASI=Asia, NAX=N. America, MEA=M. East & N. Africa,
CIS=Former USSR, CSC=LAC
Roland-Holst 3
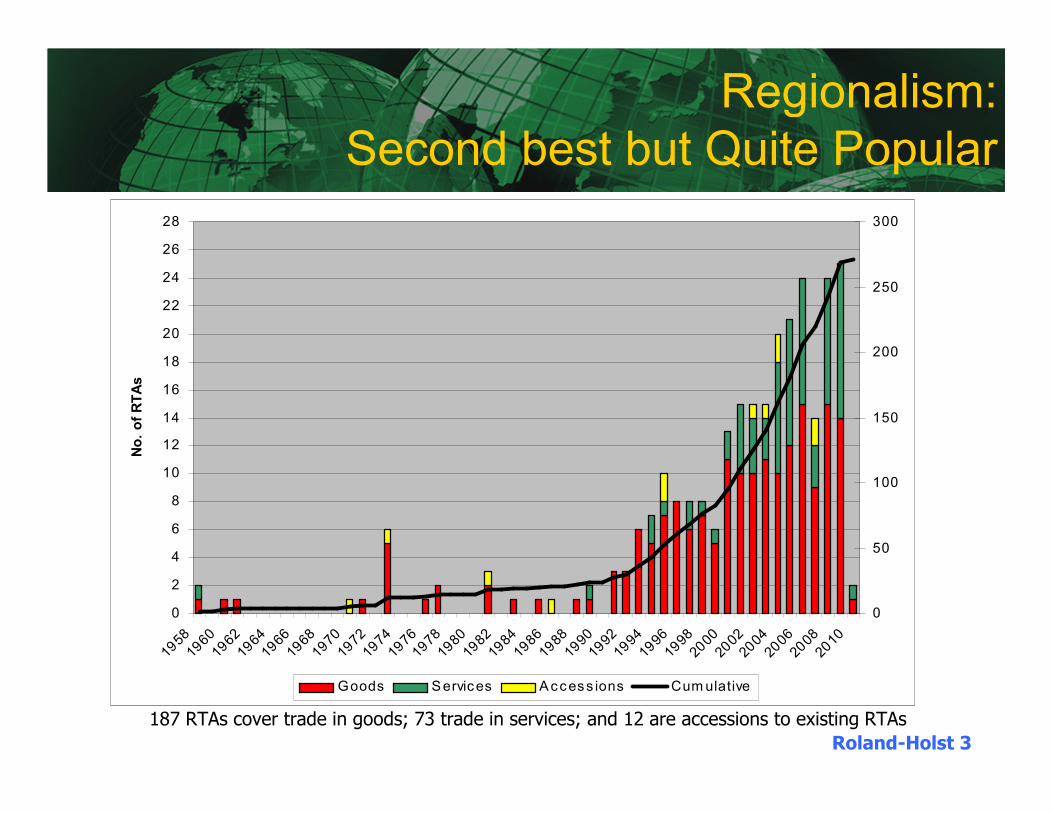
Regionalism:
Second best but Quite Popular
187 RTAs cover trade in goods; 73 trade in services; and 12 are accessions to existing RTAs
0
2
4
6
8
10
12
14
16
18
20
22
24
26
28
195819
6019
6219
6419
6619
6819
7019
7219
7419
7619
7819
8019
8219
8419
8619
8819
9019
9219
9419
9619
9820
0020
0220
0420
0620
0820
10
No. of RTAs
0
50
100
150
200
250
300
Goods Services Access ions Cumulative
Roland-Holst 4
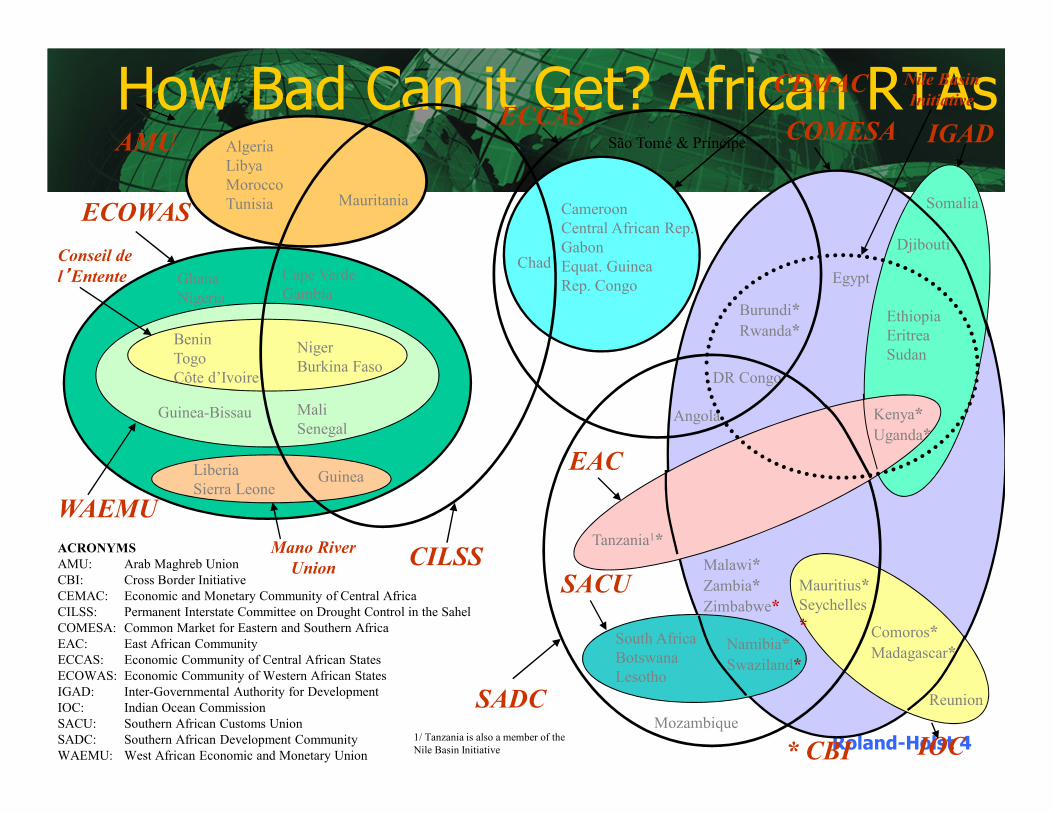
How Bad Can it Get? African RTAs
Ghana
Nigeria
AMU
ECOWAS
WAEMU
São Tomé & Príncipe
Egypt
Burundi*
Rwanda*
DR Congo
Malawi*
Zambia*
Zimbabwe*
Comoros*
Madagascar*
Mauritius*
Seychelles
*
ECCASCOMESA
SADC
SACU
CEMAC
Mano River
Union
IGAD
Mozambique
IOC
Tanzania1*
Kenya*
Uganda*
EAC
Ethiopia
Eritrea
Sudan
Somalia
South Africa
Botswana
Lesotho
Namibia*
Swaziland*
Liberia
Sierra Leone
Cameroon
Central African Rep.
Gabon
Equat. Guinea
Rep. Congo
ChadCape Verde
Gambia
Guinea-Bissau
Benin
Togo
Côte d’Ivoire
Niger
Burkina Faso
Mali
Senegal
Conseil de
l’’’’Entente
Guinea
CILSS
Angola
Nile Basin
Initiative
* CBI
Algeria
Libya
Morocco
Tunisia Mauritania
ACRONYMS
AMU: Arab Maghreb Union
CBI: Cross Border Initiative
CEMAC: Economic and Monetary Community of Central Africa
CILSS: Permanent Interstate Committee on Drought Control in the Sahel
COMESA: Common Market for Eastern and Southern Africa
EAC: East African Community
ECCAS: Economic Community of Central African States
ECOWAS: Economic Community of Western African States
IGAD: Inter-Governmental Authority for Development
IOC: Indian Ocean Commission
SACU: Southern African Customs Union
SADC: Southern African Development Community
WAEMU: West African Economic and Monetary Union
Reunion
Djibouti
1/ Tanzania is also a member of the
Nile Basin Initiative
Roland-Holst 5
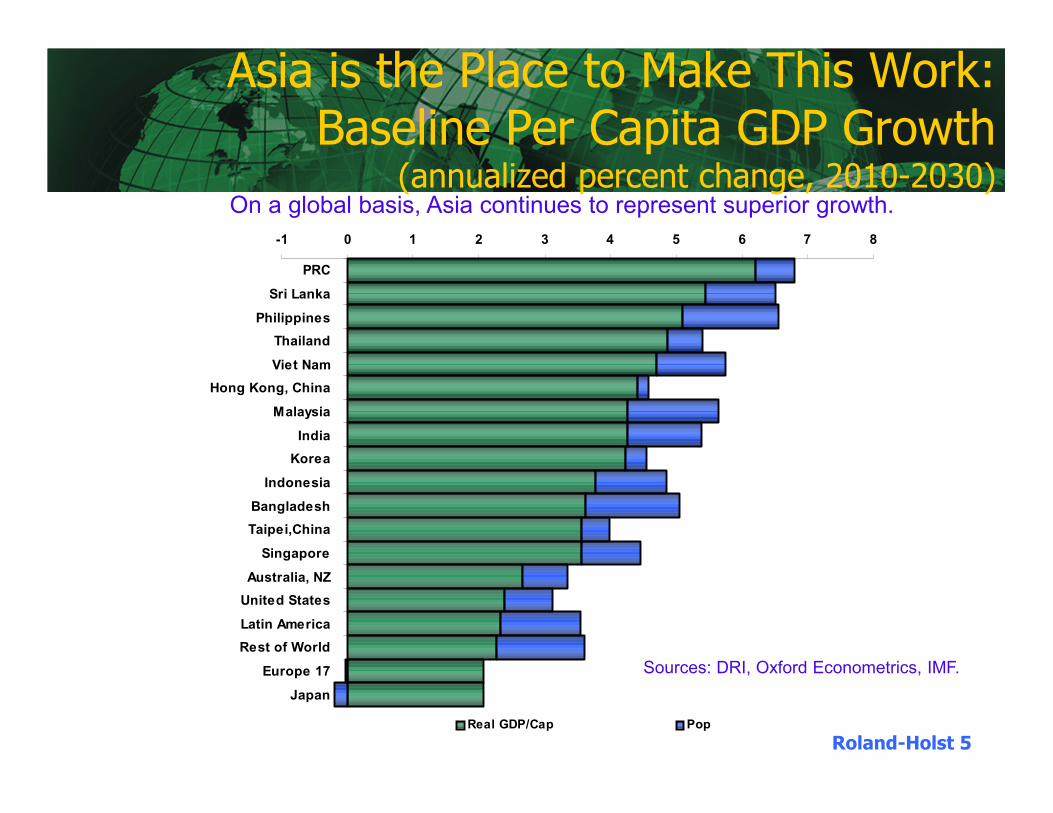
Asia is the Place to Make This Work:Baseline Per Capita GDP Growth
(annualized percent change, 2010-2030)
-1 0 1 2 3 4 5 6 7 8
PRC
Sri Lanka
Philippines
Thailand
Viet Nam
Hong Kong, China
Malaysia
India
Korea
Indonesia
Bangladesh
Taipei,China
Singapore
Australia, NZ
United States
Latin America
Rest of World
Europe 17
Japan
Real GDP/Cap Pop
On a global basis, Asia continues to represent superior growth.
Sources: DRI, Oxford Econometrics, IMF.
Roland-Holst 6
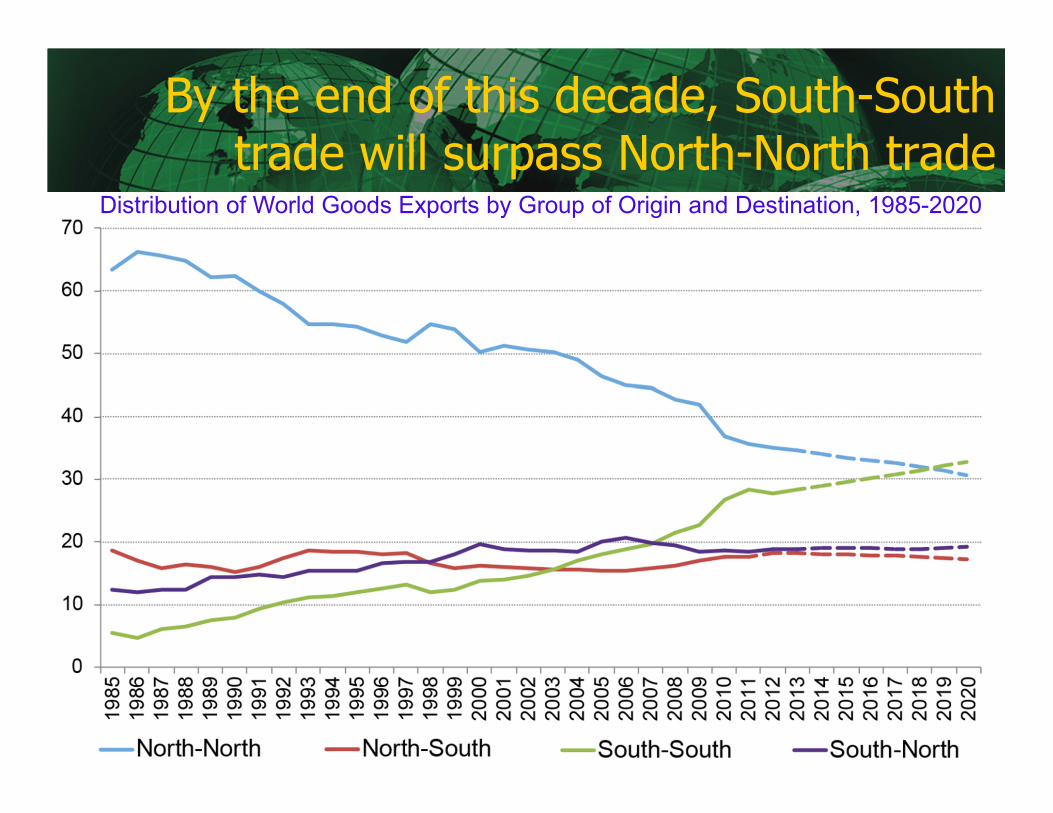
By the end of this decade, South-South trade will surpass North-North trade
Distribution of World Goods Exports by Group of Origin and Destination, 1985-2020
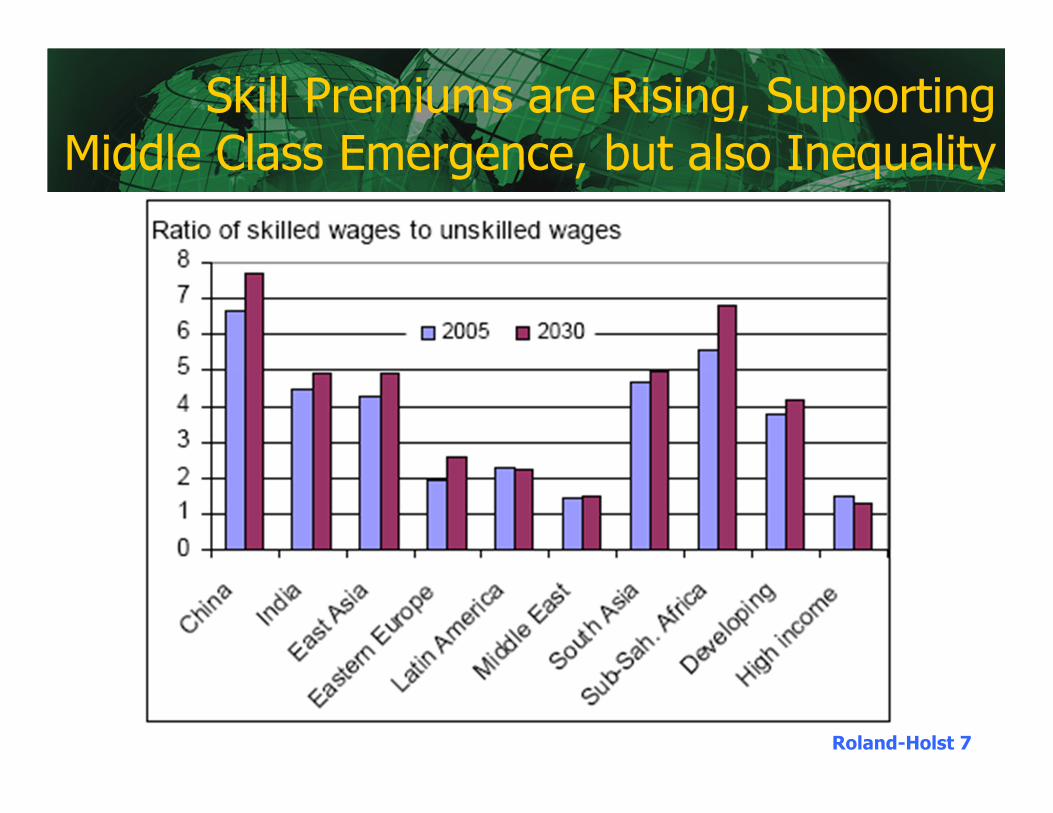
Roland-Holst 7
Skill Premiums are Rising, Supporting Middle Class Emergence, but also Inequality
Roland-Holst 8
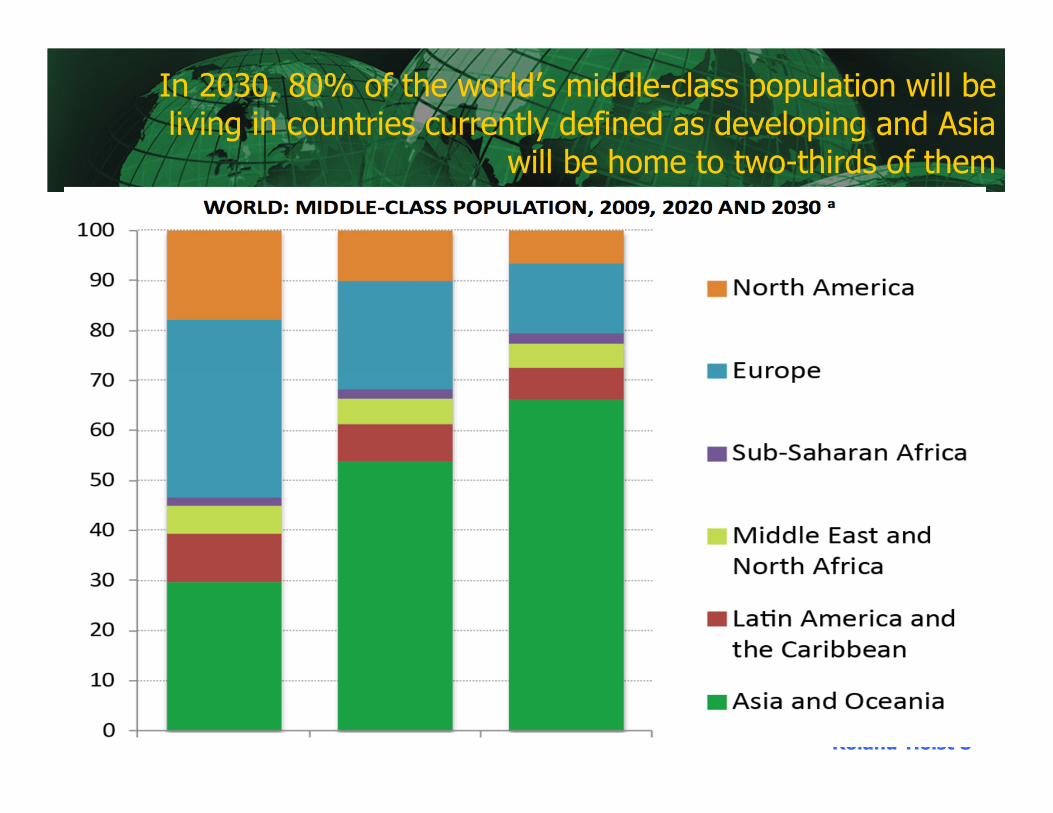
In 2030, 80% of the world’s middle-class population will be living in countries currently defined as developing and Asia
will be home to two-thirds of them
Roland-Holst 9
Regional Drivers of Growth/Incomes
• Trade – A potent historical growth catalyst for Asia
• Capital Mobility – Foreign direct investment (good) and portfolio investment (less popular)
• Labor Mobility – Domestic and international migration
Roland-Holst 10
Trade -> Growth
Over the last generation, global poverty has fallen and DC trade has increased sharply. What can we infer from this?• Dollar and co-authors– Washington Consensus – Openness promotes growth
• Kremer and Maskin (2006) – Undeniable correlation, but big differences in policy effectiveness
• Harrison et al (2007) – Country case studies, quite diverse, but generally supporting the growth hypothesis
Roland-Holst 11
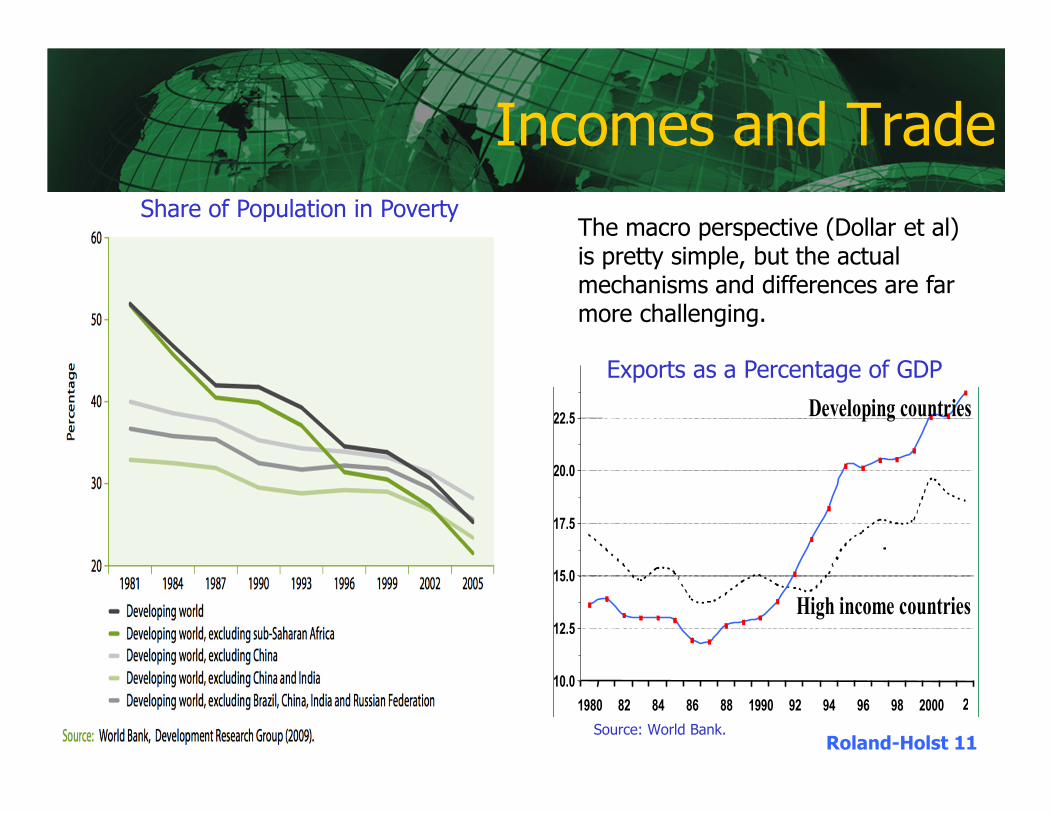
Incomes and Trade
Source: World Bank.
Exports as a Percentage of GDP
10.0
12.5
15.0
17.5
20.0
22.5
1980 82 84 86 88 1990 92 94 96 98 2000 2
Developing countries
High income countries
-
Share of Population in PovertyThe macro perspective (Dollar et al) is pretty simple, but the actual mechanisms and differences are far more challenging.
Roland-Holst 12
Conclusions from the Trade Research Literature
• Trade integration associated with higher growth, growth associated with poverty reduction, but no evidence of significant link between trade and poverty
• Trade and financial integration associated with rising inequality, higher consumption volatility in poor countries
• Simple interpretations of orthodox trade models are of limited relevance, however, it appears generally that� Poor in expanding (FDI/exporting) sectors gain � Poor in contracting (import-competing) sectors lose—largely a consequence of labor immobility
• Financial crises hurt the poor• Complementary policies are critical: trade policy must be part of a “package” of successful policies
Roland-Holst 13
Factor Mobility and Incomes
• FDI has generally been strongly associated with growth and aggregate income gains. Impacts on poverty and inequality are more complex.
• Migration is the most complex. It is associated both with growth and contraction, poverty and prosperity, inequality and convergence. This topic requires the most careful interpretation.
Roland-Holst 14
The Holy Trinity of FDI Benefits
In a world of mobile capital, the only justification for higher wages is higher labor productivity.
Three cardinal benefits of FDI contribute to higher MRP for labor (wages).
1. External savings – capital accumulation
2. Market access – improved terms of trade
3. Technology transfer – direct increases in output per worker
Roland-Holst 15
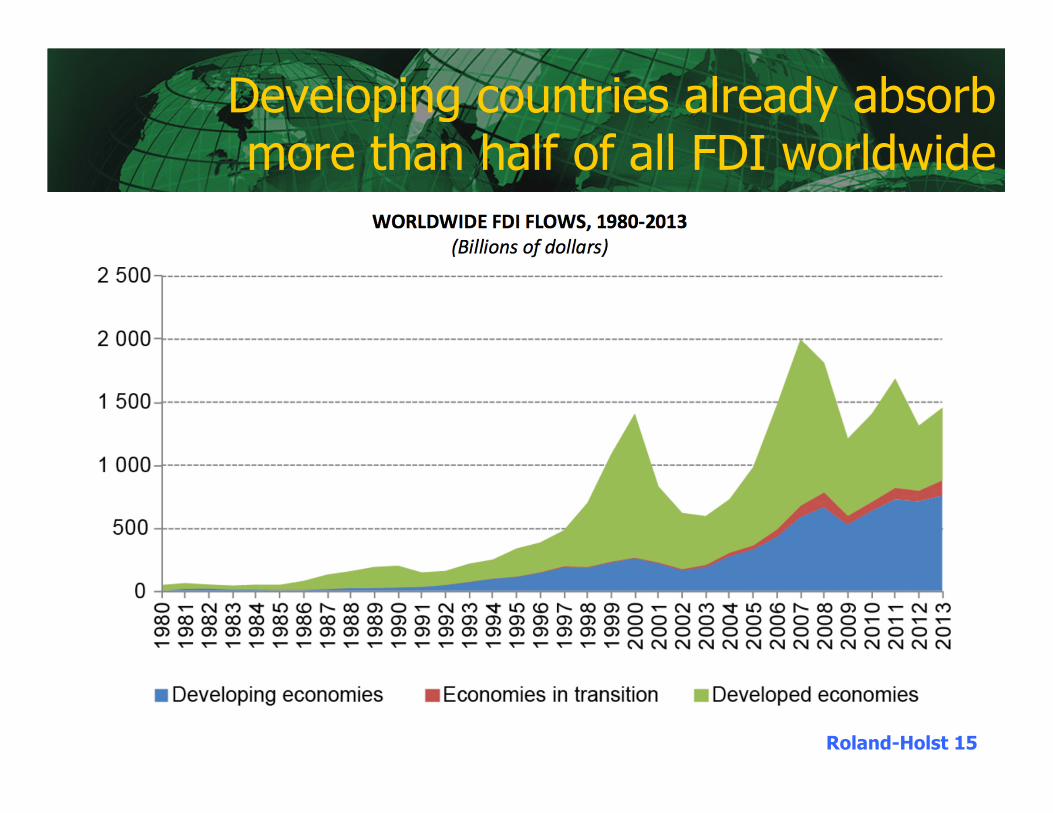
Developing countries already absorb more than half of all FDI worldwide
Roland-Holst 16
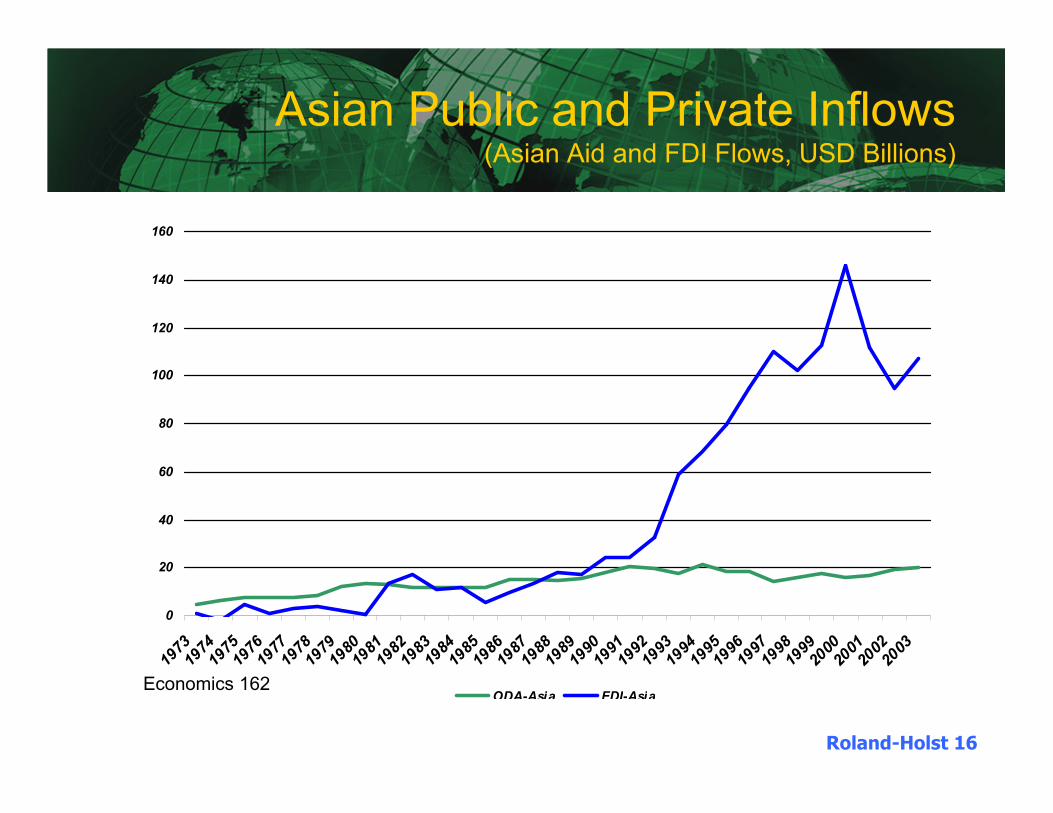
Asian Public and Private Inflows(Asian Aid and FDI Flows, USD Billions)
140
160
80
100
120
40
60
80
0
20
Roland-Holst
Economics 162
1973197419751976197719781979198019811982198319841985198619871988198919901991199219931994199519961997199819992000200120022003
ODA-Asia FDI-Asia
Roland-Holst 17
Technology and Innovation
• Technology can divide labor markets, generally it increases skill premiums and national income, but also inequality.
• Globally, innovation is less about invention than about technology adoption – doing things in a new way
• By this measure, innovation and productivity gains can propagate extensively via technology diffusion
Roland-Holst 18
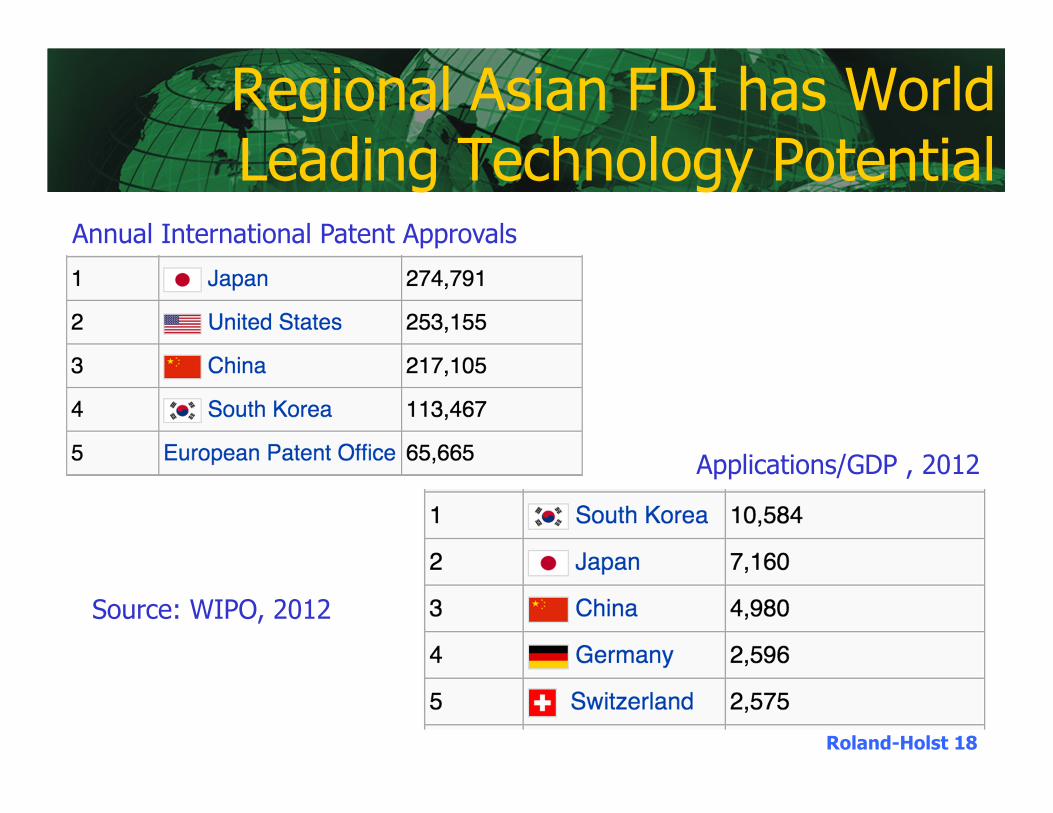
Regional Asian FDI has World Leading Technology Potential
Annual International Patent Approvals
Applications/GDP , 2012
Source: WIPO, 2012
Roland-Holst 19
Evidence on FDI’s Contribution
• Contribution to growth is uncontroversial
• Poverty reduction depends strongly on labor market complementarities and factor mobility (like trade).
• For skilled workers, evidence is dramatic. Very strong correlation between FDI and returns to education.
Roland-Holst 20
Risks and How to Mitigate Them
• Rural marginalization� Agrifood marketing – indirect participation in urban growth
� Migration
• Regional hierarchy: value-added ladders � Technology diffusion = local innovation� Convergence- this takes time
• National political economy� Market enlargement� Tech transfer again – joint ventures
Roland-Holst 21
• Asia will continue to develop it’s own approach to RCI. There are limits to the relevance of the EU example.
• In particular,
• Europe is much smaller geographically and more cohesive institutionally
• In Asia we are unlikely to see the kind of microeconomic management practiced in Brussels
• Promoting Western “competitiveness” has not been a leading national development strategy in Asia
• Pragmatism and market forces will be primary drivers, complemented by determined commitments to:
• National investment strategies
• Adherence to standards (technical and legal)
Conclusions from RCI Experience Elsewhere
Roland-Holst 22
Notes on “Soft Infrastructure”
• Much emphasis is given to physical infrastructure and its many direct and indirect services, but there is also a broad universe of “soft” infrastructure.
• Concentrated in national and multilateral public institutions, they constitute an essential element of trade facilitation.
• Trade negotiating institutions are only the most conspicuous members of a large family of institutions promoting more coherent market linkages and policy dialogue. In this context, Asian “OECD” policies can make important contributions.
• Another essential category is information services that support more effective public and private agency.
Roland-Holst 23
How ADB Can Help
1. Promote regional, evidence-based dialog
2. Propagate standards and indicators (e.g. MDGs, IDGs)
3. Promote capacity and commitment to
� Information sharing
� Modeling and scenario analysis
� Impact evaluation
Roland-Holst 24
Example of Information Services:Economic Modeling and Assessment
• Good precedence here – GTAP provides a solid foundation
• Regional Models (GMS, CAREC, etc.) can be consistently disaggregated into national models, supporting evidence-based domestic policy and regional dialog
• By establishing standards and capacity, ADB can contribute to, and participate in, this process directly
Roland-Holst 25
Regional Modeling Capacity - ADB
• A new CAREC regional model has been developed as part of TA-8259, Assisting The Central Asia Regional Economic Cooperation Institute Knowledge Program
• The most advanced, up-to-date, and detailed model of its kind.
• The current version has 19 countries/regions, up to 57 sectors
• Could be decomposed into individual member country models (TA-8259, Phase II)
• Results communication takes two forms:� Traditional technical reporting� A user-friendly data/results browsing app for dissemination to decision makers
Roland-Holst 26
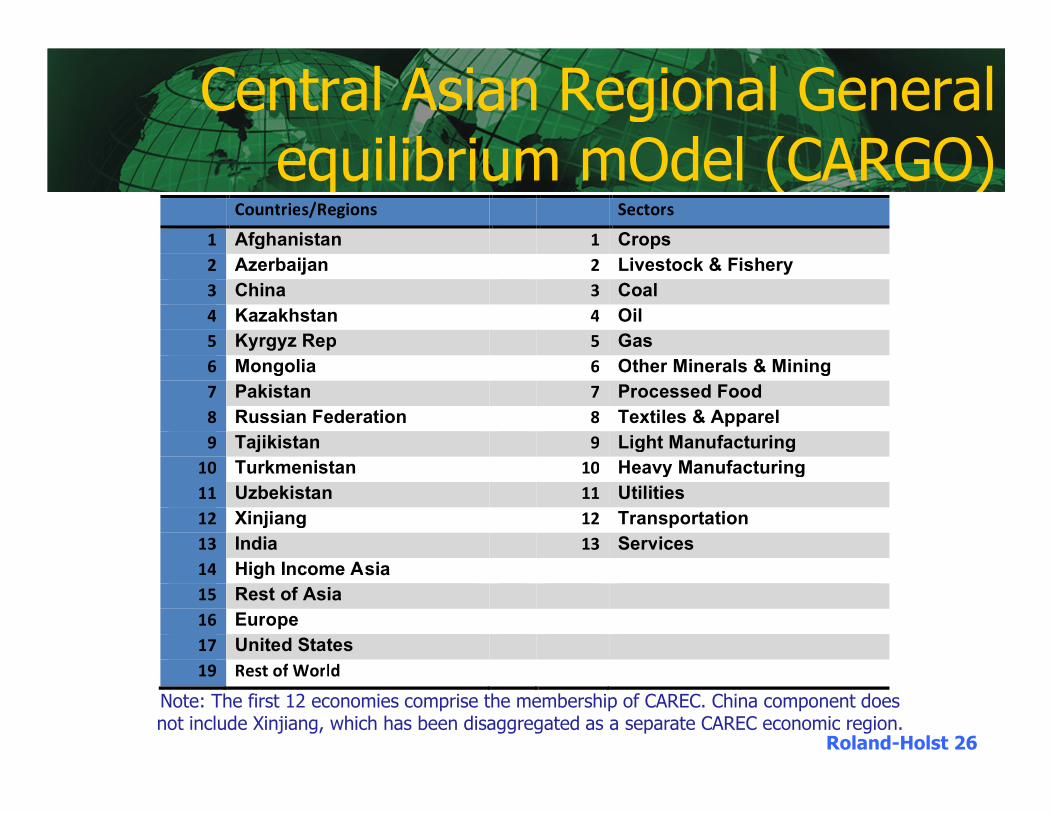
Central Asian Regional General equilibrium mOdel (CARGO)
Countries/Regions Sectors
1 Afghanistan 1 Crops
2 Azerbaijan 2 Livestock & Fishery
3 China 3 Coal
4 Kazakhstan 4 Oil
5 Kyrgyz Rep 5 Gas
6 Mongolia 6 Other Minerals & Mining
7 Pakistan 7 Processed Food
8 Russian Federation 8 Textiles & Apparel
9 Tajikistan 9 Light Manufacturing
10 Turkmenistan 10 Heavy Manufacturing
11 Uzbekistan 11 Utilities
12 Xinjiang 12 Transportation
13 India 13 Services
14 High Income Asia
15 Rest of Asia
16 Europe
17 United States
19 Rest of World
Note: The first 12 economies comprise the membership of CAREC. China component does not include Xinjiang, which has been disaggregated as a separate CAREC economic region.
Roland-Holst 27
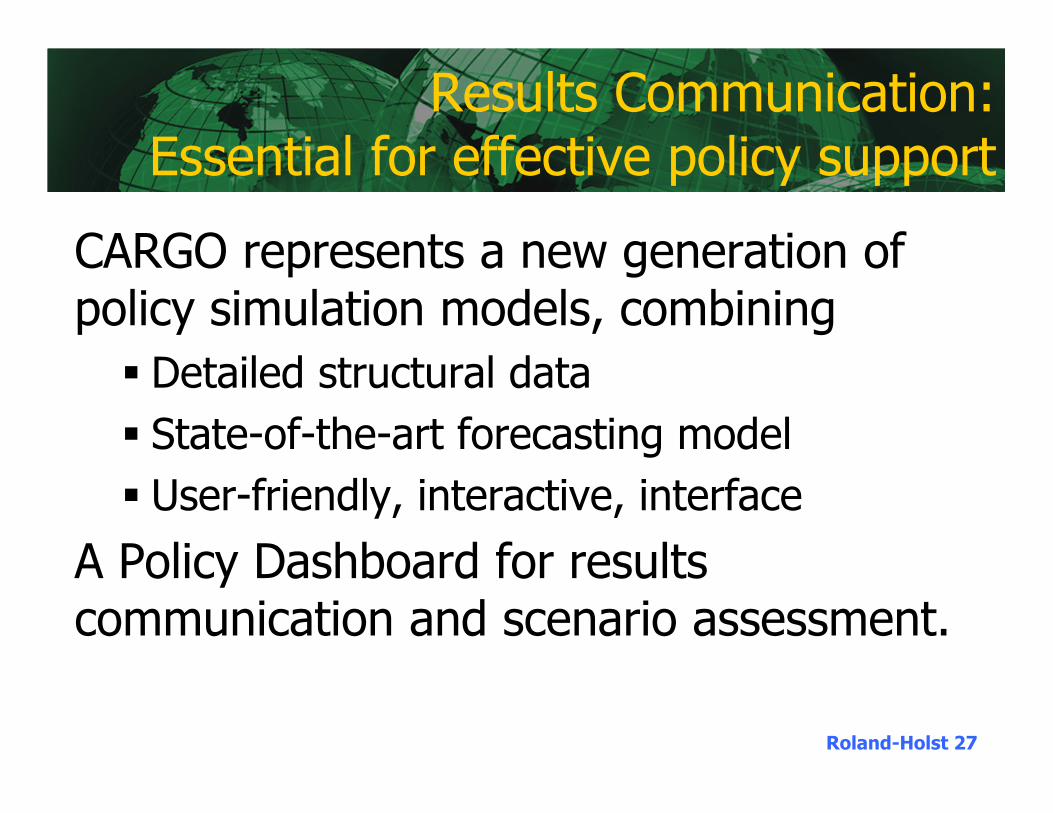
Results Communication:Essential for effective policy support
CARGO represents a new generation of policy simulation models, combining
� Detailed structural data
� State-of-the-art forecasting model
� User-friendly, interactive, interface
A Policy Dashboard for results communication and scenario assessment.
Roland-Holst 28
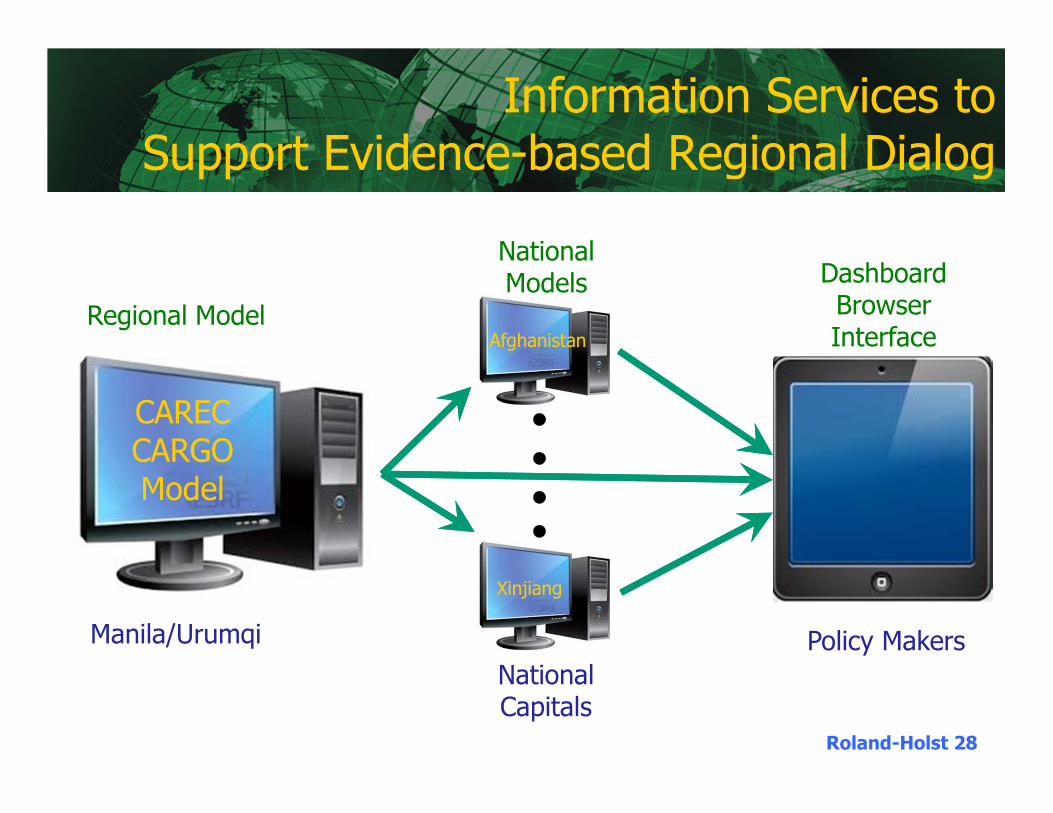
Information Services to Support Evidence-based Regional Dialog
CARECCARGOModel
Afghanistan
Xinjiang
Dashboard Browser Interface
National Models
Regional Model
Policy Makers
National Capitals
Manila/Urumqi
Roland-Holst 29
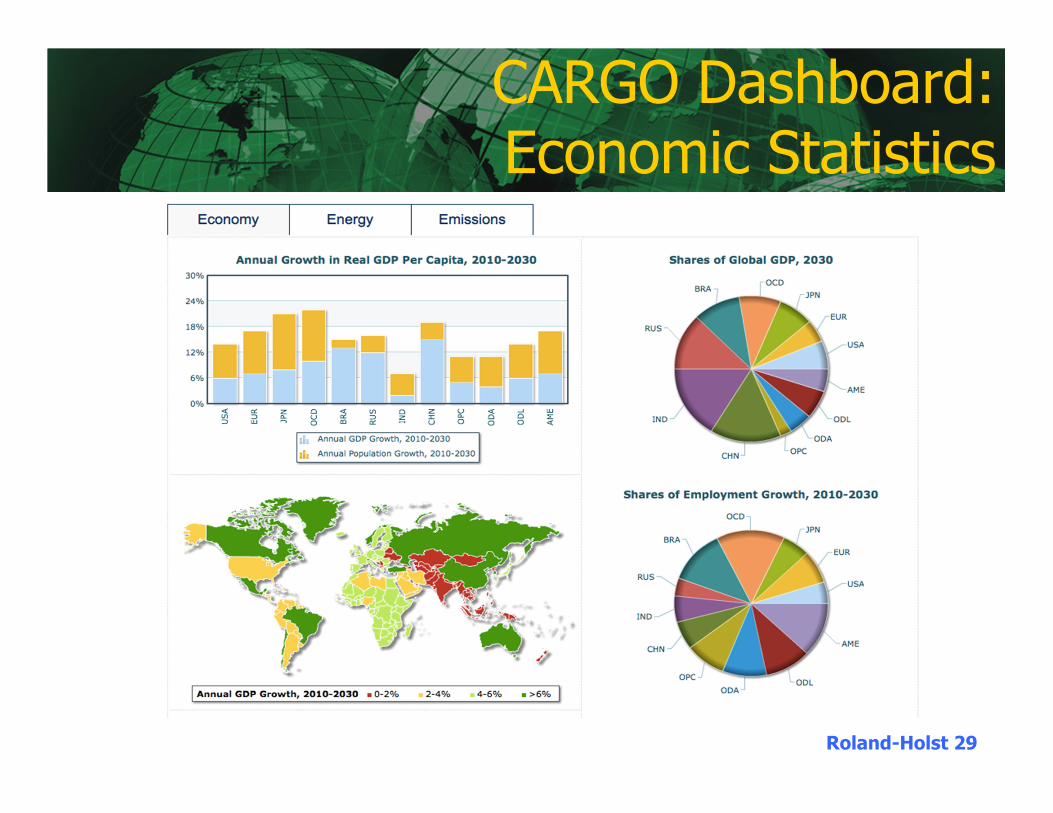
CARGO Dashboard:Economic Statistics
Roland-Holst 30
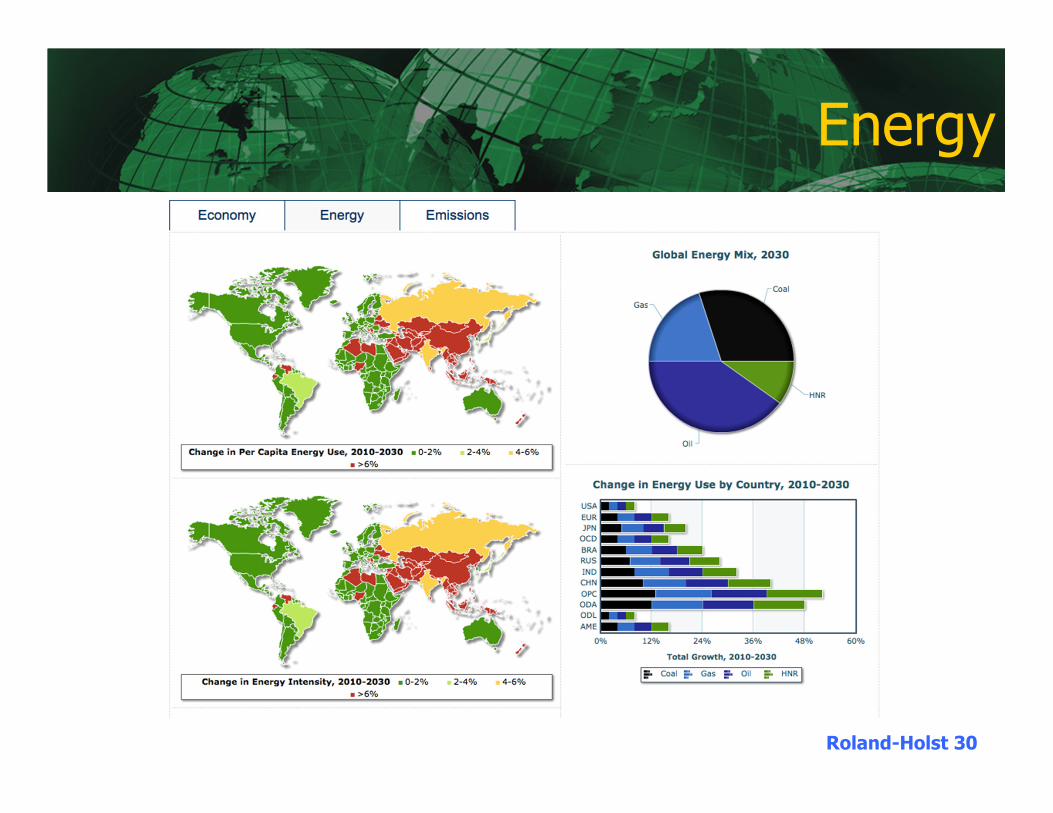
Energy
Roland-Holst 31
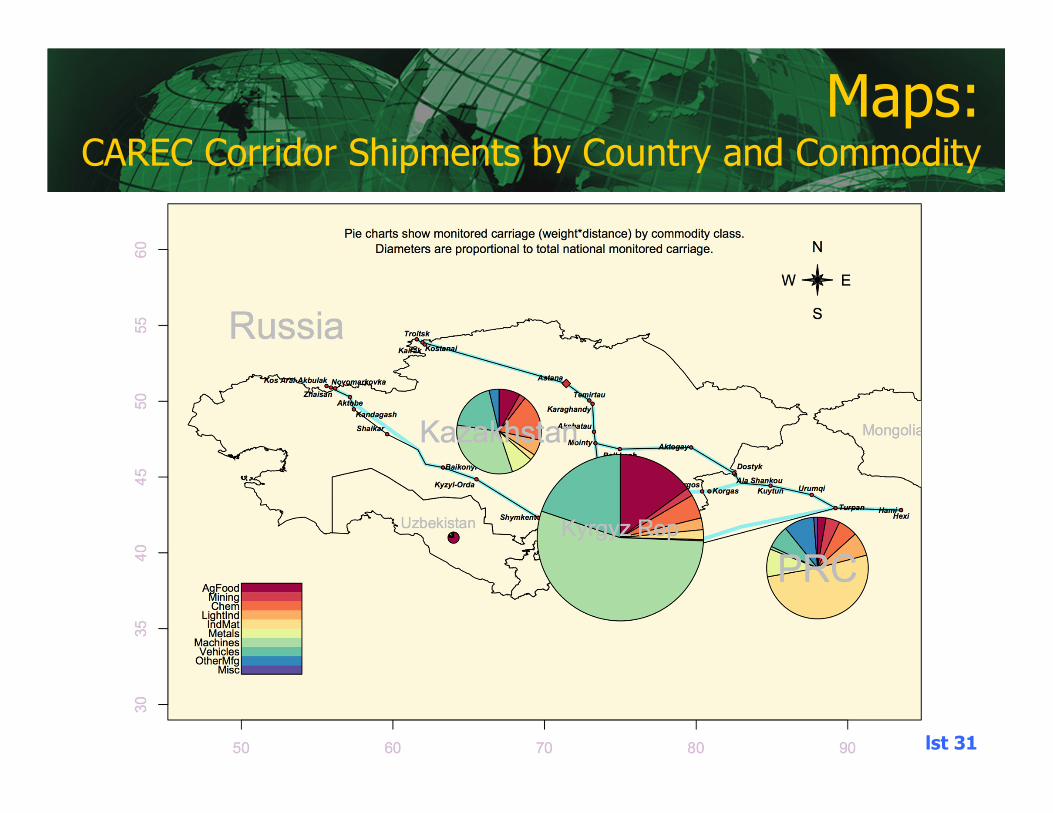
Maps:CAREC Corridor Shipments by Country and Commodity
Roland-Holst 32
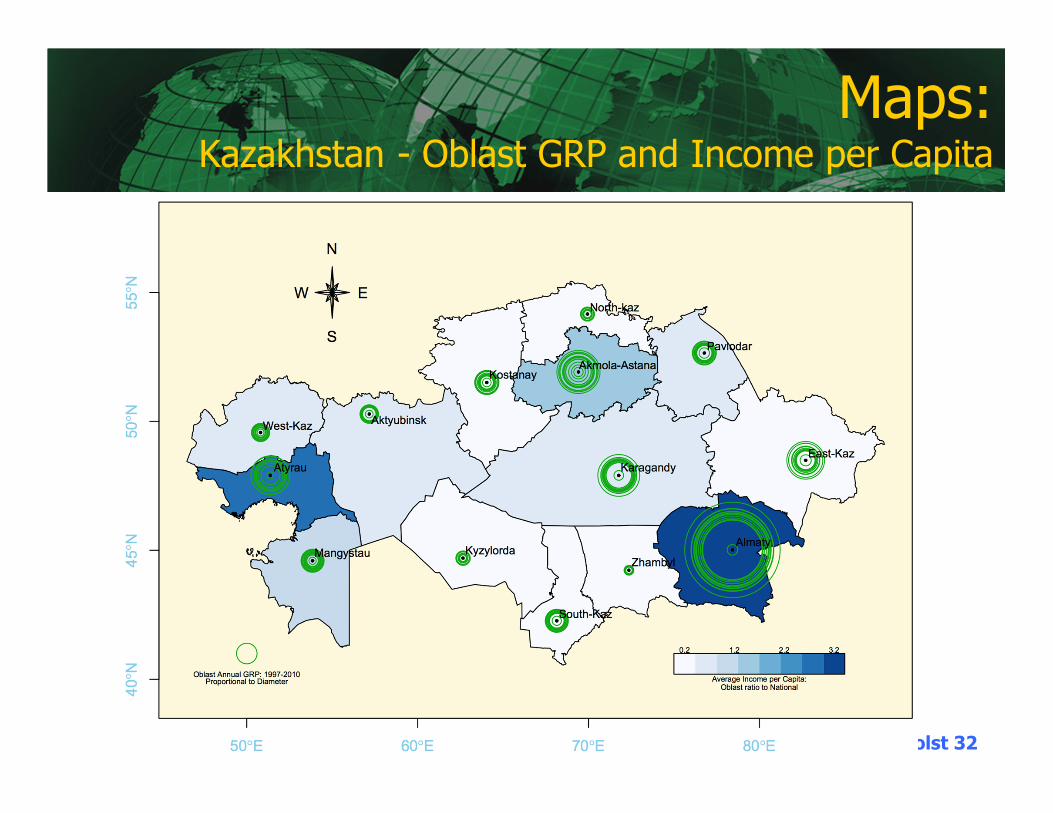
Maps:Kazakhstan - Oblast GRP and Income per Capita
Roland-Holst 33
Sub-National Modeling
• Given the heterogeneity of impacts, institutional and spatial disaggregation should be a high priority
• Administrative vs spatial frameworks – legacy issues with data and authority
• Initial conditions and capacity for data development vary widely
• Begin with simple frameworks and local buy-in, expanding as time and resources permit
• Agreement on some standards/indicators (e.g. MDG’s) could facilitate coordinated investments by countries and development partners
Roland-Holst 34
Modeling Priorities
• Real economy interactions – a strong empirical tradition, easy to extend� Neoclassical efficiency and growth� Unit cost effects – technological change, margins, real productivity� “New institutional” economics – much new data needed, for Asia, scenario analysis is a beginning
• Financial interactions� Flow of funds, macro balances – all fine� FDI – yes, but caveats regarding micro-data (see below)� Portfolio behavior – good luck with this
• Labor markets� Domestic human capital, mobility, and market structure are very important (plenty of tools for this)
� International migration is also possible, but probably not the highest priority (some exceptions: e.g. Philippines, new ASEAN scenarios).
• Competitiveness – This kind of analysis (Melitz and Redding, Brunner et al) is certainly feasible, but will require huge data investments or scenario analysis where great care is taken interpreting differences in domestic market conditions.
Roland-Holst 35
A “Concrete” Example:Modeling Infrastructure’s Impact
Infrastructure’s contribution to growth and distribution can be modeled from three economic perspectives:
1. Keynesian – Aggregate demand and employment stimulus.
2. Ricardian – Reducing trade margins and intensifying comparative advantage.
3. Neoclassical – Endogenous growth benefits.
Roland-Holst 36
Keynesian Stimulus
• Infrastructure spending is a popular means of direct long term or transitory employment stimulus
– Examples: WPA (US), Work Relief (PRC), Japan (heavy counter-cyclical and recurrent fiscal commitments)
• Because of its generality, this kind of spending can be targeted across a wide spectrum of regions and socio economic groups
• For public goods, infrastructure multiplier effects are generally quite substantial
Roland-Holst 3712 December 2006
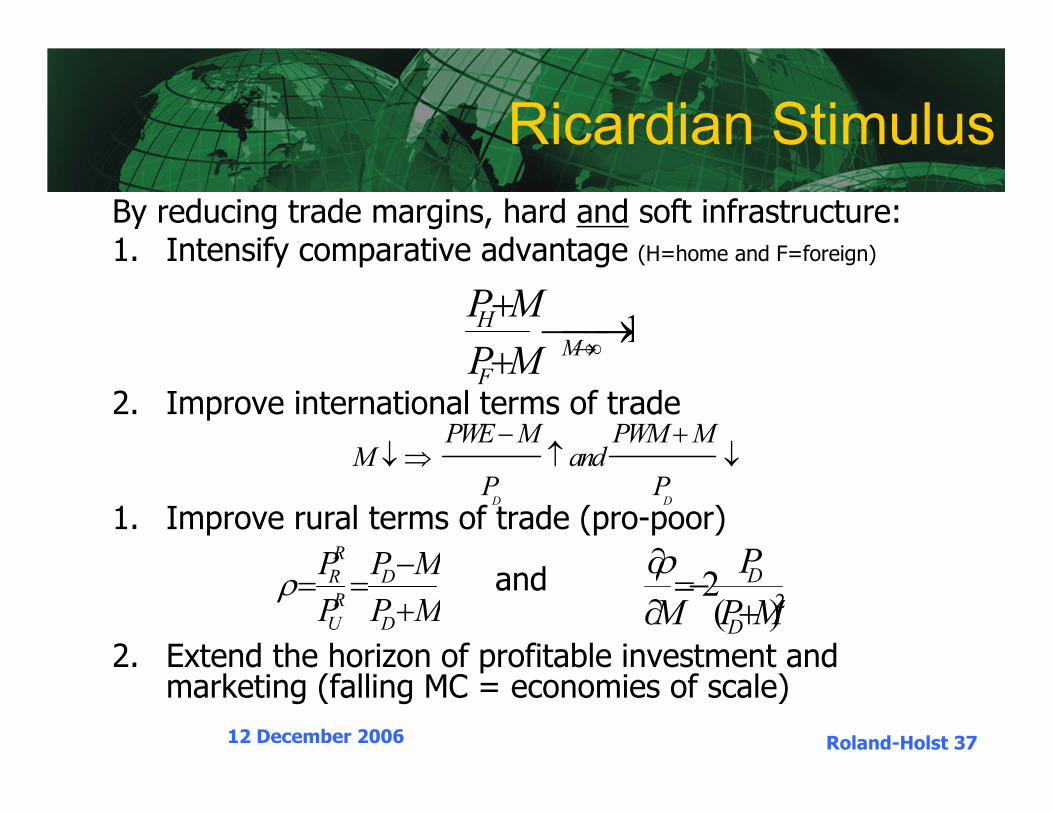
Ricardian Stimulus
By reducing trade margins, hard and soft infrastructure: 1. Intensify comparative advantage (H=home and F=foreign)
2. Improve international terms of trade
1. Improve rural terms of trade (pro-poor)
and
2. Extend the horizon of profitable investment and marketing (falling MC = economies of scale)
1H
M
F
P M
P M→∞
+→
+
D D
PWE M PWM MM and
P P
− +↓⇒ ↑ ↓
R
R D
R
U D
P P M
P P Mρ
−= =
+ 22( )
D
D
P
M P M
ρ∂=−
∂ +
Roland-Holst 38
Neoclassical Stimulus
Modern economic theory recognizes many endogenous growth factors, and these can be greatly facilitated by infrastructure:– Productivity enhancement– Technology diffusion– Supply chain and other network externalities
– Human capital development– Competitive discipline, everybody knows this is important, but animal spirits are notoriously difficult to quantify
Roland-Holst 39
4. Conclusions
• Expanding trade and lowering trade costs will continue to benefit the region.
• Greater financial integration (supporting FDI) can promote convergence and poverty alleviation, but domestic labor mobility and human capital development will be needed to amplify these effects and limit inequality.
• International migration will have a small, and largely self-limiting, influence.
• Inequality vs poverty : both important, but different; a need to set priorities.
• Most OECD economies have not targeted inequality through technology or competitiveness policy.