Embed Size (px)
Citation preview

Submission to the Senate Select Committee on the Scrutiny of New Taxes: Minerals Taxes & Carbon Taxes
ALAN MORAN Institute of Public Affairs
October 2010

1
Part A: Resource Rent Tax
Introduction and Summary
Australia is one of the world’s most important suppliers of mineral products and developments over recent years have been a key reason behind the nation’s growing prosperity. Looking forward, Australia continues to be among the leading nations in new developments. Exploration expenditure, the precursor of new developments, remains high. Exploration in Australia as a share of the world total has however been falling. While prospectivity is doubtless a major cause of this, the relative profitability of operating in Australia may be contributing. Laws that make it more difficult to access land in national parks and as a result of native title would have reduced the relative attractiveness of Australia. If taxes on mining output are to be raised – and the current proposals are for taxes considerably higher than in the countries with which we are competing – this will be an additional factor in firms’ investment location decisions. Australia has excellent procedures and skills to develop infrastructure and has all of the corporate skills necessary to do so. But as a supplier of minerals we have no position of privilege and if other areas prove to be more receptive in tax, environmental and other facets, a diminished share of the world markets would be experienced.
Current Proposals
With her replacement of Mr. Rudd as Prime Minister, on 23 June 2010, Ms Gillard announced the scrapping of the Resources Super Profits Tax (RSPT) and its replacement by the Mineral Resource Rent Tax (MRRT). While mining directly represents only six per cent of GDP, its importance is far in excess of this since a great deal of the service sector is also dependent upon it. Mining is directly responsible for half of the nation’s exports. The RSPT involved the Commonwealth taking a 40 per cent interest in the profits of mining companies after their expenses were deducted. Commissioned by Minerals Council of Australia, KPMG made the following estimates of the effective tax rates at present and following the tax’s introduction. These estimates were similar to those of other reputable accountancy practices.
Table A1

2
KPMG also estimated the Effective Tax Rate (ETS) and compared this with the Corporate Tax Rate (CTR) in Australia and in other economies under the RSPT.
Table A2
A basic rationale for the new tax was that a profits based levy might be less distortive than a fixed royalty. This is the case in two sets of circumstances.

3
First, where a mine is marginal, a royalty at a fixed rate adds to the cost irrespective of the project’s viability and may prevent it from proceeding, leaving its owners with no profits and the government with no associated revenue. A profits related royalty would not prevent such a mine from proceeding because the tax itself would not cause the venture to be unprofitable. Secondly, a profit based royalty would not cause premature closure of a mine nearing the end of its life since it would not add to costs, simply share in the after cost revenues. This classic case for a profits‐based resource rent tax however applies to only a narrow range of circumstances. Situations where such circumstances might prevail and profits based charges are preferable are made all the less common because of the uncertainties of costs and prices. In rare cases where profit‐based royalties would be superior, ad hoc modifications to a fixed royalty rate may be just as easily negotiated. In any event, it would be relatively easy and invite little controversy if current fixed rate royalties were converted to profit related measures. Such approaches apply in several North American jurisdictions (e.g. Nevada and Ontario) as well as in the Northern Territory.
Comparing the Resources Super Profits Tax (RSPT) and the Minerals Resource Rent Tax (MRRT)
RSPT comprised two aspects. One was its retrospective nature in seeking to take the benefits of decades of shareholder investment. The other was a tax increase on new mines, the effect of which would be to reduce the returns and therefore the incentive to embark on new mining developments. A tax is retrospective where it increases the impost on sunk investments that were committed under a less onerous regime. And while any government has the right to set the taxation regime it sees as best for its own nation’s circumstances, a retrospective tax will have an adverse impact of investor perceptions and hence future investment opportunities. Retrospectivity is an accusation governments are keen to deny since it implies a general risk to capital investment. Hence the RSPT proposals were accompanied with claims that the existing tax take has become inadequate as a result of the change in prices. The focus of the MRRT as a replacement of RSPT is on substituting current output based royalties with profit based royalties. Many see advantages in this and profits based royalties are quite common throughout the world. But a mechanical change of this nature is not consistent with the Government’s revenue estimates. The RSPT was

4
estimated to raise an additional $9 billion a year. Though the Government may not have been totally transparent in its statements, based on these MRRT still raised $7.5 billion a year. On the information that the Government has presented, it is however difficult to see how the replacement MRRT collects that level of additional revenue. The RSPT applied to the written down assets of mines but MRRT is levied on their current valuations. This removes the retrospective tax aspect which accounted for almost all the previously envisaged tax revenue. Furthermore, MRRT is restricted to iron ore and coal and its rate is reduced from 40 per cent to 30 per cent or perhaps 22.5 per cent since there is a “25 per cent extraction allowance”. Other elements of the MRRT would also reduce its revenue raising capacity. Thus, the tax free threshold becomes the bond rate plus 7 per cent ‐ about 16 per cent compared with under 6 per cent for the RSPT and new investment is eligible for an immediate write‐off. Moreover, in the case of iron ore, with the removal of state royalties MRRT is likely to bring a reduced tax rate. This is because MRRT is to be levied “as close as possible to the point of extraction”, whereas the present royalty is levied at the port. As demonstrated by the prolonged litigation over the use of BHP and Rio’s Pilbara rail lines, iron ore at the mine head is worth very little. Treasury’s estimate that the MRRT would reduce RSPT’s estimated tax collections by only $1.5 billion was never credible. The key differences between the two taxes are illustrated in Table A3.

5
Table A3
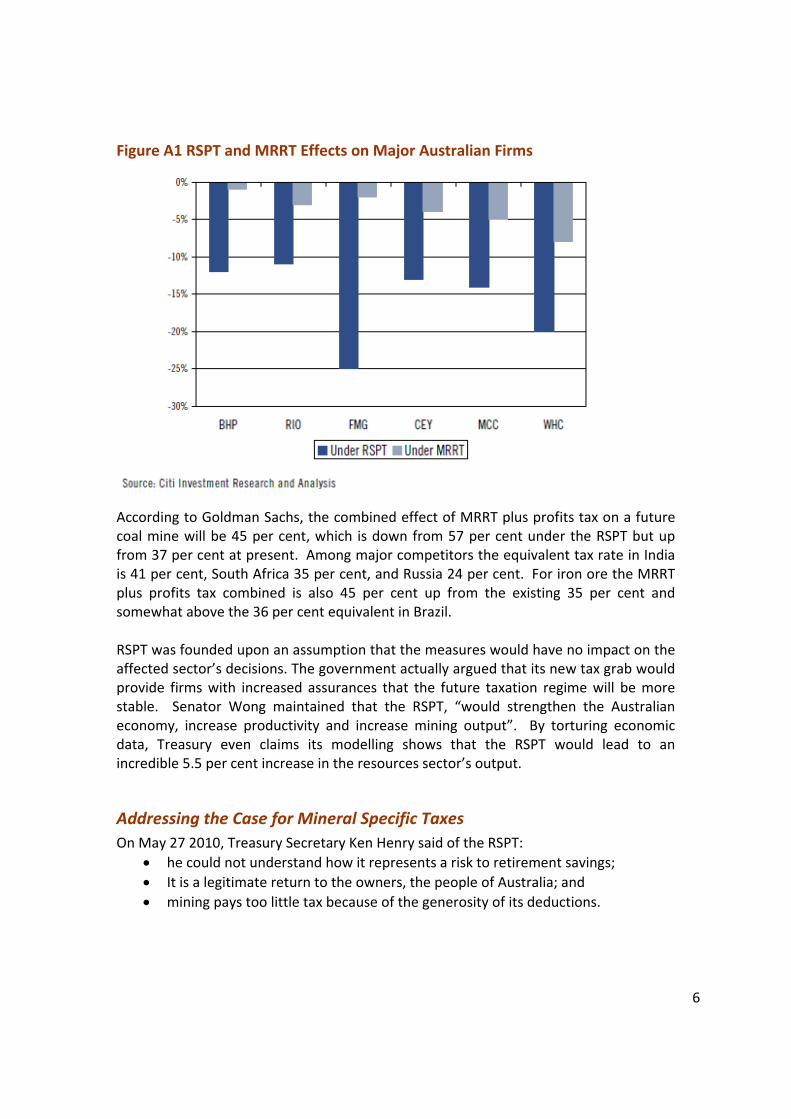
Analysts assessing the costs of the Government’s proposals are hampered by lack of information, a secrecy that seems also to extend to the committee charged with furthering the proposals. For this reason there remains uncertainty about the provisions agreed to by the Government and the three largest miners: BHP Billiton, Rio and Xstrata in particular concerning the deductibility of state royalties should they be increased in the future. Even so, some estimates are available of the tax implications of the MRRT. Analysts have used these to assess corporate valuation effects. According to Citibank, RSPT would have devalued the major mining business’s worth by 13‐25 per cent; Citibank puts the cost of MRRT on BHP, Rio and Fortescue at 1‐3 per cent of value. Deutsche Bank estimates the MRRT’s adverse effect on two of the three main listed coal miners at less than one per cent of value. Citibank’s estimates of the effects of the two taxes on key firms are illustrated in Figure A1.
6
Figure A1 RSPT and MRRT Effects on Major Australian Firms
According to Goldman Sachs, the combined effect of MRRT plus profits tax on a future coal mine will be 45 per cent, which is down from 57 per cent under the RSPT but up from 37 per cent at present. Among major competitors the equivalent tax rate in India is 41 per cent, South Africa 35 per cent, and Russia 24 per cent. For iron ore the MRRT plus profits tax combined is also 45 per cent up from the existing 35 per cent and somewhat above the 36 per cent equivalent in Brazil. RSPT was founded upon an assumption that the measures would have no impact on the affected sector’s decisions. The government actually argued that its new tax grab would provide firms with increased assurances that the future taxation regime will be more stable. Senator Wong maintained that the RSPT, “would strengthen the Australian economy, increase productivity and increase mining output”. By torturing economic data, Treasury even claims its modelling shows that the RSPT would lead to an incredible 5.5 per cent increase in the resources sector’s output.
Addressing the Case for Mineral Specific Taxes
On May 27 2010, Treasury Secretary Ken Henry said of the RSPT:
he could not understand how it represents a risk to retirement savings;
It is a legitimate return to the owners, the people of Australia; and
mining pays too little tax because of the generosity of its deductions.

7
How does RSPT represent a risk to superannuation?
Henry argued that RSPT was a bonus to superannuation since, unlike at present, 40 per cent of the costs of the mineral development was guaranteed by the government. In fact this cannot be the case. First, unlike with the classic “Brown tax” on which RSPT clams to be modelled, the refund is “on tick” and there is no possibility that Parliament can bind its successors not to renege on the agreed sums. This sovereign risk issue was made all the more intense by the government saying that the refund will be on a “reasonable basis” and not, as in the classic Brown Tax, automatically paid as part of the up‐front expenditure of the developer. The payment to failed projects would be strongly resisted. Western Australia Premier Colin Barnett pointed out that Ravensthorpe nickel project has lost $2 billion and that, “Under this proposal the Australian taxpayer would be writing out a check for $800 million to the company that ran a failed project." Resistance to such outlays would be even greater with projects that were seen by the Government as incompetently run. More importantly from the perspective of current shareholders, including superannuation funds, the tax raises $9 billion initially (Mr Henry acknowledged that it would raise more than this in out‐years though dismissed estimates as high as $20 billion). This is profits from existing activities which were developed under a tax regime that was far less onerous than that now planned. It is a direct transfer from shareholders to the government and also reinforces fears about sovereign risk. If this profit earned under previous fiscal systems were to be taxed then it would require reciprocal action in providing support for all the ventures that failed.
Resource rent justification
Claiming the tax is a legitimate rental payment to the people of Australia mistakes the nature of rent. High returns are earned from two sorts of activities: the application of excellence in management, marketing and production processes so that a firm consistently outperforms its competitors; and from innovation or discovery of previously hidden wealth. Nobody is claiming the former should attract an additional tax. Rent is a payment for a resource as compensation to the owner. It is levied at the maximum rate the owner considers a renter will pay, hence it is an efficient means of ensuring the resource is used most productively. Economic rent is sometimes defined as the surplus that is earned from an activity over and above a normal profit. It is difficult to see this ever being defined well enough for it to be taxed without it affecting productivity. Firms often earn what are referred to as quasi rents. Those stem from individual successes in R&D and exploration. The firms earning them are stand‐outs, sometimes likened to successful gamblers, as the

8
industries as a whole earn no more than normal profits, with gains offset by losses. Taxing winners therefore involves increasing the average tax on these industries and this brings about sub‐optimal expenditure and activity. This is underlined by the fact that, over time and across all jurisdictions, mining businesses do not earn super profits. If they did they would quickly be competed down to normal levels, as there are no barriers to entry into the industry and as skills within firms can readily be detached and employed in other firms or in new firms. Because of these factors, a special tax on the successful firms is actually a general tax on all firms. If the average profit from mining activities is 11 per cent, this is an amalgam of many different ventures’ returns. Probably only one in ten of major expenditure programs earns a return of, say, 100%. Another one might earn a 10% return and the rest earn zero hence the average is 110 or 11%. If the success is to be subject to an additional tax at for example 36% (40% of 90%) the aggregate return to the industry is reduced 84% (64% plus the 10% not subject to the tax of the successful firm 10 per cent and 10% of the semi‐successful firm). That means, in the example given, the prospective return to the entrepreneur is reduced by 16 per cent even if the entrepreneur can be convinced that the tax regime will not again move in an adverse direction. A 16% reduction or increase in income is a very potent incentive to action. There are no economic rents in mining unless barriers to entry prevent active competition. Hence there is no more case for a general excess tax on this industry than there is on other industries that involve discovering new means of meeting market needs, as we see in the IT industry.
The alternative justification for a special tax on mining is as recompense for the resources that are owned by the people as a whole and once used can never be replaced. This depletion issue is not straightforward. Resources may be used up but, with a few exceptions, they are abundant and even though the most readily mined deposits are depleted first, prices in real terms have continued to fall. This reflects the improvements in mining and transport technology over time as well as a reduction in the quantities of minerals per unit of expenditure as a result of quality requirements and improved technologies in production and distribution. But mining, like any other process whereby hidden value is intended to be uncovered, involves great uncertainties. Mineral deposits have long been vested on the basis of ‘finders‐keepers’. This is analogous to the vesting of ownership of intellectual property generally. It provides strong incentives to the search for hidden value. The mineral vesting regime though has other variants that are associated with the ownership having some different features than an invention, namely that the ownership rights among the nation that has sovereignty over the land on which the minerals are located.

9
That has given rise to the notion of royalties. In turn, this has led to measures that bring penalties to firms that do not take sufficient effort to explore and then develop any subsequent find. The ‘compact’ between those granted an area of exclusive exploration rights is that in return for having the vast bulk of any value from a successful find, the explorer must undertake a work program to seek out resources and report for public information the results of the program. Tenements normally have to be progressively surrendered back to the authorities to provide opportunities for other explorers to seek out mineral wealth, and in the process building upon the data that has been gathered by the previous explorers. An alternative approach might involve formally vesting the rights to minerals so that the owner has incentives to seek them out or on sell them to maximise profits. However, as with an analogous exclusive vesting of areas of presently unknown new technological developments, this is unlikely to bring about optimal search activity. This would remain true even if an area’s mineral rights were to be sold in perpetuity. The owner would have an incentive to remain inactive in the area hoping to gain additional information from the activities in neighbouring blocks. In that way there would be a lesser degree of effort into searching for undiscovered wealth than if the explorer were to be obliged, as a condition of his (temporary) license to undertake serious expenditures in seeking out hidden value. This highlights the fallacy about rental income being a legitimate reward from the exploitation of mineral resources that are owned by the people. Rents do not exist unless someone has discovered a deposit, just as high profits in IT industries do not exist without an innovation having been made. Governments have imposed royalties on the fallacious basis that the deposit is owned by the people. This is only true of deposits that are already known. Thus, the original discoverer of a mineral province like the Sydney Basin coal deposits could not hope to maintain a monopoly over the information covering hundreds of thousands of square kilometres. Without that monopoly, however, there would be a wasteful scramble for the rights to exploit the resource, since there would be incentives for each mining company to extract as much as possible before its competitors.
In such cases, the rights to mine the resource might best be auctioned and the auction price would represent the resource rent. No adverse effects on production would take place, and the revenue raised by the auction would therefore be a true rent. Examples such as the Sydney Basin are, however, rare, and certainly do not apply across the whole of the mining industry. As discussed below, it is not clear that resource rents generally exist in the mining industry. Consequently, taxing mining may have serious adverse implications for investment and research and development expenditures.

10
Mining pays too little tax because of the generosity of its tax deductions
Mr Henry argues that the profits of the mining companies are swollen by the generous tax treatment they receive. A deviation of the statutory tax rate of 30 per cent from some other rate can only come about because the latter has a different system of deductions. Commonly this is brought about by redefining the “generous” deductions on depreciation of capital investments or of R&D/exploration expenditure, which may receive some favourable taxation treatment and is also usually deductable in the year of expenditure instead of constituting investment‐type expenditure deductable over a number of years. Mr Henry said that the Treasury estimates of tax paid by mining would still be low even if depreciation expenditure rules were revised. This is difficult to reconcile with the information issued by the Tax Office which shows Effective Tax Rates for mining to be higher than those of other industries.
Table A4

11
In any event, if a notional tax rate deviates from the statutory rate this stems from alternative treatment of income and expenditure. It the government is saying this is inappropriate, it should change the existing tax law on deductions across the board. It is not possible to argue that the mining industry uniquely pays excessive levels of taxation unless the industry faces a unique taxation regime.
Effects on the Economy of Increased Mining Taxes
Any increased level of tax will reduce the revenues from an activity. Mining has been unquestionably the dynamic behind Australian economic growth and prosperity in recent years. Mineral production has been favoured by increased demand as a result of the rapid industrialisation of China. The outcome has also seen some price improvement but, placed in long term perspective, this has been quite modest as the following chart illustrates. Chart A1 Mineral Commodity Prices
Relative Prices of Australian Mineral Commodities
0.00
0.50
1.00
1.50
2.00
2.50
3.00
Sep
-74
Sep
-76
Sep
-78
Sep
-80
Sep
-82
Sep
-84
Sep
-86
Sep
-88
Sep
-90
Sep
-92
Sep
-94
Sep
-96
Sep
-98
Sep
-00
Sep
-02
Sep
-04
Sep
-06
Sep
-08
metalic minerals
Coal
Source: ABS 6457
Australia has an abundance of resources but so also do other countries. Having resources and converting these into assets of value are different matters. Resource development starts with exploration and Australia has 13 per cent of the global mining exploration share of expenditure, behind Canada but ahead of the US, Russia, Brazil, South Africa, China, Peru, Mexico and other leading venues.

12
Australia’s share of exploration expenditure has tended to dip somewhat over recent years. The causes of this are doubtless manyfold and include policies and prospectivity assessments in Australia and other countries. One matter counting against Australia is regulatory impediments to new exploration. Among these is native title, with recognised claims now covering 11 per cent of the continent and a large backlog of applications still to be considered. Some estimates put the area prospectively under Native Title at over 40 per cent of the continent. Whether recognised or not, native title claims create an additional complexity in negotiating mining rights and, where title is granted would require a de facto increase in royalties. National parks also reduce the amount of land that might be mined (and in some cases explored). National parks, not all of which are off‐limits to mining, now account for a further 7.5 per cent of the continent’s land area. Other matters that are likely to increase costs stem from environmental obligations. At the very least, the requirement to undertake assessments requires a longer time lag to development of a productive asset. And, starting with a ban on sand mining in Fraser Island in 1977, some proposals – the latest being this year’s NSW decision to reject the Bickham coal mine ‐ that had been confidentially expected to proceed have been rejected. This must have an impact on investors’ assessments of sovereign risk. The trend in Australian exploration expenditure relative to the rest of the world is shown in Figure A2

13
Figure A2 World and Australian Exploration Expenditure
Concluding Comments
Australia has developed a world class mining industry and this has underpinned the economic growth the nation has enjoyed over the past few decades. Though the existence of prospective reserves is essential to this development, so also is the ability of firms to see supportive policies in place and anticipate that they will remain so. Among these are clear property rights that are not subject to expropriation. The originally planned RSPT unmistakably fell into that definition with its retrospective taxation applied onto sunk assets. The proposals presently before us with the MMRT do not appear to have a retrospective element. However, by definition, they are estimated to increase the revenue collected from the industry and do entail higher levels of taxation. The uncertainty about how state royalties are treated brings a further complication. In recent years several policy developments outside of taxation have reduced the availability of land for exploration and mineral development. Chief among these is the “discovery” of the concept of a native title claim and this has been added to by increased environmental stringency and an expansion of national parks.

14
All of these developments will tend to make Australia perceived as being less supportive of new mining activity. From the perspective of major world operators, this is of limited importance since all jurisdictions are in competition with each other and one that becomes more onerous tends to simply slip down the priority list. This is, of course, less the case for smaller Australian miners who tended to be focussed exclusively on Australia. And, although a tightening of conditions of operation or a raising of tax levels in a particular jurisdiction is relatively unimportant for any major global miner, it does mean a reduction in opportunities and eventually wealth in the nation that sees its priority position slip. This competitive situation is widely recognised. Indeed, the Canadians were jubilant at the launch of the Australian RSPT super‐tax on mineral profits. Recognising the new proposal as a massive new handicap on its most important rival for exploration dollars, Canadian Finance Minister Jim Flaherty said, "If it is what it appears to be, a significant tax increase, that's another competitive advantage for Canada. We're reducing our corporate taxes." Even though the taxation arrangements that appear to be planned with the MRRT are less onerous than those of the RSPT, the tax rates appear to be considerably higher than those in Australia’s major competitors for new mining. And the government statements about the relatively small reduction in revenue collections MRRT entailed compared to RSPT have further enhanced uncertainty. Accordingly, we see no case for an increase in taxes on mining and consider such measures would detract from future activity and hence national prosperity.

15
Part B: Carbon Taxes The Magnitude of the Carbon Reduction Task To arrive at the sorts of greenhouse gas emission levels the IPCC estimates are needed to limit temperature increases to around 2‐3°C, world emissions have to be reduced by a quarter of the current levels (by 80 per cent for Australia). This is a major task for the developed nations and would even require a considerable cut back for developing nations. Chart B1 illustrates the magnitudes Chart B1
Mechanisms for Reducing Emissions In examining the different approaches to forcing a change in consumption and production, it is best to treat ass measures in terms of their taxation equivalents. This involves making no distinction between regulatory measures forcing a particular approach and conventional tax measures. A straightforward tax or the creation of fully tradeable property rights are widely recognised as the most efficient means of combating an externality like global warming from greenhouse gas emissions, should this be taking place. A carbon tax or tradeable
CO2 levels for 2050 stabilisation ~590 ppm(adjusted for population growth)
CO2 emission levels 2008 and 2050
0
5
10
15
20
25
Australia UnitedStates
Germany Japan Russia China India World World2050
ton
nes
CO
2/ca
pit
a

16
right to emit, like that envisaged in Australia’s proposed cap‐and‐trade scheme, are similar in their effectiveness in reducing carbon dioxide emissions. They differ largely in the initial allocation of the costs. Normally under a cap‐and‐trade system, incumbent emitters are given free emission rights in recognition of investments they made prior to the impost. The costs therefore fall on consumers (and in some respects new producers). Under a tax, incumbent producers receive no recognition for their property in the form of “sunk” costs that are devalued by the tax. Shareholders of those suppliers pay a higher share of the cost, a payment that many regard as equivalent to expropriation, and consumers a correspondingly lower share. In practice all proposals deviate from a stylised pure tax or pure property rights allocation. Thus, under cap‐and‐trade, only major energy users are compensated and their free allotments are gradually phased down, while under a tax based system there are usually some forms of mitigatory provision envisaged for businesses especially vulnerable to unfair competition from firms located in countries with low carbon taxes. With taxes, the initial focus is on price with the quantitative reductions being derived from this. Quantitative rights work the other way round but both approaches are established with both price and quantity outcomes in mind. This is because price and quantity are recognised as trade‐offs. Under a tax, the rate is set with a particular quantitative outcome in mind. With a quantitative cap the number of tradeable rights is set with a price outcome in mind. The magnitude the tax rate or its quantitative equivalent is balanced by their respective outcomes. The issues in deciding the level of tax or quantitative restriction entails:
Estimating the costs incurred by economies as a result of the higher human induced emissions that are forecast as a result of business‐as‐usual
Determining the costs of abating these emission levels in the light of: o costs of alternative technologies that emit no or less carbon dioxide; o costs to consumers of diverting their purchases to low carbon goods and
services; and, o the transition costs entailed in replacing existing energy supply and
replacing them with low carbon dioxide emitting facilities. Aside from a tax or cap‐and‐trade, there are more interventionary measures. Among these is targeting the more promising areas where it is thought that emission reductions can be bought more cheaply. This approach was behind the ill‐fated Australian measures to install rooftop insulation and has been the basis for a range of subsidies managed by the Department of Climate Control. The other areas where regulation is in place to bring about reduced emissions are with a range of direct regulations on houses (5 Star) and consumer durables.

17
Falling between these command‐and‐control type regulatory measures and the market based approaches of a tax or cap‐and‐trade are regulations that force the use of renewables.
Costs of Business‐as‐Usual Peer reviewed estimates assembled by Richard Tol put the world’s cost effects of a 3ºC warming (and Lindzen, perhaps the world’s most eminent climate scientist, puts the maximum possible at slightly over 1 ºC, most of which has already occurred) as ranging between plus and minus 2.5 per cent of GDP. As illustrated in Chart B2, the Stern estimates (which were not independently reviewed) are outliers with a 12.5 per cent cost. Chart B2
Global Cost Estimates
The projected temperature changes would take place over a period of 100 years, during which the average Australian under business‐as‐usual is estimated to see a 77 per cent increase in income by 2050 and a two and a half fold increase by 2100. Most other countries would see even faster per capita growth. The relatively small changes to the economy that are estimated to take place if the earth’s atmosphere warms tend to be lost in alarmist projections. If atmospheric warming is taking place, we are in fact discussing an issue with only a moderate economic impact and therefore fairly minor effects world income levels.
18
Costs of Abating Emissions Using Carbon Taxes In taking action to curb CO2 emissions, Australia would need to eliminate over four fifths of current emissions. Critical in estimating the costs is the CO2 price necessary to drive the changes and this in turn depends on the ease with which carbon emitting energy can be substituted for other forms of energy or energy substituted by other goods and services. Once assumptions are made about consumer and producer responsiveness to price changes and about new technology developments, costs are estimated on the basis of a comprehensive tax on carbon dioxide emissions. In modeling the costs for Australia, it is assumed that as countries adopt a similar tax on carbon dioxide emissions. Estimates of the carbon price necessary to force the required emission reductions range from around 50 to hundreds of dollars per tonne of CO2. In Australian terms this translates into a doubling to a sevenfold increase in electricity costs. The IPCC put the tax at $100 per tonne. The Australian Treasury has many price estimates, the lowest of which is initially $23 per tonne of CO2 (or around $30 per MWh). Under the Teasury scenarios, Australia buys emission rights that have been given to other countries, which requires a reduction in real incomes for consumers. Treasury projects the costs of reducing Australian emissions at only 2‐3 per cent of GDP over the course of fifty years, using carbon taxes that treble electricity prices. Renewables plus CCS are put at 50% by 2050. Chart B3 is an illustration of the energy profiles Treasury predicts in one of its scenarios.

19
Chart B3
5/11/2009 Alan Moran, Institute of Public Affairs
9
Australia’s electricity generation
technology shares, 550 ppm scenario
But Treasury’s projections of the outcome of carbon taxes in terms of GDP are guesses. They are derived from bold technological assumptions coupled with the experience of consumers’ responses to minor price changes that have taken place in the past. The only experience of the sort of substantial price changes thought to be needed has been the quadrupling of oil prices during the 1970s. However, that event brought substitutions of oil by coal, natural gas and nuclear as well as increased oil discoveries. Climate change policy would prevent similar developments. Unless some unknown breakthough occurs (or we move to nuclear power), throttling back fossil fuel use by 80 per cent would impose massive costs and, contrary to the rosy Treasury scenarios, would bring drastic reductions in living standards. Forecasting models have to be based on projections from quite small changes experienced in supply and demand over relatively short periods. And they have no technological forecasting capability. It is argued that energy cannot be that important since it is only 5 per cent of GDP and rather less than this if its distribution costs are excluded. But much the same can be

20
said of food, which in rich countries comprises only some 12 per cent of GDP and most of this is distribution and value‐added features. While no modern economy could run on renewables, even if it could, to force this would mean a tax equivalent well in excess of $40 per tonne of CO2 displaced. For Australia, this would collect over $18 billion a year, over $1000 a year for the average worker. Research undertaken indicates that people would not willingly accept such an impost. Following US research results about public resistance to paying the costs of carbon restraint, the IPA commissioned Australian research through the Galaxy polling company asking how much Australians would be prepared to pay in carbon taxes. The findings are reproduced in Table B1. Table B1
Sample 16644
42 4 3 don't know
457 15 35 nothing
1312 12 12 $100
149 17 14 $300
2214 26 22 $500
83 14 9 $1,000
31 12 6 over $1000
There is conflicting evidence and I'm not surewhat the truth is/don't know
The variation in globaltemperature is just part ofthe natural cycle of nature
The world is warmingand man's emissionsare to blameTotal
amount willing to pay
Only six per cent said they would pay over $1000 a year to reduce greenhouse gas emissions. Fully 35 per cent said they were not willing to pay any form of impost.
Current Australian Provisions for Carbon Reduction
Rather than a broad emission reduction mechanism, Australia has a range of budget and regulatory measures, the most important of which requires substitution of carboniferous fuels by designated forms of renewables. The lowest cost of these is wind power.

21
As previously discussed, regulatory measures are a form of taxation when they penalise particular products in order to presssure consumers to use other products. This creates a cost that is usually hidden from view but is no less real as a result.
Australia’s Renewable Energy Requirements
The Mandatory Renewable Energy Target requires 9,500 GWh of renewable electricity by 2011 ‐ about 4% of the total supply. The states have supplementary schemes. Victorian Premier Bracks in November 2005 argued that a, “lack of national leadership” by the Federal Government in not increasing the MRET scheme from the 9500 GWh target, “is costing Victoria – economically and environmentally ‐ and cannot be allowed to continue.” Victoria’s scheme requires an additional 3,274 GWh a year of renewable electricity by 2016. It was expected to create “up to 2,000 new jobs, most of them in regional Victoria”, although none emerged. The state schemes are to be folded into the federal requirement for 20 per cent renewable energy by 2020. This is set at 45,000 GWh, which is to be progressively reached year by year, and excludes the established hydro‐electricity production. Under the “20 per cent by 2020” legislation, the renewables have two components. The first covers the small providers, and is budgeted at 4,000 GWh (comprising Renewable Emission Certificates (RECs) with each REC equivalent to 1 MWh). It includes household solar hot water heating systems and roof top photovoltaic panels. Both attract a fixed price REC of $40 per MWh. In addition photovoltaic panels currently enjoy a 5:1 multiple (i.e. a $200 REC) which is being phased down. Photovoltaic panels also attract a subsidy mandated by state and territory governments of up $600 per MWh feed‐in tariff. The electricity distributor is obliged to pay this and covers the costs by taxing other consumers. Some jurisdictions define this as a gross subsidy on all power generated, others have it only on the power fed back into the grid, though the commercial sales are ensuring a very high proportion of the electricity generated is so exported. In NSW the subsidy was estimated, until its recent modification, to give a guaranteed return of 120 per cent. The Australia‐wide feed‐in subsidy is estimated at around $350 per MWh on average placing (though this has changed now that NSW has reduced its subsidy from $600 per MWh to $200) the aggregate subsidy of the scheme at $340 per MWh (excluding the 5:1 multiple). Information is not readily available regarding the split between those small installations receiving the feed‐in tariff and the average level of that tariff.

22
In addition, there are further subsidies available, including the Solar Homes and Communities Plan which offers up to $8,000 per installation. In 2009/10 $272 million was budgeted for this scheme. Other programs would add to these subsidies. The second component of the “20 per cent by 2020” renewables legislation is the large scale RECs set at 41,000 GWh. The fall back penalty cost to a retailer of failing to meet its target for these is set at an after‐tax rate equivalent to $93 per GWh. Currently the REC price is under $40 as the attraction of the more heavily subsidised (but intrinsically less efficient) small scale RECs has led to a temporary saturation of demand. The least cost form of renewable energy is wind, which is estimated to cost $110 per MWh if the energy can be fed into the grid at the time of the seller’s choosing. Coal based electricity costs under $40 per MWh and gas generation about $50. Because of its intrinsic unreliability and its unavailability in a great many of the hottest periods (when the air is often still), once wind reaches a significant share of supply, it attracts a lower average pool price. This discount would be incurred by the wind seller as part of the contract to the retailer. Hence with a market price at $42, and a reliability penalty of $101 the price for RECs would be $88. For the large producers’ 41,000 GWh, this entails a subsidy of $3.6 billion a year by 2020. The subsidy on the small installations is currently equivalent to a subsidy of $340 per tonne, almost double that in the now modified NSW scheme. A 2020 cost of $200 billion for a saving of 16 million tonnes was estimated by the Department of Climate Change if every household had a solar system. The legislation covering these facilities has a cap on their take‐up and it is assumed that the cost of feed‐in tariff, whether gross or net, will soon become apparent and that parliaments will move to terminate them. If this occurs and a consistent scheme gave the same subsidy to all 45,000 GWh renewables, in 2020 the overall cost would be $3,960 million. The taxation equivalent of this can be estimated from the 202 million tonnes of CO2 equivalent emissions attributed to electricity generation. If the fuel displaced by the renewables is coal the KWh to tonne is around 1 (1.3 tonnes of CO2 for brown coal; 0.9
1 One option is to buy a $300 cap at a cost estimated from dcypha of around $12. Other data indicates the discount was rather greater than this in recent years

23
tonnes for black coal). On that basis the $3.96 billion annual expenditure would save 45,000 GWh or 45 tonnes at $88 per tonne. However the intermittent nature of wind means the fuel source displaced is more often gas where it is available since gas based plant has got the flexibility to back‐off when the price is low. Gas has around 60 per cent of the CO2 equivalent of coal and to the degree it, rather than coal, is displaced the tax equivalent is around $147 per tonne of CO2.
Carbon Tax Equivalents of Renewable Requirements
It is unclear what level of emission reduction is anticipated by these measures but it is presumably between 27 and 45 million tonnes of CO2 depending on whether the renewables displace gas or coal. Such quantities represent reductions on current levels of emissions from electricity of between 13 and 22 per cent (2.4‐4.1 per cent reductions on total emissions). The tax rate equivalent is very high – a likely $88‐147 per tonne of CO2 for the 41,000 GWh represented by wind, and $340 per tonne or more for the photovoltaics. Other countries with forced levels of renewable may also be expected to incur high costs, though because Australian electricity supply is low cost, the relative costs in this country are likely to be higher. In Spain a 2007 law guaranteed producers a so‐called solar tariff of as much as 44 cents per kilowatt‐hour for their electricity for 25 years ‐‐ more than 10 times the 2007 average wholesale price of about 4 cents per kilowatt‐hour paid to mainstream energy suppliers. This is being reduced by a reported 40 per cent. Of countries with a more straightforward carbon tax equivalent, relatively low taxes are in place. In the EU CO2 contracts are trading at about €15. The New Zealand carbon tax (the revenues of which are directed to forest growth) is $NZ 12.50. Finland has a tax of €18.05 and some US states and Canadian provinces also have carbon taxes. (Though the federal US trading scheme has seen the carbon price at 10 cents, indicating the market sees little prospect of abatement measures, even though these were promised by Presidential candidate Obama).
Other Emission Reduction Measures
The more direct command‐and‐control carbon reduction measures have had a history of mismanagement in Australia and it is unlikely such approaches would prove less costly than the tax/cap‐and‐trade systems. One measure, the 5 Star energy requirements for new houses, is estimated to increase new house prices by $7,000 and thereby represents a highly discriminatory impost on new house buyers. In raising the cost, and therefore the price of new houses, this also delivers a windfall gain to existing house owners who are not required to pay the impost.

24
Concluding Comments
The household rooftop installations subsidies should be abolished immediately since they represent an almost unimaginably egregious waste of money to the electricity consumer (especially less well off consumers since it is largely the better off who are installing these facilities). The renewable program should also be phased out. It is a “winner picking” program that operates at a carbon tax equivalent of $88‐$147 per tonne. The mooted levels of carbon tax equivalent (in 2005 dollars) under the CPRS were said to reach $35‐60 per tonne in 2020 and even under the highly ambitious carbon reduction goals of 2050 were estimated to be only $114‐1972. There is no justification for adopting a partial scheme impacting on only one component of one sector of total emissions. Practical operational results in Australia confirm the theoretical superiority of general rather than specific measures as the cheapest means of achieving goals. If the goal is carbon reduction the means of achieving this must be at the lowest cost. At present, the measures appear to be designed to obscure rather than illuminate the actual cost to consumers. This is not a sound basis for governance in a democracy. Accordingly, the renewable program and the command‐and‐control regulatory measures should be abolished. The issue of whether to impose a carbon tax or other such measures to reduce carbon dioxide emissions, the level of the tax/emission reduction and when and under what circumstances it might be introduced should be left for parliament to determine. That determination should be made with full information about the costs involved in legislative options as well as the costs of failing to undertake them.
2 Australia’s Low Pollution Future, Treasury, 2008, P.139


![Inside This Issue...E-mail: ipa@ipa.org.au Webs ite: Cover photograph by David Hughes [(03) 9486 4628] Inside cartoons by Peter Foster [(03) 9813 3160] Unsolicited manuscripts welcomed](https://img.pdfslide.net/doc/110x75/611818dc97079e1bcd5b26c6/inside-this-issue-e-mail-ipaipaorgau-webs-ite-cover-photograph-by-david.jpg)