Embed Size (px)
Citation preview

1Senior Citizens in Israel
Table of ContentsIncome, Labor, and Retirement ... 4
Housing ....................................... 6
Health and Health Services......... 9
Welfare Services ....................... 12
Looking Ahead .......................... 15
SENIOR CITIZENS IN ISRAELHannah Weihl
In 1995, there were 528,600 elderlypersons in Israel.1 Although they accountfor less than 10 percent of thepopulation,2 the elderly utilize a largeproportion of the social services: in 1987,40 percent of income maintenancepayments and 29 percent of healthexpenses.3
The 65+ Age GroupEleven percent of Jews and 3 percent ofArabs are aged 65+.4
ForecastAccording to a population forecast,5
the proportion of persons aged 65+ willhardly increase in the next ten years, butthe share of those aged 75+ among theelderly will rise, foremost amongwomen.
Israel’s elderly population will growunevenly—by 56 percent among Arabsand by 12 percent among Jews.
Life ExpectancyLife expectancy of Jewish and Arab
men at age 656 is almost equal—16.0 and15.8 years, respectively. Life expectancyis greater among women than men (as itis worldwide) and greater among Jewishwomen than Arab women—17.9 yearsand 16.4 years, respectively.
Ratio of Women to MenIn 1995, women outnumbered men
among the elderly by a ratio of 57:43.7
Ethnic OriginAlmost three-fourths of Jewish
elderly in 1995 were of European orAmerican origin.8
Marital StatusThe marital status of elderly men and
women is very different:9 a majority ofmen, including those over the age of 80,are married, while most of the womenare widows. The proportion of widowsrises from 44 percent in the 65-74 age
group to 82 percent in the 80+ cohort.Two percent of Jewish elderly were nevermarried. In the Arab population, theproportion of elderly women who werenever married is higher.10
Children and GrandchildrenMost of the elderly have children and
grandchildren; a few have great-grandchildren.11 The proportion ofelderly without children is 11.3 percent.Among the Jewish elderly, 2.8 percenthave no children in Israel, i.e., nochildren who can help them in dailylife.12
ISSN 0792-7010© All rights reserved to
Adva Center
Published by Adva Center. P.O. Box 36529, Tel-Aviv 61364, Israel. Tel (03) 5608871, Fax (03) 5607108Email: [email protected], Web site: www.adva.org
I S S U E N O . 7 N O V E M B E R 1 9 9 8

2 The Israel Equality Monitor November 1998
Average Household SizeThe average household size is 1.65
persons among Jewish elderly and 2.37among Arab elderly.13 Most seniors inboth population groups (94 percent ofJews, 71 percent of Arabs) live inhouseholds of up to two persons—usually with a spouse and less commonlywith a son or daughter. Among the Arabpopulation, the proportion of elderly wholive with minor children is about 20percent.14 The share of seniors who livewith adult married children appears tobe similar among Jews and Arabs.
Mizrahi Jewish elderly are morelikely than Ashkenazi elderly to live withchildren, partly because of differencesin marriage patterns, fertility patterns,and income.15
Most widows do not live withchildren, and widows account for 77percent of all elderly who live alone.
SchoolingIn Israel, as worldwide, the elderly
have less schooling than their children.Compulsory education—insofar as itexisted in countries where Israel’scurrent elderly were born—coveredfewer years in the seniors’ generationthan in the children’s generation, and insome countries it was not the custom forgirls to attend school. Jewish boys, incontrast, generally acquired someschooling.
Non-Jewish elderly have much lessschooling than Jewish seniors and 62percent of them (more women than men)are illiterate.16 This can be attributed tothe absence of compulsory educationduring the British Mandate period.
Seniors (65+) in Localities withPopulations of 10,000 or More,
Percent of Population, End of 1995
Givatayim 20.1
Haifa 17.6
Ramat Gan 17.7
Tel Aviv 16.8
Qiryat Tivon 15.3
Bat Yam 14.0
Qiryat Yam 14.2
Nahariyya 13.3
Netanya 13.4
Qiryat Motzkin 13.4
Upper Nazareth 13.5
Qiryat Bialik 12.9
Rehovot 11.9
Holon 12.0
Petah Tiqva 11.9
Qiryat Ono 11.5
Qiryat Ata 11.4
Hadera 10.8
Ashqelon 10.7
Herzliyya 10.6
Pardes Hannah-Karkur 10.3
Beersheva 10.5
Hod Hasharon 9.6
Karmiel 10.3
Arad 10.3
Bene Beraq 9.8
Nesher 9.9
Tirat Hacarmel 10.2
Ashdod 10.0
Nes Tsiyyona 9.9
Acre 9.7
Migdal Ha’emek 9.6
Qiryat Gat 10.0
Kefar Sava 9.9
Afula 9.4
Ramat Hasharon 9.7
Rishon Leziyyon 8.6
Safed 9.2
Ra’anana 8.0
Jerusalem 8.0
Ma’alot-Tarshiha 8.6
Ramle 8.0
Yehud 8.0
Lod 8.0
Or Yehuda 7.9
Givat Shmuel 7.5
Or Aqiva 8.0
Dimona 7.4
Tiberias 7.5
Sederot 8.2
Qiryat Shemona 7.2
Ofaqim 7.9
Rosh Ha’ayin 5.5
Beit Shemesh 5.6
Beit She’an 6.0
Qiryat Malakhi 5.5
Netivot 5.8
Yavne 4.7
Ariel 4.3
Nazareth 3.6
Daliyat il-Karmil 3.5
Shifr-‘Amr 3.7
Ma’ale Adummim 3.1
Tira 3.7
Mevasseret Tsiyyon 3.6
Kafr Qara 2.8
Reina 2.8
Eilat 2.8
Arara 2.7
Sakhnin 2.6
Tamra 2.6
Maghar 2.6
Yifya 2.5
Kalansawa 2.6
Taibe 2.9
Kafr Qasm 2.4
Baqa al-Gharbiyya 2.4
Kafr Kana 2.4
Umm al-Fahm 2.3
Jedida-Makr 2.3
Arabe 2.8
Kafr Manda 1.9
Rahat 1.8
Source: Central Bureau of Statistics, LocalAuthorities in Israel, 1995, Physical Data, 1996,Table 9.

3Senior Citizens in Israel
There are five major differencesamong the elderly population.
AgeA distinction should be made between
the “young old,” who have not yetreached the age of 75, and “old-old,”those aged 75+. Since the proportion ofelderly who suffer from disability andillness rises with age, so does the shareof those in need of medical services,medicines, assistance in functioning, andappropriate transportation. For thisreason, the elderly need to spend muchmore on health than the young, but inmost cases their income does not risecommensurably.
As the health of members of these agegroups deteriorates, their living patternschange. They spend less time away fromhome and have to find activities to fillgrowing hours of leisure.
Obviously, then, the growth forecastfor the senior population generally andthe “old-old” particularly cannot butaffect the planning of welfare and healthservices.
Availability of ChildrenThe gerontology literature shows that
family members (spouses, children andtheir spouses, and grandchildren) are theones who meet most of the needs of thedisabled elderly, even in countries withthe most highly developed welfareservices. Thus, those who lack thisresource are worse off than those whosechildren are available. If these seniorsalso lack the wherewithal to purchaseservices, their situation is much moredifficult.
Israel’s legally mandated servicesmake no provisions for the special needsof the childless elderly. Lack ofchildren17 is not a formal criterion ineligibility for services, and there are no
regulations that require affirmativeaction to provide for their special needs.18
Cultural HeterogeneityThe conventional taxonomy
distinguishes among three populationgroups—Arabs, Mizrahi Jews, andAshkenazi Jews19—who have differentlevels of income and education, differentfamily values, and different householdstructures, especially among the elderly.
The distinction between elderly Arabsand Jews is important because, inaddition to the difference in culturalbackground, a political factor is present.Arab wage-earners still find it hard toobtain “good” jobs that provide tenure,pension rights, and an adequate wage,and some of today’s seniors spent muchof their working lives unemployed. MostArab elderly held unskilled jobs that didnot provide social benefits.
Length of StayAshkenazi elderly are different from
Mizrahi elderly in terms of their tenurein Israel—a difference that does muchto dictate their current level of income.Tenure also reflects the degree of one’ssocial and cultural immersion and, in thissense, affects the sense of belonging toIsraeli society.
EducationEducation makes it possible to obtain
economically and socially rewardingwork and provides the tools needed tofill leisure time and cope with changesin physical functioning. Consequently,it stands to reason that highly educatedpensioners will out-earn their poorlyeducated counterparts. This factor alsoaffects lifestyle, since seniors with littleschooling and low income must contendwith more significant changes in theirway of life after retirement.
The data presented here enable us topinpoint the most vulnerable groups inthe elderly population of Israel (andworldwide)—those who are “old-old,”are poorly educated, have low income,20
have no children who can help them, andthose who live alone (generally widows).
Differences on Five Dimensions
4 The Israel Equality Monitor November 1998
Employment and income areinterrelated even after retirement, as thelevel of one’s pension is a function ofincome during working years. Peoplewho earned little and saved nothingwhile working will have a scanty incomein old age, and unless their employersoffered pension plans, they will dependon the National Insurance (SocialSecurity) old-age pension.
Because Israeli law does not requirecitizens to contribute to a pension fund,it is the responsibility of working personsto assure themselves an income for oldage. Too many workers do not or cannottend to this necessity; 45 percent of menwho were self-employed (as against 27percent of former wage-earners) receiveincome maintenance supplements21
because they have no savings. Someplaced themselves in this situation byexhausting their pension savings beforethey reached retirement age.
In many workplaces, agreementsbetween employers and labororganizations stipulate pension fundcontributions by both sides or pensionpayments from the national budget. Suchagreements, however, are common only
in large workplaces (government,municipal authorities, former Histadrutenterprises, the Jewish Agency, and somelarge industrial firms). In many othersectors (agriculture, sales, domestics,miscellaneous services, and much ofindustry), there are no such collectiveagreements; working conditions are setforth by the employer, sometimes bymeans of time-limited personal contractsthat do not include arrangements forretirement.
Some of the elderly—17.7 percent ofmen and 5.5 percent of women over age65—participate in the labor force.22 Thisparticipation depends on the state of thelabor market and various factorsassociated with the elderly themselves:the desire to continue working, thewillingness to change occupations, theextent of need for a larger income,education level, and age upon arrival inIsrael. The job status of the elderly alsoaffects their employment rate: 37 percentof elderly (65+) participants in the laborforce in 1985 were self-employed.23
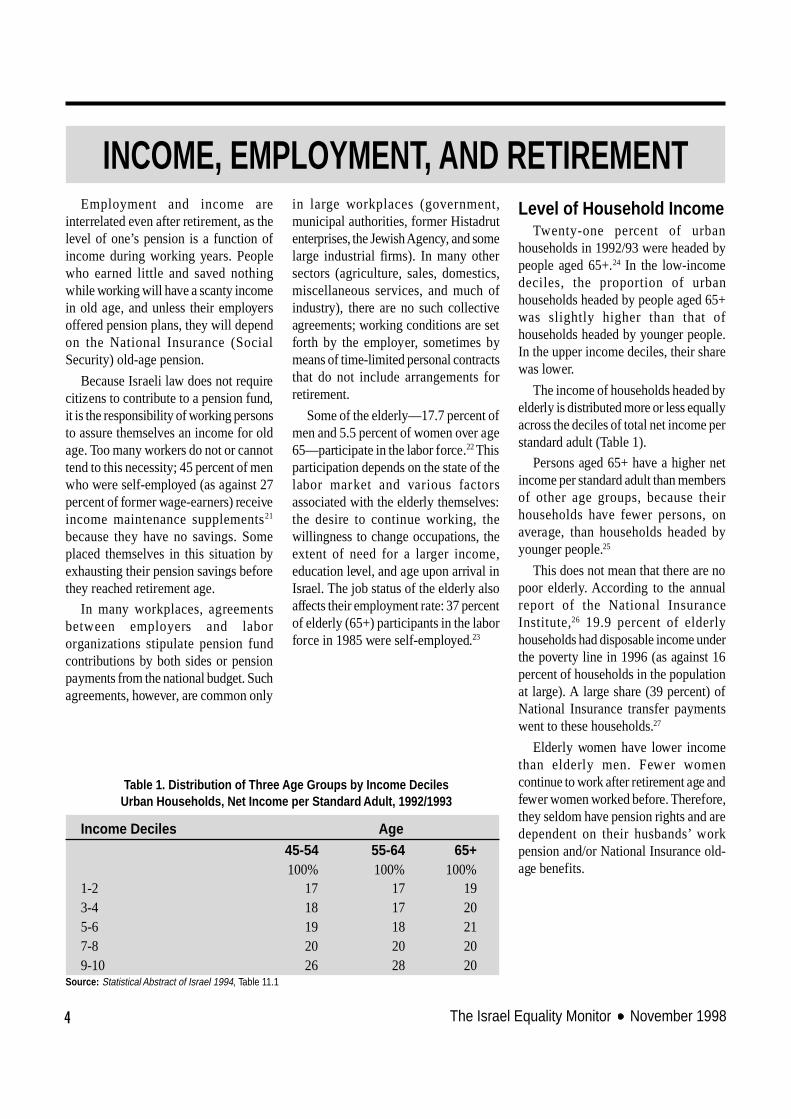
Level of Household IncomeTwenty-one percent of urban
households in 1992/93 were headed bypeople aged 65+.24 In the low-incomedeciles, the proportion of urbanhouseholds headed by people aged 65+was slightly higher than that ofhouseholds headed by younger people.In the upper income deciles, their sharewas lower.
The income of households headed byelderly is distributed more or less equallyacross the deciles of total net income perstandard adult (Table 1).
Persons aged 65+ have a higher netincome per standard adult than membersof other age groups, because theirhouseholds have fewer persons, onaverage, than households headed byyounger people.25
This does not mean that there are nopoor elderly. According to the annualreport of the National InsuranceInstitute,26 19.9 percent of elderlyhouseholds had disposable income underthe poverty line in 1996 (as against 16percent of households in the populationat large). A large share (39 percent) ofNational Insurance transfer paymentswent to these households.27
Elderly women have lower incomethan elderly men. Fewer womencontinue to work after retirement age andfewer women worked before. Therefore,they seldom have pension rights and aredependent on their husbands’ workpension and/or National Insurance old-age benefits.
INCOME, EMPLOYMENT, AND RETIREMENT
Table 1. Distribution of Three Age Groups by Income DecilesUrban Households, Net Income per Standard Adult, 1992/1993
Income Deciles Age45-54 55-64 65+100% 100% 100%
1-2 17 17 193-4 18 17 205-6 19 18 217-8 20 20 209-10 26 28 20
Source: Statistical Abstract of Israel 1994, Table 11.1

5Senior Citizens in Israel
In 1985, the total income of more thanhalf of elderly women was under one-fourth of the national average wage; only20 percent of elderly men belonged tothat income category. This disparityexplains why a higher proportion ofwomen than men receive incomemaintenance, for this benefit accruesonly to those with the lowest income.28
Significant differences are alsoevident in the income of elderly Arabs,Mizrahi Jews, and Ashkenazi Jews. Thefraction of elderly households that failedto receive an income amounting to halfof the national average wage in 1985 was81 percent among Arabs, 66 percentamong Mizrahi Jews, and only 46percent among Ashkenazi Jews.
The income of 20 percent of elderlyAshkenazi households exceeded thenational average wage; only 6 percentof elderly Mizrahi households and 2.5percent of elderly Arab households didas well.29 These differences in level ofincome explain why the rate of eligibilityfor income maintenance is 19 percenthigher among Arab elderly than amongJewish elderly.
Over the years, the proportion ofseniors entitled to incomemaintenance—those with the lowestincome—has been declining.30 In 1993,this rate was 33.8 percent of all recipients
of old-age and survivors’ benefits(including women aged 60-64).31 Theevident reason for the downtrend is anupturn in the share of seniors who qualifyfor pensions from their jobs.
Sources of IncomeElderly people have several sources
of income: work, capital, savings,pensions, and income transfers under law(old-age and survivors’ benefits, specialentitlements for victims of Nazipersecution, income maintenance, andDefense Ministry benefits). Some alsohave pensions overseas, support fromrelatives, German reparations, and thelike.
The gross income of householdsheaded by elderly persons (65+) isdistributed almost equally among foursources: (1) benefits and supportpayments, (2) pensions, (3) capital, and(4) employment.32 In other words, aboutone-fourth—28 percent—of the incomein this age group, comes directly fromthe state.
The incomes of elderly men andwomen are differently composed. In1985, more men than women had incomefrom employment (47 percent vs. 21percent, respectively) and pensionincome (27 percent vs. 10 percent).33
Income from old-age benefits is also
differently apportioned. Until recently,the law did not entitle women whoworked only at home to old-agebenefits;34 such women were dependenton their husbands’ old-age entitlements.For this reason, more women than menrequired income maintenance.35
Furthermore, age affects the compositionof income sources. In 1985, theproportion of elderly with income fromemployment declined from 33 percentin the 65-69 age group to 7 percentamong those aged 80+, and theproportion of seniors with a pensionincome fell from 46 percent to 22percent, respectively.36 As the proportionof elderly with tenured jobs in Israel hasrisen, so has the share of pension in the“basket” of income sources.37
Different origin groups have differentsources of income. In 1985, 75 percentof Arab elderly subsided on NationalInsurance benefits alone, as did 45percent of Mizrahi elderly and 25 percentof Ashkenazi elderly.38
Table 2 shows that the proportion ofelderly who had income from pensions,employment, or capital in 1985 wasmuch lower among Arabs than amongJews. Several factors explain thedifference: a low educational level thatbarred Arabs from rewarding and“regulated” occupations (those thatprovide ample social benefits), lack ofindustrial development in Arab localities,and overt or covert discrimination inhiring practices, including those of thecivil service.39
Table 2 also illuminates differencesin the composition of Ashkenazi andMizrahi Jews’ sources of income. Thedifference in the proportions of personswith savings and capital income—33percent of Ashkenazim vs. 11 percent ofMizrahim—is especially salient. AmongAshkenazim, there are differencesbetween old-timers and those whosettled in the country at an advanced age.Some 95 percent of those who receiveold-age benefits despite the fact that they
Table 2. Income of Elderly Households and Percent of Households Benefitingfrom Each Source of Income, by Ethnic Origin and Nationality
Households National Pension Work Other(thousands)** Insurance (savings,
capital, other)
Total 273.1 91 38 21 25
Jews 257.4 91 40 22 27
European-origin*** 183.6 90 42 25 33
Asia-Africa origin 71.1 92 35 15 11
Non-Jews 18.4 94 12 7 3Source: Central Bureau of Statistics, 1989, Income Patterns among the Elderly in Israel, Table 13.** Households that include a woman aged 60+ or a man aged 65+.*** Including America, Israel, and unknown.

6 The Israel Equality Monitor November 1998
are ineligible under the NationalInsurance Law because they failed to beemployed for ten years or more (most ofthem are recent immigrants who arrivedafter age 60)40 also receive incomemaintenance, because they have no othersource of income.
Household ExpensesAs people age, the makeup of their
household consumption changes.41 Theshare of expenses for food, health, andhousing rises; the share of health andhousing in total outlays among theelderly is almost double that shareamong young people;42 and theproportion of expenses for clothing,footwear, culture, transport, andcommunications declines.
The 1992/93 Family ExpenditureSurvey reveals further differences,stemming chiefly from income level,between the 45-64 age group and the 65+cohort (Table 3).
In the low income per standard adultgroup, the highest share of expenses goes
for food (irrespective of age of head ofhousehold). In such households headedby people aged 65+, food accounts for30 percent of expenses; the next in orderare housing and home maintenance.
In the group of high income perstandard adult, in contrast, food expensesclaim a much smaller proportion ofhousehold outlays (only 13 percent in the65+ age group); larger fractions areallotted for housing, transport, andcommunications.
The rise in relative expenditure forhealth at all income levels reflects notonly the increase in morbidity and thedecline in functioning but also the flawsof the health system with respect togeriatric services. National healthinsurance does not cover the mostfrequent health needs of the elderly:medications for chronic illnesses (partialcoverage only), eyeglasses, dentalprosthetics, hearing aids, wheelchairs,walkers, dental care, visits to doctorswhen clinics are closed, and long-terminpatient care.
HOUSINGAbout two-thirds of elderly Israelis
reside in dwellings that they own; mostof the others live in dwellings owned bychildren or other relatives. Some of theseunits are not suited to the needs of elderlypeople for reason of size or access. Someare apartments in old and poorlymaintained buildings. Small dwellingsfor purchase and public dwellings forrental are not generally available. Manycannot afford to purchase housing or rentit on the free market. The Ministry ofConstruction and Housing has begunresponding to the housing needs of theindigent elderly by building shelteredhousing units countrywide, at relativelylow rent.
The Ministry assists elderly personswho lack housing43 by offering shelteredunits and, for those who live underordinary rental conditions, rentsubsidies. However, the assistanceprograms available44 are poorly suited tolow-income elderly because the grantsare too small.
The Housing Conditions of Senior CitizensAt first glance, home ownership
seems no different in the 65+ cohort thanin the 45-64 age group: 76 percent ofdwellings inhabited by people in the 65+age group are owner-occupied, 19percent are rented, and 5 percent areowned by others and made availablerent-free.45 The term “owner-occupied”may be misleading because when elderlypeople live with adult children, title tothe dwelling may be held by either theparent or the child.
A 1985 survey46 showed that two-thirds of persons aged 60+ lived indwellings that they owned, 22 percentin dwellings owned by their children, and10 percent in rental housing. Living indwellings owned by offspring iscommon among widows, more than 40
Table 3. Household Consumption, by Income and Age of Household Head (indeclining order)
High net income Low net incomeper standard adult per standard adult
Age 45-641. Housing*, transport, and communications** 1. Food
2. Food, education, and culture*** 2. Housing
3. Home upkeep**** 3. Home upkeep
4. Education and culture
Age 65+1. Housing 1. Food
2. Home upkeep 2. Housing
3. Transport and communications, health 3. Home upkeep, health
4. Food
Source: Central Bureau of Statistics, Survey of Household Expenditures 1992/1993.* Central-government taxes, rent, home insurance, and in-kind housing consumption.** Use of public transport and private taxis, travel abroad, and motor-vehicle expenses.*** Education services for children; newspapers and books; cultural performances; sports and entertain-ment; vacation, recreation, and outings; durable culture and entertainment products; and hobbies.**** Water, electricity, gas, fuel for home consumption, home maintenance and improvements, assistance athome, and miscellaneous household needs.
7Senior Citizens in Israel
percent of whom live with sons ordaughters. This is most common amongelderly Arabs and Mizrahi Jews, 31percent of whom fit this pattern asagainst 19 percent of Ashkenazi Jews.
Different origin groups have differentrates of home ownership. The proportionof elderly persons who rent their housingis almost twice as high among Mizrahimas among Ashkenazim. The disparityoriginates in the different economicsituations of the two population groupsand in the housing policy in effect whenthe immigrant transit camps wereevacuated. Public-housing companiesbuilt rental housing at that time, andalthough tenants were given anopportunity to purchase their dwellings,not all managed to do so. The dataindicate that the proportion of elderlyliving in rented apartments increasedbetween 1985 and 1991, evidentlybecause of housing policies vis-a-viselderly immigrants.
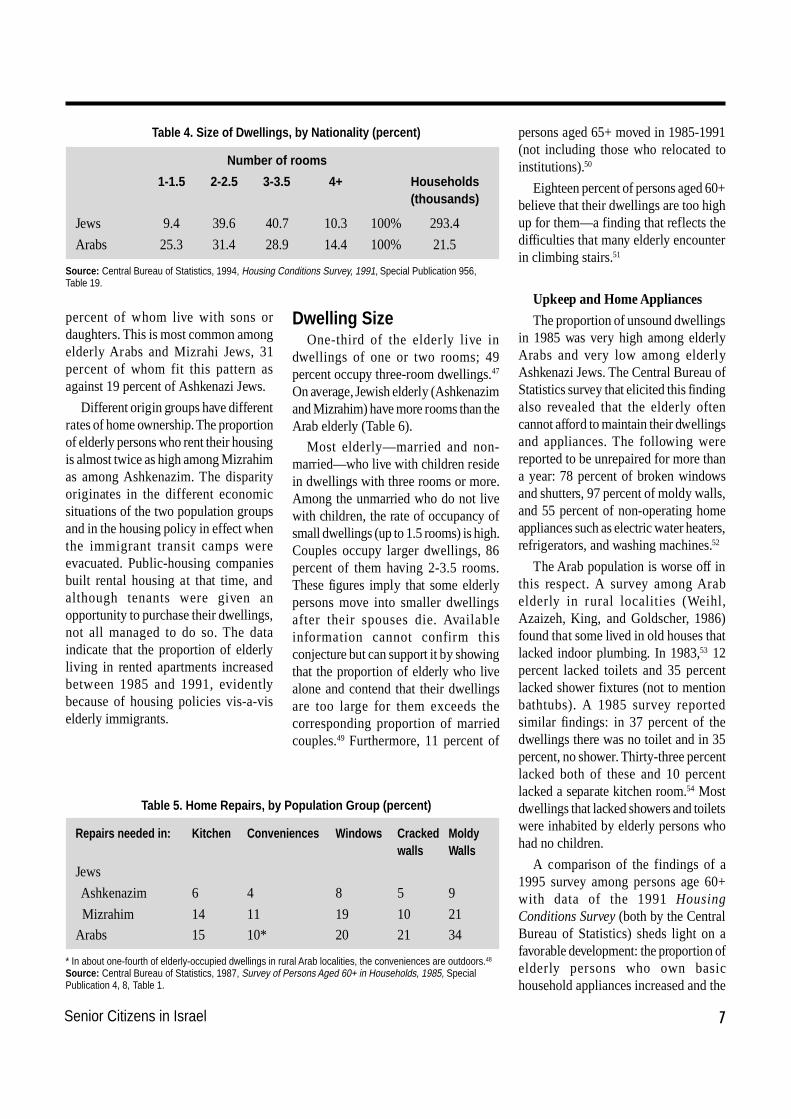
Dwelling SizeOne-third of the elderly live in
dwellings of one or two rooms; 49percent occupy three-room dwellings.47
On average, Jewish elderly (Ashkenazimand Mizrahim) have more rooms than theArab elderly (Table 6).
Most elderly—married and non-married—who live with children residein dwellings with three rooms or more.Among the unmarried who do not livewith children, the rate of occupancy ofsmall dwellings (up to 1.5 rooms) is high.Couples occupy larger dwellings, 86percent of them having 2-3.5 rooms.These figures imply that some elderlypersons move into smaller dwellingsafter their spouses die. Availableinformation cannot confirm thisconjecture but can support it by showingthat the proportion of elderly who livealone and contend that their dwellingsare too large for them exceeds thecorresponding proportion of marriedcouples.49 Furthermore, 11 percent of
Table 4. Size of Dwellings, by Nationality (percent)
Number of rooms
1-1.5 2-2.5 3-3.5 4+ Households(thousands)
Jews 9.4 39.6 40.7 10.3 100% 293.4
Arabs 25.3 31.4 28.9 14.4 100% 21.5
Source: Central Bureau of Statistics, 1994, Housing Conditions Survey, 1991, Special Publication 956,Table 19.
Table 5. Home Repairs, by Population Group (percent)
Repairs needed in: Kitchen Conveniences Windows Cracked Moldywalls Walls
Jews
Ashkenazim 6 4 8 5 9
Mizrahim 14 11 19 10 21
Arabs 15 10* 20 21 34
* In about one-fourth of elderly-occupied dwellings in rural Arab localities, the conveniences are outdoors.48
Source: Central Bureau of Statistics, 1987, Survey of Persons Aged 60+ in Households, 1985, SpecialPublication 4, 8, Table 1.
persons aged 65+ moved in 1985-1991(not including those who relocated toinstitutions).50
Eighteen percent of persons aged 60+believe that their dwellings are too highup for them—a finding that reflects thedifficulties that many elderly encounterin climbing stairs.51
Upkeep and Home Appliances
The proportion of unsound dwellingsin 1985 was very high among elderlyArabs and very low among elderlyAshkenazi Jews. The Central Bureau ofStatistics survey that elicited this findingalso revealed that the elderly oftencannot afford to maintain their dwellingsand appliances. The following werereported to be unrepaired for more thana year: 78 percent of broken windowsand shutters, 97 percent of moldy walls,and 55 percent of non-operating homeappliances such as electric water heaters,refrigerators, and washing machines.52
The Arab population is worse off inthis respect. A survey among Arabelderly in rural localities (Weihl,Azaizeh, King, and Goldscher, 1986)found that some lived in old houses thatlacked indoor plumbing. In 1983,53 12percent lacked toilets and 35 percentlacked shower fixtures (not to mentionbathtubs). A 1985 survey reportedsimilar findings: in 37 percent of thedwellings there was no toilet and in 35percent, no shower. Thirty-three percentlacked both of these and 10 percentlacked a separate kitchen room.54 Mostdwellings that lacked showers and toiletswere inhabited by elderly persons whohad no children.
A comparison of the findings of a1995 survey among persons age 60+with data of the 1991 HousingConditions Survey (both by the CentralBureau of Statistics) sheds light on afavorable development: the proportion ofelderly persons who own basichousehold appliances increased and the

8 The Israel Equality Monitor November 1998
disparity between the 65+ age group andthe 45-64 cohort diminished. In 1985,22 percent of the dwellings inhabited bythe elderly lacked telephones;55 six yearslater, this proportion had fallen to 8.1percent.56 The proportion of elderly whoheated their water with solar fixtures roseby 5 percent,57 and the share of elderlywho owned home heating equipmentalso increased slightly.58
The 1991 Housing Conditions Surveyshows that relatively fewer elderly (65+)than younger people owned washingmachines or vacuum cleaners. Even ifthe disparity traces to intergenerationaldifferences in lifestyle, the lack of theseappliances obviously makes householdmanagement more difficult.
Noam and Sicron (1990)59 show thatdifferent types of households owndifferent home appliances. Widows andwidowers who do not live with theirchildren have fewer appliances thanmarried couples who do not live withchildren, and appliances are muchscarcer in the homes of widowers thanin those of widows. Elderly persons wholive with their children have a higherstandard of living than those who livealone.
Data from the 1983 PopulationCensus show that the Arab elderly have
scantier household equipment than theJewish elderly and Arab householdsgenerally.
An examination of appliances inhouseholds of Arab elderly who areentitled to long-term care benefits60
showed that a considerable share ofseniors’ household appliances were inpoor repair: 25 percent of refrigerators,23 percent of solar or electric waterheaters, 25 percent of washing machines,and 16 percent of television sets.
Housing of ElderlyImmigrants 61
Elderly immigrants, like allimmigrants, are entitled to rent subsidiesand subsidized housing loans. Bothsources of assistance, however, aredesigned for working people who havesources of income from which they mayrepay loans or round up the sum neededfor rent on the free market. Old-agebenefits do not provide enough incomefor this. This probably explains why 86percent of seniors who immigrated fromthe former Soviet Union between 1989and the mid-1990s live with children orother relatives, even though two-thirdsof them lived alone or with a spousebefore immigration. Shared housingimproves both generations’ economic
circumstances but burdens the livingconditions—congestion, change inlifestyle, and lack of independence inhousehold management—of everyoneinvolved. Some of these elderly mayeventually seek other housing options,such as sheltered settings.
The proportion of elderly whoimmigrate without children has beenclimbing over the years; special housingoptions need to be arranged for them inthe long term. One of the possibilitiesbeing considered is sheltered housing.
Sheltered Housing 62
At the end of 1994, Israel had 8,990sheltered housing units for seniors.63
About 35 percent were publicly owned;the rest were owned by volunteerorganizations and private landlords (33percent and 32 percent, respectively).The public settings are run by localassociations for the elderly or are inapartment buildings owned bycompanies such as Amigour, which serverecent immigrants in the main. Thesedwellings are assigned to indigentelderly without entrance fees. In contrast,tenants of units under non-publicownership must pay entrance fees thatare sometimes quite steep, along withcommensurate monthly payments.
The number of public dwellingsincreased substantially in 1995.64
Sheltered housing is not meant to bea substitute for independent housing,even though today there is evidently atendency to regard it as a way of solvingthe housing distress of some indigentelderly. Sheltered housing is designed tooffer an alternative to theinstitutionalization of independentelderly persons by providing support andprotection in the form of basic servicesfor seniors who are still able to live ontheir own.
Table 6. Frequency of Household Appliances, Rural Arab Population,by Generations in Household (percent)
Single- Multi- Total Totalgeneration generation Arabhousehold household population
(including urban)
Electric heater 21 36 30
Kerosene heater 30 42 37
Refrigerator 66 90 81 91
Stove 16 39 39
Washing machine 17 42 33 44
Radio 46 79 66
Television 27 76 57 83
Source: Weihl et al., 1986, Table 28.

9Senior Citizens in Israel
Health Needs of the ElderlyPeople’s health-care needs increase
with age, and the proportion of privateand public expenditure required to meetthem climbs commensurably.65 Theuptrend is manifested in many ways:persons in the 65+ group visit doctorsmore frequently than those in the 45-64cohort,66 their rate of generalhospitalization is higher, and theiraverage stay in hospitals is longer.67 Alarge majority of the 13,706 patients innursing wards in 1996 were over the ageof 65 .68
The proportion of persons disabledrises with age. Only 70 percent of thoseaged 80+, as against 97 percent in the60-64 group, report that they are able toleave home without assistance.Additionally, the proportion ofbedridden persons rises from 0.2 percentto 2.0 percent.69 The proportion ofpersons able to move around outsidetheir homes decreases from 86 percentin the 65-74 cohort to 49 percent at age80+. After age 80, 74 percent of personsfind it difficult to use stairs and 70percent have difficulty in getting on andoff buses.70 The proportion of those whohave difficulty in carrying out personalfunctions (bathing, dressing, carryingobjects) and those with hearing andvision disorders also rises with age.
These data point to the extent and typeof needs that elderly citizens encounteras a result of health problems. Those whohave functional disabilities but do notlive in institutions need, in addition tohealth services, regular assistance inactivities of daily life—includinghousehold management (if they livealone) and, at times, technical aids suchas walkers, wheelchairs, specialmattresses, and hearing and visual aids.Except for nursing and medical
supervision, these services are coveredneither by compulsory health insurance71
nor by other public services, except fora nursing care benefit72 for those with ahigh degree of disability. The mainvictims of these omissions are the low-income elderly.
Admission to GeneralHospitals
In most general hospital wards exceptfor pediatrics, obstetrics, gynecology,and oncology, the 65+ age group is over-represented relative to its share in thepopulation.73 As of 1996, seniorsaccounted for about one-third of hospitalpatients and 37 percent of inpatient daysin general hospitals.74
Geriatric HospitalizationIn addition to general hospitalization,
many of the elderly need long-terminpatient care because of irreversiblehealth problems. Forty percent of allhospital beds (as of 1996)75 werereserved for long-term patients.76
Between 1983 and 1996, the number ofsuch beds increased by 134.8 percent 77
and the proportion of beds per thousandpersons grew rapidly.78 Although theserates point to large public and privateinvestments in the development of theseservices, it is not clear whether thesupply suffices for current needs, letalone for the anticipated increase in thenumber of “old-old” (75+) in the nextfew years.79 The daily cost of long-termhospitalization is much lower than thatof “ordinary” inpatient care, but thepatient’s stay is much longer—162 dayson average in 1996, as against 4.4 daysin regular wards.80
Geriatric inpatient facilities aredefined by law as hospitals and requirea license from the Ministry of Health.
The Health Ministry has establishedthree categories of patients in need oflong-term inpatient care:81
1. Long-term (nursing) patients—those whose medical problems requireprolonged and skilled medicalsupervision and whose condition meetsone or more of the following criteria:bedridden or wheelchair-bound,incontinent, or virtually non-ambulatorybecause of pathologies or complicationsof various illnesses.
2. Long-term (nursing) patientswith multiple problems—nursingpatients who have illnesses that requireconstant medical treatment andsupervision, e.g., pressure sores, cancer,or renal failure.
3. Patients who are mentally frailbut not bedridden.
The list of services covered byNational Health Insurance applies onlyto multiple-problem nursing patients, buteven they do not qualify for full coverageof inpatient care. As of the end of 1996,they had to pay more than NIS 100 perinpatient day. According to a survey bythe JDC-Brookdale Institute, multiple-problem nursing patients accounted for3-4 percent of geriatric inpatientadmissions in 1990.82
There are no accurate statistics on thedemographic structure of the geriatricinpatient population; the informationbelow is derived from data on allresidents of institutions for the elderly.83
A majority of the institutionalizedelderly are women, possibly becausemost widows have no one to take careof them at home. The share of MizrahiJews is much lower than that ofAshkenazim.84 Although this seems toindicate that the Mizrahi group is less inneed of “institutional arrangements”
HEALTH AND HEALTH SERVICES
10 The Israel Equality Monitor November 1998
outside the home, this explanationshould not be accepted at face valuebecause some Mizrahim, as members ofa lower income group than Ashkenazim,find it hard to afford inpatient care evenwhen the state shares the expense.Furthermore, the proportion of childlesselderly who cannot arrange non-institutional care alternatives is lower inthis group.85
Until recently, the Arab populationshowed no interest in geriatrichospitalization and the number of Arabinpatients was negligible. Since the firstgeriatric ward for the Arab populationwas opened, Arabs have exhibited muchgreater willingness to be admitted tosuch institutions.86 Demand for beds ison the rise, and public and privateagencies are working on ways to meetit.
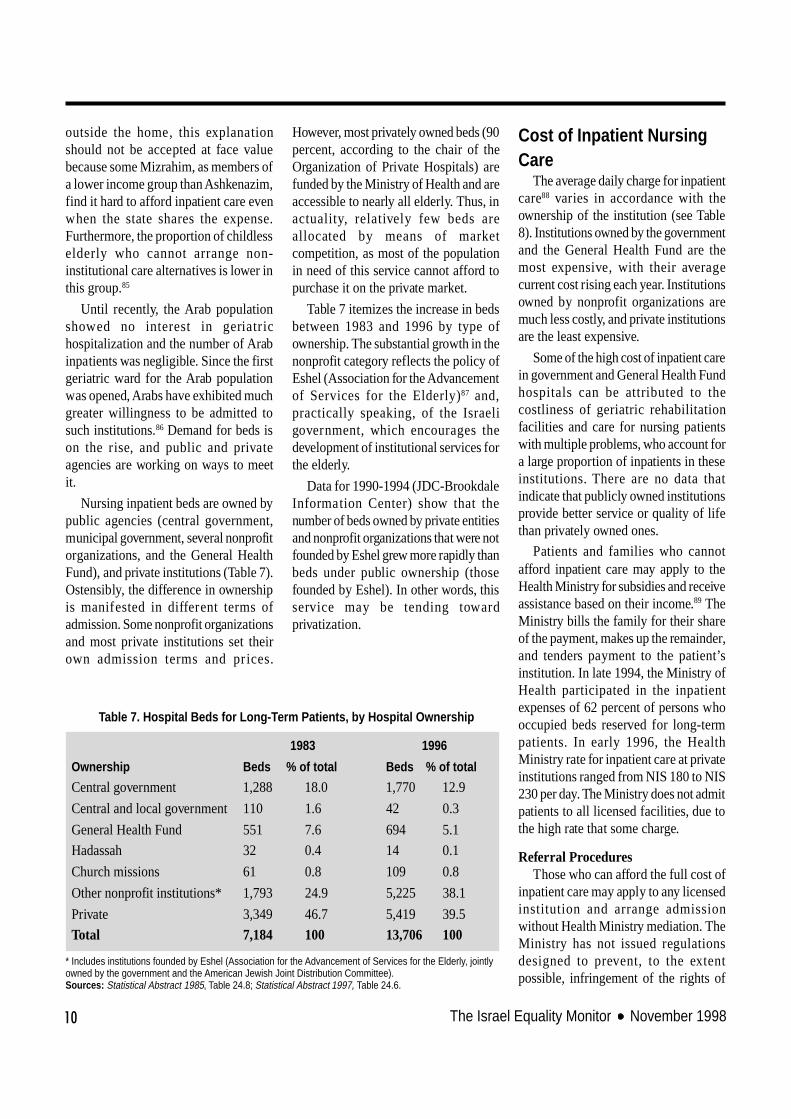
Nursing inpatient beds are owned bypublic agencies (central government,municipal government, several nonprofitorganizations, and the General HealthFund), and private institutions (Table 7).Ostensibly, the difference in ownershipis manifested in different terms ofadmission. Some nonprofit organizationsand most private institutions set theirown admission terms and pr ices.
However, most privately owned beds (90percent, according to the chair of theOrganization of Private Hospitals) arefunded by the Ministry of Health and areaccessible to nearly all elderly. Thus, inactuality, relatively few beds areallocated by means of marketcompetition, as most of the populationin need of this service cannot afford topurchase it on the private market.
Table 7 itemizes the increase in bedsbetween 1983 and 1996 by type ofownership. The substantial growth in thenonprofit category reflects the policy ofEshel (Association for the Advancementof Services for the Elderly)87 and,practically speaking, of the Israeligovernment, which encourages thedevelopment of institutional services forthe elderly.
Data for 1990-1994 (JDC-BrookdaleInformation Center) show that thenumber of beds owned by private entitiesand nonprofit organizations that were notfounded by Eshel grew more rapidly thanbeds under public ownership (thosefounded by Eshel). In other words, thisservice may be tending towardprivatization.
Cost of Inpatient NursingCare
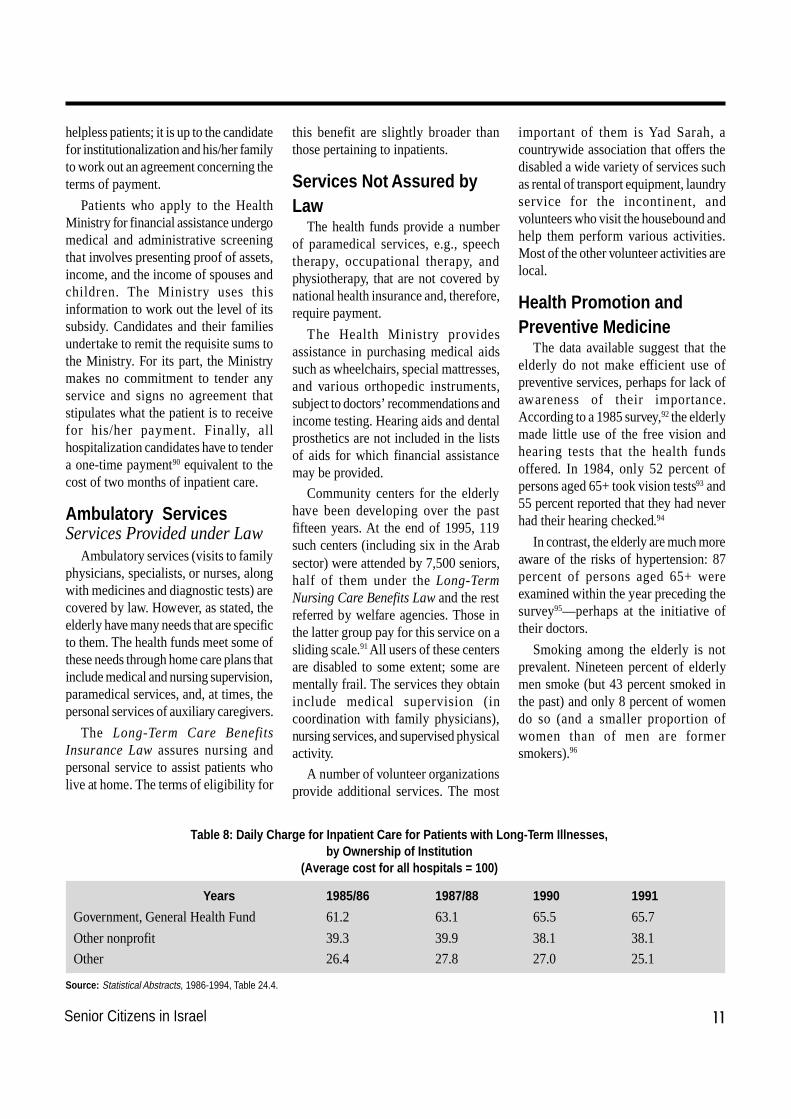
The average daily charge for inpatientcare88 varies in accordance with theownership of the institution (see Table8). Institutions owned by the governmentand the General Health Fund are themost expensive, with their averagecurrent cost rising each year. Institutionsowned by nonprofit organizations aremuch less costly, and private institutionsare the least expensive.
Some of the high cost of inpatient carein government and General Health Fundhospitals can be attributed to thecostliness of geriatric rehabilitationfacilities and care for nursing patientswith multiple problems, who account fora large proportion of inpatients in theseinstitutions. There are no data thatindicate that publicly owned institutionsprovide better service or quality of lifethan privately owned ones.
Patients and families who cannotafford inpatient care may apply to theHealth Ministry for subsidies and receiveassistance based on their income.89 TheMinistry bills the family for their shareof the payment, makes up the remainder,and tenders payment to the patient’sinstitution. In late 1994, the Ministry ofHealth participated in the inpatientexpenses of 62 percent of persons whooccupied beds reserved for long-termpatients. In early 1996, the HealthMinistry rate for inpatient care at privateinstitutions ranged from NIS 180 to NIS230 per day. The Ministry does not admitpatients to all licensed facilities, due tothe high rate that some charge.
Referral ProceduresThose who can afford the full cost of
inpatient care may apply to any licensedinstitution and arrange admissionwithout Health Ministry mediation. TheMinistry has not issued regulationsdesigned to prevent, to the extentpossible, infringement of the rights of
Table 7. Hospital Beds for Long-Term Patients, by Hospital Ownership
1983 1996
Ownership Beds % of total Beds % of total
Central government 1,288 18.0 1,770 12.9
Central and local government 110 1.6 42 0.3
General Health Fund 551 7.6 694 5.1
Hadassah 32 0.4 14 0.1
Church missions 61 0.8 109 0.8
Other nonprofit institutions* 1,793 24.9 5,225 38.1
Private 3,349 46.7 5,419 39.5
Total 7,184 100 13,706 100
* Includes institutions founded by Eshel (Association for the Advancement of Services for the Elderly, jointlyowned by the government and the American Jewish Joint Distribution Committee).Sources: Statistical Abstract 1985, Table 24.8; Statistical Abstract 1997, Table 24.6.
11Senior Citizens in Israel
helpless patients; it is up to the candidatefor institutionalization and his/her familyto work out an agreement concerning theterms of payment.
Patients who apply to the HealthMinistry for financial assistance undergomedical and administrative screeningthat involves presenting proof of assets,income, and the income of spouses andchildren. The Ministry uses thisinformation to work out the level of itssubsidy. Candidates and their familiesundertake to remit the requisite sums tothe Ministry. For its part, the Ministrymakes no commitment to tender anyservice and signs no agreement thatstipulates what the patient is to receivefor his/her payment. Finally, allhospitalization candidates have to tendera one-time payment90 equivalent to thecost of two months of inpatient care.
Ambulatory ServicesServices Provided under Law
Ambulatory services (visits to familyphysicians, specialists, or nurses, alongwith medicines and diagnostic tests) arecovered by law. However, as stated, theelderly have many needs that are specificto them. The health funds meet some ofthese needs through home care plans thatinclude medical and nursing supervision,paramedical services, and, at times, thepersonal services of auxiliary caregivers.
The Long-Term Care BenefitsInsurance Law assures nursing andpersonal service to assist patients wholive at home. The terms of eligibility for
this benefit are slightly broader thanthose pertaining to inpatients.
Services Not Assured byLaw
The health funds provide a numberof paramedical services, e.g., speechtherapy, occupational therapy, andphysiotherapy, that are not covered bynational health insurance and, therefore,require payment.
The Health Ministry providesassistance in purchasing medical aidssuch as wheelchairs, special mattresses,and various orthopedic instruments,subject to doctors’ recommendations andincome testing. Hearing aids and dentalprosthetics are not included in the listsof aids for which financial assistancemay be provided.
Community centers for the elderlyhave been developing over the pastfifteen years. At the end of 1995, 119such centers (including six in the Arabsector) were attended by 7,500 seniors,half of them under the Long-TermNursing Care Benefits Law and the restreferred by welfare agencies. Those inthe latter group pay for this service on asliding scale.91 All users of these centersare disabled to some extent; some arementally frail. The services they obtaininclude medical supervision (incoordination with family physicians),nursing services, and supervised physicalactivity.
A number of volunteer organizationsprovide additional services. The most
important of them is Yad Sarah, acountrywide association that offers thedisabled a wide variety of services suchas rental of transport equipment, laundryservice for the incontinent, andvolunteers who visit the housebound andhelp them perform various activities.Most of the other volunteer activities arelocal.
Health Promotion andPreventive Medicine
The data available suggest that theelderly do not make efficient use ofpreventive services, perhaps for lack ofawareness of their importance.According to a 1985 survey,92 the elderlymade little use of the free vision andhearing tests that the health fundsoffered. In 1984, only 52 percent ofpersons aged 65+ took vision tests93 and55 percent reported that they had neverhad their hearing checked.94
In contrast, the elderly are much moreaware of the risks of hypertension: 87percent of persons aged 65+ wereexamined within the year preceding thesurvey95—perhaps at the initiative oftheir doctors.
Smoking among the elderly is notprevalent. Nineteen percent of elderlymen smoke (but 43 percent smoked inthe past) and only 8 percent of womendo so (and a smaller proportion ofwomen than of men are formersmokers).96
Table 8: Daily Charge for Inpatient Care for Patients with Long-Term Illnesses,by Ownership of Institution
(Average cost for all hospitals = 100)
Years 1985/86 1987/88 1990 1991
Government, General Health Fund 61.2 63.1 65.5 65.7
Other nonprofit 39.3 39.9 38.1 38.1
Other 26.4 27.8 27.0 25.1
Source: Statistical Abstracts, 1986-1994, Table 24.4.

12 The Israel Equality Monitor November 1998
Personal Services Provided byWelfare Bureaus
Welfare services are provided by thestate—through the agency of municipalgovernments—and by volunteerorganizations and private businesses.These services are not enshrined in law.97
The 1958 Welfare Services Law stressesthis by stating that municipalgovernments are obligated to establishan organizational entity to which theneedy may apply, but “this means neitheran obligation to provide services of anydefined extent and substance nor a legalentitlement of the needy to specificassistance.”98
To qualify for welfare servicesthrough municipal bureaus, one mustmeet criteria set forth by the Ministry ofLabor and Social Affairs. Practicallyspeaking, services are available onlywhen the welfare bureau in theapplicant’s locality has budget provisionsfor them. Most municipal authorities arerequired to cover 30 percent of theirwelfare outlays from their own budgets;the Ministry of Labor and Social Affairsmakes up the rest.
In addition to the central-governmentallocation, welfare services for theelderly can call on extra-budgetarysources. The American Jewish JointDistribution Committee participates withthe state in budgeting Eshel (Associationfor the Advancement of Services for theElderly) and Mifal Hapayis, the statelottery, subsidizes the construction ofold-age homes and community facilitiessuch as day centers. Additionally,welfare services may avail themselvesof private sources such as assistancefunds and charitable loan funds ofvarious kinds.
Volunteer activities in the old-age
field focus on building and managingresidences for the independent elderlyand operating social clubs and shelteredhousing. Private businesses deal mainlyin institutional services and shelteredhousing.
These services are administered underguidelines set up by the Ministry ofLabor and Social Affairs (social workregulations) concerning the services thatthe bureaus may provide and the mannerof their provision. Eligibility for servicessuch as home assistance, home repairs,hot meals, and placement in geriatric daycenters and old-age homes hinges on anincome test.99 In contrast, advisoryservices and personal care by a socialworker are provided irrespective of theapplicant's income level.
The Ministry of Labor and SocialAffairs does not release information onthe extent of personal services offeredby the welfare bureaus, although all thebureaus keep records.100 Thus, thefollowing discussion of welfare servicesis based on data obtained from thebureaus of Jerusalem101 and Tel Aviv.102
In 1994, 50 percent of applicants’ filesin Tel Aviv and 38 percent in Jerusalempertained to the elderly (men aged 65+and women aged 60+). Fifteen percentof seniors in Tel Aviv and 9 percent ofthose in Jerusalem had active files.103
These differences are interesting becausethe share of elderly in the lowest incomebracket (those who receive incomemaintenance in addition to the old-agebenefit) was higher in Jerusalem than inTel Aviv (31 percent vs. 25 percent).104
In both cities, the share of the elderlyamong clients at the neighborhoodbureaus is different: from 38 percent to73 percent in Tel Aviv105 and from 36percent to 46 percent in Jerusalem. Thesedifferences106 indicate that the size of the
welfare clientele depends not only on thepopulation’s needs but also on workingprocedures, the overt and covertpriorities of each bureau, availableresources, clients’ information aboutservices, the public image of the service,and people’s willingness to requestassistance and endure the inconvenienceof the administrative procedures. On thebasis of the data that the Tel Aviv andJerusalem welfare departments sharedwith us, we may adduce the following:
a. The share of elderly amongwelfare clients is evidently in the vicinityof 50 percent,107 much higher than theproportion of this age groupcountrywide. This reflects thevulnerability of the elderly populationand its lack of basic resources.
b. The average caseload of geriatricsocial workers is twice that of socialworkers who deal with other populationgroups. This indicates that personnel arebeing allocated disproportionately,probably on the assumption that care forthe elderly is less time-intensive thancare of other clients. We do not know ifthis assumption has ever been examined;in any case, the information we weregiven places it in doubt. Data from theTel Aviv Municipality for 1995 show that59 percent of new clients at themunicipal welfare departments wereelderly: reviewing the needs of newapplicants is a painstaking process.
c. According to data from the TelAviv Municipality, 56 percent of elderlywelfare clients have serious healthproblems: 39 percent are defined as veryphysically frail, 9 percent as nursingpatients, and 8 percent as mentally frail.The high rate of “very physically frail”in the caseload illuminates thelimitations of the Long-Term CareBenefits Insurance Law, attesting to the
WELFARE SERVICES
13Senior Citizens in Israel
existence of a seriously disabledpopulation group that does not qualifyfor nursing benefits but needs supportservices, especially if family support isnot available.
Personal Services underthe Long-Term CareInsurance Law
The Long-Term Care BenefitsInsurance Law, activated in 1988, createsnursing benefit eligibility for men overage 65 and women past age 60 if theyhave severe disabilities, and live at home.The size of the benefit corresponds tothe extent of the patient’s inability toperform personal care actions on his orher own. The rate thus computed isweighted for the availability (or non-availability) of family assistance. Exceptfor special cases, the benefit is not givendirectly to eligibles; rather, it is translatedinto eligibility for hours of service thatare provided by outside agencies whichreceive payment from the NationalInsurance Institute.
Eligibility for the benefit is contingenton an income test. At the beginning of1998, the threshold for an individual wasNIS 5,605 per month (the nationalaverage wage). The cut-off point for acouple was NIS 8,408.
The proportion of the relevant agegroup qualifying for benefits under theLong-Term Care Benefits Insurance Lawhas been rising: from 5.3 percent in early1990108 to 9.8 percent in 1996.109
Community ServicesCommunity services for the elderly
have expanded considerably in the pastten years, foremost thanks to Eshel111 andthe Israel Community CentersCorporation. Eshel delivers its servicesby means of municipal associations forthe elderly, which sponsor and operateservices at the local level. In 1995, some100 local associations were operatingunder the Eshel umbrella.112 The
Community Centers Corporation offersprograms for some 30,000 elderlypersons in two-thirds of its facilities,including some in the non-Jewish sector.This activity, unlike that usually offeredin social clubs, includes programs forindependent activity113 andempowerment.
Day CentersDay centers are for disabled elderly
who live at home and need activity,human contact, nursing care, andmedical supervision. Because more thanhalf of their clients are eligible for thisservice as part of the long-term carebenefit, a high proportion of attendeeshave severe disabilities.
The proportion of disabled elderlywho attend day centers variesgeographically: 10 percent in Tel Avivand Jerusalem, 15 percent in Haifa, and20 percent in the Central District.114
These differences point to differentpatterns of use and raise questions aboutlocal operating and attendance policiesand the availability of services indifferent parts of the country.
Day center services have expandedvastly in the past few years. In 1990, 53centers served 3,875 elderly; at the endof 1994, 119 centers, including 6 in Arablocalities, served 7,500 seniors, 1.5percent of the entire elderlypopulation.115 By the end of 1997, 147centers served nearly 11,000 seniors,approximately 2 percent of the relevantpopulation group. Nevertheless, ashortage of 1,400 places is expected bythe year 2000.116
Community services are not availableto the entire population because theirformation depends on the initiative andsize of the municipal government. Asmall municipal government cannotsustain community geriatric servicesbecause its population of seniors is notlarge enough.
Most of the centers (84 percent) were
founded by Eshel and are run by localassociations backed by the municipalgovernment. Payment for service isgraded by degrees of eligibility for theservices of municipal welfare bureaus.
A few day centers are administeredby volunteer organizations; 6 percent arerun by private agencies.117
Convalescent CentersConvalescent centers provide a
therapeutic-rehabilitative service forseniors following hospitalization. Theyalso provide a warm home for those inneed of a sheltered setting for limitedperiods of time. Such centers areavailable today in six localities,sponsored by public associations andmunicipal governments in conjunctionwith the Ministry of Labor and SocialAffairs.118 Payment for this service is ona sliding scale.
In Jerusalem, 454 seniors used thisservice in 1995.
Social ClubsIn 1994, there were roughly 700
social clubs for the elderly, including 400in urban localities. They were run bymunicipal governments and volunteeragencies such as Mishan, WIZO,Emunah, the Community CentersCorporation, and smaller localorganizations. The clubs’ hours ofactivity are not uniform. Four to sixpercent of the clubs’ clients are disabledseniors.119 The clubs offer diverseactivities for men and women together,except in the Arab sector, where mostactivities are separate.120
Volunteer ActivityVolunteer organizations offer regular
services for the elderly, sometimes on alarge scale. Yad Sarah, for example,serves a large population of seniorsincluding button-activated alarm systemsand laundry service for the incontinent.Yad la-Qashish in Jerusalem providessheltered employment and related
14 The Israel Equality Monitor November 1998
services, and the National InsuranceInstitute engages many retirees inassisting other elderly persons.Miscellaneous volunteer agenciesprovide the elderly with many servicesin coordination with municipal welfaredepartments. (A network ofneighborhood centers in Jerusalem, forexample, has 884 volunteers.) Finally,Magen David Adom (emergencyservices) runs a telephone contact systemfor seniors who require such care.
Institutional ServicesThe Inspection of Residences
Regulations (Upkeep of Independent andFrail Elderly in Old-Age Homes, 1986)charge the Ministry of Labor and SocialAffairs with licensing and inspectingold-age homes. The regulations setcompulsory standards in most fields ofthe institutional system. In the middle of1996, the country had 102 licensed old-age homes and another 100 in the midstof the licensing process. The number ofbeds in licensed homes was 12,460 atthe end of 1994, and 46 percent of themwere reserved for the frail.121 Additionalhomes that have not applied to theMinistry for licenses also exist.122
Report 46 of the Israel StateComptroller deals at length with theproblem of licensing and inspecting old-age homes and the process of shuttingthem down. According to the report, 69percent of the 226 residences that wereactive in 1995 were unlicensed. Thirty-two of them had been targeted for closurebut continued to operate because of thedifficulty in closing old-age homeswhose tenants have nowhere else to go.Additional unlicensed homes continue tooperate because most of their tenantshave become nursing patients; in suchcases, the Ministry of Labor and SocialAffairs is not allowed to issue them alicense, and the Ministry of Health does
not do so for budgetary reasons.
Population of Old-AgeHomes
Tenants’ level of physical functioning:Tenants of old-age homes arecategorized as independent or frail,depending on their ability to functionphysically. The legal definition ofphysically frail elderly123 indicates thatthis category is variable. There aredifferent levels of frailty, from personswho need assistance in a few activitiesof daily living to those whoseindependence is very seriouslyconstrained. Fifty-four percent of tenantsof homes for the aged were independentin 1994 (Table 8), as against 60 percentfour years previously.124 The decreasereflects the Ministry’s policy ofminimizing the institutionalization ofindependent elderly and the growingtendency of the independent elderly toprefer sheltered housing over old-agehomes.
The inspection regulations requireold-age homes to provide special settingsor departments for frail tenants becausethese seniors’ needs are different fromthose of the independent. Small facilitiessometimes lack such settings eventhough frail elderly live there. Somehomes allow frail tenants to hire privatecaregivers.
Tenants’ age: Available data125 showthat about two-thirds of institutionalizedelderly (including those in inpatientfacilities) are past the age of 80. Thisfigure reflects the new tendency126 toseek institutionalized service only afterall other possibilities have beenexhausted. Community services,including those provided under the Long-Term Care Benefits Insurance Law, givethe elderly many more ways to meet theirneeds than in the past.
More than 70% of institutionalizedseniors are women—nearly all of themwidows—and the number of married
couples is negligible. It stands to reasonthat institutional settings become moreattractive after the death of one’s spouse.
The number of institutionalizedseniors who lack available offspring isnot known but is presumablyconsiderable.127 Without relatives whocan provide assistance, elderly peoplefind it very difficult to maintain areasonable quality of life in an old-agehome.
Be'er and Factor (1993, Table 13)show that the share of Mizrahi tenantsin institutions (including inpatientfacilities) is much lower than their shareamong the elderly at large. The disparityis likely greater among tenants of old-age homes than among nursing-homepatients because most nursing homes,unlike old-age homes, do not haveparticularistic admission criteria (like,for example, homes for senior citizenswho come from Germany), and becausemost nursing-home patients qualify forstate funding assistance.128
Ownership of Old-AgeHomes
The distribution of beds in old-agehomes by type of ownership (Table 9)shows that relatively few beds are ownedby the public sector (including nationaland municipal governments) and thatmost beds owned by such agencies—84percent—are earmarked for the frailelderly. The volunteer nonprofit sectorfocuses on institutional services forindependent elderly. Private businessescater to both categories almost equally.This situation reflects the Ministry’slong-standing policy of avoiding directprovision of services and encouragingservice development by other agencies,with the accent on service quality.
This policy is manifested foremost inthe essence of Eshel’s activity, thedevelopment of relatively inexpensiveinstitutional and community services forthe entire population of frail and nursing

15Senior Citizens in Israel
elderly. Eshel’s modus operandi, whichentails extensive involvement ofcommunity representatives in serviceplanning and operation, also enhancesthe community’s awareness of itsresponsibility for maintaining andsupervising welfare services. The policyof the government (and the JDC) withrespect to the development ofinstitutional services is reflected in Table9, which shows that between 1990 and1994, the steepest increase occurred inthe number of beds for the physicallyfrail; the number of beds for theindependent decreased in the public andthe volunteer sectors.129 The table alsoshows that the private market (and thevolunteer sector130) has been developingmore quickly than the public sectordespite the vigorous activity of Eshel.
Size of Old-Age HomesThere is a strong correspondence
between the type of ownership and thesize of an old-age home. Be'er and Factor(1993, Table 3) show that, on average,privately owned homes have much fewerbeds than homes under other ownership.A large home facilitates optimal use ofstaff and space and diversification ofservices, including leisure activities. Thesize of the home is especially significantfor frail tenants, who need many specialservices. The 1986 regulations for the
inspection of old-age homes, whichinclude provisions for meeting thetherapeutic and physical needs of frailtenants, apply to large homes only. Onlyfacilities with 100 tenants or more, forexample, must have a bathroom tailoredto the needs of the physically frail. Theprovisions omit such stipulations forsmaller homes, even though frail seniorsalso live there.
Paying for Institutionalization
Most tenants of old-age homes—some 70 percent—cover the full cost oftheir institutionalization by themselves;the rest need assistance from the state.131
The level of state assistance depends onapplicants’ financial resources, includingthose of their spouses and children. Theshare of payment assigned to theadmission candidate and his/her childrenis determined by an income test; the statemakes up the difference.
LOOKINGAHEAD
Israel belongs to the group ofcountries that have a high proportion ofpensioners (age 65+) relative to the shareof breadwinners. This fraction will growsteadily as life expectancy increases andbirth rates fall, and as it does, so will theeconomic burden on society. In view ofthis predictable development, it isnecessary to examine and improve thearray of geriatric services and to adjustit—to the extent possible—to futuredevelopments. In this context, severalremarks are in order:
* The proportion of seniors wholive solely on National Insurance (SocialSecurity) old-age benefits (includingincome maintenance) has fallen in thepast few years but remains high. As longas retirement saving is not compulsory,many people will reach this stage of lifewithout an income of their own and willfall into the lowest income category.
* The post-65 period amounts toabout one-fourth of an adult’s lifespan(Life expectancy at age 65 is 15.8 yearsfor men and 17.9 years for women132).During this lengthy period, significantchanges take place in various areas ofpersonal life, as manifested, especiallyin older age groups, in the deteriorationof health and independence. The resultis an increase in the share of expensesfor health and household services. In thelow income brackets, this increase comesat the expense of other vital needs, suchas replacing worn household appliances,travel for social-contact purposes, leisureactivity, and even food. The shapers ofthe income maintenance policy havetreated this period of life as one in whichneeds and expenses do not change, rulingthat the level of income maintenance for
Table 9. Distribution of Beds for Independent and Frail Elderly, by Ownership,1990-1994
1990 1994
Type of bed
Ownership Independent Frail Total Independent Frail Total
Public (stateand Eshel) 545 1,556 2,101 333 1,737 2,070
Volunteerorganizations 4,425 1,190 5,615 4,201 1,447 5,648
Private 1,838 1,831 3,669 2,134 2,548 4,682
Total 6,808 4,577 11,385 6,668 5,732 12,400
Source: Information Center, JDC-Brookdale Institute
16 The Israel Equality Monitor November 1998
the elderly should remain constantthroughout the period.
* Three government offices—theMinistry of Health, the Ministry of Laborand Social Affairs, and the NationalInsurance Institute—are responsible forplanning and delivering services for thedisabled elderly, each in its own domain.This fragmentation works to the disfavorof the elderly population. Each agencyoperates on its own “turf,” within its ownbudgetary and political constraints, andunder its own priorities. For this reason,services for this population have becomesegmented, and in some areas theresponse to needs is deficient. Anexample is the dividing line between thefrail elderly (those who live at home aswell as those who live in institutions) andnursing patients. For lack of an inclusiveapproach toward service planning andresource allocation, no meaningful effortis being made to prevent thehospitalization of patients who neednursing services. Some of these patientscould remain at home if more extensiveassistance for housebound patients wereavailable, but it seems that this goal willbe attained only when the geriatric carebudget is assigned to a single agency.
* The high proportion of elderlyamong consumers of welfare services(health, income maintenance, and socialservices) is the inverse of their share ofthe population and is not reflected in theservice systems’ priorities. A typicalexample is the array of geriatric inpatientservices. The need for inpatient care iswidespread (chiefly in the oldest agegroups). Despite the fact that it isrelatively inexpensive and that those inneed have paid health insurancepremiums for many years, it is notcovered by National Health Insurance.133
Obviously, full funding of this servicefrom the state budget would create aheavy economic burden,134 but there isreason to ask why, of all health-systemservices, this one was singled out for
omission from the National HealthInsurance Law. Ignoring the needs of anentire age group, while the NationalHealth Insurance Law covers all theneeds of young people, appears to be anact of discrimination. Such a policy cancome about only where the stateconsiders the elderly a burden thatsociety need not bear and where theelderly lack the political clout to defendtheir rights. The establishment’s stanceon this matter is questionable, especiallyin view of the investments being madein the development of medicalknowledge, which has extended lifeexpectancy and the term of need fornursing care services.135

17Senior Citizens in Israel
References1 The definition of elderly as persons
aged 65+ is accepted in internationalpublications and in UN statistics.
2 Central Bureau of Statistics(hereinafter: CBS), 1995, Statistical Abstract ofIsrael, 1996, Table 2.10. Israel’s population isyoung in comparison with Europe, NorthAmerica, and Japan.
3 Jack Habib, 1992. Policy Issues in anAging Society. JDC Israel, Brookdale Instituteof Gerontology and Human Development, R-62-92, p. 1.
4 The high proportion of children in theArab population explains the significantdifference between the population groups.
5 CBS, Statistical Abstract of Israel1994, Table 2.22. The principal source of data inthis section is CBS, Statistical Abstract ofIsrael, 1996 (hereinafter: Statistical Abstract).
6 Statistical Abstract, Table 3.20.7 Statistical Abstract, Table 2.21.8 Statistical Abstract, Table 2.22.9 CBS, 1989, Special Publication 840,
Survey of Persons Aged 60+ in Households,1985, Part B, p. 18.
10 Statistical Abstract, Table 2.19.11 There are no precise data on
grandchildren and great-grandchildren. A studybased on the 1966 population showed that 13percent of Jewish elderly had either no childrenor children who had died (Weihl et al., 1970,Table I-2, p. 28). About 90 percent hadgrandchildren and more than 10 percent hadgreat-grandchildren. A survey of the Muslimrural elderly (Weihl et al., 1986, p. 37) showedthat 3 percent had no children, 94 percent hadgrandchildren, 44 percent had great-grandchildren, and 9 percent had great-great-grandchildren.
12 CBS, 1989, Survey of Persons Aged60+ in Households, 1985, Special Publication840, Part B, Table 56.
13 CBS, Statistical Abstract of 1997,Table 2.8.
14 Weihl et al., 1986, p. 12. About 20percent of multigenerational households includechildren who are still minors.
15 National Insurance Institute, 1989,Income Patterns among the Elderly in Israel,Survey 63, p. 13. Because Mizrahi Jews haverelatively low income on the average, somecannot help adult children purchase a home.Thus, many young Mizrahi couples live withtheir parents.
16 Weihl et al., 1986, p. 9.17 The following should be included in
this category: elderly persons who have noliving children (even if they havegrandchildren); elderly who have no childrenliving in Israel and, therefore, cannot call onthem for services; and elderly whose childrencannot provide them with services because ofchronic illness (mental illness, physicaldisability, mental retardation).
18 With the exception of:
1) Provisions of the Long-Term CareBenefit Insurance Law that give childlesseligibles a few extra eligibility points.
2) Health Ministry provisions that movechildless patients to the head of the queue foradmission to long-term inpatient facilities.
19 These groups are also quiteheterogeneous: Christian and Muslim Arabs;Jews of western European and eastern Europeanorigin; and Jews of Yemenite and Moroccanorigin.
20 For the most part, there is a highcorrespondence between level of schooling andlevel of income.
21 CBS, 1989, Survey of Persons Aged60+ in Households, 1985, B., Table 13.
22 CBS, Statistical Abstract of Israel1997, Table 12.3.
23 Ibid., Table 37b.24 CBS, Statistical Abstract of Israel
1994, Table 1.11.25 CBS, 1995, Survey of Households,
1993, 1992, Special Publication 993, pp. 18-19;and CBS, 1994, Survey of Family Expenditures,1992/93 p. 14.
26 National Insurance Institute, 1996/97.27 Zvi Zussman, Ha’aretz, February 3,
1997.28 National Insurance Institute, 1992,
Survey 91, p. 6.
29 National Insurance Institute, 1989,Survey 63, Table 15.
30 National Insurance Institute, 1992,Survey 91, p. 6.
31 National Insurance Institute, 1994,Insured Persons and Benefit Recipients byLocality, 1992-1993, Survey 120, Table 1.
32 CBS, Statistical Abstract 1994, Table11.3.
33 National Insurance Institute, 1989,Income Patterns among the Elderly in Israel,Survey 63, Table 3. This table also includeswomen aged 60-64.
34 The change in the law is not retroactiveand it applies only to those newly entering theage group.
35 Recipients of Income Maintenanceamong the Elderly in Israel, Survey 91, p. 6;and ibid., Table 4. This table includes womenaged 60-64.
36 National Insurance Institute, 1989,Table 5.
37 CBS, Household Income 1991, 1990,1989, Special Publication 933, Table 18. Seealso National Insurance Institute, 1992,Recipients of Income Maintenance among theElderly in Israel, Survey 91, p. 5.
38 National Insurance Institute, 1989,Income Patterns among the Elderly in Israel,Survey 63, Table 14. The table includes womenaged 60-64.
39 Weihl et al., 1986, p. 133; nearly 20percent of the male population in that studyretired before they reached age 65.
40 National Insurance Institute, StatisticalQuarterly, April-May 1995 (Tables A/2-B/16),pp. 16-56.
41 CBS, 1994, Survey of FamilyExpenditure, 1992/93, B, p. 23.
42 Young people in this context are thoseaged 20-30.
43 “Lacking housing,” as the Ministry ofHousing and Construction defines the term, arethose who neither own nor have ever owned adwelling in Israel.
44 Ministry of Construction and Housing,Tenanting Division, procedures.
45 CBS, 1991, Survey of Housing
18 The Israel Equality Monitor November 1998
Conditions, Special Publication 956, Table 6.46 CBS, 1989, Survey of Persons Aged
60+ in Households, 1985, A. Conditions ofHousing and Household Management, Table 1.
47 CBS, 1994, Survey of HousingConditions, 1991, Special Publication 956,Table 19.
48 CBS, 1987, Survey of Persons Aged60+ in Households, 1985, Special Publication814, Table 3.
49 CBS, 1994, Survey of HousingConditions, 1991, Special Publication 956,Table 27. The rate of those changing dwellingsis greater in younger age brackets: 15 percent inthe 55-64 cohort and 25 percent in the 45-54cohort.
50 Ibid., Table 20.51 Ibid.52 CBS, 1988, Survey of Persons Aged 60+
in Households, 1985, Special Publication 840,Table 54.
53 CBS, 1983, Publications of thePopulation and Housing Census, 11, Table 33.
54 Weihl, Azaizah, King, and Goldscher,1986, Tables 17 and 18.
55 CBS, 1989, Survey of Persons Aged60+ in Households, 1985, Special Publication840, Table 50. The proportion of those lacking atelephone rises with age to 31 percent in the 80+cohort.
56 CBS, 1994, Housing ConditionsSurvey, 1991, Special Publication 956, Table 48.
57 Electrical water heaters are also used.In 1948, such heaters were installed in 33.4percent of dwellings of the elderly, meaning that10 percent of dwellings inhabited by personsaged 65+ had no water heating fixture. Theextent of this phenomenon in 1991 is notknown.
58 The phrasing is cautious because thequestions in the two surveys were not identical.
59 Noam, G., and Sicron, M., 1990, Socio-Demographic Changes among the Elderly inIsrael, 1961-1983, Analysis of Data from thePopulation and Housing Census, JDC Israel-Brookdale Institute of Gerontology and HumanDevelopment in Israel, p. 66.
60 Weihl 1995, Table 1, p. 10.
61 Source: Naon, D., and Straussberg, N.Needs of Elderly Immigrants in Housing andProtracted Care, Eshel, Five-Year Plan, 1996-2000, 1996, pp. 145-148.
62 Source of statistical data, Be’er, S.,Estimates of Needs for Services for the Elderlyin Israel, by Geographic Region, 1994-2005,Eshel, Five-Year Plan, 1996-2000, pp. 64-65.
63 The population of tenants grew morerapidly. A survey of tenants in 1990 showed thatabout one-fourth of the dwellings were tenantedwith married couples (Be’er, S., op. cit., p. 64).
The number of units under publicownership increased significantly in 1995.
64 Starkschall, M., 1996, Guide toSheltered Housing, Eshel.
65 Habib, J., p. 1. In 1987, 29 percent ofhealth-service expenditures were for the elderly.
66 CBS, Health Survey 1996/97.67 CBS, 1993, Diagnostic Statistics on
Inpatient Admissions, Special Publication 941,p. 16.
68 CBS, Statistical Abstract 1996, Table24.6.
69 CBS, 1989, Survey of Persons Aged60+ in Households, 1985, B., SpecialPublication 940, Table 2.
70 Ibid., Table 4. The share of people whosay they do not use buses climbed from 17percent in the 65-74 cohort to 40 percent in the80+. They did not explain whether their notriding buses was due to the inability to use busesor the use of taxis or private cars.
71 Health funds provide home-careservices comprised essentially of medical,paramedical, and social supervision but do notprovide personal assistance services.
72 For a discussion of services providedunder this law: see the chapter on welfareservices.
73 CBS, 1997, Health Survey 1996/97.Advance Data for the Period April-September1996.
74 In 1992, this age group accounted for45 percent of inpatient days in general hospitalsof the General Health Fund. Shmueli, E., andLevy, Y., “Distribution of Consumption ofServices in Israel by Age,” Social Security,
December 1996, p. 146-153.75 All geriatric inpatient institutions
(including nursing departments in homes forindependent elderly) are defined as hospitals.
76 Long-term illnesses includerehabilitational and nursing geriatrics, mentalfrailty, nursing oncology, and tuberculosis.Almost all beds are taken up by elderly persons.Statistical Abstract 1997, Table 24.6.
77 CBS, Statistical Abstract, 1985 and1996, Table 24.8 and 24.6.
78 CBS, Statistical Abstract 1997, Table24.7.
79 CBS, Statistical Abstract, 1994,Table 2.22.
80 CBS, Statistical Abstract 1997, Table24.8. The rate of nursing inpatient admissions isrising commensurate with the aging of thepopulation. The Eshel five-year plan (Eshel,1990) speaks of a shortage of 3,700 beds in theyear 2000
81 Ministry of Health, 1994, Proceduresof the Long-Term Illness and Old-Age Division.Geriatric rehabilitation beds are not included inthe category of “Long Term Illness Beds.”
82 JDC-Brookdale Institute, 1996. Bentur,N., Brodsky, J., and Habot, B., Nursing Patientswith Multiple Problems in the GeriatricInpatient System, p. 4.
83 Be’er, S., and Factor, H., 1993,“National Census of Residents of Long-TermCare Institutions and Sheltered-HousingPrograms,” Gerontology 62, pp. 16-36.
84 Ibid., Table 12.85 Weihl, 1970, Table 1/2. Seven percent
of elderly persons of European origin and 16percent of those of Asian-African origin do nothave living children.
86 Source: Eshel, verbal communication.87 This association provides services
within local government jurisdictions on thecondition that the local governments incorporatethe service into their budgets after three to fiveyears.
88 Current average cost per inpatient day= the total expenditure in each type of hospitaldivided by the number of inpatient days.Statistical Abstract 1994, p. 730.
19Senior Citizens in Israel
89 A family, for this purpose, includesspouse and children.
90 Ministry of Health, Long-TermIllnesses and Old Age Division, January 11,1995, update of provisions in funding procedurefor nursing inpatient admission, “EntranceCharge.”
91 Source: Information Center, JDC-Brookdale Institute.
92 CBS, 1989, Special Publication 840,Survey of Persons Aged 60+ in Households,1985, B, Special Publication 840.
93 Ibid., Table 12.94 Ibid., Table 21.95 Ibid., Table 22.96 Ibid., Table 30.97 Except for services provided through
the National Insurance Institute.98 Shnit, D., 1988, p. 22.99 Every applicant, however low his/her
income, must share the expense of the service.The level of participation depends on income.
100 Our request for information on thenumber of elderly applicants to the welfarebureaus was not answered.
101 Data from the Planning Department ofthe Jerusalem Municipal Welfare Bureau.
102 Municipality of Tel Aviv-Yafo, WelfareService Division, 1995, Analysis of Data onClients and Service Recipients at the WelfareService Division for 1994.
103 This rate was computed according todata on the population of urban localities asshown in Statistical Abstract 1994, whichpresents data from 1993.
104 CBS, 1997, Local Authorities in Israel,1995, Physical Data, Special Publication 1046,Table 55.
105 Municipality of Tel Aviv-Yafo, 1995, p.2.
106 In the material gathered for this andother studies (Weihl, 1990), differences werefound among bureaus in the ratios of clients tolocal population and of the elderly to all clientsof the department.
107 This conjecture is based on partial dataobtained from the bureaus of Tel Aviv andJerusalem and on information obtained verbally
from the Ministry of Labor and Social Affairs.108 National Insurance Institute, 1991,
Table 1.109 Swirski, Barbara, 1997, Looking at the
Israel State Budget: Issues in Care for theElderly, Adva Center: 16.
110 See Note 12.111 This association, founded by JDC-
Israel, operates in administrative and financialcoordination with the Government of Israel.
112 Eshel, 1996, Five-Year Plan, 1996-2000, p. 18.
113 Verbal communication.114 Eshel 1996, Table 22, pp. 89.115 Ibid., p. 65.116 Ibid., p. 65.117 Ibid.118 Ibid., p. 26.119 Source: Information Center, JDC-
Brookdale Institute.120 We did not obtain statistical data on the
extent of activity.121 Source: Service for the Elderly,
Ministry of Labor and Social Affairs.122 Source: Information Center, JDC-
Brookdale Institute.123 Independent elderly are those capable
of carrying out activities of daily life withoutassistance. A frail senior is one whose level offunctioning necessitates partial assistance in theactivities of daily life. Regulations forInspection of Homes for the IndependentElderly, 1986, Chapter 1.
124 Be’er, S., and Factor, H., 1993, Table 5,p. 20.
125 Be;er, S., and Factor, H., 1993.126 Weihl, H., 1974.127 In the early 1970s, they accounted for
more than one-third of the population (Weihl,1973). More recent data are not available.
128 See chapter on Health.129 The contraction occurred because of
redesignation of beds, sometimes after thedepartments underwent physical changes.
130 Some nonprofit organizations chargehigh prices for institutionalization, sometimes
higher than those in the private sector.131 End of 1994. Source: Information
Center, JDC-Brookdale Institute.132 CBS, Statistical Abstract 1997, Table
3.20.133 Some coordination is achieved by
means of Eshel.134 Admissions of nursing inpatients with
multiple problems are included in this “basket,”but only partially: patients and/or their familiesare charged a high fee for each inpatient day.
135 Most geriatric inpatients alreadyreceive partial funding from the Ministry ofHealth.
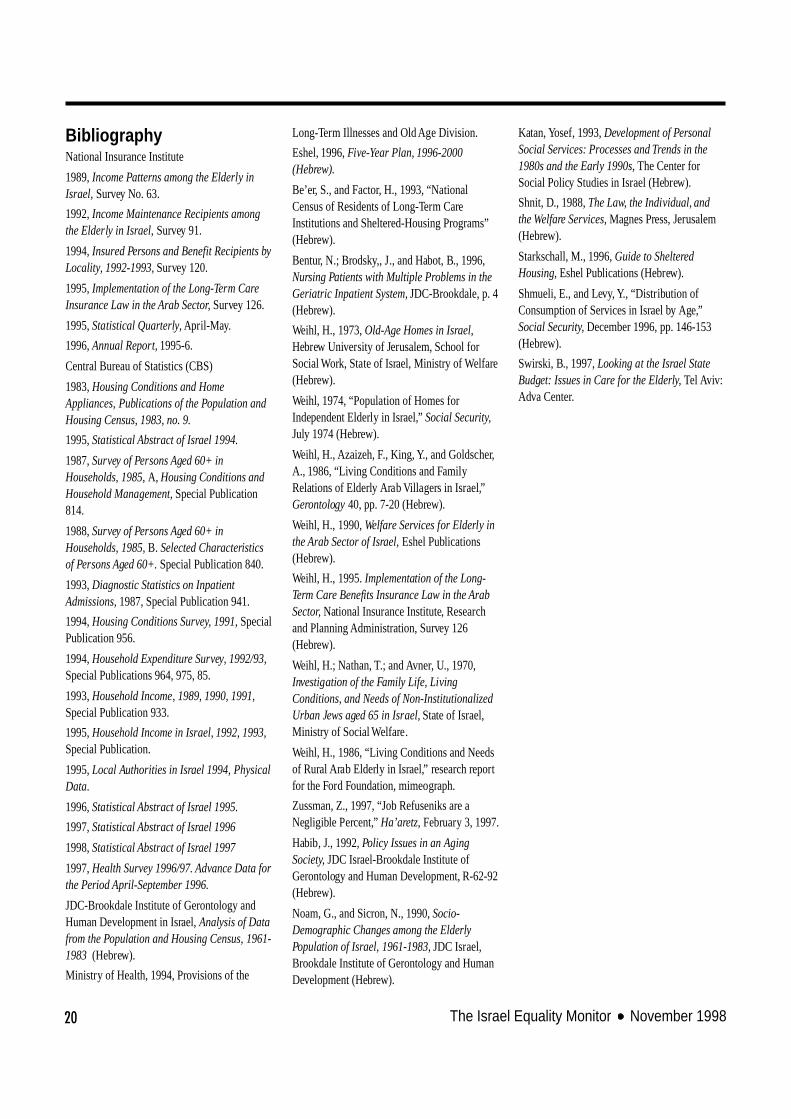
20 The Israel Equality Monitor November 1998
BibliographyNational Insurance Institute
1989, Income Patterns among the Elderly inIsrael, Survey No. 63.
1992, Income Maintenance Recipients amongthe Elderly in Israel, Survey 91.
1994, Insured Persons and Benefit Recipients byLocality, 1992-1993, Survey 120.
1995, Implementation of the Long-Term CareInsurance Law in the Arab Sector, Survey 126.
1995, Statistical Quarterly, April-May.
1996, Annual Report, 1995-6.
Central Bureau of Statistics (CBS)
1983, Housing Conditions and HomeAppliances, Publications of the Population andHousing Census, 1983, no. 9.
1995, Statistical Abstract of Israel 1994.
1987, Survey of Persons Aged 60+ inHouseholds, 1985, A, Housing Conditions andHousehold Management, Special Publication814.
1988, Survey of Persons Aged 60+ inHouseholds, 1985, B. Selected Characteristicsof Persons Aged 60+. Special Publication 840.
1993, Diagnostic Statistics on InpatientAdmissions, 1987, Special Publication 941.
1994, Housing Conditions Survey, 1991, SpecialPublication 956.
1994, Household Expenditure Survey, 1992/93,Special Publications 964, 975, 85.
1993, Household Income, 1989, 1990, 1991,Special Publication 933.
1995, Household Income in Israel, 1992, 1993,Special Publication.
1995, Local Authorities in Israel 1994, PhysicalData.
1996, Statistical Abstract of Israel 1995.
1997, Statistical Abstract of Israel 1996
1998, Statistical Abstract of Israel 1997
1997, Health Survey 1996/97. Advance Data forthe Period April-September 1996.
JDC-Brookdale Institute of Gerontology andHuman Development in Israel, Analysis of Datafrom the Population and Housing Census, 1961-1983 (Hebrew).
Ministry of Health, 1994, Provisions of the
Long-Term Illnesses and Old Age Division.
Eshel, 1996, Five-Year Plan, 1996-2000(Hebrew).
Be’er, S., and Factor, H., 1993, “NationalCensus of Residents of Long-Term CareInstitutions and Sheltered-Housing Programs”(Hebrew).
Bentur, N.; Brodsky,, J., and Habot, B., 1996,Nursing Patients with Multiple Problems in theGeriatric Inpatient System, JDC-Brookdale, p. 4(Hebrew).
Weihl, H., 1973, Old-Age Homes in Israel,Hebrew University of Jerusalem, School forSocial Work, State of Israel, Ministry of Welfare(Hebrew).
Weihl, 1974, “Population of Homes forIndependent Elderly in Israel,” Social Security,July 1974 (Hebrew).
Weihl, H., Azaizeh, F., King, Y., and Goldscher,A., 1986, “Living Conditions and FamilyRelations of Elderly Arab Villagers in Israel,”Gerontology 40, pp. 7-20 (Hebrew).
Weihl, H., 1990, Welfare Services for Elderly inthe Arab Sector of Israel, Eshel Publications(Hebrew).
Weihl, H., 1995. Implementation of the Long-Term Care Benefits Insurance Law in the ArabSector, National Insurance Institute, Researchand Planning Administration, Survey 126(Hebrew).
Weihl, H.; Nathan, T.; and Avner, U., 1970,Investigation of the Family Life, LivingConditions, and Needs of Non-InstitutionalizedUrban Jews aged 65 in Israel, State of Israel,Ministry of Social Welfare.
Weihl, H., 1986, “Living Conditions and Needsof Rural Arab Elderly in Israel,” research reportfor the Ford Foundation, mimeograph.
Zussman, Z., 1997, “Job Refuseniks are aNegligible Percent,” Ha’aretz, February 3, 1997.
Habib, J., 1992, Policy Issues in an AgingSociety, JDC Israel-Brookdale Institute ofGerontology and Human Development, R-62-92(Hebrew).
Noam, G., and Sicron, N., 1990, Socio-Demographic Changes among the ElderlyPopulation of Israel, 1961-1983, JDC Israel,Brookdale Institute of Gerontology and HumanDevelopment (Hebrew).
Katan, Yosef, 1993, Development of PersonalSocial Services: Processes and Trends in the1980s and the Early 1990s, The Center forSocial Policy Studies in Israel (Hebrew).
Shnit, D., 1988, The Law, the Individual, andthe Welfare Services, Magnes Press, Jerusalem(Hebrew).
Starkschall, M., 1996, Guide to ShelteredHousing, Eshel Publications (Hebrew).
Shmueli, E., and Levy, Y., “Distribution ofConsumption of Services in Israel by Age,”Social Security, December 1996, pp. 146-153(Hebrew).
Swirski, B., 1997, Looking at the Israel StateBudget: Issues in Care for the Elderly, Tel Aviv:Adva Center.

21Senior Citizens in Israel
The contents of this publication may be used, but please cite the source: The Israel Equality Monitor.
Adva Center Board of Directors
Dr. Yossi Dahan, chairMs. Gilberte Finkel, treasurerDr. Ismail Abu-SaadDr. Dani FilcDr. Halla HazzanDr. Rachel KalushMs. Fatina KhazanProfessor Hubert Law-YoneDr. Uri RamProfessor Marilyn SafirDr. Rifka SavaiyaDr. Oren Yiftach-elDr. Yossi Yona
About the authors:
Hannah Weihl is a gerontology researcher whohas taught at the School of Social Work at theHebrew University in Jerusalem.
Adva Center receives general support from
NOVIBThe New Israel FundThe Jacob and Hilda Blaustein Foundation
This report and otherreports published by
Adva Center areavailable on internet:
www.adva.org