Embed Size (px)
Citation preview

Missouri University of Science & Technology
Scale Growth Model for Hot-Rolled Steel
Rough Draft Report
By
Daniel Anderson
Joshua Huighe
Sonya Snyder
Advisor: Dr. O'Malley
Industrial Sponsor: Nucor Steel - Indiana
Date: May 13, 2015
Scale Growth Model for Hot Rolled Steels - 1

Table of Contents:
1. Executive Summary 3
2. Problem Definition 4
2.1 Introduction 4
2.2 Goals and Objectives 5
3. Background Information 7
3.1 Scale Morphologies 7
3.2 Scale Formation 9
3.3 Measuring Scale 11
3.4 Environmental, Societal, and Economic Impact 12
3.5 Approach 12
4. Experimental Procedure 13
4.1 Sample Preparation 13
4.2 Nucor Steel - Arkansas (NSAR) Testing 13
4.3 Imaging 14
5. Results and Discussion 15
5.1 Kinetics Analysis 15
5.2 Imaging Analysis 16
5.3 Major Challenges 22
6. Summary 23
6.1 Future Work 23
7. References 24
Scale Growth Model for Hot Rolled Steels - 2

1. Executive Summary
In the continuous casting process where the Hot Mill and Casters are connected by a
tunnel furnace, the steel surface interacts with the oxidizing atmosphere and furnace temperature
to form iron oxide, or scale. Scale can be unfavorable because surface defects in the final
product, paint or coating non-adherence, and increased wear on machinery can occur.
The purpose of this project was to determine what oxygen contents and tunnel furnace
temperatures increase or decrease scale growth at Nucor Steel – Indiana (NSIN). This study
characterized what scale oxides formed by measuring the change in mass of steel samples that
were subjected to conditions similar to those used at NSIN. The data obtained from these
samples was used to measure how much scale grew and the kinetics of the scale growth.
Two tests were completed at Nucor Steel – Arkansas (NSAR) to recreate the conditions
at NSIN. Samples were placed in a pipe and placed into the tunnel furnace to induce scale
growth with respect to time. In addition, the SEM was used to gather micrographs of the samples
in their as-received state and after testing. EDS analysis was used to supplement micrographs of
the layered scale. Samples were weighed before and after testing to determine the amount of
scale that formed. Using the change in mass as a function of time, the kinetics of scale growth
were determined.
Next year’s group will create an ideal model of scale growth by testing more of NSIN’s
steel at varying oxidizing conditions and temperatures. An activation energy constant can be
determined with multiple tests and can more accurately provide the rate at which scale forms on
the steel.
Scale Growth Model for Hot Rolled Steels - 3

2. Problem Definition
2.1 Introduction
In a mini-mill steel operation, such as at NSIN, a ladle of steel continuously feeds the
Casters, which forms the molten steel into a specific shape through an open-bottom mold. The
steel slab solidifies and gets cut to length prior to entering a tunnel furnace. The tunnel furnace
homogenizes the steel slab temperature, with an approximate 15 minute transit time, so that
rolling occurs evenly in the Hot Mill. The slab begins to oxidize in the excess oxygen
atmosphere of the tunnel furnace as it reaches a uniform temperature of about 1200ºC. Figure 1
illustrates the steel slab forming process detailed above.
Figure 1. Schematic representation of continuous casting where the slab is formed at the
Casters, gets cut, or cropped, to a specified length, homogenizes in the tunnel furnace, and gets
formed in the Hot Mill. Image from: http://ispatguru.com/wp-content/uploads/2013/04/CSP.jpg
The slab oxide, known as scale, creates problems though. Scale rolled into the steel slab
causes surface defects, effecting the quality of paint and coating adherence in the final product,
and increases the work roll wear in the Hot Mill. Therefore, a descaling unit, which uses high-
pressure water jets, removes the built up scale. As the slab exits the descaling unit, the surface of
Scale Growth Model for Hot Rolled Steels - 4

the steel is once again exposed to the atmosphere, allowing scale to form again. If further
processing is conducted at the steel mill, the slab goes through a pickling line. A hydrochloric
acid solution is used to pickle the slab, which removes the scale that formed in the Hot Mill.
2.1 Goals and Objectives
With scale that remains adherent to two grades of steel, a high silicon bearing and a
chromium bearing grade, after descaling and pickling, NSIN would like to characterize the scale
phases present to minimize scale growth and in turn minimize surface and quality defects. The
main goal of this project is to determine what conditions (oxygen content and tunnel furnace
temperature) increase and decrease scale formation. NSIN knows that longer residence times and
higher oxygen contents increase the amount of scale present on the steel; therefore, the senior
design group will characterize and determine the amounts of each scale morphology in the steel
in a 2-4% excess oxygen content atmosphere at temperatures between 1121-1176ºC, modeling
NSIN’s tunnel furnace conditions.
The aforementioned goals and objectives were modified since the fall semester. The
original purpose of this project was to create a model of the ideal temperatures and atmospheric
conditions which minimize scale growth. The objectives associated with the original purpose
were to measure the change in mass, thickness, and adherence of the scale on steel samples from
NSIN. Originally, this year’s senior design team was to conduct experiments and create the ideal
model, but with various setbacks and the desire for a two-year project, this goal was no longer
considered for the year. This year’s senior design team instead focused on experimentation to
determine what kinetic model was present in NSIN’s tunnel furnace. Next year’s senior design
Scale Growth Model for Hot Rolled Steels - 5

team will finish experimentation and create an ideal model of oxygen contents and tunnel
furnace temperatures that minimize scale formation.
A summary of the milestones and deliverables, along with changes, can be seen in Figure
2. Figure 2 is divided into first and second semester milestones and deliverables for simplicity.
Semester 1
8/25
/201
4
9/1/
2014
9/8/
2014
9/15
/201
4
9/22
/201
4
9/29
/201
4
10/6
/201
4
10/1
3/20
14
10/2
0/20
14
10/2
7/20
14
11/3
/201
4
11/1
0/20
14
11/1
7/20
14
11/2
4/20
14
12/1
/201
4
12/8
/201
4
Project DefinitionTeammate EvaluationBackground ReportDraft ReportFinal ReportPosterTeammate Evaluation
Class Tasks
Week8/
25/2
014
9/1/
2014
9/8/
2014
9/15
/201
4
9/22
/201
4
9/29
/201
4
10/6
/201
4
10/1
3/20
14
10/2
0/20
14
10/2
7/20
14
11/3
/201
4
11/1
0/20
14
11/1
7/20
14
11/2
4/20
14
12/1
/201
4
12/8
/201
4
Team OrganizationSet Meeting TimesContact Industry PersonnelMeet with AdvisorTour NSINPrepare Lab Set-upOrder Necessary Supplies
Project Tasks
Week
Scale Growth Model for Hot Rolled Steels - 6

Semester 2
1/19
/201
5
1/26
/201
5
2/2/
2015
2/9/
2015
2/16
/201
5
2/23
/201
5
3/2/
2015
3/9/
2015
3/16
/201
5
3/23
/201
5
3/30
/201
5
4/6/
2015
4/13
/201
5
4/20
/201
5
4/27
/201
5
5/4/
2015
5/11
/201
5
26-Jan Semester Plan Presentation23-Feb Progress Report Presentation9-Mar Mid-Semester Progress Report Paper11-Mar Teammate Evaluation13-Apr Progress Report Presentation24-Apr Draft Final Report7-May Oral Presentation8-May Final Teammate Evaluation13-May Final Report
Due Date Class Tasks
Week
1/19
/201
5
1/26
/201
5
2/2/
2015
2/9/
2015
2/16
/201
5
2/23
/201
5
3/2/
2015
3/9/
2015
3/16
/201
5
3/23
/201
5
3/30
/201
5
4/6/
2015
4/13
/201
5
4/20
/201
5
4/27
/201
5
5/4/
2015
5/11
/201
5
2-Feb Order Parts, Gas, Etc.23-Feb Test Furnace16-Mar Sample Preparation9-Mar Optical Microscopy6-Apr SEM Time 6-Apr Induce Scale Growth20-Apr Analyze Data20-Apr Optimize Parameters4-May Additional Testing (if necessary)
Due Date Project Tasks
Week
Overlap of Original and Modified Dates
Completed Due DateOriginal DatesModified Dates
Figure 2. Gantt chart for fall and spring semester with originally planned project tasks dates.
3. Literature Review
3.1 Scale Morphologies
Three oxides form as scale on steel: wüstite, magnetite, and hematite. Wüstite, FeO, is
the inner-most scale layer, forming next to the steel, and is not stable below 570ºC. Magnetite,
Scale Growth Model for Hot Rolled Steels - 7

Fe3O4, is the center-most scale layer and is stable below 500ºC. Hematite, Fe2O3, is the outermost
scale layer and has the highest oxygen content, forming at temperatures above 800ºC. Figure 3
shows layered scale growth as well as typical volume fractions for each layer at temperatures
greater than 600ºC [1].
Figure 3. Typical volume fractions of the layered scale components in steel.
Scale removal is a difficult process because each oxide has different properties and
grows at different rates. Table 1 summarizes properties associated with wüstite, magnetite, and
hematite. As can be seen in Table 1, for instance, the difference in hardness values varies
drastically amongst the three oxides. Therefore, higher pressures from the descaling unit are
needed to remove hematite, whereas less pressure is needed to remove wüstite.
Table 1. Thermophysical Properties of Oxide Phases, at high temperatures[2].
Property Wüstite Magnetite Hematite UnitDensity 5670 5180 5240 kg m-3
Tensile strength 0.4 4 10 MPaHardness 270-350 420-500 1000 HVThermal conductivity 2.7-3.2 0.5-3.5 0.5-3.5 W m-1 K-1
Thermal diffusivity 0.7 10-6 0.2-3 10-6 0.2-3 10-6 m2 s-1
Specific heat capacity 58 200 150 J mol-1 K-1
Dilatation coefficient 10-15 10-6 K-1
Scale Growth Model for Hot Rolled Steels - 8

3.2 Scale Formation
Scale can follow three oxidation rates: linear, parabolic, or logarithmic. For temperatures
above 600oC, oxide growth appears to follow a parabolic trend [4], [5]. However it is noted that at
temperatures below 600oC, the formation of scale may follow a logarithmic or linear trend
instead of a parabolic one [5]. At NSIN, temperatures in the tunnel furnace are approximately
1200oC, which should be indicative of parabolic scale growth. Figure 4 shows a plot for
parabolic scale growth.
Figure 4. Parabolic plot of oxide thickness over time[4].
When the steel is first exposed to air, the surface begins to oxidize quickly because the
steel is directly in contact with the atmosphere, yielding parabolic growth. After 15-20 seconds,
the growth rate will decrease as the exposed layer of steel becomes covered in scale, and linear
growth begins.
Scale Growth Model for Hot Rolled Steels - 9

Birosca used parabolic methods to form an Arrhenius plot and equation shown in Figure
5 [4]. While the constant found by this plot may not be used for the current research, the
modeling approach may be applicable to evaluate measurements taken during the experiments.
Figure 5. Plot of the Arrhenius constant vs. the temperature [4].
Figure 6 shows an iron and oxygen phase diagram. Partial pressures of oxygen are given
as dashed lines. In the diagram, I refers to FeO (wüstite), II is Fe3O4 (magnetite), and III is Fe2O3
(hematite). According to the phase diagram, above 700oC, hematite is the most stable iron oxide
phase in air. The phase diagram also shows that upon cooling, wüstite transforms to magnetite
plus iron via nucleation on the grain boundaries and surface [6]. Since NSIN’s tunnel furnace
operates with excess oxygen above 700oC, hematite and magnetite should be present at
equilibrium.
Scale Growth Model for Hot Rolled Steels - 10

Figure 6. Iron and oxygen phase diagram [6].
3.3 Measuring Scale
Various experiments have been conducted to determine the types and amounts of scale
that form. One experiment from Basabe and Spzunar et. al oxidized ground samples in air with
varying mixtures of oxygen, nitrogen, carbon dioxide, hydrogen and argon amounts for 40, 80,
and 120 seconds over the temperature range 600-1200ºC [7]. Once the samples were brought to
temperature, they were quenched in water to preserve the initial wüstite that formed. The scale
was ground into a fine powder and analyzed with x-ray diffraction (XRD). The samples' mass
Scale Growth Model for Hot Rolled Steels - 11

were measured before and after the oxidation test using an analytical balance to track mass
changes. The study showed that parabolic growth kinetics were followed, which is what the
senior design team hopes to find with this study. In addition, high temperatures were found to
avoid the decomposition of wüstite, which is the easiest oxide to remove, and would be the most
beneficial for NSIN.
3.4 Environmental, Societal, and Economical Impacts
An environmental impact associated with this study lies in water treatment at NSIN.
Scale contains iron, which, in large amounts, can damage ecosystems around the plant if water
treatment is not adequate. This environmental impact is addressed by all steel making facilities
as the EPA regulates the impact that these process have on the environment.
An economic impact of this senior design project is tied to increased yield for NSIN and
their customers. If less scale forms, more yield occurs for NSIN because less iron will be
converted into the oxide layer. In addition, customers who require surface quality stringent
material will return product if scale is present. When scale growth is limited or fully removed,
more profit is made by NSIN and their customers because reorders are not required and quality
steel is received.
3.5 Approach
From the studies researched by the group, inducing scale growth by subjecting samples to
varying oxygen contents and temperatures that are compatible with NSIN’s tunnel furnace will
provide parabolic growth. The steel samples will be measured before and after testing to
determine weight gain, which will be compared to microscopy analysis to characterize the scale
morphologies present in the samples.
Scale Growth Model for Hot Rolled Steels - 12

4. Experimental Procedure
4.1 Sample Preparation
NSIN provides steel for testing. The steel samples were first cut into thin strips
approximately 1" wide with the abrasive saw in McNutt B9. They were then cut to their final
dimensions of 1" X 1" coupons with the slow speed saw in McNutt 267. The samples were then
pickled in a 10% HCl solution for 2 hours, with the samples being turned over after 1 hour to
ensure scale on both sides of the coupons were removed. This provided a clean surface for
testing. The samples where then weighed so the change in mass after scale growth could be
analyzed. It was expected that the steel samples would gain 1-3 grams depending on testing time.
4.2 Nucor Steel – Arkansas (NSAR) Testing
Tests were run in NSAR's tunnel furnace due to failures of the thermogravimetric furnace
in the Materials Research Center and the mill’s proximity to campus. A location in the tunnel
furnace where oxygen content and temperature measurements were taken was chosen to mimic
the temperature and atmospheric control conditions of the thermogravimetric furnace. A
thermocouple in the tunnel furnace was removed and a steel pipe was inserted in its place. The
pipe was cut so a lip where samples could sit was created. The pipe and thermocouple can be
seen in Figure 7. As can be seen in the figure, the pipe was inserted the same distance into the
tunnel furnace as the thermocouple.
Scale Growth Model for Hot Rolled Steels - 13

Figure 7. The sample holder (top) compared to the thermocouple (bottom).
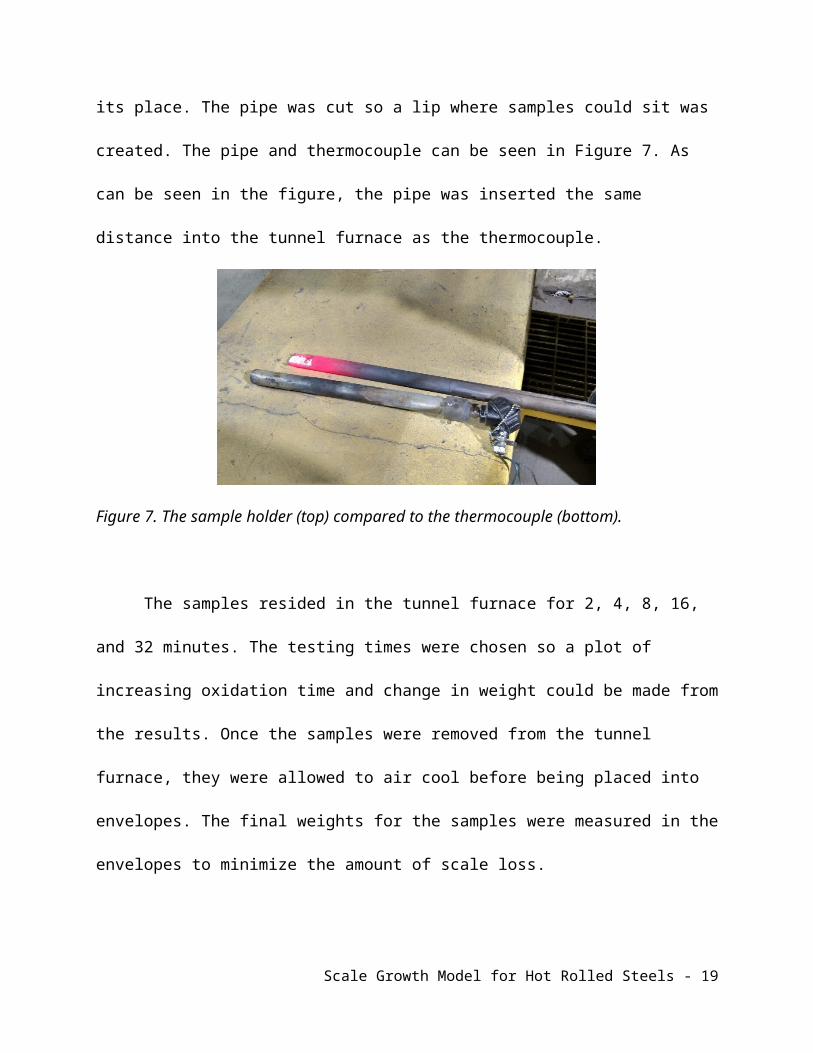
The samples resided in the tunnel furnace for 2, 4, 8, 16, and 32 minutes. The testing
times were chosen so a plot of increasing oxidation time and change in weight could be made
from the results. Once the samples were removed from the tunnel furnace, they were allowed to
air cool before being placed into envelopes. The final weights for the samples were measured in
the envelopes to minimize the amount of scale loss.
4.2 Imaging
To analyze the samples in the SEM, samples were mounted in epoxy to preserve the
scale. A two-part epoxy resin was used because of its quick-setting capabilities. Once solidified,
the mounted samples were polished. Polishing was conducted with four grinding stages (220,
320, 800, and 1200) and three polishing stages (9um, 3um, and 0.1um). Grinding was conducted
a minimum of three times on each stage to get through the scale layer and allow for a clear image
to be taken of the scale thickness that grew against the steel.
In order to view the scale layers, SEM images were taken coupled with EDS analysis on
the Hitachi S-4700 in McNutt B18. A gold-palladium coating was applied to the mounted
Scale Growth Model for Hot Rolled Steels - 14

samples to minimize sample charging. Once a focused image of the scale surface was obtained,
EDS analysis was conducted to determine the scale morphology present. ImageJ was used to
determine the thickness of the wüstite, magnetite, and hematite layers present.
5. Results and Discussion
5.1 Kinetics Analysis
As seen in the literature review (Section 3), the expected results for the study indicate
parabolic growth. Since the samples were pickled prior to testing at NSAR, the clean surface is
expected to initially oxidize quickly. As the scale layer gets thicker the rate is expected to slow
because not as much of the steel surface is exposed to the atmosphere. The resulting trend should
be parabolic growth. The results for the tests run at NSAR can be seen in Figure 8.
Figure 8. Parabolic growth of scale from test conducted at NSAR.
Scale Growth Model for Hot Rolled Steels - 15
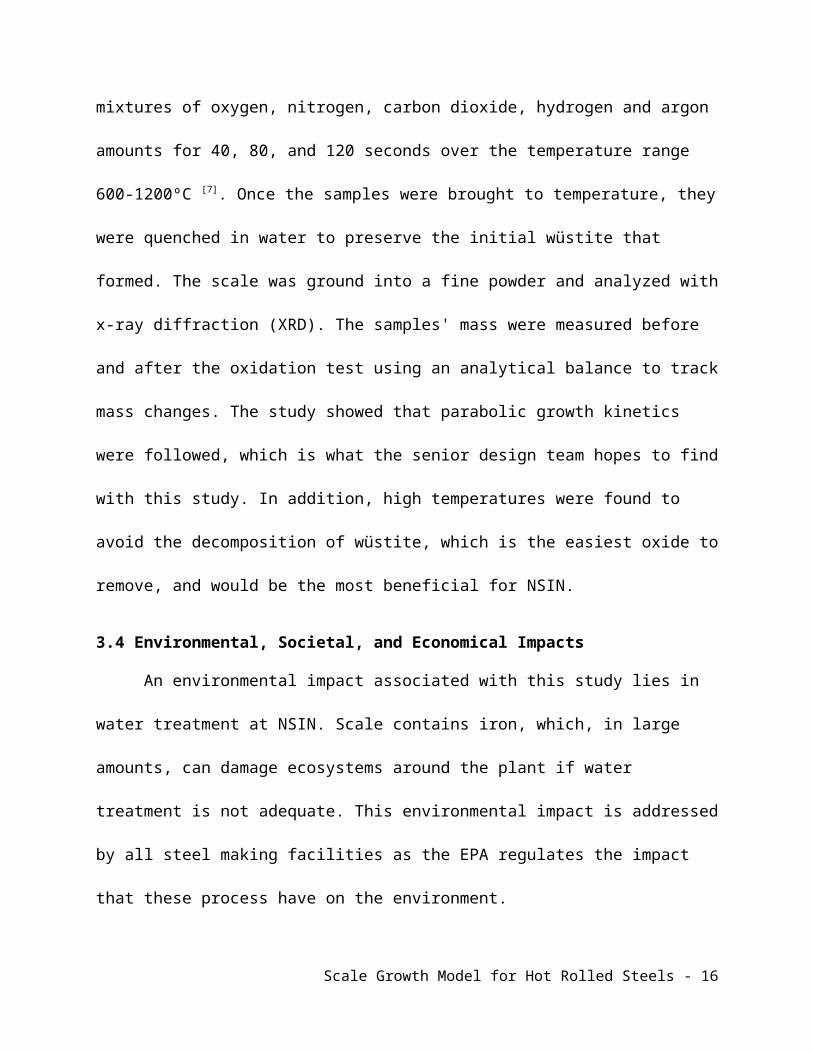
Figure 8 does show parabolic growth, as expected. Initial exposure of the steel allows
scale to grow rapidly, while scale growth slowed after 2 minutes in the tunnel furnace. The blue
curve, Y2, did contain some error. Less scale grew on the sample tested at 8 minutes, which may
be associated with scale spalling due to thermal shock.
5.2 Imaging Analysis
The as-received steel samples from NSIN were first analyzed in the SEM to determine if
three scale morphologies could be identified prior to experimentation. The initial SEM images
can be seen in Figures 9-10. Figure 9 was taken with the Hitachi S-4700 and represents sample
G. Multiple scale layers can be seen with the two images in Figure 9 along with porosity
generally associated with scale.
Figure 9. SEM images of as-received G sample taken with the Hitachi S-4700.
Figure 10 was taken with the Hitachi S-570. Charging of the specimen occurred, but
layers can still be seen. With the amount of charging that occurred during this analysis, further
samples were imaged in magnetic mode, coated in gold-palladium for 2 minutes, and further
grounded with copper tape to the sample holder.
Scale Growth Model for Hot Rolled Steels - 16

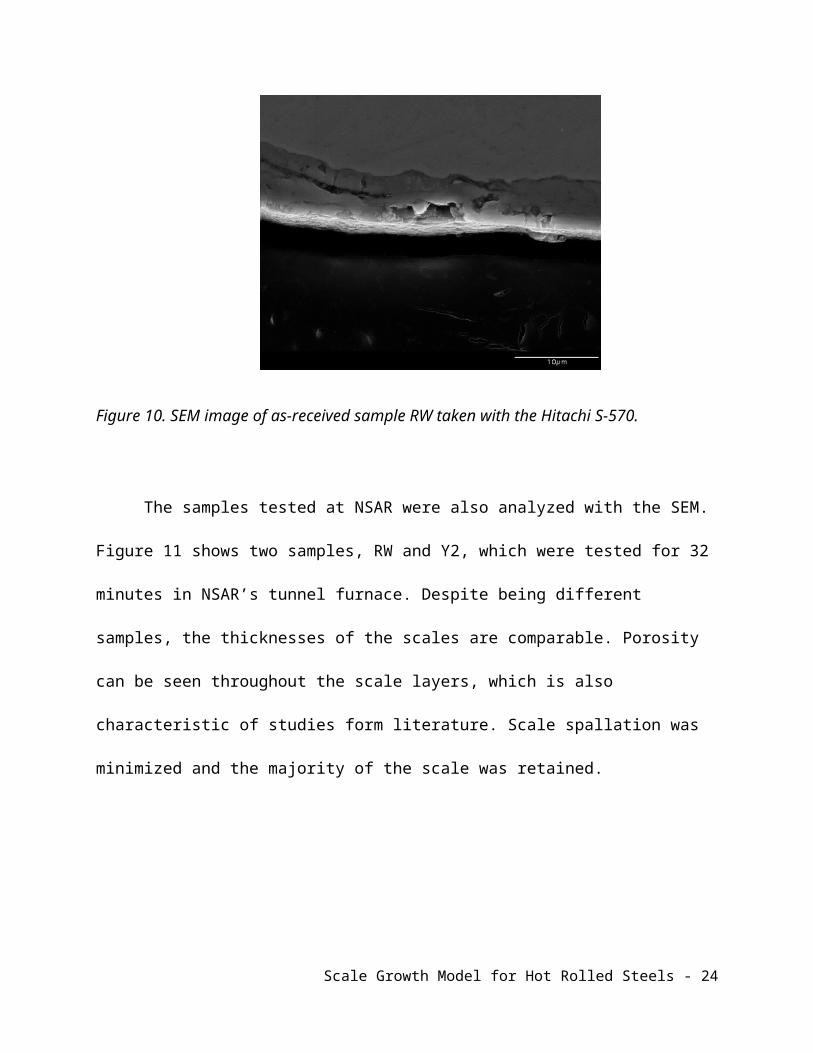
Figure 10. SEM image of as-received sample RW taken with the Hitachi S-570.
The samples tested at NSAR were also analyzed with the SEM. Figure 11 shows two
samples, RW and Y2, which were tested for 32 minutes in NSAR’s tunnel furnace. Despite being
different samples, the thicknesses of the scales are comparable. Porosity can be seen throughout
the scale layers, which is also characteristic of studies form literature. Scale spallation was
minimized and the majority of the scale was retained.
Scale Growth Model for Hot Rolled Steels - 17

Figure 11. Left: SEM image of RW tested for 32 minutes in the tunnel furnace. Right: SEM image of Y2 tested for 32 minutes in the tunnel furnace.
Figures 12 and 13 show further SEM results along with EDS analysis for the tests
conducted at NSAR. The scale layers that grew during these tests were much thicker than the
layers on the as-received samples. The as-received samples passed through the descaling unit,
which removes scale using high pressure water jets, which explains the thin scale layer present
on these samples. Yet, despite being descaled, it can be seen that scale was still present, showing
that the descaling unit is not removing all the scale present. Figure 12 shows the G sample after it
was tested at NSAR. When compared to Figure 9, which is the as-received state of the G sample,
Scale Growth Model for Hot Rolled Steels - 18
the scale layer is much larger. Figure 12 was not descaled and the scale was retained with
minimal spalling during transfer.
Figure 12. SEM image of sample G after 32 minutes of testing in NSAR’s tunnel furnace.
Figure 13 is a higher resolution SEM analysis of sample G (see Figures 9 and 12) along
with the associated EDS analysis for various layers in the sample. Wüstite was the predominant
layer present in the sample, followed by magnetite, and hematite. The EDS analysis shows the
varying sizes of iron and oxygen peaks, which relate to the different scale layers. In addition,
some silicon was present in this sample. Grade G was a high silicon bearing grade and the silicon
actually diffused into the scale. With silicon in the scale, scale removal may become more
difficult, which may be why scale was present in Figure 9.
Scale Growth Model for Hot Rolled Steels - 19
Figure 13. SEM image and EDS spectrum are provided to show the varying compositions of each layer for sample G.
ImageJ was also performed on the steel samples to determine the thickness of each of the
scale layers. The Hirox in the Materials Research Center was used. ImageJ analysis using the
Hirox images can be seen in Figure 14.
Scale Growth Model for Hot Rolled Steels - 20

Figure 14. Hirox images showing ImageJ analysis of each layer for sample G.
The results for the thicknesses of the scale layers for sample G are consistent with what is
expected based on the research that was performed on past experiments. Wüstite was the thickest
layer, followed by the magnetite, and lastly hematite was the smallest. Table 2 summarizes the
results of the ImageJ analysis.
Table 2. Average thickness of the three scale layers for sample G.
Layer Wüstite Magnetite Hematite
Average Thickness (µm) 582.9 331.6 43.7
% of Total 61 35 4
Scale Growth Model for Hot Rolled Steels - 21

5.3 Major Challenges
This project has been filled with lots of challenges. Upon return from NSIN with
samples, the first challenge faced was sample preparation in terms of cutting, scale removal, and
experimentation in a furnace. The first attempt to grow scale on the samples testing in a standard,
non-atmosphere inducing, furnace on campus. This resulted in lots of scale forming, but the
atmosphere was not controllable. The next attempt was to find a furnace with a controlled
atmosphere. A TGA was found in both the Materials Research Center (MRC) and in the
chemical engineering building. The chemical engineering TGA was quickly eliminated because
it could not reach high enough temperatures for the experiments. The MRC’s TGA was more
promising, but while heating samples under vacuum and in argon scale growth was still
occurring. After running several tests the TGA broke and the samples were instead run in the
tunnel furnace at Nucor Arkansas.
Samples were pickled in HCl on campus and then driven down to NSAR to oxidize them
in their tunnel furnace. The challenge with this was that it’s a four hour drive and the whole day
would be required to make the trip and run the tests. No days could be found that fit in
everyone’s schedules and two trips were eventually made. Once the tests were ran at NSAR,
more challenges arose, instead of having a computer measure the oxidation kinetics of the
experiment, as with a TGA, individual tests on many samples at different amounts of time were
required. Having to remove the samples from the furnace resulted in some of the scale being lost
before the mass could be measured. This increased the error in the results. While this challenge is
the first one that was not totally overcome, the results at least provided some indication of what
could be expected.
Scale Growth Model for Hot Rolled Steels - 22

The final challenge that occurred was obtaining SEM images of the samples. The samples
that were taken to NSAR were mounted in epoxy and required time to harden and be ready for
the SEM. Once they were ready for the SEM they then were very difficult to focus on because
they were magnetic. This made it very difficult to see the three oxide layers that were expected.
While this project was one challenge after another for the duration of it, the outcome was very
successful and a lot was learned in the process.
6. Summary
In conclusion, the initial work was completed for next year’s senior design team to
continue the project. Scale grew in a parabolic manner, as literature suggests. Silicon was found
in the scale for the high silicon bearing grade, which may indicate why the scale on these
samples is more difficult to remove.
6.1 Future Work
Future work for this project would involve testing in atmospheric conditions and
temperatures identical to those used at NSIN. This would involve modifying a furnace on
campus that reaches temperatures of 1200 C and is also able to control atmosphere. By testing ⁰
the same grade of steel in multiple conditions, an Arrhenius equation could be created. This
could then be used to find the optimal temperature and conditions in NSIN's range to limit the
growth of scale. The surface roughness of the steel is another factor to be tested. Literature states
that the rougher the steel the less scale forms. If steel roughness varies with grade, then scale
may be more prominent on particular grades.
Scale Growth Model for Hot Rolled Steels - 23
7. References
1. D.T. Blazevic. "Tertiary rolled-in scale: the hot strip mill problem of the 1990s." Proceedings of the 37th MWSP Conference, ISS-AIME. 33-38. (1996).
2. M.M. Wolf. "Scale Formation and Descaling in Continuous Casting and Hot Rolling." Iron and Steelmaker (I and SM) Volume 27. Issue 12. 65. (February 2000). Print.
3. IEI, International Enamellers Institute - Congress. IEI, International Enamellers Institute - Congress.
4. S. Birosca, G. D. West, and R. L. Higginson, "Microstructural Investigation of the Oxide Scale on Low Carbon Steel", IPTME Leicestershire, UK (2005).
5. W. Sun, A.K. Tieu, Z. Jiang, H. Zhu, and C. Lu, "Oxide Scales Growth of Low-Carbon Steel at High Temperatures," J. Mat. Process. Tech., 155-156 1300-1306 (2004).
6. F. Matsuno and Y. Ohmori, "Crystallography of Eutectoid Decomposition in the FeO Oxide Layer Formed on Steel Surface," Transactions of the Japan Institute of Metals, 29 [1] 8-16 (1988).
7. Valdimir V. Basabe and Jerzy A. Szpunar. "Growth Rate and Phase Composition of Oxide Scales during Hot Rolling of Low Carbon Steel." ISIJ International. Volume 44. Issue 9. (2004): 1554-1559.
8. J.S. Sheasby, W E. Boggs, and E T. Turkdogan. "Scale Growth on Steels at 1200ºC: Rationale of Rate and Morphology." Metals Science 18.3 (1984): 127-36. Print.
Scale Growth Model for Hot Rolled Steels - 24