Embed Size (px)
Citation preview
Senior Centers in New York State A Comprehensive Study by the New York State Office for the Aging
January 2014
2
Senior Centers in New York State A Comprehensive Study by the New York State Office for the Aging
TABLE OF CONTENTS I. Executive Summary II. Introduction III. Senior Center Initiative IV. History of Senior Centers in New York State V. Methodology and Data Collection Process VI. Key Findings: Survey Results VII. Key Findings: Regional Roundtable Discussions VIII. Senior Center Action Steps IX. Conclusion X. Appendices
a. Regional Roundtable Questions b. Senior Center Survey Instrument c. Regional Roundtable Power Point Presentation
3
I. Executive Summary Purpose and Scope – In the summer of 2013 NYSOFA conducted a study of senior centers across New York State. Senior centers are defined by the Older Americans Act (OAA) as a “community focal point” for comprehensive and coordinated services for older adults. The purpose of this study was to gain a better understanding of the current state of senior centers; specifically, the types of programs and services that are being offered, staffing patterns and sources of funding, the current and impending challenges that centers are facing and how they might impact the future of senior centers. The study was conducted by New York State Office for the Aging (NYSOFA) staff and consisted of an online survey that was distributed to the 600+ senior centers across the state, as well as regional follow-up roundtable/focus group discussions. The information gained from this study is intended to demonstrate more accurately what senior centers do in their communities. It is designed to provide program and policy recommendations that will position senior centers to play an expanded role in the community by diversifying and expanding their service offerings. NYSOFA will also use this data as a guide to ensure better statewide collaborations and statewide perspective on the future of senior centers through future federal OAA reauthorization deliberations. Results and Important Findings – Several themes emerged from the results of the survey and follow-up roundtable discussions.
Centers have diverse administrative structures, though most identify as non-profit organizations and are funded by county government.
The operating budgets of centers also varied, ranging from less than $50,000 to over $500,000.
Many centers are operating with very few full and part time staff and, as a result, are heavily dependent on volunteer support.
Volunteers provide many key services including assistance with setting up and planning for classes and activities, meal preparation, information and assistance, teaching classes, and other activities.
Centers often serve large geographic areas and draw their participants from multiple neighborhoods.
Transportation is often not an accessible service for many participants, especially those frail and disabled consumers who may require door-to-door services. Centers reported that transportation was one of their biggest barriers.
Overall attendance has grown in the last decade, but centers report that participant interests have changed. Younger participants are increasingly less interested in meals at the center and more interested in fitness and exercise activities.
4
Senior Center Action Steps – Based on the responses elicited from the survey and roundtable discussions, the following action steps emerged.
Increase Collaboration with State and Local Agencies and Organizations.
Work with mental health and substance abuse agencies to enhance access to resources for the growing prevalence of older adults with these issues.
Work collaboratively with local high schools, colleges and universities to recruit students to assist with maintenance activities (yard clean-up) or to teach classes such as computer literacy. Colleges and universities could also allow older adults to audit classes, as centers have seen an increase in the number of participants that are interested in continuing education.
Support Public Education, Outreach, and Marketing Activities.
Marketing and outreach activities assist centers in increasing participation, obtaining volunteers, increasing contributions.
A specific marketing campaign can work to change the public perception of senior centers and make them more appealing to the younger populations.
Develop an “open-house” to reintroduce civic leaders and the public at large to the center and what it offers.
Support Programming Innovations that Accommodate Caregivers.
Provide expanded options for service availability after-hours or on the weekends.
Enhance linkages to respite and caregiver support. Explore public funding opportunities. Explore new partnerships with managed care organizations and businesses. Partner with other state and local public and private agencies to meet service
needs and reach shared goals.
Support Programmatic and Structural Changes that Evolve to Meet the Needs of a Changing Demographic.
Develop an environment/structure similar to that of a community center – expand membership to be inclusive of intergenerational programming.
Act as the hub of information/access/programs/volunteer opportunities. Create centers that serve as the primary resource for entire senior community –
all-inclusive/interdisciplinary one stop shop. Congregate meal needs to evolve to be more appealing to younger generations. Develop a kiosk at centers where participants could receive information and
counseling on benefits such as SNAP, HEAP, SSI, etc.
Develop and Enhance Programs that Support Health Promotion and Wellness.
Newer participants are more interested in exercise and fitness programs – establish a health club feel.
5
Promote evidence-based programming. Tele-medicine – provision of health screenings, blood pressure checks, flu shots,
medication management, and so forth. II. Introduction NYSOFA, established in 1965 by Article 19-J of the Executive Law (now, New York State Elder Law, Article II, Title 1), is New York’s designated state unit on aging as required by the federal Older Americans Act (OAA). NYSOFA is the lead agency for promoting, coordinating, and administering federal, state and local programs and services for older New Yorkers ages 60 and over and their caregivers. The mission of NYSOFA is to help older New Yorkers to be as independent as possible for as long as possible through advocacy, the development and delivery of person-centered, consumer-oriented, and cost-effective policies, programs and services which support and empower older New Yorkers and their families, in partnership with the network of public and private organizations which serve older adults. Senior centers are a critical part of the aging network serving as a service hub for many communities. Emanating from state and federal statute and its stated mission, NYSOFA plays a central role in advocating on behalf of New York’s 3.7 million older adults ages 60 and older as well as over 3.1 million informal caregivers (family, friends and neighbors) providing daily or intermittent care for older adults and persons of all ages with disabilities. NYSOFA partners with 57 county-based area agencies on aging (AAA’s) and area agencies located on the St. Regis and Seneca Reservations. Combined, NYSOFA and the AAA’s maintain contracts with over 1,200 community-based organizations to deliver cost-effective, pre-Medicaid non-medical community-based long-term services and supports to at-risk older adults in their homes and communities. The goals and priorities of NYSOFA are consistent with the State’s vision for promoting and sustaining the independence of older New Yorkers – slowing the growth of Medicaid spending, implementing New York’s Olmstead plan, integrating services and breaking down silos with other agencies and systems, serving individuals where they are – in their homes and other community-based settings, implementing coordinated care models, and making government work better and smarter. NYSOFA’s goals and priorities are as follows:
Empower older New Yorkers, their families, and other consumers to make informed decisions about, and be able to easily access, existing health and long-term services and supports options;
Empower the network of AAA’s to work in partnership with managed care and other health and long-term services and supports systems and providers to deliver a comprehensive array of clinical and non-clinical services that support person-centered decision making and independence regardless of setting;
6
Enable older New Yorkers to remain in their own homes with high quality of life for as long as possible through the provision of home and community-based services, including supports for family caregivers;
Empower older New Yorkers to stay active and healthy through OAA services, evidence-based interventions such as Chronic Disease Self-Management and fall prevention, volunteerism and civic engagement, and the promotion of healthy lifestyles including expanding the use of Medicare prevention and wellness benefits;
Ensure the rights of older New Yorkers and prevent their abuse, neglect and exploitation; and
Refine current management and operational practices to identify quantifiable metrics used to measure performance, breaking down agency silos (state and local), and achieve greater efficiency and an effective management structure throughout the Aging Network in New York State.
Demographics and Change Drivers:
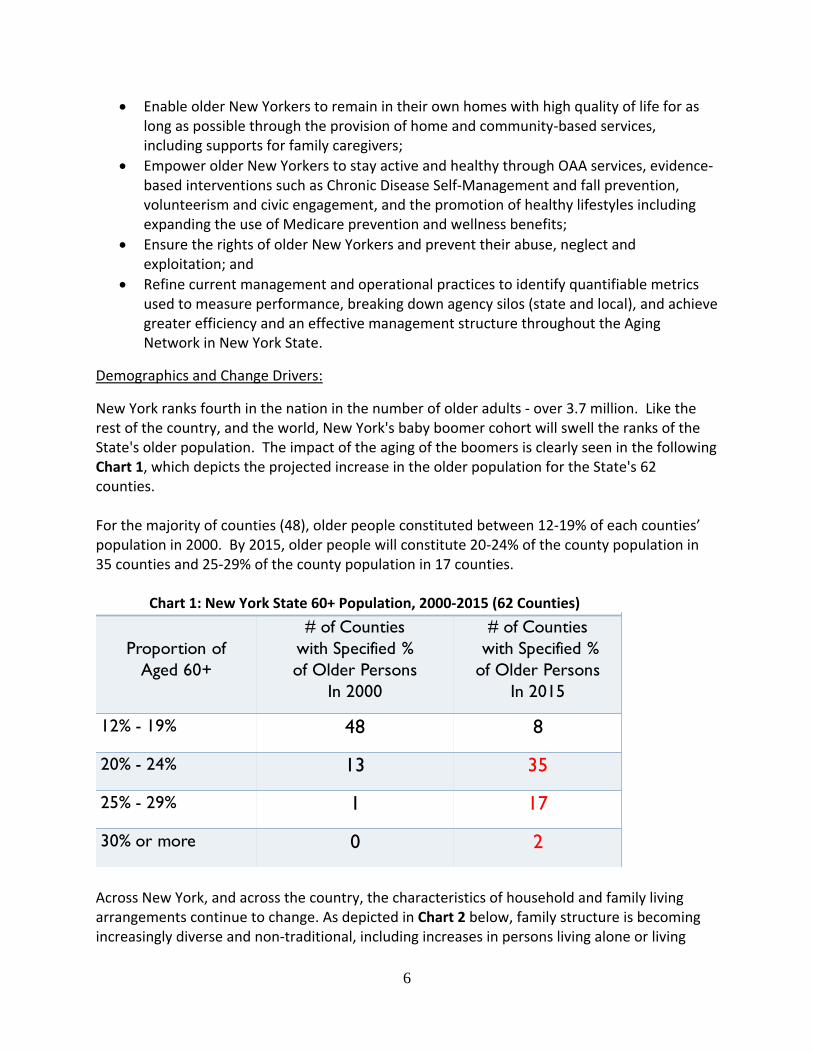
New York ranks fourth in the nation in the number of older adults - over 3.7 million. Like the rest of the country, and the world, New York's baby boomer cohort will swell the ranks of the State's older population. The impact of the aging of the boomers is clearly seen in the following Chart 1, which depicts the projected increase in the older population for the State's 62 counties. For the majority of counties (48), older people constituted between 12-19% of each counties’ population in 2000. By 2015, older people will constitute 20-24% of the county population in 35 counties and 25-29% of the county population in 17 counties.
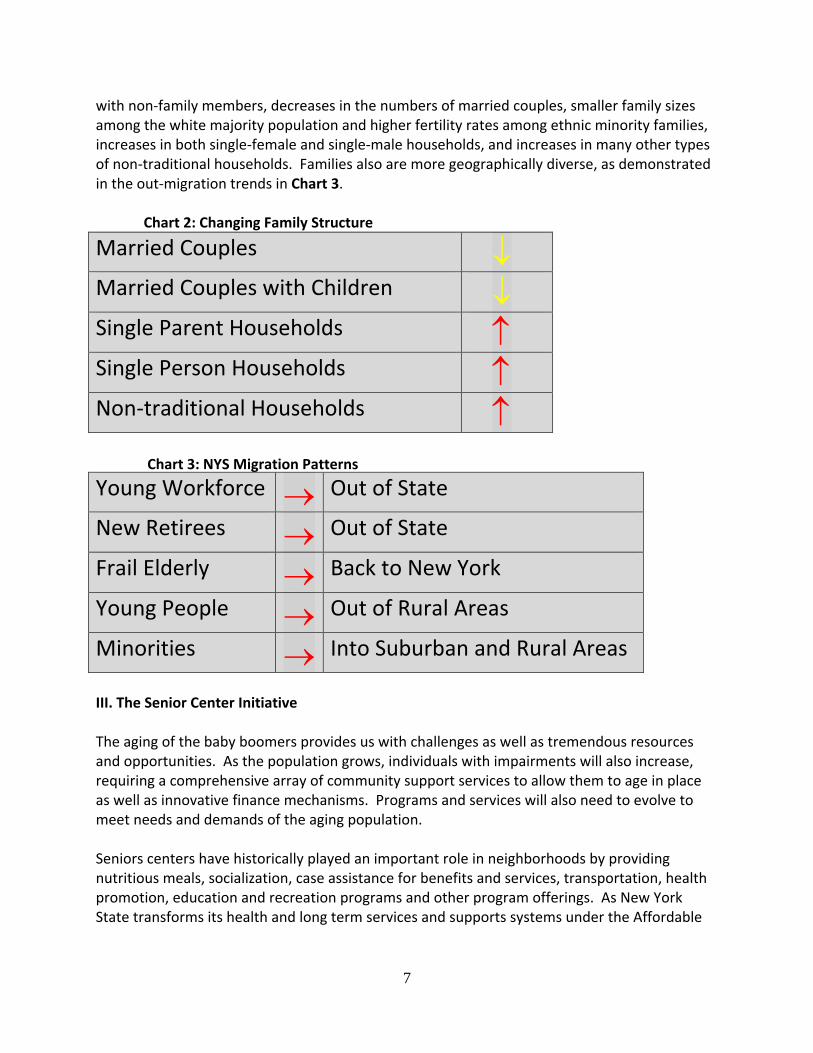
Across New York, and across the country, the characteristics of household and family living arrangements continue to change. As depicted in Chart 2 below, family structure is becoming increasingly diverse and non-traditional, including increases in persons living alone or living
New York State – 62 Counties
Proportion of Population Aged 60 and Over
2000 and 2015
Proportion of
Aged 60+
# of Counties
with Specified %
of Older Persons
In 2000
# of Counties
with Specified %
of Older Persons
In 2015
12% - 19% 48 8
20% - 24% 13 35
25% - 29% 1 17
30% or more 0 2
Chart 1: New York State 60+ Population, 2000-2015 (62 Counties)
7
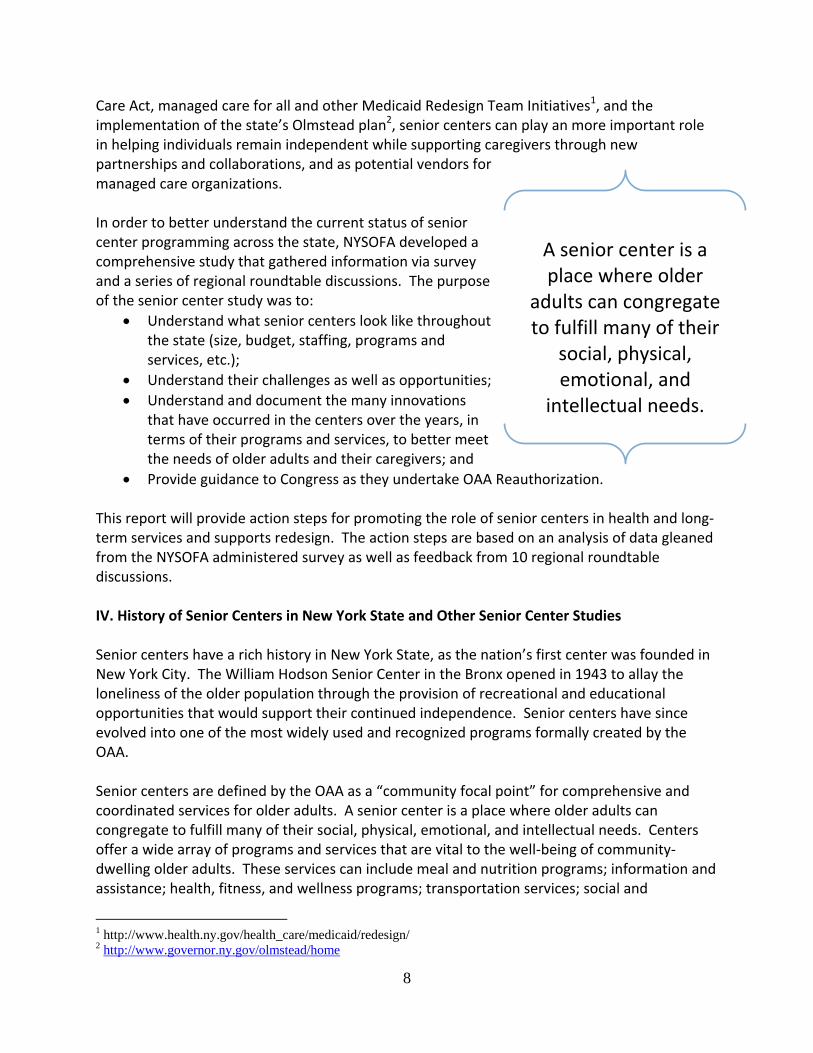
with non-family members, decreases in the numbers of married couples, smaller family sizes among the white majority population and higher fertility rates among ethnic minority families, increases in both single-female and single-male households, and increases in many other types of non-traditional households. Families also are more geographically diverse, as demonstrated in the out-migration trends in Chart 3. Chart 2: Changing Family Structure
Married Couples
Married Couples with Children
Single Parent Households
Single Person Households
Non-traditional Households
Young Workforce Out of State
New Retirees Out of State
Frail Elderly Back to New York
Young People Out of Rural Areas
Minorities Into Suburban and Rural Areas
III. The Senior Center Initiative The aging of the baby boomers provides us with challenges as well as tremendous resources and opportunities. As the population grows, individuals with impairments will also increase, requiring a comprehensive array of community support services to allow them to age in place as well as innovative finance mechanisms. Programs and services will also need to evolve to meet needs and demands of the aging population. Seniors centers have historically played an important role in neighborhoods by providing nutritious meals, socialization, case assistance for benefits and services, transportation, health promotion, education and recreation programs and other program offerings. As New York State transforms its health and long term services and supports systems under the Affordable
Chart 3: NYS Migration Patterns
8
Care Act, managed care for all and other Medicaid Redesign Team Initiatives1, and the implementation of the state’s Olmstead plan2, senior centers can play an more important role in helping individuals remain independent while supporting caregivers through new partnerships and collaborations, and as potential vendors for managed care organizations. In order to better understand the current status of senior center programming across the state, NYSOFA developed a comprehensive study that gathered information via survey and a series of regional roundtable discussions. The purpose of the senior center study was to:
Understand what senior centers look like throughout the state (size, budget, staffing, programs and services, etc.);
Understand their challenges as well as opportunities;
Understand and document the many innovations that have occurred in the centers over the years, in terms of their programs and services, to better meet the needs of older adults and their caregivers; and
Provide guidance to Congress as they undertake OAA Reauthorization. This report will provide action steps for promoting the role of senior centers in health and long-term services and supports redesign. The action steps are based on an analysis of data gleaned from the NYSOFA administered survey as well as feedback from 10 regional roundtable discussions. IV. History of Senior Centers in New York State and Other Senior Center Studies Senior centers have a rich history in New York State, as the nation’s first center was founded in New York City. The William Hodson Senior Center in the Bronx opened in 1943 to allay the loneliness of the older population through the provision of recreational and educational opportunities that would support their continued independence. Senior centers have since evolved into one of the most widely used and recognized programs formally created by the OAA. Senior centers are defined by the OAA as a “community focal point” for comprehensive and coordinated services for older adults. A senior center is a place where older adults can congregate to fulfill many of their social, physical, emotional, and intellectual needs. Centers offer a wide array of programs and services that are vital to the well-being of community-dwelling older adults. These services can include meal and nutrition programs; information and assistance; health, fitness, and wellness programs; transportation services; social and
1 http://www.health.ny.gov/health_care/medicaid/redesign/ 2 http://www.governor.ny.gov/olmstead/home
A senior center is a place where older
adults can congregate to fulfill many of their
social, physical, emotional, and
intellectual needs.
9
recreational activities; educational and arts programs; volunteer and civic engagement opportunities; and so forth. According to the National Council on Aging (NCOA), there are presently over 11,000 senior centers that serve more than 1 million older adults on a daily basis. Senior centers serve a diverse demographic. National statistics have demonstrated that a majority of senior center participants are women who live alone, with the average participant age being 75. Those that visit their local senior center typically do so at least once a week – NCOA reports that 75% of participants visit one to three times a week and spend at least 3 hours per visit. Participation in senior center programs and services has proven to have a positive impact on an older adults overall well-being and life satisfaction3. Based on information provided by AAA’s, NYSOFA estimates that there are approximately 650 senior centers across the state. This does not include independent senior centers that are operated by towns, villages, and other non-profits who do not receive funding from NYSOFA. In New York State, senior centers play an important role in connecting older adults to essential programs, services, and activities that support their independence in the community. The current health care reorganization and related long term supports and services systems change can provide opportunities for senior centers to enhance their roles in the public and private sectors, thereby increasing their visibility and sustainability. A February 2010 report by the Council of Senior Centers and Services of New York City Inc. (CSCS) titled “21st Century Senior Centers: Changing the Conversation4” studied the impact of senior centers on the lives of their participants; evaluated how senior centers are evolving to meet the challenges of the 21st Century; and examined the challenges faced by administrators in meeting the demands of their constituents, their communities, and their funders. This analysis of the City’s senior centers has led to the development and implementation of “Innovative Senior Centers” by the New York City Department for Aging (DFTA)5. The CSCS report recommends that senior centers evolve to serve more diverse populations in terms of age as well as culture, ethnicity, and limited English proficiency. Second, the report states that senior centers need to diversify their programs and services and hire qualified staff. Finally, the report states that senior centers need to enhance their capacity to meet new challenges. The data collected by NYSOFA and the action steps and conclusions are consistent with those provided in the CSCS report. In addition to the work that DFTA has done to develop and implement Innovative Senior Centers, DFTA also surveyed over 200 senior center directors to better understand the clients who are using the centers. Among DFTA’s findings from the survey include:
Over 70% of center participants have mental health issues, have cognitive issues and are physically frail.
3 National Council on Aging (2013). Senior Centers: Fact Sheet. http://www.ncoa.org/press-room/fact-sheets/senior-
centers-fact-sheet.html 4 http://cscs-ny.org/files/FINAL-WHOLE-REPORT.pdf 5http://www.nyc.gov/html/dfta/html/community/innovative_senior_centers.shtml
10
Over 80% of centers provide table service to participants to weak or frail to wait in line for lunch.
50% of centers have altered the physical space of their centers to accommodate participants.
Most centers are interested in forming/pursuing a relationship with a managed long term care provider with Medicaid reimbursement.
Among the opportunities DFTA cites is the opportunity to partner with managed long term care to offer “one-stop shopping” where older adult participants could receive all the services that they need, ensure proper nutrition at lunch and serve as a stimulating environment to reduce social isolation. V. Methodology and Data Collection Process NYSOFA designed a comprehensive survey (Appendix B) that captured basic information on the following elements:
Center demographics
Center operations
Activities and services
The role of volunteers within the center The survey was distributed to the 600+ senior centers across the state and yielded a return rate of 140 responses, or approximately 20%. The responses to the survey were analyzed and compiled using statistical software. In addition to conducting a statewide survey, NYSOFA also organized 10 regional roundtable listening sessions, which focused on a series of questions based on the results of the quantitative survey. These questions are contained in Appendix A of this report. The discussion groups were facilitated by NYSOFA staff via a PowerPoint presentation of survey results (Appendix C) and organized according to the AAA caucus region as follows: Long Island (Nassau and Suffolk), North Country, Central New York, Capital Region, Hudson Valley, Western New York, Southern Tier, Finger Lakes, and New York City/Westchester. Participants in the group discussions included senior center staff, AAA staff, and other key aging network stakeholders. Feedback obtained from these discussions was compiled and added to the Senior Center Action Steps section contained within this report. VI. Key Findings: Survey Results The results of the statewide survey support the importance of senior centers and the essential services they provide to maintain the independence of older adults. Several themes emerged from the survey’s results. These themes are presented as follows:
11
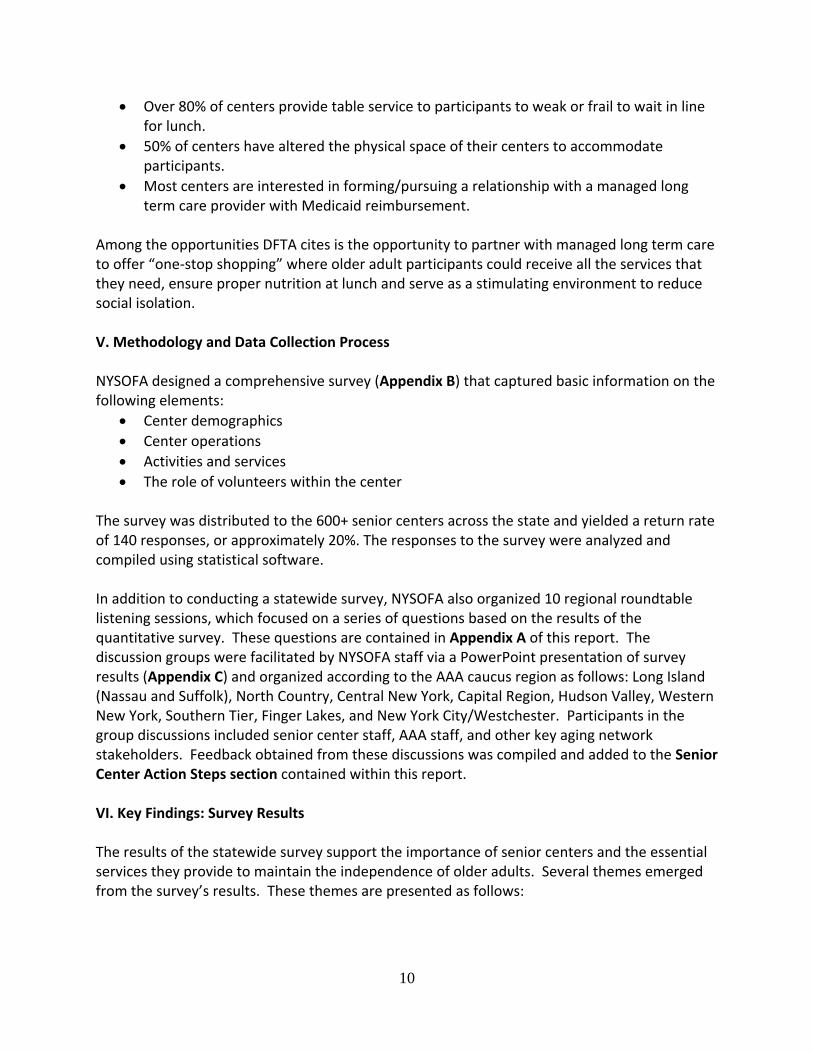
Funding/Administrative Structure: The survey indicated that the senior centers in New York State are very different in terms of their size, operating budgets, program and service offerings, and staffing. They represent a variety of geographic locations and serve a diverse selection of populations. The programmatic structure of the centers was also different across the state. Most (53%) of the centers that responded identified as a non-profit agency, while the remainder identified as a division of city, county, or municipal government. On average, county governments are the major source of funding for centers, representing 31% of the overall budget. State and federal funding followed making up 29% of the overall budget, while private fundraising and participant contributions fell close behind at 25%. The remaining budget consisted of fees (9%), while some identified other sources of funding, such as city or town government.
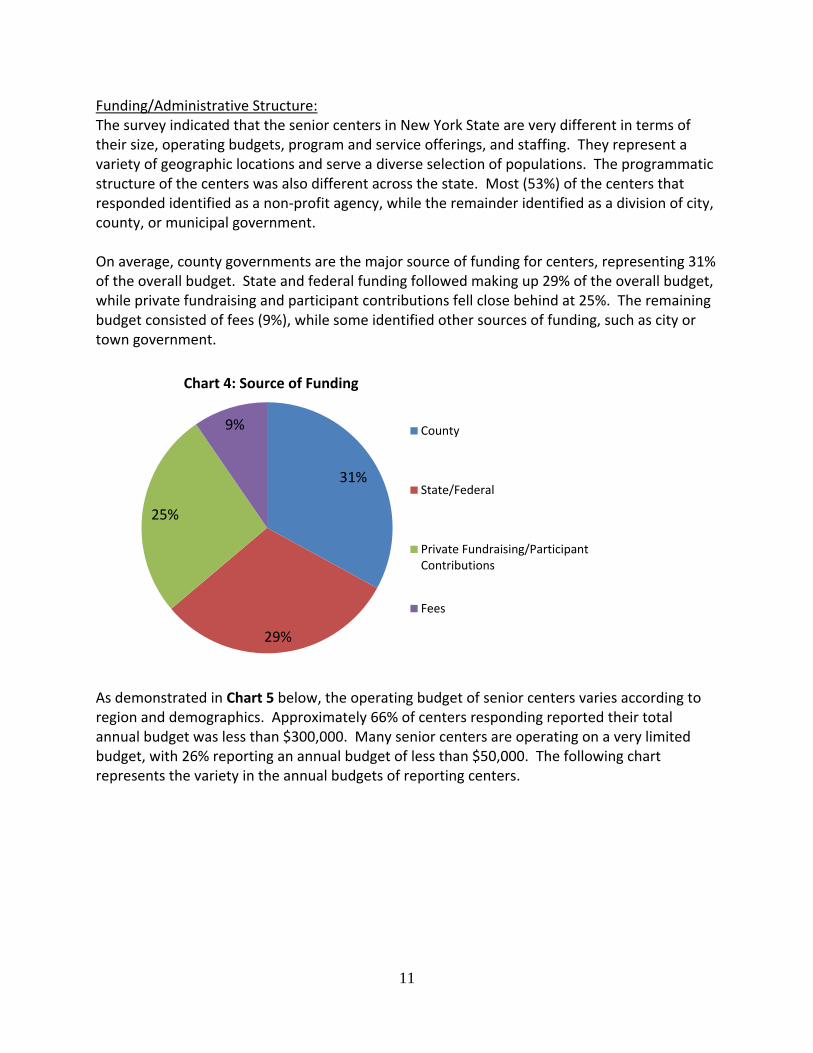
As demonstrated in Chart 5 below, the operating budget of senior centers varies according to region and demographics. Approximately 66% of centers responding reported their total annual budget was less than $300,000. Many senior centers are operating on a very limited budget, with 26% reporting an annual budget of less than $50,000. The following chart represents the variety in the annual budgets of reporting centers.
31%
29%
25%
9% County
State/Federal
Private Fundraising/ParticipantContributions
Fees
Chart 4: Source of Funding
12
Chart 5: Total Operating Budget
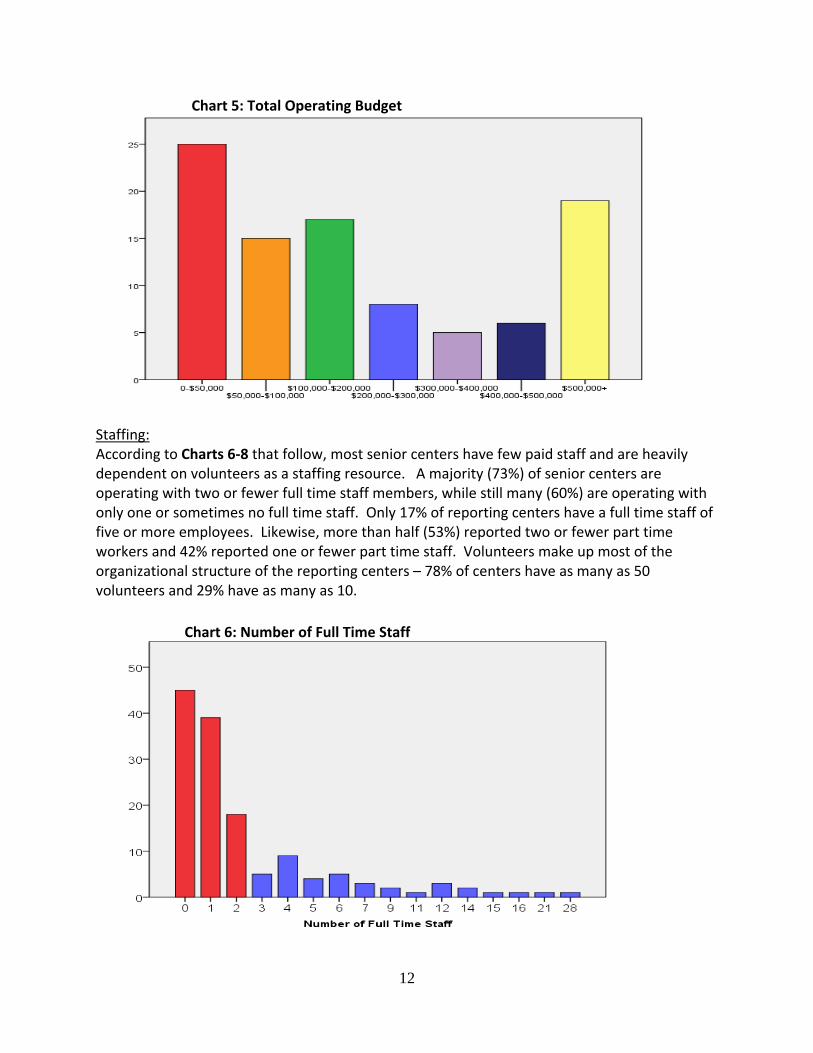
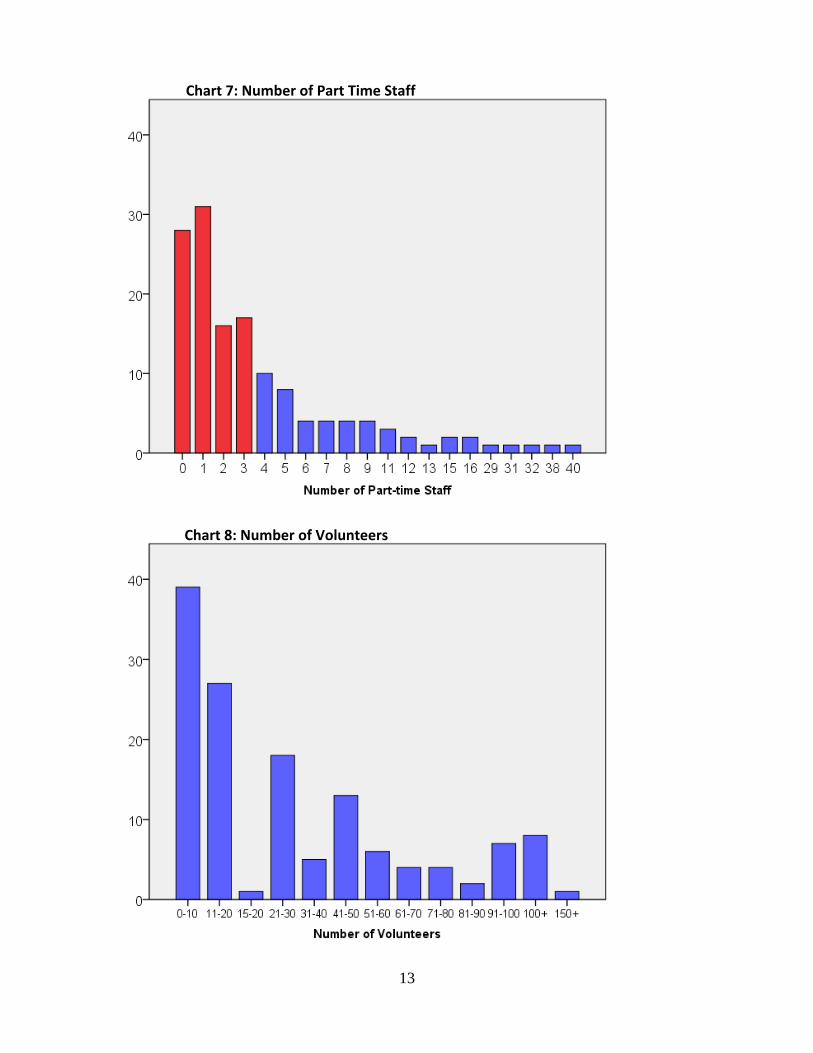
Staffing: According to Charts 6-8 that follow, most senior centers have few paid staff and are heavily dependent on volunteers as a staffing resource. A majority (73%) of senior centers are operating with two or fewer full time staff members, while still many (60%) are operating with only one or sometimes no full time staff. Only 17% of reporting centers have a full time staff of five or more employees. Likewise, more than half (53%) reported two or fewer part time workers and 42% reported one or fewer part time staff. Volunteers make up most of the organizational structure of the reporting centers – 78% of centers have as many as 50 volunteers and 29% have as many as 10.
Chart 6: Number of Full Time Staff
13
Chart 7: Number of Part Time Staff
Chart 8: Number of Volunteers
14
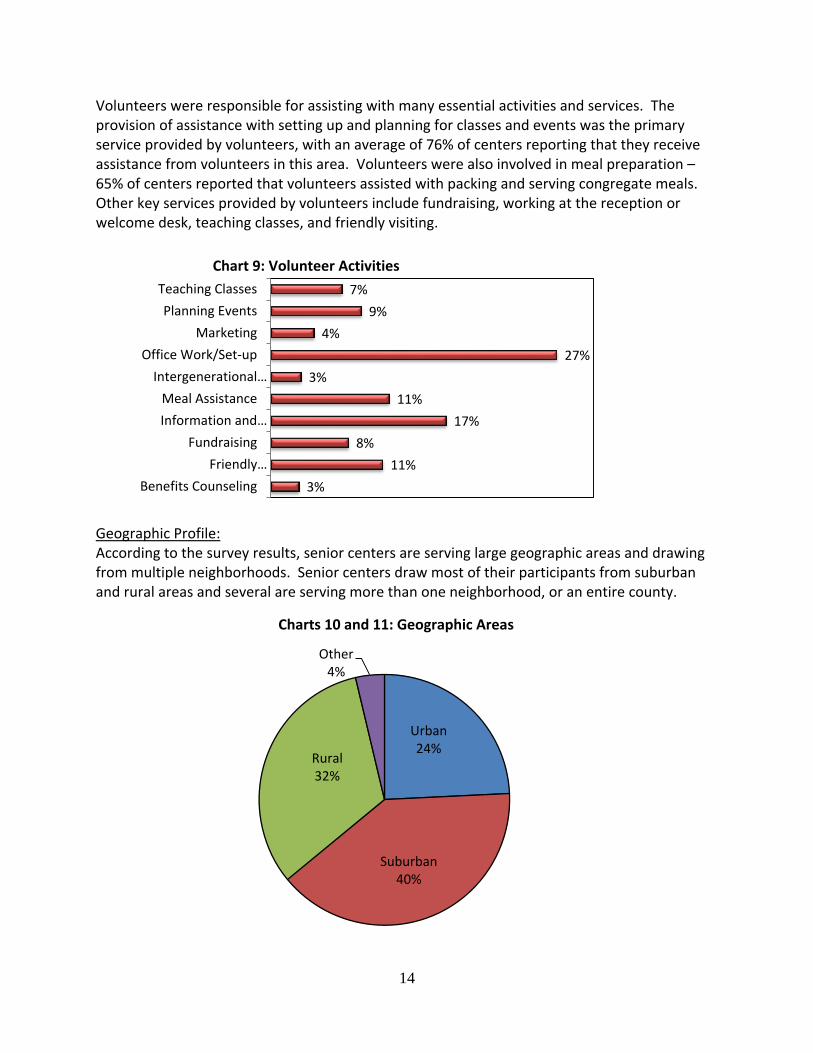
Volunteers were responsible for assisting with many essential activities and services. The provision of assistance with setting up and planning for classes and events was the primary service provided by volunteers, with an average of 76% of centers reporting that they receive assistance from volunteers in this area. Volunteers were also involved in meal preparation – 65% of centers reported that volunteers assisted with packing and serving congregate meals. Other key services provided by volunteers include fundraising, working at the reception or welcome desk, teaching classes, and friendly visiting.
Geographic Profile: According to the survey results, senior centers are serving large geographic areas and drawing from multiple neighborhoods. Senior centers draw most of their participants from suburban and rural areas and several are serving more than one neighborhood, or an entire county.
3%
11%
8%
17%
11%
3%
27%
4%
9%
7%
Benefits Counseling
Friendly…
Fundraising
Information and…
Meal Assistance
Intergenerational…
Office Work/Set-up
Marketing
Planning Events
Teaching Classes
Urban 24%
Suburban 40%
Rural 32%
Other 4%
Chart 9: Volunteer Activities
Charts 10 and 11: Geographic Areas
15
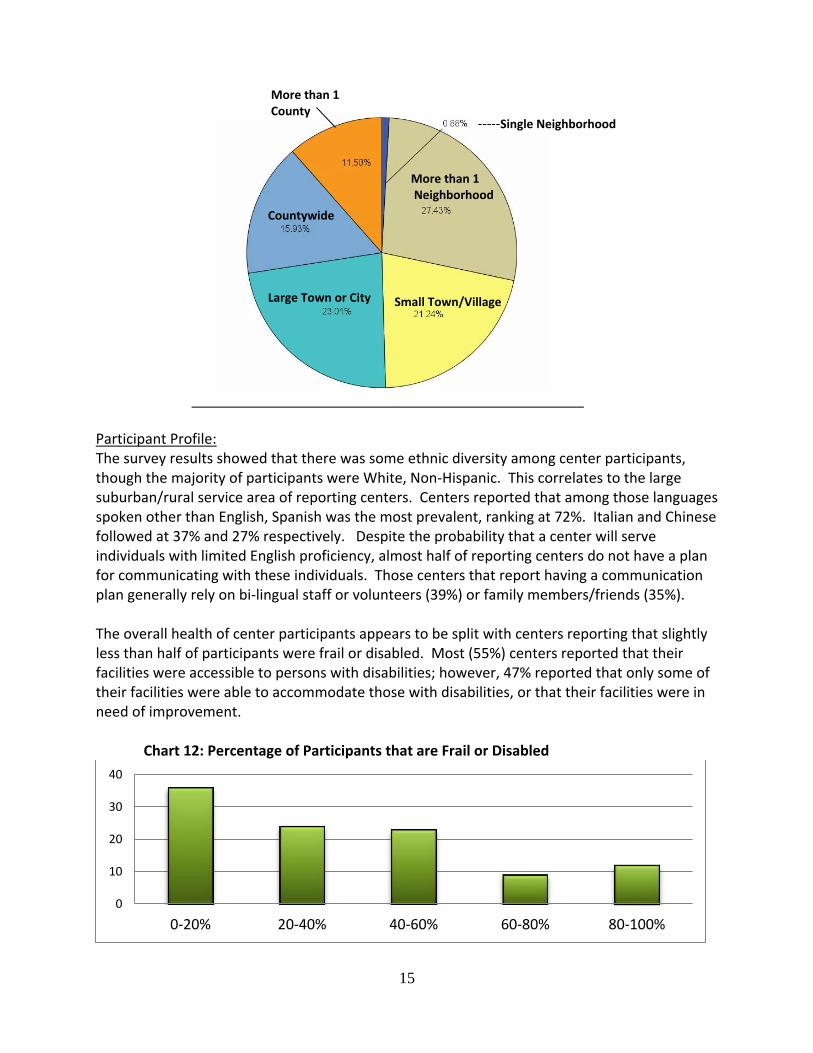
Participant Profile: The survey results showed that there was some ethnic diversity among center participants, though the majority of participants were White, Non-Hispanic. This correlates to the large suburban/rural service area of reporting centers. Centers reported that among those languages spoken other than English, Spanish was the most prevalent, ranking at 72%. Italian and Chinese followed at 37% and 27% respectively. Despite the probability that a center will serve individuals with limited English proficiency, almost half of reporting centers do not have a plan for communicating with these individuals. Those centers that report having a communication plan generally rely on bi-lingual staff or volunteers (39%) or family members/friends (35%). The overall health of center participants appears to be split with centers reporting that slightly less than half of participants were frail or disabled. Most (55%) centers reported that their facilities were accessible to persons with disabilities; however, 47% reported that only some of their facilities were able to accommodate those with disabilities, or that their facilities were in need of improvement.
Chart 12: Percentage of Participants that are Frail or Disabled
0
10
20
30
40
0-20% 20-40% 40-60% 60-80% 80-100%
-----Single Neighborhood
More than 1 County
Countywide
Large Town or City Small Town/Village
More than 1 Neighborhood
16
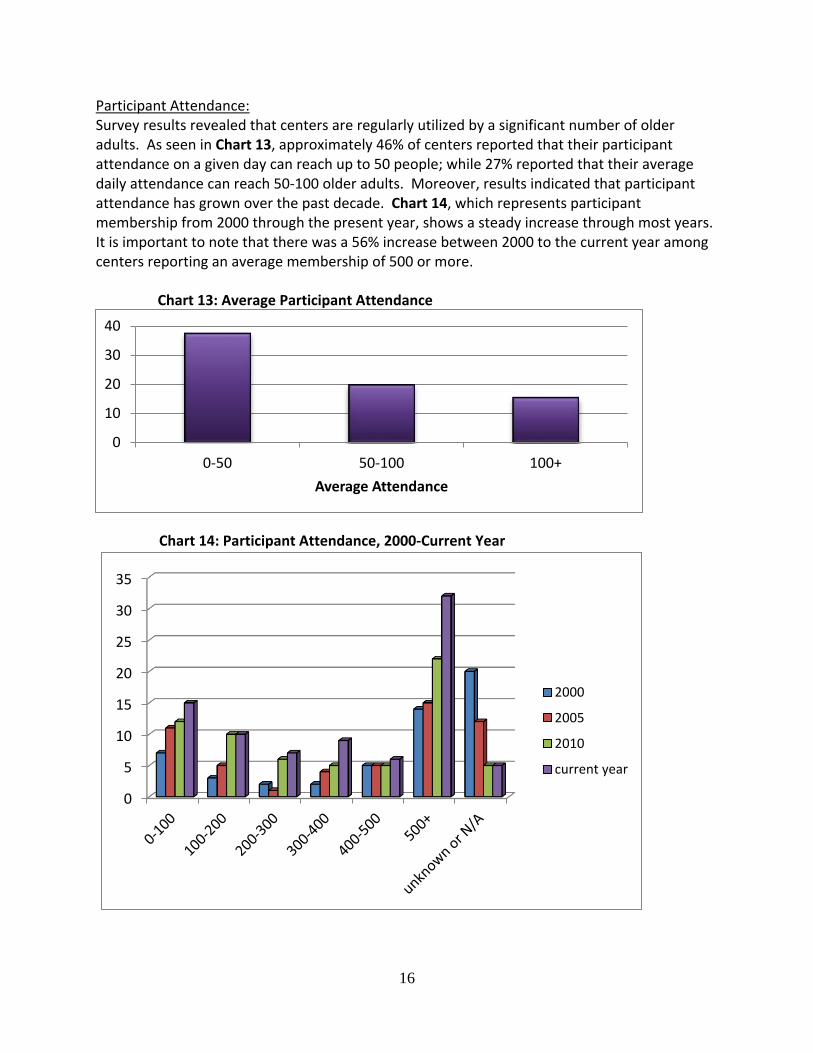
Participant Attendance: Survey results revealed that centers are regularly utilized by a significant number of older adults. As seen in Chart 13, approximately 46% of centers reported that their participant attendance on a given day can reach up to 50 people; while 27% reported that their average daily attendance can reach 50-100 older adults. Moreover, results indicated that participant attendance has grown over the past decade. Chart 14, which represents participant membership from 2000 through the present year, shows a steady increase through most years. It is important to note that there was a 56% increase between 2000 to the current year among centers reporting an average membership of 500 or more.
0
10
20
30
40
0-50 50-100 100+
Average Attendance
0
5
10
15
20
25
30
35
2000
2005
2010
current year
Chart 13: Average Participant Attendance
Chart 14: Participant Attendance, 2000-Current Year
17
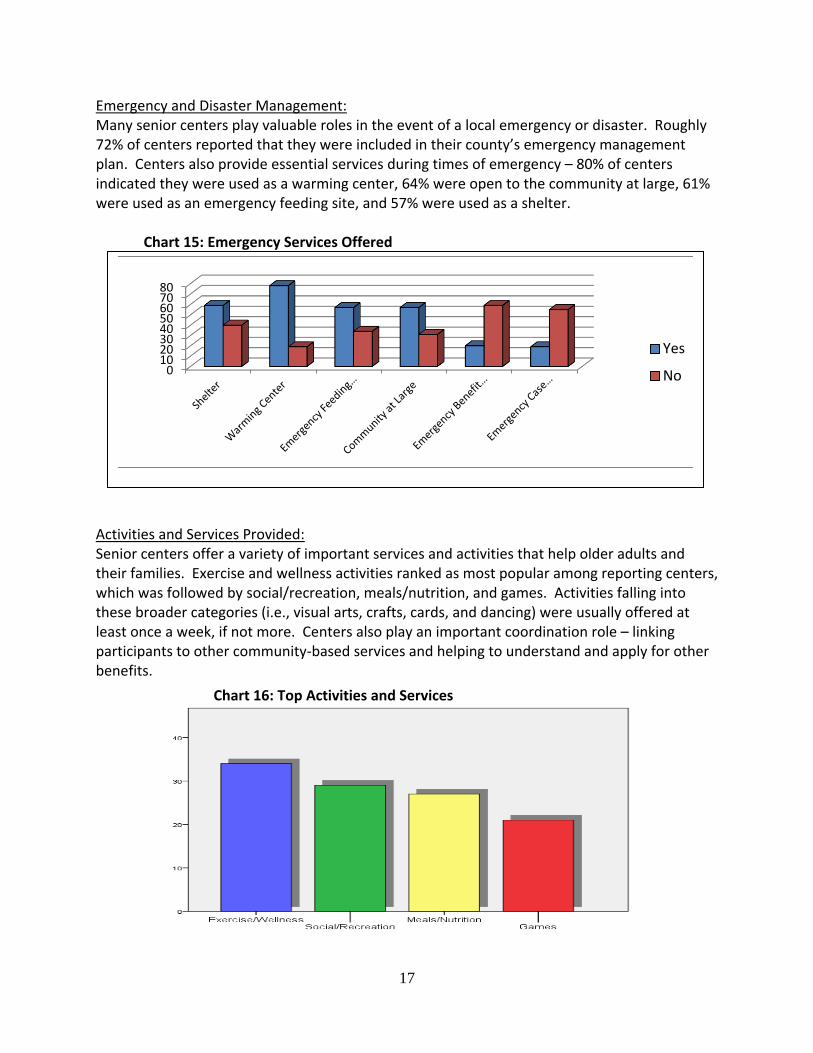
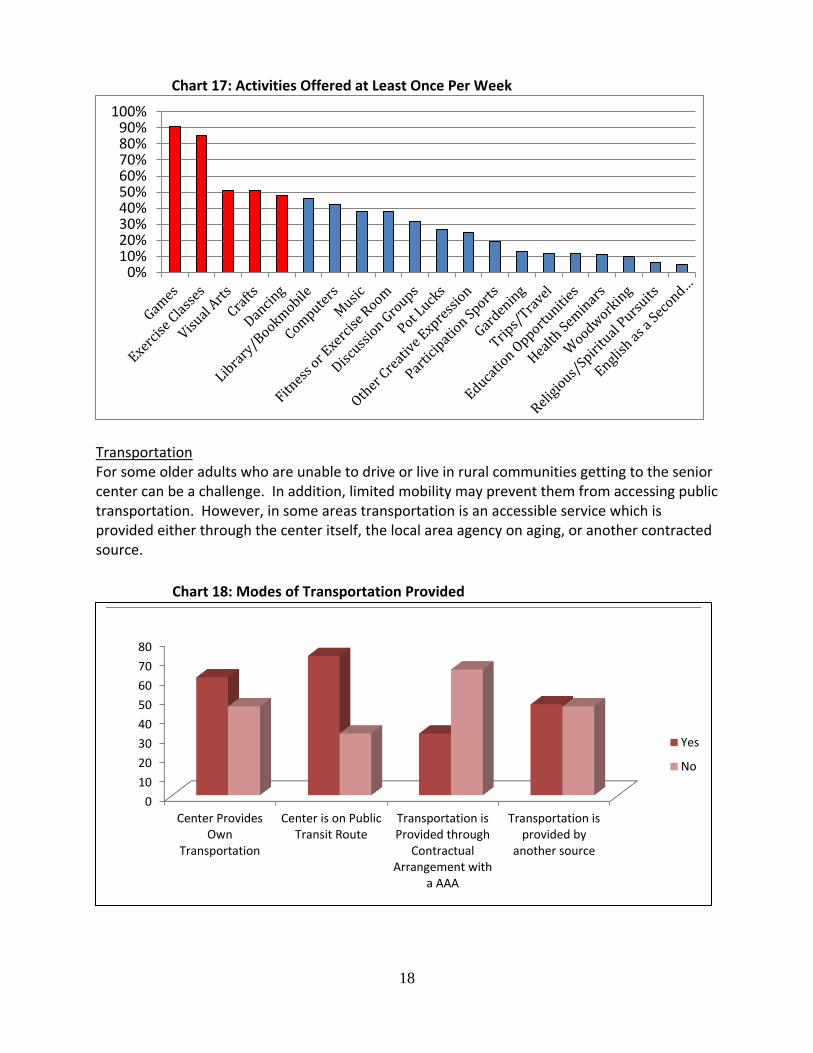
Emergency and Disaster Management: Many senior centers play valuable roles in the event of a local emergency or disaster. Roughly 72% of centers reported that they were included in their county’s emergency management plan. Centers also provide essential services during times of emergency – 80% of centers indicated they were used as a warming center, 64% were open to the community at large, 61% were used as an emergency feeding site, and 57% were used as a shelter. Chart 15: Emergency Services Offered Activities and Services Provided: Senior centers offer a variety of important services and activities that help older adults and their families. Exercise and wellness activities ranked as most popular among reporting centers, which was followed by social/recreation, meals/nutrition, and games. Activities falling into these broader categories (i.e., visual arts, crafts, cards, and dancing) were usually offered at least once a week, if not more. Centers also play an important coordination role – linking participants to other community-based services and helping to understand and apply for other benefits.
01020304050607080
Yes
No
Chart 16: Top Activities and Services
18
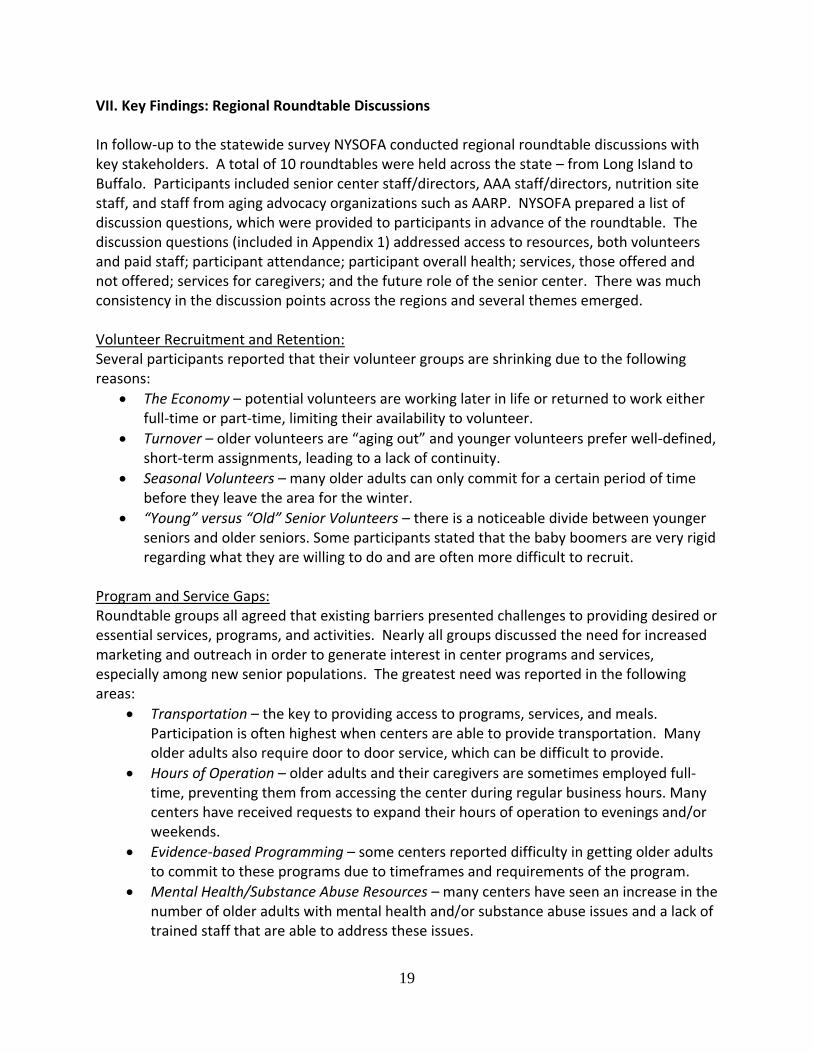
Transportation For some older adults who are unable to drive or live in rural communities getting to the senior center can be a challenge. In addition, limited mobility may prevent them from accessing public transportation. However, in some areas transportation is an accessible service which is provided either through the center itself, the local area agency on aging, or another contracted source.
0%10%20%30%40%50%60%70%80%90%
100%
0
10
20
30
40
50
60
70
80
Center ProvidesOwn
Transportation
Center is on PublicTransit Route
Transportation isProvided through
ContractualArrangement with
a AAA
Transportation isprovided by
another source
Yes
No
Chart 17: Activities Offered at Least Once Per Week
Chart 18: Modes of Transportation Provided
19
VII. Key Findings: Regional Roundtable Discussions In follow-up to the statewide survey NYSOFA conducted regional roundtable discussions with key stakeholders. A total of 10 roundtables were held across the state – from Long Island to Buffalo. Participants included senior center staff/directors, AAA staff/directors, nutrition site staff, and staff from aging advocacy organizations such as AARP. NYSOFA prepared a list of discussion questions, which were provided to participants in advance of the roundtable. The discussion questions (included in Appendix 1) addressed access to resources, both volunteers and paid staff; participant attendance; participant overall health; services, those offered and not offered; services for caregivers; and the future role of the senior center. There was much consistency in the discussion points across the regions and several themes emerged. Volunteer Recruitment and Retention: Several participants reported that their volunteer groups are shrinking due to the following reasons:
The Economy – potential volunteers are working later in life or returned to work either full-time or part-time, limiting their availability to volunteer.
Turnover – older volunteers are “aging out” and younger volunteers prefer well-defined, short-term assignments, leading to a lack of continuity.
Seasonal Volunteers – many older adults can only commit for a certain period of time before they leave the area for the winter.
“Young” versus “Old” Senior Volunteers – there is a noticeable divide between younger seniors and older seniors. Some participants stated that the baby boomers are very rigid regarding what they are willing to do and are often more difficult to recruit.
Program and Service Gaps: Roundtable groups all agreed that existing barriers presented challenges to providing desired or essential services, programs, and activities. Nearly all groups discussed the need for increased marketing and outreach in order to generate interest in center programs and services, especially among new senior populations. The greatest need was reported in the following areas:
Transportation – the key to providing access to programs, services, and meals. Participation is often highest when centers are able to provide transportation. Many older adults also require door to door service, which can be difficult to provide.
Hours of Operation – older adults and their caregivers are sometimes employed full-time, preventing them from accessing the center during regular business hours. Many centers have received requests to expand their hours of operation to evenings and/or weekends.
Evidence-based Programming – some centers reported difficulty in getting older adults to commit to these programs due to timeframes and requirements of the program.
Mental Health/Substance Abuse Resources – many centers have seen an increase in the number of older adults with mental health and/or substance abuse issues and a lack of trained staff that are able to address these issues.
20
HIICAP, HEAP, and other Benefits Counseling – most centers reported an increasing need for information and assistance regarding benefits and income-based programs.
Case Management – senior center participants are often seeking guidance on how to manage current life situations. Often staff will wind up providing this service as people would prefer to get it at the center, rather than be referred to another agency or organization that may specialize in this service.
Technology – several centers reported that they did not have access to computers. Those that did have access reported a need for instruction and/or someone to assist with technical issues so that participants are less intimidated by computers.
Volunteer Coordinators – centers acknowledged the importance of volunteers to senior center operations, but many reported a need for a Volunteer Coordinator to assist in managing volunteers, providing supervision, and assigning tasks.
Participant Profile: There was much consistency across the regions regarding the general profile of senior center participants. However, reports on attendance rates and overall health of participants tended to vary across regions. Those centers who experienced increasing attendance often noted some type of programmatic change that they could attribute it to. For instance, one center in the Finger Lakes region replaced a mid-day meal with a night time dining experience. Center staff and volunteers provided table service and they also involved the local high school. Moreover, NY Connects and staff from the AAA were available to answer questions and provide information. The dinner had approximately 130 attendees, where they typically receive 15-30 attendees for lunch. Several centers reported that participation at their centers was down. It is important to note that many centers reported that participation in programs, such as exercise and wellness, is rising; however, participation in meals is declining. They noted the following reasons for the overall decreasing attendance:
Poor health of older adults – many participants are “aging out”.
Younger seniors are not joining as quickly as older seniors leave.
Services and programs are not attractive to younger seniors – 60 years old is not considered “old” anymore.
The meal is no longer the focal point – participants are more interested in coming for specific classes and then leave. As a result, there are fewer regular participants.
There was also variety in responses regarding the overall health of center participants. Several centers noted that participants are older and frailer now than they were in years past. Many agreed that the increased frailty was a result of participants that were starting to come to the center at older ages, most likely because they are working longer into their lives. However, some centers reported that they see many participants in their 80’s or older who are in better health and less frail than many younger participants in their 60’s. Centers also stated that today’s older adults are more health conscious and take better care of themselves than previous generations of older adults.
21
Innovations to Increase Participation: The trend of decreasing attendance at senior centers has led some to develop program or service changes to evolve with the changing demographics. Examples of center innovations include:
Prescription delivery from the pharmacy to the centers
Implementation of history and current events programming as well as cultural events and activities
Community gardening through the City’s Green Thumb program
Nutrition programs to help older adults who may have nutrition-related health issues.
Expansion of the Chronic Disease Self-Management Program (both English and Spanish versions)
Geriatric mental health programming
Vegetarian and locally sourced organic meals
Access to a swimming pool for activities like a “Watercize” class and an underwater photography class
Pro-bono legal clinics
Depression and alcohol screenings
Dinner cafe with self-service options
Intergenerational programming, such as teaching computer literacy
Innovative programming, such as classes on Skype communication and bird watching
NY Public Library "satellite branch" to sign seniors up for library cards and run a monthly book club
Use of technology in health and wellness programs, including that which helps improve cognitive acuity
Tele-Health kiosks to help members monitor their own health
Virtual senior center programming enabling homebound seniors to participate in senior center classes and activities through webcams
Wellness coaching
Specialty programming for the Indian immigrant community
Volunteer-run morning “Coffee Club”
Guest chef program – prominent community members preparing favorite meals
“Breakfast for Your Brain” and other cognitive wellness programs
Provision of congregate and social services to NYC’s LGBT seniors;
Mental health programming designed specifically for the LGBT population
Provision of services designed to provide a vast number of workshops for older adults who are blind or visually impaired, including adaptive technology, Braille and various education programs
Lowered eligibility to age 50 to attract younger participants
Use of local colleges and universities to assist with yard clean-up for local seniors
Open center on the weekends/evenings to accommodate caregivers and working seniors
22
Schenectady County did a pilot test of a virtual senior center called “Tapping into the Arts” in a new building. The center offers an array of programs and services, such as flower making, acting 101, singing, comedy, yoga, and so forth. Teachers are paid a stipend and interns from Union College are being used as teachers.
JASA’s NextAct Programs provide cultural and educational programming, advocacy training, lecture series, conferences, and volunteer opportunities for adults aged 55+ in an effort to engage the baby boom population. Programs within NextAct include:
Sundays at JASA – a continuing education program that offers a wide range of courses, lectures and seminars focusing on the arts and humanities. Dynamic and expert educators teach all courses in an informal and relaxed setting. Semester-long courses are supplemented by a weekly lecture series featuring renowned journalists, writers and performers.
Joint Public Affairs Committee (JPAC) – JASA's advocacy program, established to promote leadership, civic involvement, and advocacy through citywide meetings, workshops, legislative visits, conferences, and social action.
Institute for Senior Action (IFSA) – a comprehensive education, leadership, and advocacy training program, which guides older adults on ways to engage in civic affairs and social action. The course is taught over a 10 week period, twice per year, in the fall and spring in Manhattan. There are 3-4 week IFSA courses are offered in the Bronx, Brooklyn and Queens. Instructors are carefully chosen experts in their respective fields; lecturers include elected officials, visionaries from grassroots organizations and leaders in the fields of gerontology and civic engagement, among others.
NextAct Lectures – offer fascinating perspectives into film, art, culture, politics, music, and a wide variety of other subjects, and take place in the evening followed by a wine and cheese reception.
Volunteer Services – provide a variety of meaningful experiences. Efforts are made to ensure a rewarding experience for both volunteer and the client.
VIII. Senior Center Action Steps The results of the survey and the corresponding roundtable discussions yielded several action steps that seniors centers can implement to ensure they are better equipped to meet the challenges of an aging population. Senior centers play an important role in ensuring the continued independence and well-being of older adults and they should have the capacity to evolve with the changing age structure to meet the needs of current and future generations as well as be a viable vendor for services in the states managed care for all environment. Following is a representative list of actionable items gleaned from the data collected during this study and regional roundtables.
23
Increase Collaboration with State and Local Agencies and Organizations.
Work with mental health and substance abuse agencies to enhance access to resources for the growing prevalence of older adults with these issues.
Work collaboratively with local high schools, colleges and universities to recruit students to assist with maintenance activities (yard clean-up) or to teach classes such as computer literacy. Colleges and universities could also allow older adults to audit classes, as centers have seen an increase in the number of participants that are interested in continuing education.
Support Public Education, Outreach, and Marketing Activities.
Marketing and outreach activities assist centers in increasing participation, obtaining volunteers, increasing contributions.
A specific marketing campaign can work to change the public perception of senior centers and make them more appealing to the younger populations.
Develop an “open-house” to reintroduce civic leaders and the public at large to the center and what it offers.
Support Programming Innovations that Accommodate Caregivers.
Services provided after-hours or on the weekends Enhance linkages to respite and caregiver support Explore public funding opportunities Explore new partnerships with managed care organizations and businesses. Partner with other state and local public and private agencies to meet gaps and
need and reach shared goals.
Support Programmatic and Structural Changes that Evolve to Meet the Needs of a Changing Demographic.
Develop an environment/structure similar to that of a community center – expand membership to be inclusive of intergenerational programming
Act as the hub of information/access/programs/volunteer opportunities Create centers as the primary resource for entire senior community – all
inclusive/interdisciplinary one stop shop Congregate meal needs to evolve to be more appealing to younger generations Develop a kiosk at centers where participants could receive information and
counseling on benefits such as SNAP, HEAP, SSI, etc.
Develop and Enhance Programs that Support Health Promotion and Wellness.
Newer participants are more interested in exercise and fitness programs – establish a health club feel
Promote evidence-based programming Tele-medicine – provision of health screenings, blood pressure checks, flu shots,
medication management, and so forth

24
IX. Conclusion The results of this study demonstrate the important role that senior centers play in the community and how unique each one is. The aging population will lead to increasing numbers of older adults in need of resources to remain independent in their communities. Moreover, the new generation of older adults will be more diverse and have different needs and demands than previous generations. It is important to examine the current structure of senior centers to determine necessary change to accommodate new generations. If senior centers progress to meet the growing and fluctuating needs of older adults, they will remain an active and vital part of the community.
25
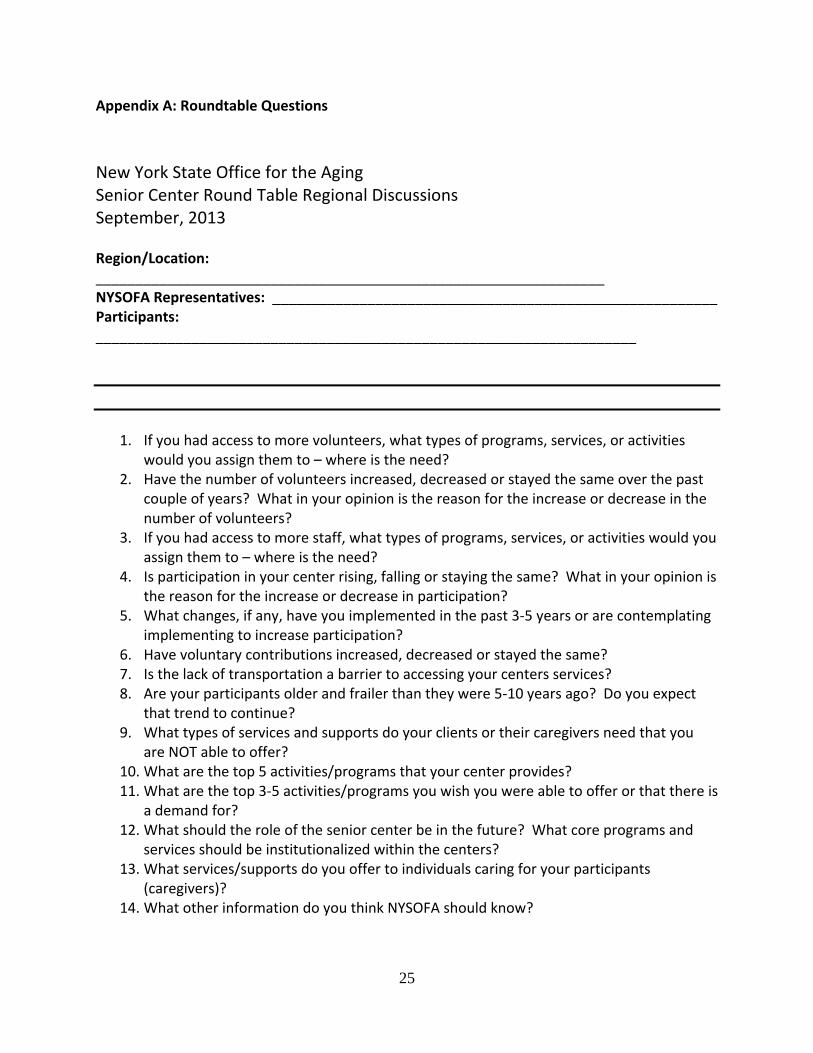
Appendix A: Roundtable Questions
New York State Office for the Aging Senior Center Round Table Regional Discussions September, 2013 Region/Location: ________________________________________________________________ NYSOFA Representatives: ________________________________________________________ Participants: ____________________________________________________________________
1. If you had access to more volunteers, what types of programs, services, or activities
would you assign them to – where is the need? 2. Have the number of volunteers increased, decreased or stayed the same over the past
couple of years? What in your opinion is the reason for the increase or decrease in the number of volunteers?
3. If you had access to more staff, what types of programs, services, or activities would you assign them to – where is the need?
4. Is participation in your center rising, falling or staying the same? What in your opinion is the reason for the increase or decrease in participation?
5. What changes, if any, have you implemented in the past 3-5 years or are contemplating implementing to increase participation?
6. Have voluntary contributions increased, decreased or stayed the same? 7. Is the lack of transportation a barrier to accessing your centers services? 8. Are your participants older and frailer than they were 5-10 years ago? Do you expect
that trend to continue? 9. What types of services and supports do your clients or their caregivers need that you
are NOT able to offer? 10. What are the top 5 activities/programs that your center provides? 11. What are the top 3-5 activities/programs you wish you were able to offer or that there is
a demand for? 12. What should the role of the senior center be in the future? What core programs and
services should be institutionalized within the centers? 13. What services/supports do you offer to individuals caring for your participants
(caregivers)? 14. What other information do you think NYSOFA should know?
26
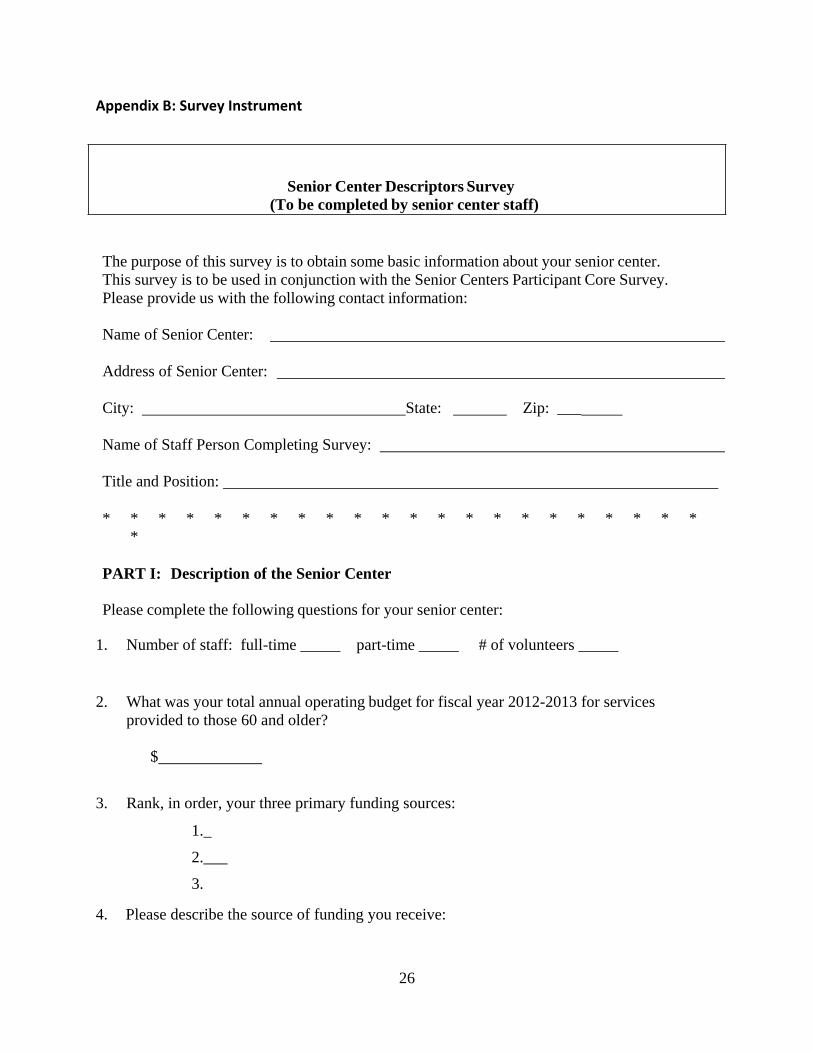
Appendix B: Survey Instrument
Senior Center Descriptors Survey
(To be completed by senior center staff)
The purpose of this survey is to obtain some basic information about your senior center.
This survey is to be used in conjunction with the Senior Centers Participant Core Survey.
Please provide us with the following contact information:
Name of Senior Center:
Address of Senior Center:
City: State: Zip: ___
Name of Staff Person Completing Survey:
Title and Position:
* * * * * * * * * * * * * * * * * * * * * *
*
PART I: Description of the Senior Center
Please complete the following questions for your senior center:
1. Number of staff: full-time _____ part-time _____ # of volunteers _____
2. What was your total annual operating budget for fiscal year 2012-2013 for services
provided to those 60 and older?
$
3. Rank, in order, your three primary funding sources:
1._ 2.___ 3.
4. Please describe the source of funding you receive:
27
State/Federal___________%
County_______________%
Private Fundraising/Participant Contributions_______________%
Fees______________%
5. Which of the following best describes your senior center?
(Please CIRCLE the best answer)
A not-for-profit agency................................................. 1
A division of city or county government........................ 2
Other .............................................................................. 3
(Please specify) 6. Does your organization operate one or more satellite program locations where senior
services are available?
Yes ..........................................................................................1
No ...........................................................................................2 (Go to Question 7)
6a. If Yes, please list or attach a list of your satellite sites to this survey.
7. Please identify the type of entity your center is operating as:
Discrete entity……………………………….…….............................................1
(Go to Question 8)
Discrete entity within a larger organization…………………………………….2
Part of a larger organization's overall programming………………………........3
Community center/part of a community center (open to all ages or all adults)..4
7a. If you answered "2" "3" or "4" in Question 7, please name the parent organization
and CIRCLE the number that corresponds to the category which best describes the
parent organization:
Name of parent organization:
Neighborhood house ............................................................1
Recreation department .........................................................2
Council on aging/department of aging..................................3
Community center................................................................4
Community action agency ...................................................5
Senior housing .....................................................................6
Other ...................................................................................7
28
(Please specify) 8. Please identify the geographic area from which you draw participants to your senior center.
(Please CIRCLE the best answer)
Single neighborhood................................................................1
More than one neighborhood...................................................2
Small town/village (less than 10,000 inhabitants)...................3
Large town/city (greater than 10,000 inhabitants)...................4
Countywide.............................................................................5
More than one county .............................................................6 9. From the list below, select the area that your senior center primarily draws participants from.
(You may circle more than one area)
Urban area...............................................................................1
Suburban area .........................................................................2
Rural area................................................................................3
Other ......................................................................................4
(Please specify)
10. What is the makeup of your center’s membership?
White, Non-Hispanic_______%
Black, Non-Hispanic_______%
Hispanic_______%
White (Alone) Hispanic_______%
Asian _______%
American Indian/Native Alaskan________%
Native Hawaiian/Other Pacific Islander_______%
11. Are facilities and programs accessible to frail persons or persons with disabilities (including
physical, cognitive, visual, and/or hearing impairments? (Please CIRCLE the best answer)
All…………………………………………………………….1
Some………………………………………………………….2
None………………………………………………………….3
In Need of Improvement……………………………………..4
12. Does your center have a plan for communicating with persons with limited English
proficiency? (Please CIRCLE the best answer)
29
Yes……………………………………………………………1
No…………………………………………………………….2
13. What is the most utilized method of communicating with persons with limited English
proficiency? (Please CIRCLE the best answer)
Bi-lingual staff/volunteers……………………………………1
Professional/trained interpreters……………………………...2
Family members or friends…………………………………...3
None identified……………………………………………….4
In need of improvement………………………………………5
Other, please specify__________________________
14. Identify languages other than English most commonly spoken by participants: (You may
circle more than one area)
Chinese…………………………………………………………1
Spanish…………………………………………………………2
Haitian Creole…………………………………………………..3
Italian…………………………………………………………...4
Korean…………………………………………………………..5
Russian………………………………………………………….6
Other, please specify__________________________
15. What percentage of program participants would you describe as frail or persons with
disabilities (including physical, cognitive, visual, and/or hearing impairments)?
____________________________ % 16. In an average day, approximately how many participants attend your senior center?
_____________________________
17. What was your center’s total membership for the following years:
2000________________________
2005________________________
2010________________________
Current Year_________________
30
18. For each day your center is open, please write the hours of operation. If the center is closed
on a particular day, on the line write “closed.”
Days Hours (Example: 8 a.m. until 5 p.m.)
Monday
Tuesday
Wednesday
Thursday
Friday
Saturday
Sunday 19. During an emergency/disaster is your center used for or does it provide any of the
following? (Please CIRCLE yes or no for each response option)
Yes No
a. Shelter 1 2
b. Warming Center 1 2
c. Emergency Feeding Site 1 2
d. Community at Large 1 2
e. Emergency Benefit Assistance 1 2
f. Emergency Case Management 1 2
g. Other 1 2
(Please Specify) ________________________________
20. Is your center included in your county’s emergency management plan?
Yes……………………………………………………..1
No………………………………………………………2
21. What sources of public/assisted transportation are available to the senior center participants?
(Please CIRCLE yes or no for each response option)
Yes No
a. Senior center provides own transportation ....................... 1 2
b. The senior center is on a public transit route .................... 1 2
c. Transportation is provided through a contractual
31
arrangement with an Area Agency on Aging ..................... 1 2
d. Transportation services for the participants are
provided by another source.............................................. 1 2
Please name or describe the other source: __________________________
PART II: Activities, Services and Volunteering
A. Activities
1. Of the activities that your center offers, please identify the top five (those
that draw the most participants):
1.______________________________________
2.______________________________________
3.______________________________________
4.______________________________________
5.______________________________________
2. In the activity list below, please identify how often that activity is
offered.
a. Exercise Classes (Tai chi, Yoga)
Not offered.........................................................................1
Offered 1-3 times a month.................................................2
Offered 1 time per week.....................................................3
Offered 2-4 times per week................................................4
Offered 5 or more times per week......................................5
b. Dancing (ballroom, line, square, etc.) Not offered.........................................................................1
Offered 1-3 times a month.................................................2
Offered 1 time per week.....................................................3
Offered 2-4 times per week................................................4
Offered 5 or more times per week......................................5 c. Games (pool, bingo, cards, bridge, dominos, bocce ball, mah jong, etc.).
Not offered.........................................................................1
Offered 1-3 times a month.................................................2
Offered 1 time per week.....................................................3
32
Offered 2-4 times per week................................................4
Offered 5 or more times per week......................................5
d. Fitness or Exercise Room
Not offered.........................................................................1
Offered 1-3 times a month.................................................2
Offered 1 time per week.....................................................3
Offered 2-4 times per week................................................4
Offered 5 or more times per week......................................5
e. Participation Sports (golf, softball, tennis, etc.)
Not offered.........................................................................1
Offered 1-3 times a month.................................................2
Offered 1 time per week.....................................................3
Offered 2-4 times per week................................................4
Offered 5 or more times per week......................................5
f. Visual Arts (painting, pottery, etc.)
Not offered.........................................................................1
Offered 1-3 times a month.................................................2
Offered 1 time per week.....................................................3
Offered 2-4 times per week................................................4
Offered 5 or more times per week......................................5
g. Music (singing, instrument, chorus, etc.)
Not offered.........................................................................1
Offered 1-3 times a month.................................................2
Offered 1 time per week.....................................................3
Offered 2-4 times per week................................................4
Offered 5 or more times per week......................................5
h. Crafts (quilting, needlepoint, basket weaving, etc.)
Not offered.........................................................................1
Offered 1-3 times a month.................................................2
Offered 1 time per week.....................................................3
Offered 2-4 times per week................................................4
Offered 5 or more times per week......................................5
i. Other Creative Expression (drama, journaling, writing, etc.)
Not offered.........................................................................1
Offered 1-3 times a month.................................................2
Offered 1 time per week.....................................................3
Offered 2-4 times per week................................................4
Offered 5 or more times per week......................................5
j. Woodworking
33
Not offered.........................................................................1
Offered 1-3 times a month.................................................2
Offered 1 time per week.....................................................3
Offered 2-4 times per week................................................4
Offered 5 or more times per week......................................5
k. Gardening
Not offered.........................................................................1
Offered 1-3 times a month.................................................2
Offered 1 time per week.....................................................3
Offered 2-4 times per week................................................4
Offered 5 or more times per week......................................5
l. Computers
Not offered.........................................................................1
Offered 1-3 times a month.................................................2
Offered 1 time per week.....................................................3
Offered 2-4 times per week................................................4
Offered 5 or more times per week......................................5
m. Education Opportunities (college courses lectures, etc.)
Not offered.........................................................................1
Offered 1-3 times a month.................................................2
Offered 1 time per week.....................................................3
Offered 2-4 times per week................................................4
Offered 5 or more times per week......................................5
n. English as a second language classes
Not offered.........................................................................1
Offered 1-3 times a month.................................................2
Offered 1 time per week.....................................................3
Offered 2-4 times per week................................................4
Offered 5 or more times per week......................................5
o. Library/Bookmobile
Not offered.........................................................................1
Offered 1-3 times a month.................................................2
Offered 1 time per week.....................................................3
Offered 2-4 times per week................................................4
Offered 5 or more times per week......................................5
p. Health Seminars
Not offered.........................................................................1
Offered 1-3 times a month.................................................2
Offered 1 time per week.....................................................3
Offered 2-4 times per week................................................4
34
Offered 5 or more times per week......................................5
q. Discussion Groups (book/news club)
Not offered.........................................................................1
Offered 1-3 times a month.................................................2
Offered 1 time per week.....................................................3
Offered 2-4 times per week................................................4
Offered 5 or more times per week......................................5
r. Trips, Travel Group, Field Trips
Not offered.........................................................................1
Offered 1-3 times a month.................................................2
Offered 1 time per week.....................................................3
Offered 2-4 times per week................................................4
Offered 5 or more times per week......................................5
s. Pitch-ins or Pot Lucks
Not offered.........................................................................1
Offered 1-3 times a month.................................................2
Offered 1 time per week.....................................................3
Offered 2-4 times per week................................................4
Offered 5 or more times per week......................................5
t. Religious/Spiritual Pursuits
Not offered.........................................................................1
Offered 1-3 times a month.................................................2
Offered 1 time per week.....................................................3
Offered 2-4 times per week................................................4
Offered 5 or more times per week......................................5
u. Other (please specify)
NA………..........................................................................1
Offered 1-3 times a month.................................................2
Offered 1 time per week.....................................................3
Offered 2-4 times per week................................................4
Offered 5 or more times per week......................................5
B. Services
3. Of the services that your center offers, please identify the top five (those
that draw the most participants):
1._______________________________________
2._______________________________________
35
3._______________________________________
4._______________________________________
5._______________________________________
4. In the s e r v i c e s list below, please indicate the number that represents
how often that service is offered.
a. Adult Day Services
Not offered.........................................................................1
Offered 1-3 times a month.................................................2
Offered 1 time per week.....................................................3
Offered 2-4 times per week................................................4
Offered 5 or more times per week......................................5
b. Congregate Meals Not offered.........................................................................1
Offered 1-3 times a month.................................................2
Offered 1 time per week.....................................................3
Offered 2-4 times per week................................................4
Offered 5 or more times per week......................................5
c. Home Delivered Meals
Not offered.........................................................................1
Offered 1-3 times a month.................................................2
Offered 1 time per week.....................................................3
Offered 2-4 times per week................................................4
Offered 5 or more times per week......................................5
d. Food Pantry/Food Commodities
Not offered.........................................................................1
Offered 1-3 times a month.................................................2
Offered 1 time per week.....................................................3
Offered 2-4 times per week................................................4
Offered 5 or more times per week......................................5
e. Nutrition Education and Training
Not offered.........................................................................1
Offered 1-3 times a month.................................................2
Offered 1 time per week.....................................................3
Offered 2-4 times per week................................................4
Offered 5 or more times per week......................................5
f. Flu Shots & Other Immunizations
Not offered .........................................................................1
Offered 1-3 times a month.................................................2
36
Offered 1 time per week.....................................................3
Offered 2-4 times per week................................................4
Offered 5 or more times per week......................................5
g. Health Monitoring/Screenings (blood pressure screening, osteoporosis
screening)
Not offered .........................................................................1
Offered 1-3 times a month.................................................2
Offered 1 time per week.....................................................3
Offered 2-4 times per week................................................4
Offered 5 or more times per week......................................5
h. Medication Management
Not offered .........................................................................1
Offered 1-3 times a month.................................................2
Offered 1 time per week.....................................................3
Offered 2-4 times per week................................................4
Offered 5 or more times per week......................................5
i. Medical Equipment and Supplies
Not offered .........................................................................1
Offered 1-3 times a month.................................................2
Offered 1 time per week.....................................................3
Offered 2-4 times per week................................................4
Offered 5 or more times per week......................................5
j. Home Care (personal care, homemaker/housekeeper, home health aide
shopping)
Not offered .........................................................................1
Offered 1-3 times a month.................................................2
Offered 1 time per week.....................................................3
Offered 2-4 times per week................................................4
Offered 5 or more times per week......................................5
k. Telephone Assurance/Emergency Response
Not offered .........................................................................1
Offered 1-3 times a month.................................................2
Offered 1 time per week.....................................................3
Offered 2-4 times per week................................................4
Offered 5 or more times per week......................................5
l. Caregiver and Respite services
Not offered ........................................................................1
Offered 1-3 times a month.................................................2
Offered 1 time per week.....................................................3
Offered 2-4 times per week................................................4
37
Offered 5 or more times per week......................................5
m. Energy Assistance
Not offered ........................................................................1
Offered 1-3 times a month.................................................2
Offered 1 time per week.....................................................3
Offered 2-4 times per week................................................4
Offered 5 or more times per week......................................5
n. Home Repair
Not offered ........................................................................1
Offered 1-3 times a month.................................................2
Offered 1 time per week.....................................................3
Offered 2-4 times per week................................................4
Offered 5 or more times per week......................................5
o. Counseling, Support Groups
Not offered.........................................................................1
Offered 1-3 times a month.................................................2
Offered 1 time per week.....................................................3
Offered 2-4 times per week................................................4
Offered 5 or more times per week......................................5
p. Information & Assistance with Employment
Not offered.........................................................................1
Offered 1-3 times a month.................................................2
Offered 1 time per week.....................................................3
Offered 2-4 times per week................................................4
Offered 5 or more times per week......................................5
q. Information & Assistance about Housing Opportunities
Not offered.........................................................................1
Offered 1-3 times a month.................................................2
Offered 1 time per week.....................................................3
Offered 2-4 times per week................................................4
Offered 5 or more times per week......................................5
r. Information & Assistance with Legal Affairs (living wills, power of attorney,
etc.)
Not offered.........................................................................1
Offered 1-3 times a month.................................................2
Offered 1 time per week.....................................................3
Offered 2-4 times per week................................................4
Offered 5 or more times per week......................................5
38
s. Information & Assistance with Medicare, Medicaid, LTC Insurance, etc.
Not offered.........................................................................1
Offered 1-3 times a month.................................................2
Offered 1 time per week.....................................................3
Offered 2-4 times per week................................................4
Offered 5 or more times per week......................................5
t. Information & Assistance about Taxes
Not offered.........................................................................1
Offered 1-3 times a month.................................................2
Offered 1 time per week.....................................................3
Offered 2-4 times per week................................................4
Offered 5 or more times per week......................................5
u. Transportation Provided by the Senior Center
Not offered.........................................................................1
Offered 1-3 times a month.................................................2
Offered 1 time per week.....................................................3
Offered 2-4 times per week................................................4
Offered 5 or more times per week......................................5
v. Assistance with Accessing other Community Transportation Options (e.g. bus
passes, rural transit networking, out of county transportation)
Not offered.........................................................................1
Offered 1-3 times a month.................................................2
Offered 1 time per week.....................................................3
Offered 2-4 times per week................................................4
Offered 5 or more times per week......................................5
w. Evidenced-based Programming (Chronic Disease Self-Management, Matter of
Balance, etc.)
Not offered.........................................................................1
Offered 1-3 times a month.................................................2
Offered 1 time per week.....................................................3
Offered 2-4 times per week................................................4
Offered 5 or more times per week......................................5
x. Other (please specify) ________________________________
NA………..........................................................................1
Offered 1-3 times a month.................................................2
Offered 1 time per week.....................................................3
Offered 2-4 times per week................................................4
Offered 5 or more times per week......................................5
C. Volunteering
5. How many of the following people assist as volunteers in your senior
39
center:
______ Number of senior men
______ Number of senior women
______ Number of non-senior adults
______ Number of young adults and teens
______ Total number of your Center's volunteers
6. For each of the volunteer activities, Circle “Yes” or “No” for each activity that
volunteers provide at the senior center.
Available
Yes No a. Benefits Counseling (e.g., Social Security, SNAP, HEAP, etc.)
.........................................................
1 2
b.
Friendly Visiting ..................................................................................................
1
2
c.
Fundraising ..........................................................................................................
1
2
d.
Information & Assistance with Legal Affairs (living wills, power of
attorney, etc.) .......................................................................................................
1
2
e.
Information & Assistance with Medicare, Medicaid, LTC Insurance, and
prescriptions.........................................................................................................
1
2
f.
Information & Assistance with Senior Health Insurance Information Program..
1
2
g.
Information & Assistance with Tax Preparation .................................................
1
2
h.
Information & Assistance with Transportation....................................................
1
2
i.
Packing/delivering Home Delivered Meals .........................................................
1
2
j.
Packing/serving Congregate Meals......................................................................
1
2
k.
Providing Respite/Sitter Services ........................................................................
1
2
l.
Mentoring Children & Other Intergenerational Activities...................................
1
2
m.
Teaching Classes..................................................................................................
1
2
n.
Setting up/cleaning for Classes and Events .........................................................
1
2
o.
Speaking to Groups about the Center (Marketing) ..............................................
1
2
40
p.
Planning or Coordinating Special Events ............................................................
1
2
q.
Telephone Reassurance........................................................................................
1
2
r.
Working at the Reception or Welcome Desk ......................................................
1
2
s.
Office Work
(e.g., typing/computer use, filing, keeping records/books)..................................
1
2
t. Working on the Newsletter .................................................................................. 1 2
u. Other .................................................................................................................... 1 2
(Please specify)
(Thank you for your cooperation!)