Embed Size (px)
Citation preview

Senior Nutrition Program Annual Report 2014-15


Table of Contents
Letter from the Director
Senior Nutrition Program
At-A-Glance
Partnerships
Program Summary
Target Population
Congregate Meals
Program Overview
Participant Profile
Meal Sites by District
Statistics
Demographics
Meals on Wheels
Program Overview
Participant Profile
Statistics
Demographics
3
4
5
8
9
10
11
12
15
16
19
21
22
22
Program Costs
Program Expenditures
Older Americans Act of 1965
Mobility Management
Program Overview
Statistics and Program Cost
Measure A Senior Transportation
Program Overview
Program Cost and Next Steps
SNP Going Forward
25
27
28
29
30
31
32
Cover Image: Strawberries and Cantaloupe at Northside, Photo by Elizabeth Tae

4
Letter from the Director
The growth in the number and proportion of older adults is unprecedented in the history of the United
States due to longer life spans and aging baby boomers. Since January 1, 2011 and every day for the next
20 years, roughly 10,000 Americans will celebrate their 65th birthdays. In 2030, when the last baby
boomers reach that magic age, the demographic landscape of our nation will have changed significantly.
One of every five people in the United States, or about 72 million people, will be an older adult. As more
Americans reach the age of 65, society is increasingly challenged to help them grow older with dignity and
comfort.
Good health, among other things, includes exercise, mental well-being, spiritual growth, family, friends,
hobbies and laughter. It also includes prevention and early detection. Nutritional improvement is a modi-
fiable behavior that can allow people to age in their own home, prolong independence, reduce medical
care utilization, lessen premature institutionalization and increase the quality of life of this population that
is growing every year. More than any other aspect of good health, improving nutritional intake is within
the ability of local governments.
The Senior Nutrition Program has been a well-regarded, stable safety-net program for the seniors in our
community since 1974. Through the Congregate Meals Program, seniors have access to healthy, nutri-
tious meals and are also provided the opportunity to socialize, take classes and access other services.
Through the Meals on Wheels Program, homebound seniors can receive nutritious meals and grocery
items delivered weekly to their home.
Thanks to the hard work and dedication of our community partners, the Senior Nutrition Program pro-
vided more meals this year than ever before. Seniors were empowered to help improve the quality and
diversity of menu items. The registration process was streamlined to better serve the meal sites. Most
importantly, this program provided the opportunity to positively transform the mental and physical well-
being of seniors throughout the County.
James Ramoni, Director
Department of Aging and Adult Services

5
Served a combined total of 1,306,766 meals to 14,679 unduplicated participants.
Provided an estimated total of 318,746 one-way rides to seniors with transportation barriers through a
collaboration with Outreach & Escort, Inc.
Entered over 5,200 registration forms for congregate meal participants.
Updated over 10,000 Nutrition Risk forms as mandated to receive federal funding.
Developed and delivered a quarterly newsletter providing facts and fun to Meals on Wheels seniors.
Conducted 124 nutrition and health education presentations at the congregate sites in collabora-
tion with the Public Health Department.
Supported 172 outreach events, either attending or providing brochures and information to different
organizations.
Performed 378 program monitoring and evaluation site visits.
Reviewed and approved 82 sets of menus.
Processed 485 invoices from vendors.
Performed 13 fiscal audits to ensure prudent use of public dollars.
Conducted 11 on-site fiscal staff trainings.
Welcoming New Staff
Three new staff members joined SNP this year. Our new Account-
ant Assistant, Lilia Roxas, comes to us from the private sector and
handles accounts payable, accounts receivable, and purchasing.
Brandon Pham joined us from another Social Services Agency pro-
gram as an Analyst and works on contract development and moni-
toring, legislative files, budgets, data reporting, scanners and system
issues and site administrative support. A new Office Specialist III
position was added to the program for FY 2015-2016. Marilyn Pi-
card was transferred on July 1, 2015 from Child Support Services to
fill the position and works on all aspects of the site registration pro-
cess. Welcome Lilia, Brandon and Marilyn!
Senior Nutrition Program
At– A-Glance
La Comida, Photo by Elizabeth Tae
Age is a question of mind over matter. If you don't mind, it
doesn't matter. –Satchel Paige

6
Senior Nutrition Program
Volunteers
Volunteers are critical to the operation of the Senior Nutrition Program. They are a tremendous resource
that builds service capacity to the congregate meal sites. Volunteers are recruited by each individual site
and work in registration, meal preparation and meal service. The Senior Nutrition Program is grateful for
their loyalty and dedication. Thank you to all the dedicated volunteers!
Congregate Meal Site Partners
We have a strong partnership with community-based organizations, faith-based organizations and munici-
palities to provide lunch-time meals. Every entity contributes financially with many of them contributing
more than the required match. Our congregate meal partners include:
Schools, Scouts and Faith-Based Youth Groups
Youth of all ages used their minds and artistic talents to create placemats and greeting cards for Valentine’s
Day and the holiday season. These works of art were distributed to Meals on Wheels participants with
their food deliveries.
Partnerships

7
Senior Nutrition Program
Partnerships
San Jose State University Work Study Program
The Federal Work Study Program provides the Senior Nutrition Program with student assistants who
handle congregate meal client registration and monthly rosters for the nutrition sites. This gives the
students an opportunity to work part-time to help fund their education at San José State University (SJSU)
while simultaneously gaining workplace experience. Here are our students:
Kathrina
“Hi, I’m Kat! I’m majoring in
Nutritional Science and hope to
venture out into the health field.
I’ve been working for this program
for about 2 years.”
Soraya
‘Hello! I am majoring in
Kinesiology and minoring in
Forensic Science. I have been
working for SNP for about
8 months.”
Elizabeth
“I’m a graduating senior pursuing
a Bachelor of Fine Arts in
Photography. I’ve been working for
SNP for about 6 months.”
San Jose State University Department of Nutrition and Food Science
The Senior Nutrition Program collaborates with SJSU’s Department of Nutrition and Food Science to
train future dietitians. Students are provided practical experience in community nutrition through the
Field Experience course and Dietetic Internship. Students must meet a minimum number of work experi-
ence hours to receive credit for completion of the class course or internship program. Under the super-
vision of SNP registered dietitians, students apply theoretical knowledge learned in the classroom to
hands-on work experience with the community nutrition and food service. Students completing the Die-
tetic Internship program meet the qualifications for practice in dietetics as a Registered Dietitian.

8
Senior Nutrition Program
Second Harvest Food Bank and Bulk Food Distribution
SNP partners with Second Harvest Food Bank (SHFB) to provide free
access to bulk food to reduce raw food costs. Congregate meal sites are
able to pick up an array of fresh produce, depending on what is in season
and available that week. Additional dry food can be ordered through
SHFB once a month and picked up at the Salvation Army. Meal sites
picked up 93,199 pounds of food at San Jose SHFB and 21,056 pounds
of food at San Mateo SHFB (La Comida), which saved sites $194,234
(114,255 total pounds x SHFB designated value of $1.70/lb).
Second Harvest Food Bank and CalFresh
In the SNP satisfaction survey distributed to Meals on Wheels participants, the last question inquired as to
whether or not a participant was interested in being contacted regarding CalFresh eligibility. This fiscal
year, 50 seniors indicated interest and provided their contact information for SHFB to determine eligibility.
Second Harvest Food Bank Brown Bag Program
Separate from SNP, SHFB and many of our congregate meal sites partner to provide the Brown Bag pro-
gram to participants. The Brown Bag includes a weekly bag of nutritious groceries such as fresh produce,
cereal, rice and other staple items that are delivered directly to the site. Participating sites include:
Other County Agencies
The Department of Environmental Health and the Public Health Department shared their knowledge and
expertise to keep our sites and seniors safe and healthy.
Partnerships
Gilroy Senior Center
Mountain View Senior Center
Alma Senior Center
Cypress Senior Center
Eastside Neighborhood Center
John XXIII Multi-Service Center
Mayfair Community Center
POSSO
Seven Trees Community Center
Southside Senior Center
Korean American Community
Services, Inc.
Northside Community Center
Santa Clara Valley Blind Center
Los Gatos
Villa Vasona
Gardner
Salvation Army

9
Senior Nutrition Program
Program Summary
The Senior Nutrition Program is authorized by the Older Americans Act of 1965 and has provided meals
to eligible seniors 60 years of age and older in Santa Clara County since 1974. The purpose of the pro-
gram is to reduce hunger and food insecurity, increase socialization and promote the health and well-being
of older adults by improving access to nutritious meals and other health services.
No senior is denied a meal if he/she is unable to pay!
Congregate Meals Program
39 sites countywide, open to all seniors age 60 or older
30 ethnically diverse menus
Each meal provides 1/3 of the daily recommended dietary allowance for a senior
Meal preparation varies by site—cook-on-site, restaurant catered, commercial kitchen
catered or centralized kitchen catered
Provides social opportunities as well as access to exercise programs, classes, legal and
financial services and more
Nutrition education offered four times a year at each site
Transportation services
Suggested participant contribution of $3.00 per meal
Meals on Wheels Program
Serves the most frail and isolated seniors of our community
Provides weekly delivery of 14 meals
Five (5) frozen lunch/dinners, in addition to a salad and sandwich/wrap entrees
and seven (7) breakfasts
Grocery items such as milk, bread, juice, fresh fruit, crackers, cheese, peanut
butter, etc.
Meals planned by a registered dietitian to meet 2/3 of the recommended dietary
allowance for a senior
Nutrition education offered four times a year through a newsletter
Suggested participant contribution of $1.80 per day
An additional Meals on Wheels service is provided through a contract with Yu-Ai Kai to
prepare and deliver daily hot meals to the Japantown and Berryessa neighborhoods
10
Target Population
Older Americans Act of 1965 Mandate
The Older Americans Act of 1965 (OAA) mandates the Senior Nutrition Program to provide nutrition
services to all persons aged 60 or older. Additionally, the OAA requires that services target persons with
the greatest social and economic need with particular attention to seniors who are age 75 or older, low-
income, living alone and/or minorities.
Target Population Minimum FY14-15
Age 75+ 32.00% 56.48%
Low-Income 7.00% 54.49%
Living Alone 7.00% 33.94%
Minority 40.00% 71.58%
Target Population
The following minimum targets are established by
the OAA to provide services to those in greatest
need. In FY 2014-2015, the Senior Nutrition Pro-
gram exceeded the targets in all areas.
Minimum
Minimum
Minimum
Minimum
11
Congregate Meals Program Overview
The Congregate Meals Program offers nutritious and healthy lunches at 39 different nutrition sites through-
out the County of Santa Clara. These lunches are either cooked on-site or catered by local restaurants or
food vendors and provide 1/3 of the Recommended Dietary Allowance for a senior. Additionally, these daily
lunches allow seniors the opportunity to socialize with one another and access exercise programs, classes
and other activities. The Congregate Meals Program is open to all seniors age 60 or over.
City of San José Conversion to Cook-On-Site
During the financial crisis in 2011, the City of San José (CSJ) considered closing a number of their congregate
meal sites. Given the importance of lower costs and maintaining food security within the senior population,
CSJ decided to switch from a cook-on-site model to a catered site model. While this solution did help with
the budget, many seniors were unhappy with the transition and expressed concern with the food quality and
lack of variety in food options.
In response to these concerns, the County of Santa Clara Board of Supervisors approved an on-going inven-
tory item of $400,000 during the FY 2014-2015 budget hearings to support the transformation of eleven con-
gregate meals sites back to the cook-on-site model.
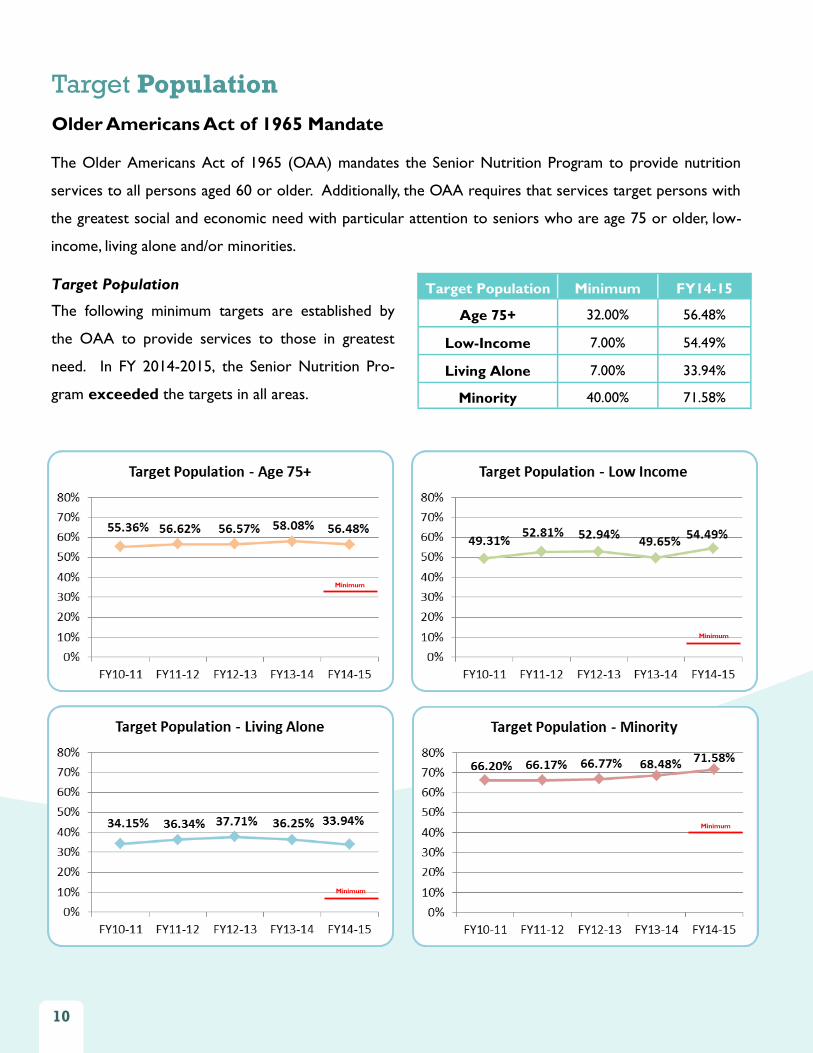
Through the hard work of staff from the City of San José, Bateman Community Living and County of Santa
Clara, the transition occurred as scheduled on January 20, 2015. Results and data from the December 2014
and May 2015 pre- and post-surveys showed that congregate meal participants are happier with the cook-on-
site model. The “Service Improved” and “Overall Satisfaction” categories improved 18.55% and 5.04% re-
spectively. Thank you to the Board of Supervisors!
City of San José Catered to Cook-on-Site Transition Before After Change
Survey Question Answer % % %
I feel healthier by eating at the nutrition site. Yes 94.12% 95.09% +0.97%
My health and spirits are maintained by socialization at the
nutrition site. Yes 97.44% 97.38% -0.07%
I have maintained my independence by attending the nutri-
tion site. Yes 95.85% 94.93% -0.93%
Over the past year, I feel the service at the nutrition site
has: Improved 58.57% 77.12% +18.55%
My overall level of satisfaction with the nutrition site is: Positive 87.43% 88.43% +5.04%
12
Congregate Meals
Registration Process
In order to receive State and Federal reimbursement, all seniors must regis-
ter for the program. Eligible participants complete the federally required
form, available in four languages, at the nutrition sites which are then for-
warded to SNP for processing. A single point of entry was created at SNP
to receive all forms which are entered into a database maintained by the
County’s Area Agency on Aging. Over 5,200 registration forms were pro-
cessed this year—an 80% increase from last year. The accuracy rate and
turn-around time for enrollment has also significantly improved. After forms
are entered into the database, registration numbers are assigned, barcodes
are created and participants are added to the nutrition sites’ rosters. The
nutrition sites use the barcode to create a “gold card” which is held by the
participant and scanned prior to eating a meal. Scanning participants’ bar-
codes allows the County to track participant attendance and demographics.
Participant Profile
A couple who attend the program at the Self-Help for the Elderly (Self-Help) nutrition site want to share
their story of how the Congregate Meals Program improved their quality of life.
Prior to learning about the program, the couple struggled with preparing meals for themselves. The wife had
been diagnosed with anxiety and was uncomfortable around others in group settings. She preferred to stay at
home and in bed which made it difficult for the couple to receive adequate nutrition and socialization. The
husband first attended Self-Help by himself and felt that going to the site provided him with an opportunity to
socialize and eat a healthy meal. He wanted his wife to have the same opportunity, but overcoming her anxie-
ty would be an obstacle. With their permission, SNP staff met with the couple in March 2015 to determine
the best option for the wife. Although she was hesitant to venture outside of her comfort zone, being able to
eat healthy Asian meals was appealing. She began accompanying her husband to the site once a week at the
end of the serving time. Gradually, with the support of her husband, site staff and volunteers, she was able to
attend daily and sit with the other seniors during the regular serving time.
She now volunteers at the site distributing milk to the other seniors. This routine helps her get out of bed
daily and she is determined to keep making small changes to improve her mental health. She is very thankful
for that fateful meeting in March that helped motivate her in making positive changes in her life.
Program Overview
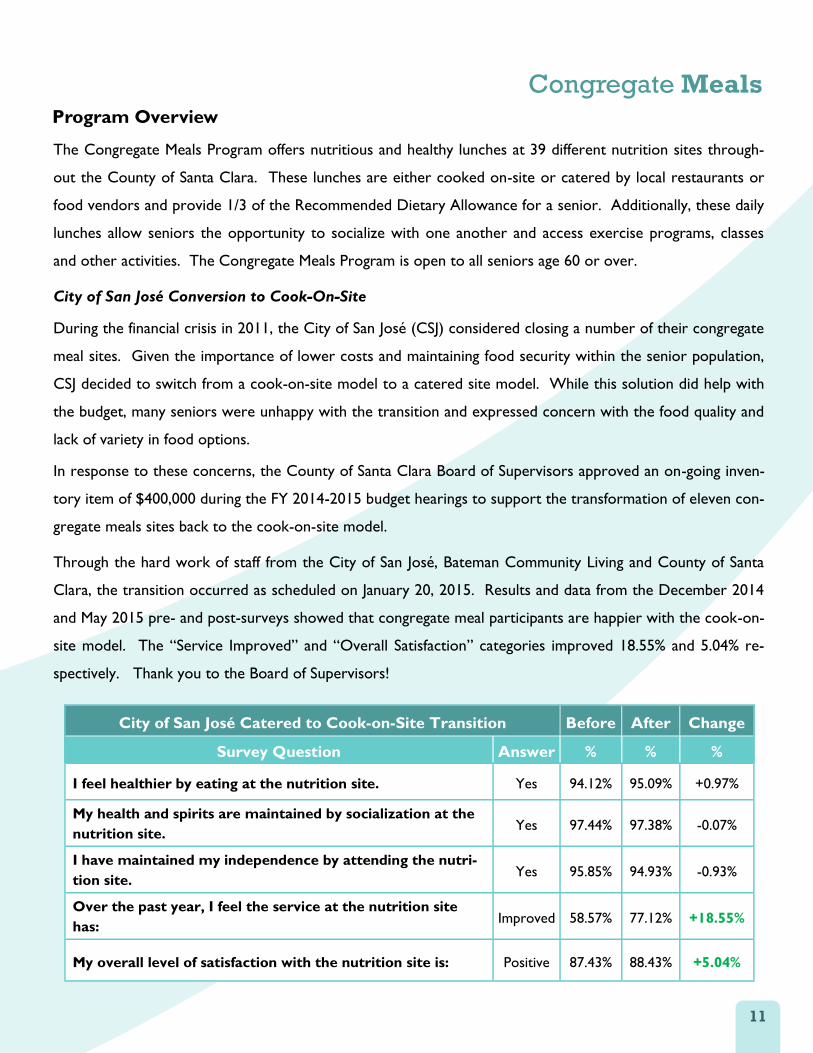
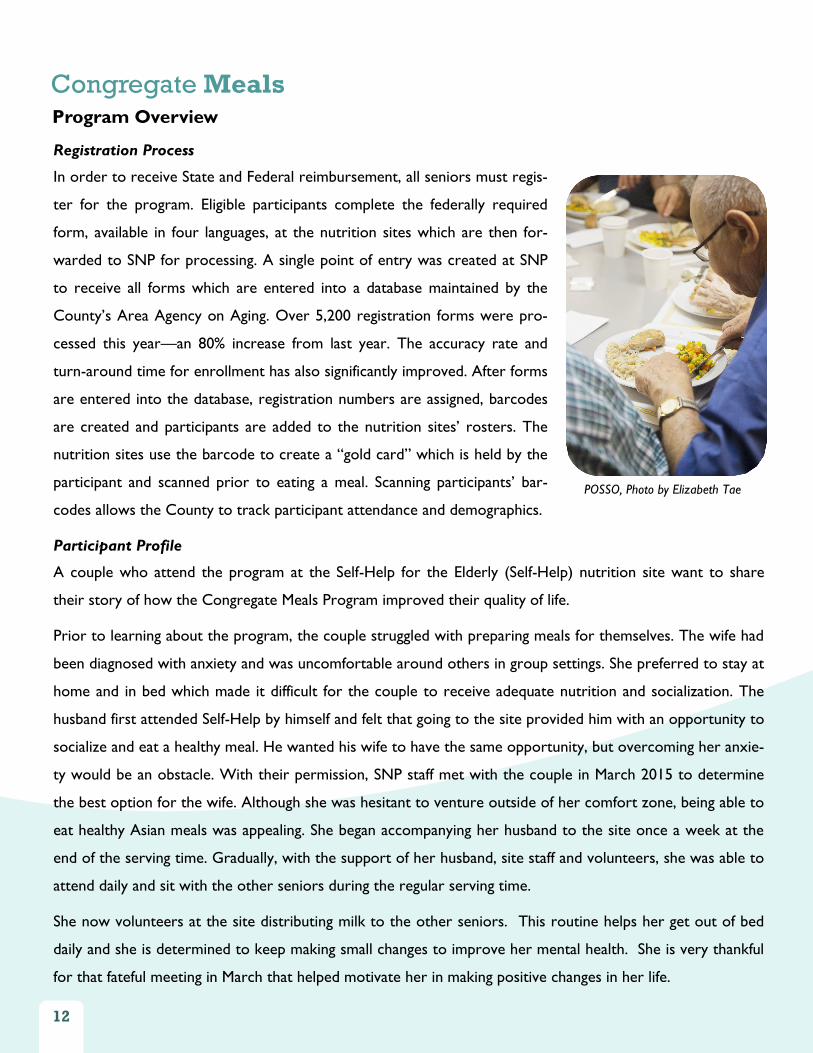
POSSO, Photo by Elizabeth Tae
13
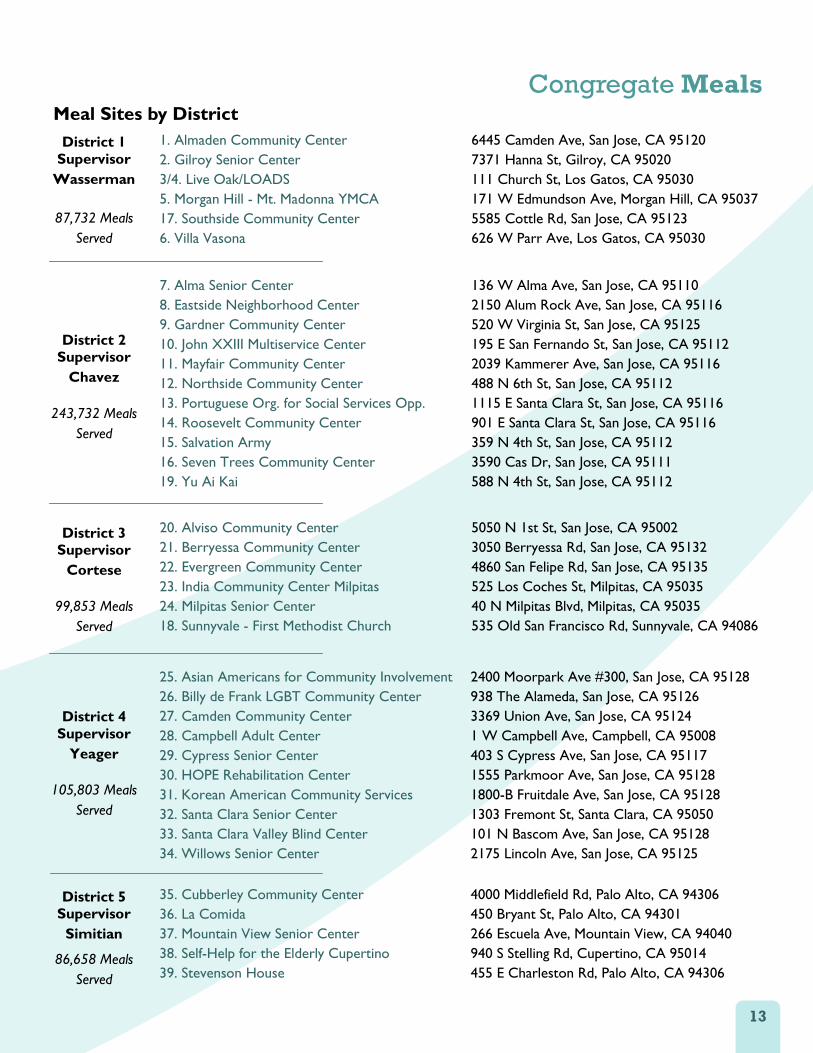
Meal Sites by District
1. Almaden Community Center
2. Gilroy Senior Center
3/4. Live Oak/LOADS
5. Morgan Hill - Mt. Madonna YMCA
17. Southside Community Center
6. Villa Vasona
6445 Camden Ave, San Jose, CA 95120
7371 Hanna St, Gilroy, CA 95020
111 Church St, Los Gatos, CA 95030
171 W Edmundson Ave, Morgan Hill, CA 95037
5585 Cottle Rd, San Jose, CA 95123
626 W Parr Ave, Los Gatos, CA 95030
7. Alma Senior Center
8. Eastside Neighborhood Center
9. Gardner Community Center
10. John XXIII Multiservice Center
11. Mayfair Community Center
12. Northside Community Center
13. Portuguese Org. for Social Services Opp.
14. Roosevelt Community Center
15. Salvation Army
16. Seven Trees Community Center
19. Yu Ai Kai
136 W Alma Ave, San Jose, CA 95110
2150 Alum Rock Ave, San Jose, CA 95116
520 W Virginia St, San Jose, CA 95125
195 E San Fernando St, San Jose, CA 95112
2039 Kammerer Ave, San Jose, CA 95116
488 N 6th St, San Jose, CA 95112
1115 E Santa Clara St, San Jose, CA 95116
901 E Santa Clara St, San Jose, CA 95116
359 N 4th St, San Jose, CA 95112
3590 Cas Dr, San Jose, CA 95111
588 N 4th St, San Jose, CA 95112
20. Alviso Community Center
21. Berryessa Community Center
22. Evergreen Community Center
23. India Community Center Milpitas
24. Milpitas Senior Center
18. Sunnyvale - First Methodist Church
5050 N 1st St, San Jose, CA 95002
3050 Berryessa Rd, San Jose, CA 95132
4860 San Felipe Rd, San Jose, CA 95135
525 Los Coches St, Milpitas, CA 95035
40 N Milpitas Blvd, Milpitas, CA 95035
535 Old San Francisco Rd, Sunnyvale, CA 94086
35. Cubberley Community Center
36. La Comida
37. Mountain View Senior Center
38. Self-Help for the Elderly Cupertino
39. Stevenson House
4000 Middlefield Rd, Palo Alto, CA 94306
450 Bryant St, Palo Alto, CA 94301
266 Escuela Ave, Mountain View, CA 94040
940 S Stelling Rd, Cupertino, CA 95014
455 E Charleston Rd, Palo Alto, CA 94306
25. Asian Americans for Community Involvement
26. Billy de Frank LGBT Community Center
27. Camden Community Center
28. Campbell Adult Center
29. Cypress Senior Center
30. HOPE Rehabilitation Center
31. Korean American Community Services
32. Santa Clara Senior Center
33. Santa Clara Valley Blind Center
34. Willows Senior Center
2400 Moorpark Ave #300, San Jose, CA 95128
938 The Alameda, San Jose, CA 95126
3369 Union Ave, San Jose, CA 95124
1 W Campbell Ave, Campbell, CA 95008
403 S Cypress Ave, San Jose, CA 95117
1555 Parkmoor Ave, San Jose, CA 95128
1800-B Fruitdale Ave, San Jose, CA 95128
1303 Fremont St, Santa Clara, CA 95050
101 N Bascom Ave, San Jose, CA 95128
2175 Lincoln Ave, San Jose, CA 95125
District 1
Supervisor
Wasserman
87,732 Meals
Served
District 2
Supervisor
Chavez
243,732 Meals
Served
District 3
Supervisor
Cortese
99,853 Meals
Served
District 4
Supervisor
Yeager
105,803 Meals
Served
District 5
Supervisor
Simitian
86,658 Meals
Served
Congregate Meals
14
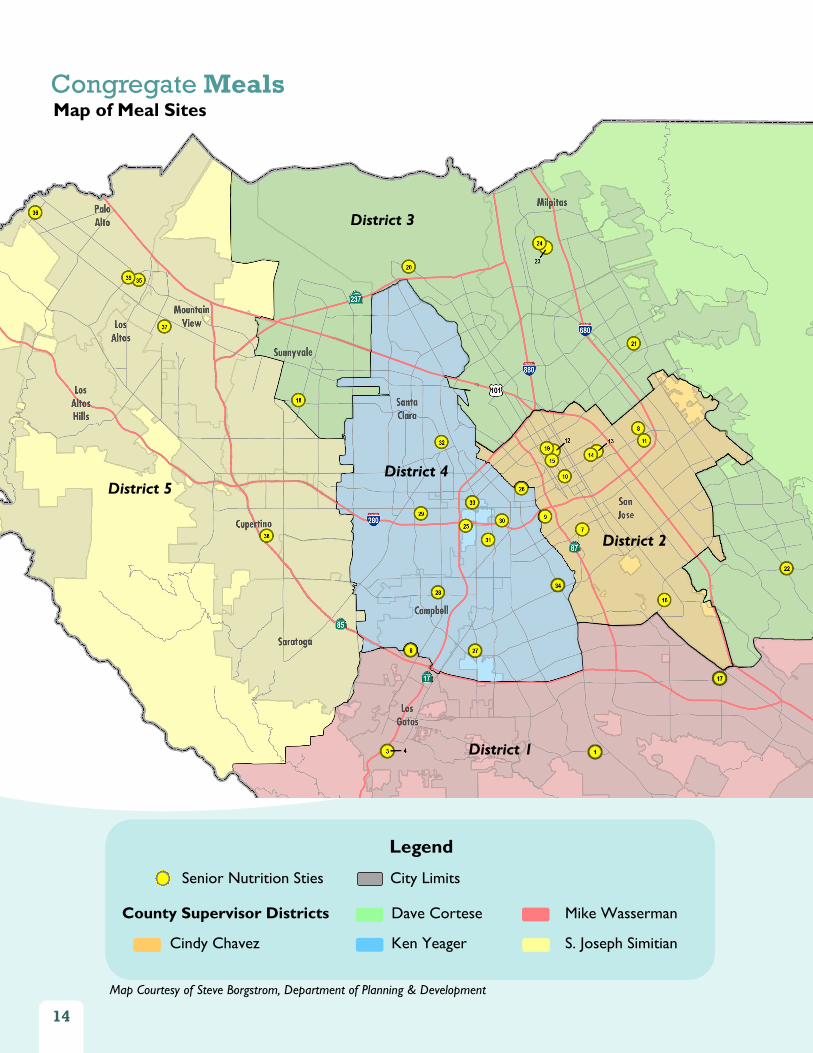
Map of Meal Sites
Senior Nutrition Sties City Limits
County Supervisor Districts
Cindy Chavez
Dave Cortese
Ken Yeager
Mike Wasserman
S. Joseph Simitian
Legend
Congregate Meals
Map Courtesy of Steve Borgstrom, Department of Planning & Development
District 3
District 4 District 5
District 1
District 2

15
Congregate Meals Map of Meal Sites
Map Courtesy of Steve Borgstrom, Department of Planning & Development
Senior Nutrition Sties City Limits
County Supervisor Districts
Cindy Chavez
Dave Cortese
Ken Yeager
Mike Wasserman
S. Joseph Simitian
Legend
District 1
16
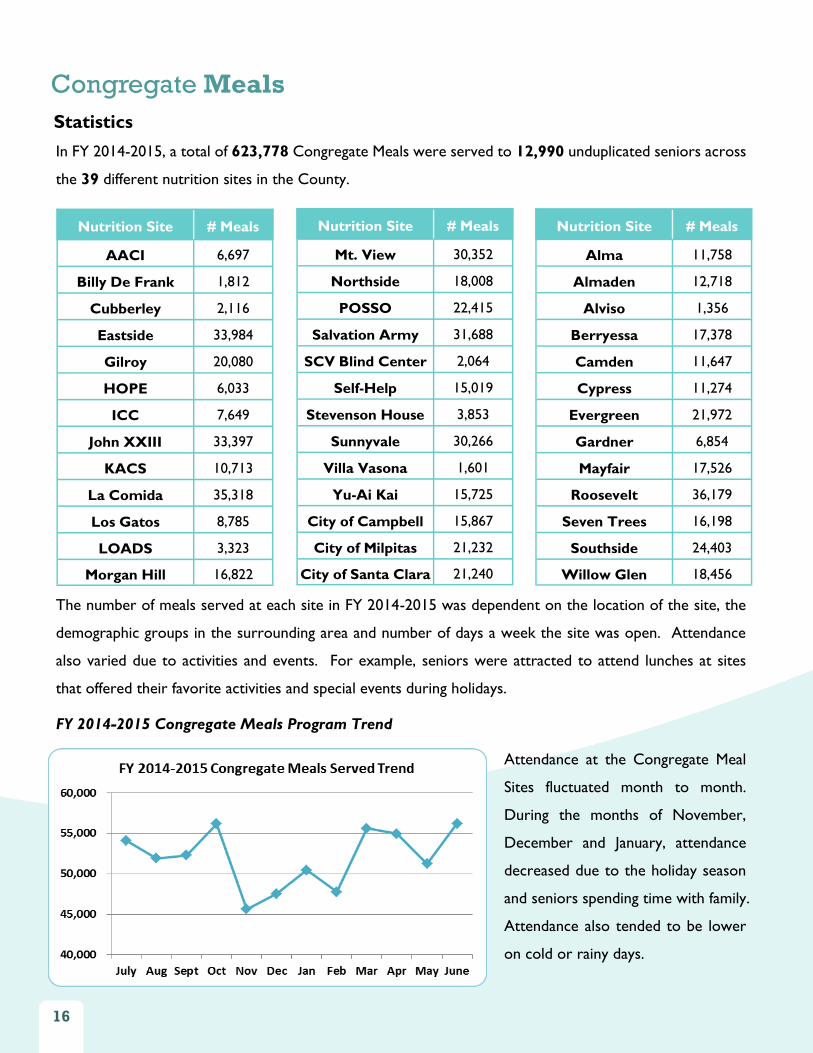
In FY 2014-2015, a total of 623,778 Congregate Meals were served to 12,990 unduplicated seniors across
the 39 different nutrition sites in the County.
The number of meals served at each site in FY 2014-2015 was dependent on the location of the site, the
demographic groups in the surrounding area and number of days a week the site was open. Attendance
also varied due to activities and events. For example, seniors were attracted to attend lunches at sites
that offered their favorite activities and special events during holidays.
FY 2014-2015 Congregate Meals Program Trend
Attendance at the Congregate Meal
Sites fluctuated month to month.
During the months of November,
December and January, attendance
decreased due to the holiday season
and seniors spending time with family.
Attendance also tended to be lower
on cold or rainy days.
Nutrition Site # Meals
AACI 6,697
Billy De Frank 1,812
Cubberley 2,116
Eastside 33,984
Gilroy 20,080
HOPE 6,033
ICC 7,649
John XXIII 33,397
KACS 10,713
La Comida 35,318
Los Gatos 8,785
LOADS 3,323
Morgan Hill 16,822
Nutrition Site # Meals
Mt. View 30,352
Northside 18,008
POSSO 22,415
Salvation Army 31,688
SCV Blind Center 2,064
Self-Help 15,019
Stevenson House 3,853
Sunnyvale 30,266
Villa Vasona 1,601
Yu-Ai Kai 15,725
City of Campbell 15,867
City of Milpitas 21,232
City of Santa Clara 21,240
Nutrition Site # Meals
Alma 11,758
Almaden 12,718
Alviso 1,356
Berryessa 17,378
Camden 11,647
Cypress 11,274
Evergreen 21,972
Gardner 6,854
Mayfair 17,526
Roosevelt 36,179
Seven Trees 16,198
Southside 24,403
Willow Glen 18,456
Congregate Meals
Statistics

17
Five Year Congregate Meals Program Trend
There was an increase of 40,649
(6.97%) congregate meals served to
seniors in FY 2014-2015.
There was an increase of 1,424
(12.31%) unduplicated seniors
served in FY 2014- 2015.
Participant Demographics
The largest age group participating in the Congregate Meals Program is in the 70 – 79 age group with
5,097 participants (approximately 39.24%).
Age Range Count Percentage
00-59 147 1.13%
60-64 1,081 8.32%
65-69 2,042 15.72%
70-74 2,535 19.52%
75-79 2,562 19.72%
80-89 3,557 27.38%
90-99 1,001 7.71%
100+ 65 0.50%
Statistics and Demographics
Congregate Meals
18
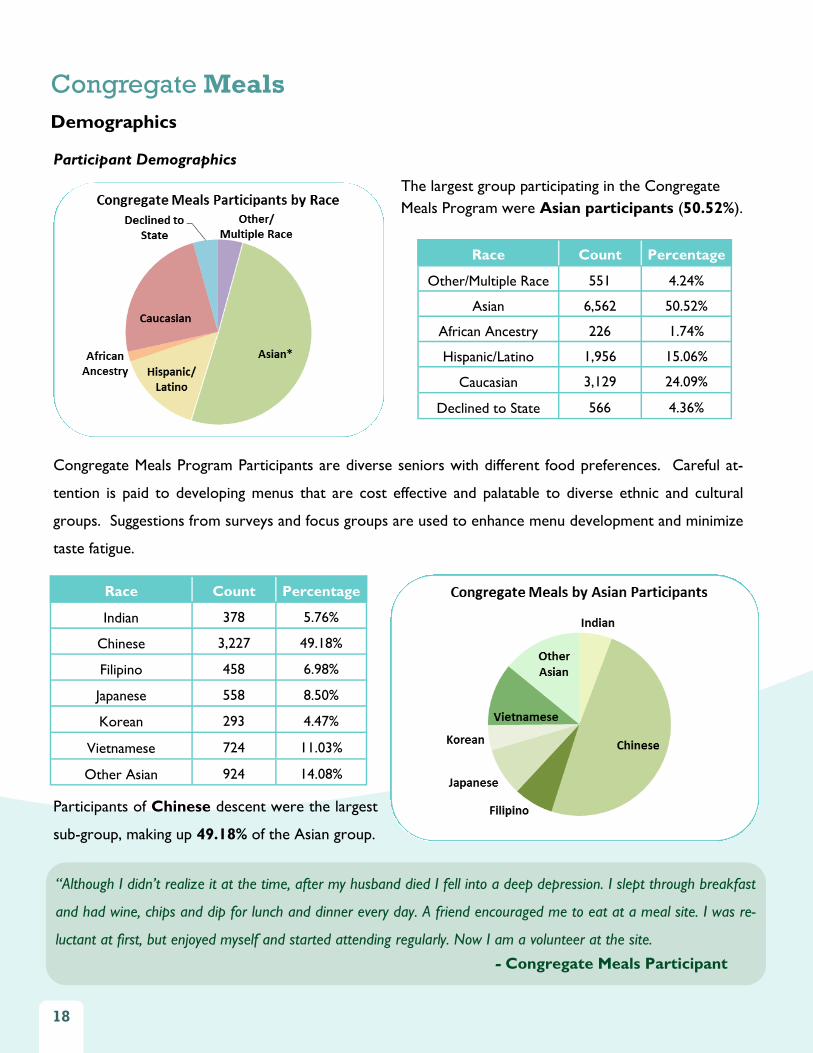
Participant Demographics
The largest group participating in the Congregate
Meals Program were Asian participants (50.52%).
Congregate Meals Program Participants are diverse seniors with different food preferences. Careful at-
tention is paid to developing menus that are cost effective and palatable to diverse ethnic and cultural
groups. Suggestions from surveys and focus groups are used to enhance menu development and minimize
taste fatigue.
Participants of Chinese descent were the largest
sub-group, making up 49.18% of the Asian group.
Race Count Percentage
Other/Multiple Race 551 4.24%
Asian 6,562 50.52%
African Ancestry 226 1.74%
Hispanic/Latino 1,956 15.06%
Caucasian 3,129 24.09%
Declined to State 566 4.36%
Race Count Percentage
Indian 378 5.76%
Chinese 3,227 49.18%
Filipino 458 6.98%
Japanese 558 8.50%
Korean 293 4.47%
Vietnamese 724 11.03%
Other Asian 924 14.08%
“Although I didn’t realize it at the time, after my husband died I fell into a deep depression. I slept through breakfast
and had wine, chips and dip for lunch and dinner every day. A friend encouraged me to eat at a meal site. I was re-
luctant at first, but enjoyed myself and started attending regularly. Now I am a volunteer at the site.
- Congregate Meals Participant
Congregate Meals
Demographics

19
Congregate Meals
Demographics
Participant Demographics
Of the 12,990 seniors participating in the
Congregate Meals Program in FY 2014-2015,
57.66% were female and 39.11% were male.
52.56% of Congregate Meals Participants live
at or below the Federal Poverty Level
(FPL). For 2014, the FPL for a household
of one (1) person was $11,670 annually
or $972.50 monthly.
Approximately 32.08% of Congregate Meals
Participants live alone. Participants attending
meals at the nutrition sites can socialize with
one another, partake in various activities and
access other services.
“Living alone but nurtured by Mt. View gen-
erosity. I can survive with dignity. And many
others are doing the same.”
- Mt. View Participant
“We are both very pleased with the lunch
program, a good reason to get moving.
Thank you all for it.”
- Sunnyvale Participant

20
Meals on Wheels
Program Overview
Meals on Wheels (MOW) is a valued service that
assists homebound older adults in maintaining prop-
er nutrition, health and independence. The Santa
Clara County MOW program provides two nutri-
tious meals daily, meeting 2/3 of Recommended Di-
etary Allowance. Seniors receive weekly deliveries
of frozen meals, entrée salads and sandwiches or
wraps (14 meals) and assorted grocery items such
as milk, bread, fresh fruit, juice, crackers, cheese,
peanut butter, etc.
Referrals and Assessments
Prospective participants are referred from various sources
including doctors, social workers and community-based
organizations. SNP’s partner, Sourcewise, deploys Nutrition
Coordinators to conduct initial assessments at potential participants’ homes. If applicants are deemed eligi-
ble for the program, they are placed on a list for meal delivery. Sourcewise’s Nutrition Coordinators also
conduct annual home-visit reassessments for every MOW participant.
Meals
SNP contracts with Bateman Community Living to provide low-fat, low-sodium, home-style meals. The
meals are chef-inspired recipes developed and perfected in Bateman’s Sacramento USDA culinary center.
The meals are prepared using lean meats, fresh or frozen vegetables and quality spices without added pre-
servatives. Once cooked, meals are pre-portioned in individual containers, sealed and labeled with high tech
cooling systems and sealing machines to ensure freshness is not compromised. Meals are kept in the freezer
until they are transported to the Santa Clara kitchen one week prior to delivery to the seniors’ homes. The
meals can be kept frozen up to six months from the date of preparation.
“Meeting and satisfying clients' needs, while at the same time complying with regulations can be a
challenge, but it’s one that we face with zeal to maximize customer satisfaction.”
- Bateman Community Living
Sourcewise Nutrition Coordinators conducted
1,615 home visit assessments.
21
Program Overview
Meals on Wheels
Taste Test
To ensure the quality of meals served, SNP and Sourcewise Nutrition Coordinators conduct taste tests
throughout the fiscal year. Feedback is offered to improve the quality of the meals. The program also uses
survey results to identify participants’ likes and dislikes and adds new food items to the menus regularly.
Unacceptable or dissatisfying items are removed from the menu.
Meal Deliveries
Meals are delivered to participants once a week by Bateman Community Living
drivers. Drivers deliver the MOW meals via refrigerated vans to participants’
homes in locations all over Santa Clara County— from Palo Alto to Gilroy.
Seniors look forward to their scheduled delivery. Without the courtesy and
professionalism of the drivers, the MOW Program would not be successful.
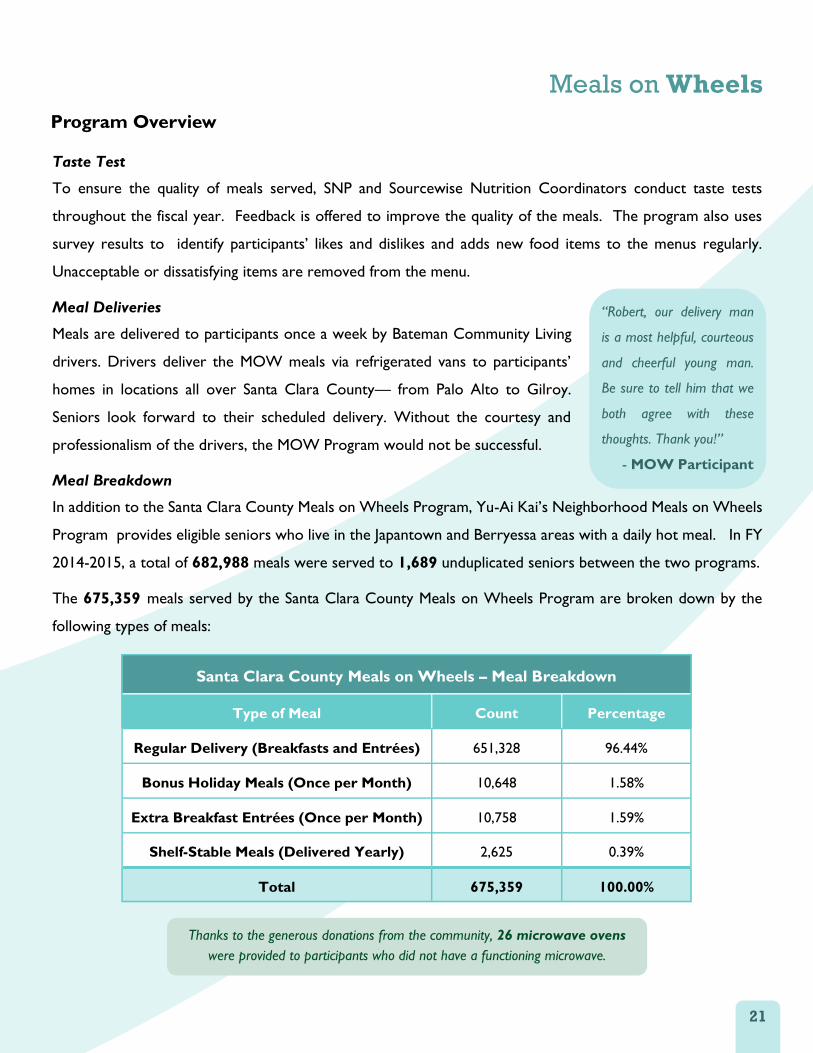
Meal Breakdown
In addition to the Santa Clara County Meals on Wheels Program, Yu-Ai Kai’s Neighborhood Meals on Wheels
Program provides eligible seniors who live in the Japantown and Berryessa areas with a daily hot meal. In FY
2014-2015, a total of 682,988 meals were served to 1,689 unduplicated seniors between the two programs.
The 675,359 meals served by the Santa Clara County Meals on Wheels Program are broken down by the
following types of meals:
“Robert, our delivery man
is a most helpful, courteous
and cheerful young man.
Be sure to tell him that we
both agree with these
thoughts. Thank you!”
- MOW Participant
Santa Clara County Meals on Wheels – Meal Breakdown
Type of Meal Count Percentage
Regular Delivery (Breakfasts and Entrées) 651,328 96.44%
Bonus Holiday Meals (Once per Month) 10,648 1.58%
Extra Breakfast Entrées (Once per Month) 10,758 1.59%
Shelf-Stable Meals (Delivered Yearly) 2,625 0.39%
Total 675,359 100.00%
Thanks to the generous donations from the community, 26 microwave ovens
were provided to participants who did not have a functioning microwave.

22
Meals on Wheels
Participant Profile
Wendy Wensch, 66 years old, was born in the countryside of Rhode Island.
Despite being born blind, partially deaf and being diagnosed early in life with
cerebral palsy, Wendy’s parents taught her to be independent. Several
years ago, Wendy was a victim of a violent crime which caused injury to her
spinal cord, confining her to a wheel chair. With limited income and the
insistent desire to reside alone in the community, her doctor recommended
Meals on Wheels.
Wendy started receiving weekly deliveries in November 2012. She is able
to heat the meals herself and add her own touch, such as introducing garlic
powder and a special dressing to her salad. She looks forward to her weekly delivery and appreciates the
drivers who treat her and her home with respect.
Wendy was recently diagnosed with cancerous tumors in her legs and is now undergoing chemotherapy.
Never deterred, Wendy continues to have a positive attitude and live life to the fullest. As a self-taught
musician, she plays harmonica for groups, friends and her own pleasure. Wendy also spends her time lis-
tening to her boom box, playing solitaire with Braille cards and chats with friends on the phone or at the
coffee shop.
Wendy savors her independence. She stated she is grateful to the Meals on Wheels Program which allows
her to reside in her own place and on her own terms.
Benefits of MOW
Improved nutrition through access to food.
Healthy meals - lower in fat, sodium and sugar.
Affordable meals - suggested contribution $1.80/day.
Flexible meal planning - seniors eat when they want.
Weekly visits by MOW drivers.
Annual home visits by MOW Nutrition Coordinators.
Nutrition education - quarterly MOW Newsletters.
23
Meals on Wheels
Statistics and Demographics
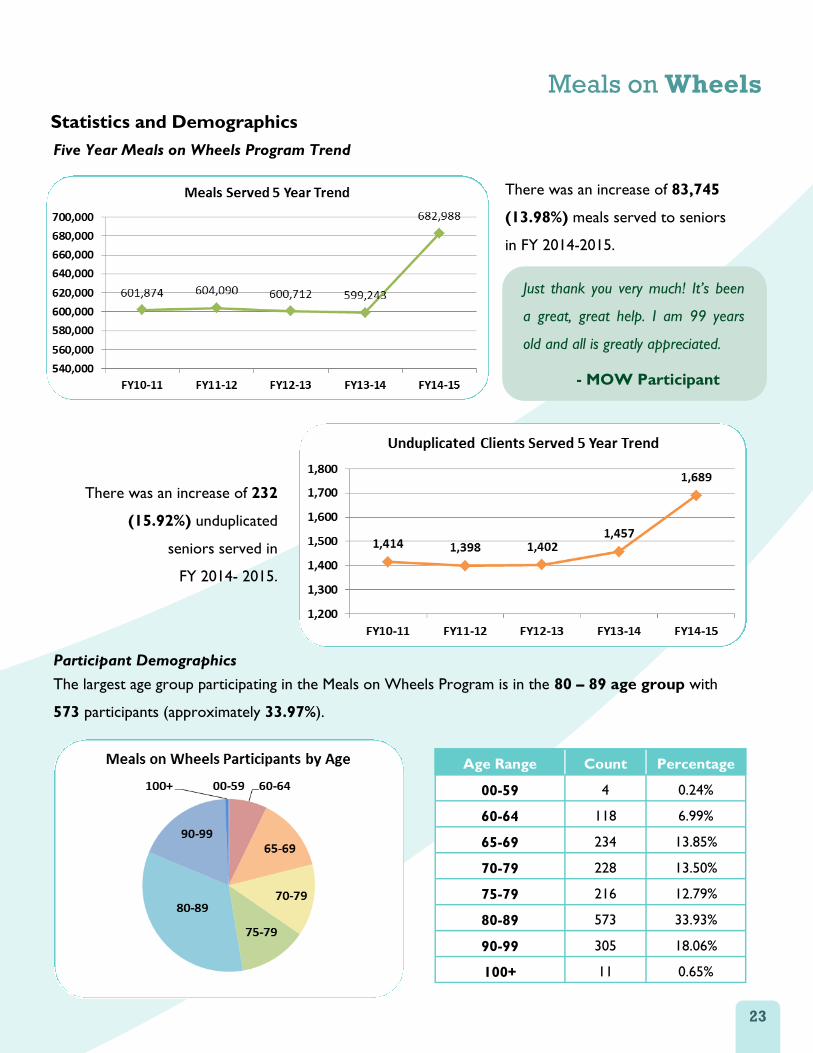
Five Year Meals on Wheels Program Trend
There was an increase of 83,745
(13.98%) meals served to seniors
in FY 2014-2015.
There was an increase of 232
(15.92%) unduplicated
seniors served in
FY 2014- 2015.
Participant Demographics
The largest age group participating in the Meals on Wheels Program is in the 80 – 89 age group with
573 participants (approximately 33.97%).
Age Range Count Percentage
00-59 4 0.24%
60-64 118 6.99%
65-69 234 13.85%
70-79 228 13.50%
75-79 216 12.79%
80-89 573 33.93%
90-99 305 18.06%
100+ 11 0.65%
Just thank you very much! It’s been
a great, great help. I am 99 years
old and all is greatly appreciated.
- MOW Participant

24
Meals on Wheels
Demographics
Participant Demographics
The Meals on Wheels Program provides meals to a diverse group of homebound seniors.
Of the 1,689 seniors participating in the
Meals on Wheels Program in FY 2014-
2015, 63.23% were female and 36.77%
were male.
Almost 70% of Meals on Wheels Partici-
pants live at or below the Federal Pov-
erty Level (FPL). For 2014, the FPL for a
household of one (1) person was
$11,670 annually or $972.50 monthly.
Race Count Percentage
Other/Multiple Race 56 3.32%
Asian 231 13.68%
African Ancestry 111 6.57%
Hispanic/Latino 223 13.20%
Caucasian 1,043 61.75%
Declined to State 25 1.48%

25
Meals on Wheels
Demographics and Next Steps
Participant Demographics
Almost 50% of Meals on Wheels Participants
live alone. Seniors who live alone are more
prone to malnutrition as they may not enjoy
cooking or eating alone, make poor food
choices or may not know how to cook.
Year-in-Review and Next Steps
The Meals on Wheels Program successfully provided nutritious meals to homebound senior residents of
the County of Santa Clara in FY 2014-2015. Overall, the Meals on Wheels Program saw a significant in-
crease in both meals and unduplicated participants served during the year; however, all eligible seniors who
requested and qualified for services through the Meals on Wheels Program were served this year. The
Senior Nutrition Program will continue to work with our partners to ensure continued Meals on Wheels
Program success in FY 2015-2016.
“Just a quick note to say a sincere thank you for the Meals on Wheels Program. I am a 63 year old, wheel-
chair bound, lower leg amputee who lives alone in Morgan Hill. I was having tremendous difficulty shopping
for groceries & cooking on a regular basis. I am also a diabetic & was having trouble controlling my numbers.
Since I have been receiving Meals on Wheels (about 3 weeks), I have delicious & nutritious food every day &
my numbers have improved tremendously. Your delivery driver is very helpful & kind also. I am very grateful
for your service & wanted to let you know how much help you have been to me.”
- MOW Participant
“I don’t get out much anymore. My son is my
only living relative and he resides in Japan. I
am lucky to receive Meals on Wheels.”
- 91-year old Participant

26
Program Costs
Expenditure Funding Sources — Transportation
County General Fund
Funding for the Mobility Management Program comes exclusively from the County General Fund. In FY 2014-
2015, $257,189.00 was used to provide mobility options to seniors with transportation barriers that allowed
them gain access to nutrition sites throughout the County. Mobility options for seniors include bus passes, gas
cards, volunteer drivers and door-to-door transportation services.
Measure A Funds
On April 15, 2014, the Board of Supervisors approved the allocation of Measure A tax revenue to fund a vari-
ety of social services. In FY 2014-2015, the Measure A Senior Transportation Program was implemented to
provide even more mobility options including safe-walking groups, adult bicycles/tricycles and older driver
safety classes to a greater number of seniors in the County. Participants were also able to utilize these ser-
vices to reach other locations such as grocery stores or doctor’s offices in addition to the nutrition sites. Of
the $750,000.00 allocated to the program in FY 2014-2015, $555,296.45 was expended. The remaining bal-
ance was rolled-over for use in FY 2015-2016.
Senior Nutrition Program Expenditures
In FY 2014-2015, the Senior Nutrition Program expended $8,494,776.33.
Expenditure Amount Percentage
Mobility
Management $257,189.00 3.03%
Measure A Senior
Transportation $555,296.45 6.54%
Congregate
Meals $4,301,442.21 50.64%
Meals on Wheels $2,116,134.22 24.91%
Administrative* $1,264,714.45 14.89%
Total $8,494,776.33 100.00%
Of the $8,494,766.33 expended by the Senior Nutrition Program in FY 2014-2015, $812,485.45 went
towards transportation services through the Mobility Management Program and Measure A Senior Transpor-
tation Program and $7,682,290.88 went towards nutrition services through the Congregate Meals Program
and Meals on Wheels Program.
*Administrative Expenditures include staff salaries, small kitchen items, office
supplies, etc. and are split 80% Congregate / 20% Home-Delivered

27
Program Costs
Federal and State Funding
Funding from the federal and state levels come in the form of the Older Americans Act of 1965 (OAA)
Title III Funds and Nutrition Services Incentive Program (NSIP) Funds. Each year, the California Depart-
ment of Aging allocates OAA and NSIP funds across the 33 Area Agencies on Aging (AAA) within Califor-
nia. The AAAs then disburse the funds within their local jurisdiction toward a variety of senior services
including senior work programs, supportive services, nutrition services, etc. Sourcewise is the designated
AAA for the County of Santa Clara.
Participant Contributions
The Senior Nutrition Program collects suggested contributions from Congregate Meals Program and Meals
on Wheels Program participants. These participant contributions are cycled back into the programs to
cover the cost of the meals and other program expenses.
County of Santa Clara General Fund
For some counties in California, OAA and NSIP Funds are the only source of funding for that county’s
Senior Nutrition Program. In the County of Santa Clara, in addition to federal and state funding, County
General Fund is appropriated to the Senior Nutrition Program to allow a greater number of participants
the ability to attend lunches at nutrition sites or receive Meals on Wheels.
Meals on Wheels Trust Fund (Donations)
Our generous community members contributed $148,304 through online and mailing list donations for the
Meals on Wheels Program. These donations are placed in a trust fund. Due to tremendous growth of
Meals on Wheels in FY 2014-2015, the Senior Nutrition Program had to transfer funds out of the Trust
Fund and into the budget to ensure that there was enough funding to serve all participants.
Expenditure Funding Sources — Nutrition
Funding Source Amount Percentage
NSIP* $979,488.00 12.75%
Title III (Federal)* $1,745,897.00 22.73%
Title III (State)* $308,689.00 4.02%
Contributions $840,961.84 10.95%
County General Fund $3,487,255.04 45.39%
MOW Trust Fund $320,000.00 4.17%
Total $7,682,290.88 100%
*These funds are distributed by Sourcewise
28
Program Costs
Funding Overview
Portions of the Congregate Meals Program and Meals on Wheels Program are funded through Title III and
NSIP Funding and are distributed by the County’s AAA, Sourcewise. In addition, Sourcewise distributes One
-Time-Only (OTO) Special Funds from the State if there are unexpended OAA Funds available. For both
programs, Title III Funding was fixed for the year. For NSIP Funding and OTO Special Funds (starting in Oc-
tober), Sourcewise reimbursed SNP up to a limited number of allocated meals. The Senior Nutrition Pro-
gram exceeded the allotment of meals for both Congregate Meals and Meals on Wheels in FY 2014-2015.
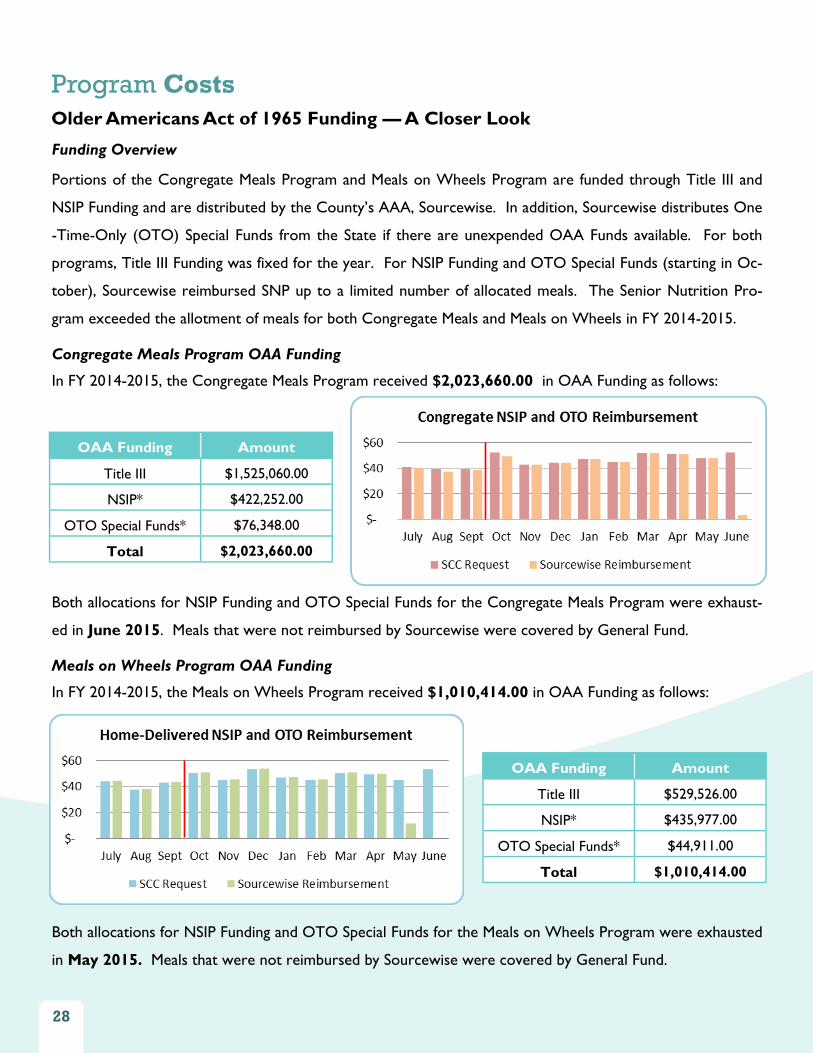
Congregate Meals Program OAA Funding
In FY 2014-2015, the Congregate Meals Program received $2,023,660.00 in OAA Funding as follows:
Both allocations for NSIP Funding and OTO Special Funds for the Congregate Meals Program were exhaust-
ed in June 2015. Meals that were not reimbursed by Sourcewise were covered by General Fund.
Meals on Wheels Program OAA Funding
In FY 2014-2015, the Meals on Wheels Program received $1,010,414.00 in OAA Funding as follows:
Both allocations for NSIP Funding and OTO Special Funds for the Meals on Wheels Program were exhausted
in May 2015. Meals that were not reimbursed by Sourcewise were covered by General Fund.
Older Americans Act of 1965 Funding — A Closer Look
OAA Funding Amount
Title III $1,525,060.00
NSIP* $422,252.00
OTO Special Funds* $76,348.00
Total $2,023,660.00
OAA Funding Amount
Title III $529,526.00
NSIP* $435,977.00
OTO Special Funds* $44,911.00
Total $1,010,414.00

29
Mobility Management
Program Overview
The Mobility Management Program is a coordinated
effort with Outreach & Escort, Inc. (OUTREACH) to
provide mobility options to seniors so they can attend
daily, healthy lunches at nutrition sites. Mobility man-
agement provides coordinated, individualized trans-
portation services to meet the needs of the seniors.
The service expands the range of mobility for seniors
and increases attendance to nutrition sites. In June,
funds for the Mobility Management Program were ex-
hausted; therefore, clients who requested services
were shifted to the Measure A Program.
One-Way Rides
In FY 2014-2015, a total of 122,828
one-way rides were provided to
seniors with transportation barriers.
Mobility Option One-Way
Trips Percentage
ADA Rides 13,388 10.90%
Monthly Bus Pass Trips* 60,928 49.60%
Prepaid Gas Card Trips* 44,792 36.47%
Van & Volunteer Driver Trips* 3,720 3.03%
Urgent Need Taxi Services Trips 0 0.00%
Mileage Reimbursement Trips 0 0.00%
Total 122,828 100.00%
There was a 10.9% increase in total number of
one-way rides from last year.
“I really feel that the gas card has been a special
blessing in my life in taking care of myself and being
able to get to the senior center for the special meals
and other special things they have.”
- Mobility Management Participant
Image Courtesy of OUTREACH
*Estimated one-way rides are based on
average usage per mobility option as re-
ported by OUTREACH:
- ADA Rides: Actual Usage
- Bus Passes: 17 one-way rides/month
- Gas Cards: 22 one-way rides/month
- Van & Volunteer Svcs.: 8 one-way rides/
month
30
Mobility Management
Statistics and Program Cost
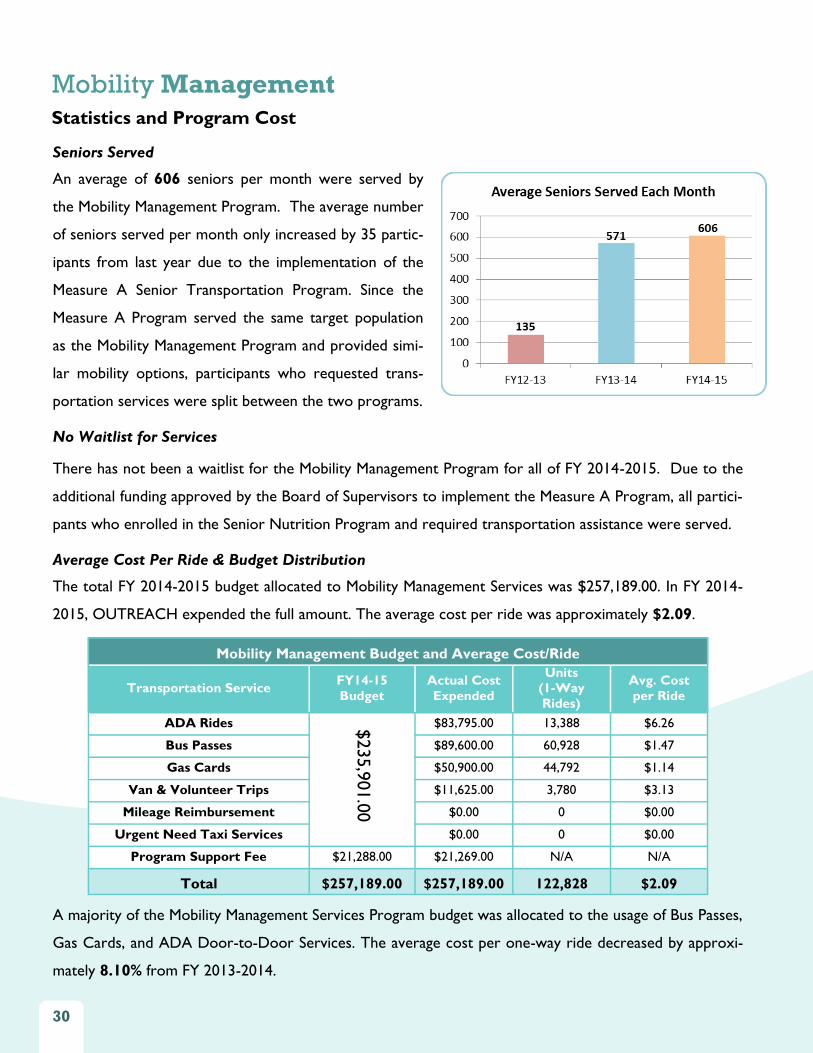
Seniors Served
An average of 606 seniors per month were served by
the Mobility Management Program. The average number
of seniors served per month only increased by 35 partic-
ipants from last year due to the implementation of the
Measure A Senior Transportation Program. Since the
Measure A Program served the same target population
as the Mobility Management Program and provided simi-
lar mobility options, participants who requested trans-
portation services were split between the two programs.
No Waitlist for Services
There has not been a waitlist for the Mobility Management Program for all of FY 2014-2015. Due to the
additional funding approved by the Board of Supervisors to implement the Measure A Program, all partici-
pants who enrolled in the Senior Nutrition Program and required transportation assistance were served.
Average Cost Per Ride & Budget Distribution
The total FY 2014-2015 budget allocated to Mobility Management Services was $257,189.00. In FY 2014-
2015, OUTREACH expended the full amount. The average cost per ride was approximately $2.09.
A majority of the Mobility Management Services Program budget was allocated to the usage of Bus Passes,
Gas Cards, and ADA Door-to-Door Services. The average cost per one-way ride decreased by approxi-
mately 8.10% from FY 2013-2014.
Mobility Management Budget and Average Cost/Ride
Transportation Service FY14-15
Budget Actual Cost
Expended
Units (1-Way
Rides)
Avg. Cost
per Ride
ADA Rides $235,9
01.0
0
$83,795.00 13,388 $6.26
Bus Passes $89,600.00 60,928 $1.47
Gas Cards $50,900.00 44,792 $1.14
Van & Volunteer Trips $11,625.00 3,780 $3.13
Mileage Reimbursement $0.00 0 $0.00
Urgent Need Taxi Services $0.00 0 $0.00
Program Support Fee $21,288.00 $21,269.00 N/A N/A
Total $257,189.00 $257,189.00 122,828 $2.09

31
Program Overview
In FY 2014-2015, the Board of Supervisors approved the Measure A – Senior Transportation Program
(Measure A Program) between the County and Outreach & Escort, Inc. (OUTREACH) to provide mobility
services to seniors with transportation barriers. These mobility services allow seniors access to nutrition
sites as well as non-nutrition destinations such as grocery stores and doctors’ appointments. Mobility options
include bus passes, gas cards, volunteer driver transportation, mileage reimbursement, door-to-door trans-
portation, ADA rides, safe walking groups, older adult bicycles/tricycles and older driver safety classes. The
program began on October 1, 2014 and runs through June 30, 2017 with a budget of $750,000.00 per year.
Objectives
The primary objectives of the program were to help alleviate the demand and waitlist for transportation to
senior nutrition sites and to serve at least 1,500 unduplicated seniors in FY 2014-2015. The Measure A Pro-
gram met its goals for FY 2014-2015. The program prevented a waitlist from accruing and served 3,231
unduplicated clients — exceeding the targeted number by 121%.
Seniors Served
In FY 2014-2015, there was a total of 195,918 one-way rides provided to an average of 1,385 seniors per
month through the Measure A Program.
Measure A Senior Transportation
Mobility Option Clients/
Month
Bus Passes (Nutrition) 901
Gas Cards (Nutrition) 69
ADA (Nutrition) 22
Bus Passes (Non-Nutrition) 227
Door-to-Door (Non-Nutrition) 148
ADA (Non-Nutrition) 18
Total 1,385
“I’m almost embarrassed how important coming down here and having lunch is. It’s something I kind of center
my day on. With the gas card it’s just easier for me and I feel less imposing on other people, I don’t like to
impose. The lunch program has made me feel better about myself”
- Camden Participant

32
Program Cost and Next Steps
Average Cost Per Ride & Budget Distribution
The total FY 2014-2015 budget allocated to the Measure A Program was $750,000.00. OUTREACH expend-
ed $555,296.45 for the year; the remaining $194,703.55 will be rolled-over to FY 2015-2016. The average
cost per ride was approximately $2.83.
Year-in-Review and Next Steps
The Measure A – Senior Transportation Program has successfully accomplished its goals in FY 2014-2015.
With Measure A funds allocated to provide more transportation options for senior residents of the County,
a waitlist was not needed for the duration of the whole fiscal year. Furthermore, 74.03% of the program’s
budget was expended to serve 3,231 unduplicated clients – 121% more than its targeted goal of 1,500
unduplicated clients. The combined number of one-way rides between the two transportation program to-
taled 318,746 in FY 2014-2015.
Measure A Senior Transportation
Measure A – Senior Transportation Budget and Average Cost/Ride
Transportation Service FY14-15
Budget Actual Cost
Expended
Units (1-Way
Rides)
Avg. Cost
per Ride
Bus Passes (Nutrition) $538,7
00.0
0
$202,775.00 137,887 $1.47
Gas Cards (Nutrition) $15,500.00 13,640 $1.14
ADA Rides (Nutrition) $19,018.75 3,043 $6.25
Bus Passes (Non-Nutrition) $51,100.00 34,748 $1.47
Door-to-Door (Non-Nutrition) $109,550.00 4,382 $25.00
ADA Rides (Non-Nutrition) $13,862.50 2,218 $6.25
Direct Personnel Costs $158,800.00 $111,970.16 N/A N/A
Administrative & Overhead $52,500.00 $31,520.04 N/A N/A
Total $750,000.00 $555,296.45 195,918 $2.83
“You can’t help getting older, but you don’t have to get old. - George Burns

33
Senior Nutrition Program in FY 2015-2016
Senior Nutrition Going Forward
Friends from Meals on Wheels Program
The Senior Nutrition Program recently released a Request for Proposal (RFP) for the Friends from Meals on
Wheels Program. The goal of the program is to increase socialization for isolated and home-bound seniors
and is set to be begin in FY 2015-2016.
Studies have shown that socialization decreases stress, increases self-esteem and reduces mental health issues
including depression. Increased socialization and the associated benefits mitigate the development of chronic
health issues and as a result, allows seniors to maintain their independence.
The Senior Nutrition Program looks forward to implementing this program in FY 2015-2016 to ensure that
the most frail and elderly older adults in the County are receiving services that improve their physical and
mental health, happiness and quality of life. The anticipated start date of the Friends from Meals on Wheels
Program is April 1, 2016.
Harvey Rose Management Audit
The Harvey Rose Management Audit Report was released in August 2014. The purpose of the audit was to
examine the operation, management practices and finances of the program to identify opportunities to in-
crease its efficiency, effectiveness and economy. Six (6) recommendations were made:
Seven Trees, Photo by Elizabeth
1. Increase MOW participant socialization and investigate
funding avenues.
2. Develop policy to expend trust fund.
3. Enhance and standardize the quality and services at the
congregate meal sites.
4. Strengthen transportation to the sites.
5. Examine options for serving meals in underserved areas.
6. Maximize participants receiving CalFresh.
Many of these recommendations have been or are in the pro-
cess of being implemented. SNP will continue to work on
them in FY 2015-2016 and will provide another report back to
the Finance and Government Operations Committee later this
year.