Embed Size (px)
Citation preview

S O U T H F L O R I D A W A T E R M A N A G E M E N T D I S T R I C TS O U T H F L O R I D A W A T E R M A N A G E M E N T D I S T R I C T
Restoring Sheetflow in a Ridge‐Slough‐Canal‐and‐Levee landscape ‐ A Synthesis of Tracers, Traps and Transport
Colin J. Saunders*Senior ScientistEverglades System Assessment
* With contributing authors
GEERApril 21‐24, 2015

S O U T H F L O R I D A W A T E R M A N A G E M E N T D I S T R I C T
* Contributing Authors:• Colin J. Saunders – Senior Scientist, Everglades Systems Assessment, SFWMD
• Erik Tate‐Boldt –Scientist, Everglades Systems Assessment, SFWMD
• Carlos Coronado‐Molina – Lead Scientist, Everglades Systems Assessment, SFWMD
• Sue Newman – Section Leader, Everglades Systems Assessment, SFWMD
• Fred Sklar – Section Administrator, Everglades Systems Assessment, SFWMD
• Christa Zweig – Scientist, Everglades Systems Assessment, SFWMD
• Eric Cline ‐‐ Scientist, Everglades Systems Assessment, SFWMD
• Chris Hansen – Florida International University
• Rudolf Jaffé – Floirda International University
• Fabiola Santamaria – Scheda Ecological
• Jud Harvey – USGS
• Laurel Larsen – Univ. California at Berkeley
• David T. Ho – University of Hawaii

S O U T H F L O R I D A W A T E R M A N A G E M E N T D I S T R I C T
Flow – A Critical Piece of the Restoration PuzzleLandscape Patterned by Flow Degraded Landscape with no Flow
S
Simulated Landscapes
With flow Without flow
Larsen et al., 2011. Recent and Historic Drivers of Landscape Change in the Everglades Ridge, Slough, and Tree Island Mosaic Critical Reviews in Environmental Science and Technology, 41: 6, 344 — 381

S O U T H F L O R I D A W A T E R M A N A G E M E N T D I S T R I C T
Sheetflow Hypothesis Cluster
sloughridge
Deep water sloughs exhibit higher velocities, more sediment transportHigh‐flow redistributes sediment from sloughs into ridges

S O U T H F L O R I D A W A T E R M A N A G E M E N T D I S T R I C T
Canal Backfill Hypothesis ClusterIs canal backfilling needed to maintain sediment transport?Does backfilling prevent downstream nutrient loading
marsh sediment
canal sediment(Hi‐P)
S O U T H F L O R I D A W A T E R M A N A G E M E N T D I S T R I C T
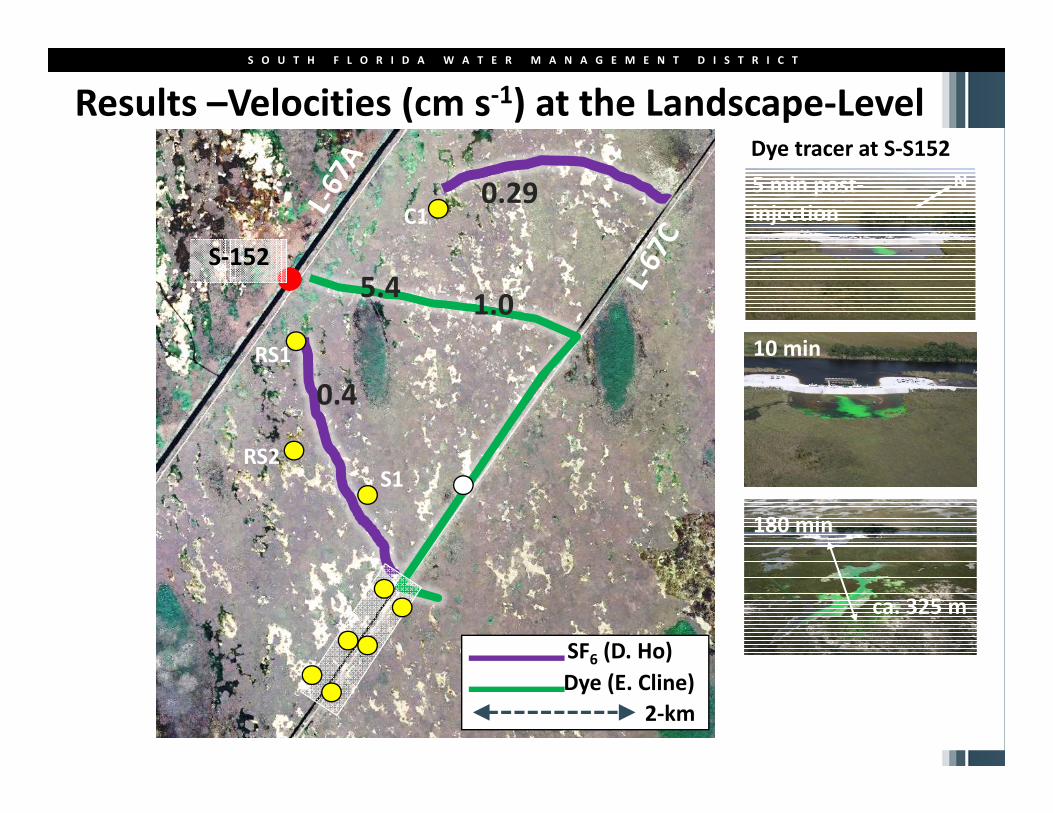
Results –Velocities (cm s‐1) at the Landscape‐Level
5.4
Dye (E. Cline)SF6 (D. Ho)
S‐152
2‐km
0.4
0.29
1.0
180 min
5 min post‐injection
N
10 min
Dye tracer at S‐S152
ca. 325 m
RS1
RS2
C1
S1

S O U T H F L O R I D A W A T E R M A N A G E M E N T D I S T R I C T
Results –Velocities (cm s‐1) at the Landscape‐Level
S152
RS1Z5‐1
NE2.9 cm s‐1
3.04.3
S152Gates Open
Time 06:00 08:00 10:00 12:00 14:00 16:00 18:00
Turbidity (NTU)
0
50
100
150
200
250
300
350Z5‐1NE‐S152RS1RS2

S O U T H F L O R I D A W A T E R M A N A G E M E N T D I S T R I C T
2 cm s‐1
S152 discharge
(cfs)
RS1 Slough Velocity vs S‐152 dischargeNov 2014‐Jan2015
200
250
Data from Jud Harvey, Jay Choi and Mark Dickman, USGS
RS1 Slough Velocity

S O U T H F L O R I D A W A T E R M A N A G E M E N T D I S T R I C T
• Transport – TSS, Velocity ‐ J. Harvey, L. Larsen
• Sediment Entrainment ‐ L. Larsen, S. Newman
• Horizontal Traps ‐ C. Saunders, C. Coronado‐Molina
• Vertical Traps ‐ C. Coronado‐Molina
• Synthetic Tracer ‐ E. Tate‐Boldt
• Organic Biomarkers ‐ R. Jaffé
• Chemistry ‐ SFWMD, USGS
Monitoring Sediment Movement in the DPM

S O U T H F L O R I D A W A T E R M A N A G E M E N T D I S T R I C T
Flow Effects on Ridge‐and‐Slough Sediment Transport – Horizontal Traps
• Sediment traps– adapted from Phillips et al., 2000 Hydrol Procs.
– Mid‐water column, parallel to flow
– Deployed at spatial sites
– Nov‐Jan 2012, 2013, 2014
Data from C. Saunders, SFWMD
Distance from S152 (m)
0 500 1000 1500 2000
trans
port
(g/c
m2/
d)
0.000
0.005
0.010
0.015
0.020
0.025Oct2012-Jan2013Oct2013-Jan2014Oct2014-Feb2015
Load
per fron
tal area (g cm
‐2d‐
1 )
Distance from S‐152 (m)
BaselineFlow #1Flow #2

S O U T H F L O R I D A W A T E R M A N A G E M E N T D I S T R I C T
• Sediment traps (BACI sites)– C1, RS1, RS2
– ridge & slough
– 3‐wk Oct‐Jan, 6‐wk Feb‐April
– 2011, 2012, 2013, 2014
C1
0.000
0.004
0.008
0.012
0.016 ridgeslough
RS1
mas
s lo
adin
g pe
r fro
ntal
are
a (g
cm
-2 d
-1)
0.000
0.004
0.008
0.012
0.016
RS2
Date6/11 10/11 2/12 6/12 10/12 2/13 6/13 10/13 2/14 6/14 10/14 2/15 6/15
0.000
0.004
0.008
0.012
0.016
C1
RS1
RS2
ridgeslough
Date
Load
per fron
tal area (g cm
‐2d‐
1 )
velo
city
(cm
s-1
)
0
2
4
6
Date6/11 10/11 2/12 6/12 10/12 2/13 6/13 10/13 2/14 6/14 10/14 2/15 6/15
0
2
4
6
0
2
4
6
8Ridge (Flowtracker)
Slough (Flowtracker)Ridge (ADV)Slough (ADV)CET-max
Date
Velocity (cm
s‐1)
Ridge (Flowtracker)
Slough (Flowtracker)Ridge (ADV)Slough (ADV)CET-max Fire
Data from C. Saunders, SFWMD

S O U T H F L O R I D A W A T E R M A N A G E M E N T D I S T R I C T
S152
Tracer Drop
RS1u
RS1d
0.0000.002 0.004 0.006 0.008 0.010 0.012
Distance along boardwalk (m) Particles s‐1‐6 ‐4 ‐2 0 2 4 6
9
‐6 ‐4 ‐2 0 2 4 6Time
900
1000
1100
1200
1300
1400
RS1u RS1d– Physical properties matched to natural Everglades floc
– 25kg frozen blocks deployed at upstream locations
– recaptured using 11 Guass magnets
– UV‐fluorescent, different colors to track multiple cohorts
– Synoptic surveys & downstream capture
Tracer
Tracking Floc Movement –Synthetic Tracer
see E. Tate‐Boldt et al. GEER presentation

S O U T H F L O R I D A W A T E R M A N A G E M E N T D I S T R I C T
Active Management Study “Zweig Slough”
A imagery from Nov 4, 2014
mber 30, 2014r velocities (ADV)
Ridge: 2‐3 cm s‐1
Slough: 16 cm s‐1
f
Tracer drops
DST recovered(grams /magnet)

S O U T H F L O R I D A W A T E R M A N A G E M E N T D I S T R I C T
Natural Tracers: Organic Biomarkers in Floc
gh #
ge #
e P. Reiger et al. GEER poster
Pre‐Flow
HighFlow
Post‐Flow
Pre‐Flow
HighFlow
Post‐Flow
Data from R. Jaffé, FIU
Ridge Slough

S O U T H F L O R I D A W A T E R M A N A G E M E N T D I S T R I C T
Do deep water sloughs exhibit faster velocities, more transport? Is ediment preferentially redistributed from sloughs to ridges?
Achieved velocities high enough to erode sediments
Water did not follow the historic flowpath
Flow velocities increased with flow duration
Sediments transported preferentially in sloughs
Sediment from sloughs can get deposited on ridges
Active management might be required along with flow
Summary – 1. Flow Effects on Sediment Transport in the Ridge & Slough

S O U T H F L O R I D A W A T E R M A N A G E M E N T D I S T R I C T
ough Sediment Transport at RS1
Method Baseline(g m‐1 d‐1)
High Flow(g m‐1 d‐1)
TimeDomain
Type of Sediment
TSS x DV‐veloc
30‐90 860 Daily avg All sediments (45 um dia.)
SS x DST‐veloc
N.D. 86 Daily avg Synthetic tracer (100 um dia.)
SS x SF6‐veloc
18‐40 90 Daily avg All sediments
Traps (3wk)
1‐15 45 3‐Week avg Larger particles
Traps (3mo)
1 41 3‐Month avg Larger particles
Summary – 1. Transport Synthesis
mplications for building topography
Baseline ridge accumulation (max) = 300 g m‐2 yr‐1Slough transport = ~5,000 to 100,000 g m‐1 yr‐1Assuming
• 120 high flow days per year• 10% settles in the ridges, 75% decomposes• Bulk density 0.15 g cm‐3
Ridge accretion increases 1.2‐17 cm decade‐160‐800% increase vs average ridge accretion

S O U T H F L O R I D A W A T E R M A N A G E M E N T D I S T R I C T
Part 2. Is the Canal a Sediment k or Source? Role of Backfilling?tical sediment traps4”‐dia PVC (Len:inlet >5)Anchored to bottom, kept upright with floats5 canal sites, 3‐6 wkdeployments
st processingFine (<1‐mm) sediments collected in ImhofffunnelsDry wt to determine mass accumulation, density, chemistry (LOI, TCNP)Molecular biomarker analysis on frozen

S O U T H F L O R I D A W A T E R M A N A G E M E N T D I S T R I C T
elocities at the L67C Canal & Levee Gap –Nov‐Dec 2013
21
No Fill
Partial Fill
Complete Fill
Velocity (cm s‐1)5

S O U T H F L O R I D A W A T E R M A N A G E M E N T D I S T R I C T
CC2S
05
10152025
CB3
05
10152025
CB2
accu
mul
atio
n ra
te (g
m-2
d-1
)
05
10152025
CB1
05
10152025
CC1N
05
1015202530 High flowsCanal Sediment
Accumulation
a from oronado‐Molina
Control‐N
Control‐S
No Fill
PartialFill
CompleteFill

S O U T H F L O R I D A W A T E R M A N A G E M E N T D I S T R I C T
Canal sediment dynamics:Molecular Organic Biomarkers
h
e
High Flow Post‐FlowPre‐Flow
Canal Sediment Traps ‐ Paq

S O U T H F L O R I D A W A T E R M A N A G E M E N T D I S T R I C T
Sediment Phosphorus and Sources: Marsh vs Canal
L‐28*
hosphorus ntent highest in nal sediments
ggests canal cumulating a cal source of diment
anals a potential urce of P
canalmarsh
Data from L Larsen (UCB) C Coronado Molina & C Saunders (SFWMD)

S O U T H F L O R I D A W A T E R M A N A G E M E N T D I S T R I C T
Is backfilling of canals needed for ecological restoration?
No‐Fill – higher accumulation, but higher inflows
Partial & Complete Fill ‐ still recovering from construction
Flow affected all canal sites ‐mobilizing canal sediments?
Implications for nutrient dynamics in canal and downstream ….analyses are ongoing
ummary – 2. Effects of Flow & Backfilling on Canal Sediment Dynamics

S O U T H F L O R I D A W A T E R M A N A G E M E N T D I S T R I C T
cknowledgements...
FWMD, USACE, USGS, ENP, USFWS, FDEP, Univ. Hawaii, Florida International University, University of California at Berkeley, University of Florida, ...
ue Wilcox, Robert Shuford, Tamela Kinsey, Richard Walker, Kristin eitz, Michael Manna, Michelle Blaha, Ed Clark, Paul Linton, Shi Xue, Pamela Lehr, Darlene Marley, Pete Rawlik, Mark Shafer, Vince Sandoval, Megan Jacoby, Jeff Woods, Mark Dickman, Mark Zucker, Lori Miller, Andy Loschaivo, Steve Baisden, Pamela Tellis, Jed Redwine, Ernest Marks, Ingar Hansen, Deinna Nicholson, Paul Julian, Mike Ross, Pablo Ruiz, Jay Sah, Ann Hijuelos, Lori Wenkert, Mike Bush ....

S O U T H F L O R I D A W A T E R M A N A G E M E N T D I S T R I C T
ESTIONS?ical Model of Flow Reconnection eve Ecological Restoration in the Everglades
. Saunders, DPM Science Team Lead