Embed Size (px)
Citation preview

SENSE 2013 Findings for
College of Southern Idaho

2
Presentation Overview SENSE Overview
Student Respondent Profile
SENSE Benchmarks
Community College Students and Stories
Strategies to Promote Learning that Matters

SENSE Overview

4
What is Student Engagement?
…the amount of time and energy students invest in meaningful educational practices
…the institutional practices and student behaviors that are highly correlated with student learning and retention
5
The Survey of Entering Student Engagement (SENSE)
SENSE helps community and technical colleges understand the experience of entering students and engage these students in the earliest weeks of their college experience.

6
As a tool for improvement, SENSE helps us
• Understand students' critical early experiences
• Identify and learn from practices that engage entering
students
• Identify areas in which we can improve
Basic principles
• Grounded in research about what works to retain and
support entering students
• Reports data publicly
• Is committed to using data for improvement
SENSE: A Tool for Community Colleges
Student Respondent Profile at College of Southern Idaho

8
Excluded Respondents The following respondents were excluded from
reporting:• Respondent did not indicate enrollment status
• Respondent did not indicate whether he or she was an entering or returning student
• Respondent marked invalid response selections
• Respondent under the age of 18
• Respondent indicated previous survey submission
Oversample respondents were also excluded.

9
Student Respondent Profile: Enrollment Status
Less than Full-Time Full-Time0%
10%20%30%40%50%60%70%80%90%
22%
78%
26%
74%
College of Southern Idaho SENSE 2013 Cohort
Source: 2013 SENSE data

10
Student Respondent Profile: Age
18-24 25+0%
10%20%30%40%50%60%70%80%90%
100%87%
13%
82%
18%
College of Southern Idaho SENSE 2013 Cohort
Source: 2013 SENSE data

11
Student Respondent Profile:Sex
Male Female0%
10%
20%
30%
40%
50%
60%
43%
55%
43%
54%
College of Southern Idaho SENSE 2013 Cohort
Source: 2013 SENSE data

12
Student Respondent Profile: Race & Ethnicity
Source: 2013 SENSE data
4% 2% 3%
16% 18%
52%
3% 1% 1% 2%
25%
59%
SENSE 2013 Cohort College of Southern Idaho

13
Student Respondent Profile: First-Generation Status
62%
38%
First-Generation
Not First-Genera-tion
Source: 2013 SENSE data

14
Student Respondent Profile: Orientation
Source: 2013 SENSE data
4.8%
16.5%1.9%
39.0%
38.6%
I took part in an online orienta-tion prior to the beginning of classes
I attended an on-campus orien-tation prior to the beginning of classes
I enrolled in an orientation course as part of my course schedule during my first semes-ter/quarter at this college
I was not aware of a college orientation
I was unable to participate in orientation due to scheduling or other issues

15
Student Respondent Profile: Courses Dropped
Source: 2013 SENSE data
85.7%
11.0%
3.1% 0.3%
None
One
Two
Three
16
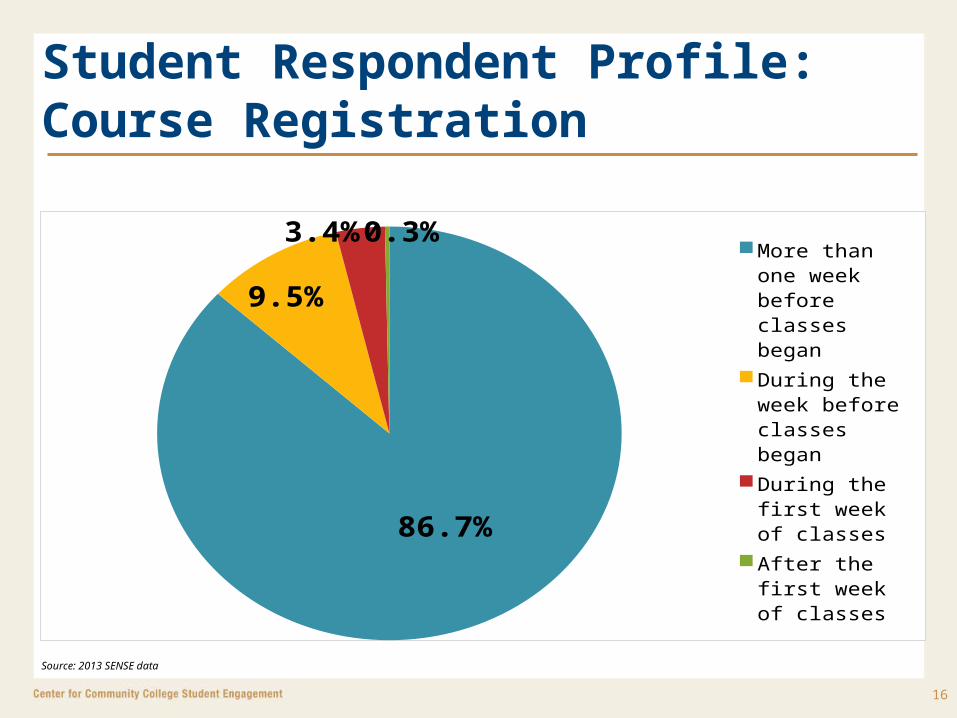
Student Respondent Profile: Course Registration
Source: 2013 SENSE data
86.7%
9.5%
3.4%0.3%
More than one week before classes began
During the week before classes began
During the first week of classes
After the first week of classes

17
Student Respondent Profile: Employment
Source: 2013 SENSE data
None 1-5 hours 6-10 hours 11-20 hours 21-30 hours More than 30 hours
34.1
0%
7.30
%
9.30
%
12.8
0%
15.8
0% 20.7
0%
37.0
0%
8.90
%
7.10
% 12.7
0%
15.1
0% 19.2
0%
37.5
%
8.8%
6.8%
12.1
%
15.0
% 19.8
%
CSI Large Colleges 2013 Cohort

18
Student Respondent Profile: Goals
Source: 2013 SENSE data
Transfer to a 4-year col-lege or university
Obtain an Associate degree
Complete a certificate
68.5
0%
86.8
0%
71.1
0%
77.8
0%
78.9
0%
58.2
0%
75.4
0%
79.6
0%
58.3
0%
CSI Large Colleges 2013 Cohort
SENSE Benchmarks
20
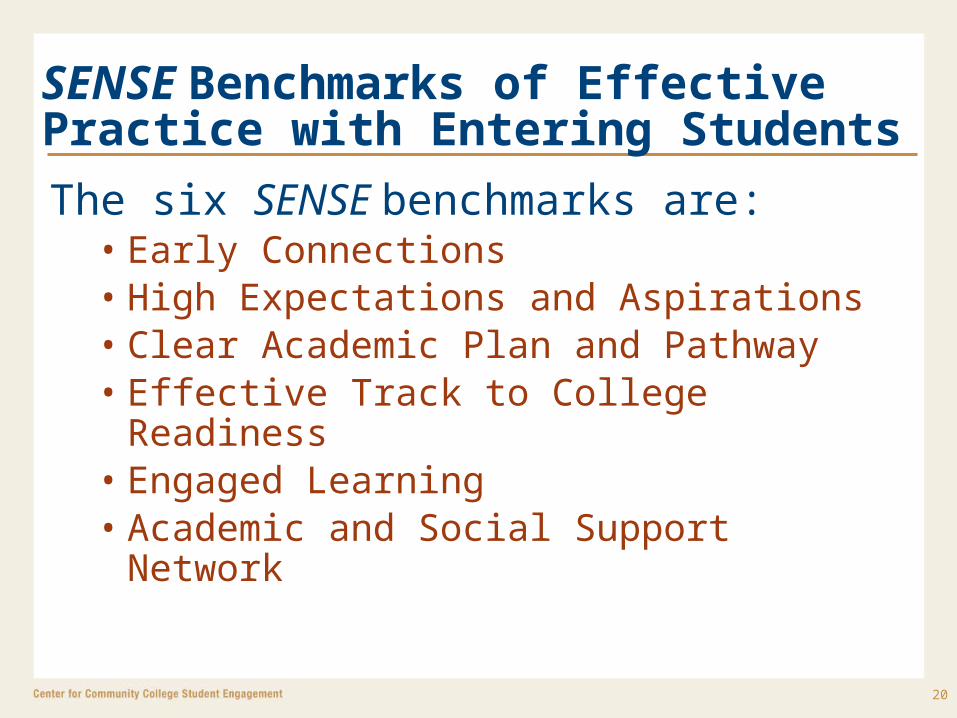
SENSE Benchmarks of Effective Practice with Entering StudentsThe six SENSE benchmarks are:
• Early Connections• High Expectations and Aspirations• Clear Academic Plan and Pathway • Effective Track to College Readiness• Engaged Learning• Academic and Social Support Network

21
Early
Conne
ction
s
High E
xpec
tatio
ns a
nd A
spira
tions
Clear A
cade
mic
Plan a
nd P
athw
ay
Effecti
ve T
rack
to C
olleg
e Rea
dines
s
Engag
ed L
earn
ing
Acade
mic
and
Social
Sup
port
Networ
k
46.6
48.8
53.1
53.2
43.9
47.7
46.7
49.7
47.7
49.6
49.4 4956
.8
55.1
58.5
58.2
59.1
55.3
CSI Large Colleges Top Performing Colleges
SENSE Benchmarks for Effective Educational Practice
Source: 2013 SENSE data

22
Early Connections
Source: 2013 SENSE data
A specific person was assigned to me so I could see him/her each t...
21% 21.80%
38.90%
26.10%
CSI Large Colleges Top Performing Colleges2013 Cohort
23
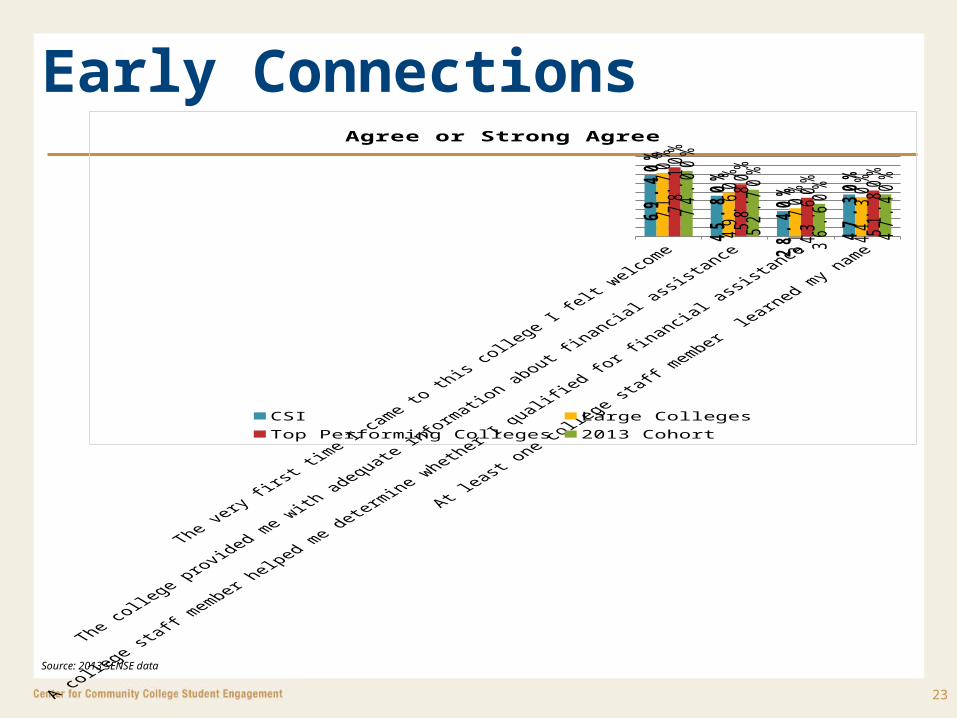
Early Connections
Source: 2013 SENSE data
69
.40
%
45
.80
%
28
.40
%
47
.30
%
71
.70
%
49
.60
%
31
.70
%
44
.30
%
78
.10
%
58
.80
%
43
.60
%
51
.80
%
74
.00
%
52
.70
%
36
.60
%
47
.40
%
Agree or Strong Agree
CSI Large CollegesTop Performing Colleges 2013 Cohort

24
Percent of Student who AGREED OR STRONGLY AGREED with the following statements
CSI Large Colleges
Top Performing Colleges
2013 Cohort
I have the motivation to do what it takes to succeed in college
91.8% 90.2% 92.7% 90.2%
I am prepared academically to succeed in college
84.2% 85.6% 89.2% 76.0%
The instructors at this college want me to succeed
87.8% 86.8% 89% 87.7%
High Expectations and Aspirations

25
Percent of Student who responded Never or Once:
CSI Large Colleges
Top Performing
Colleges2013
Cohort
Turned in an assignment late
93.3% 92.3% 94.2% 92.2%
Did Not turn in an assignment
92.6% 92.6% 94.9% 92.9%
Went to class without completing readings or assignments
86.8% 86.3% 90% 86%
Skipped class 87.2% 92% 92.5% 91.8%
High Expectations and Aspirations

26
Clear Academic Plan and Pathway
Source: 2013 SENSE data
68.6%
33.4%
59.3%
28.1%
76.5%
38.0%
63.5%
29.9%
Agree or Strongly Agree
College of Southern Idaho Large Colleges Top Performing Colleges
2013 Cohort

27
Clear Academic Plan and Pathway
Source: 2013 SENSE data
68.2%
43.4%
78.4%
59.0%
40.0%
68.9%74.2%
54.8%
85.0%
62.1%
42.3%
72.2%
Agree or Strongly Agree
College of Southern Idaho Large Colleges Top Performing Colleges2013 Cohort
28
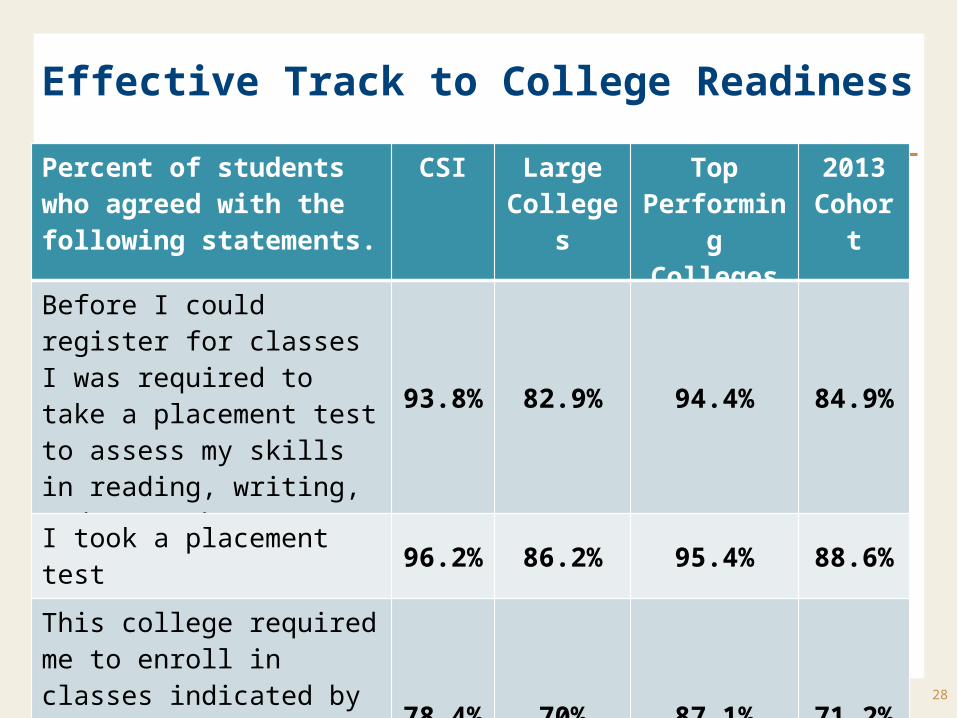
Effective Track to College Readiness
Source: 2013 SENSE data
Percent of students who agreed with the following statements.
CSI Large Colleges
Top Performing
Colleges
2013 Cohort
Before I could register for classes I was required to take a placement test to assess my skills in reading, writing, and/or math 93.8% 82.9% 94.4% 84.9%
I took a placement test 96.2% 86.2% 95.4% 88.6%
This college required me to enroll in classes indicated by my placement test scores during my first semester/quarter
78.4% 70% 87.1% 71.2%
29
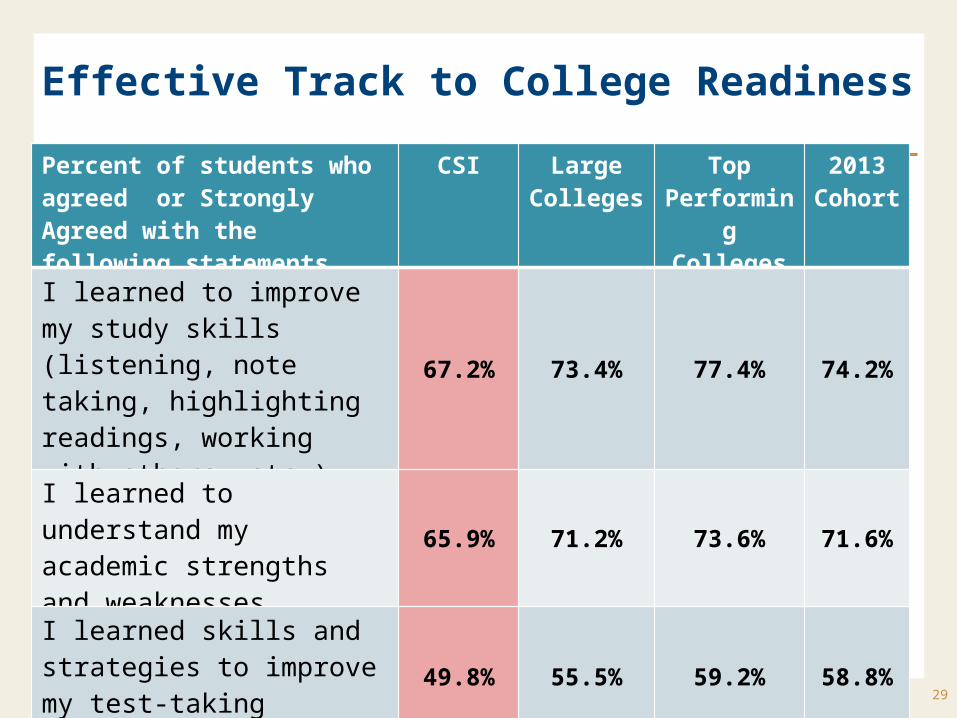
Effective Track to College Readiness
Source: 2013 SENSE data
Percent of students who agreed or Strongly Agreed with the following statements.
CSI Large Colleges
Top Performing
Colleges
2013 Cohort
I learned to improve my study skills (listening, note taking, highlighting readings, working with others, etc.)
67.2% 73.4% 77.4% 74.2%
I learned to understand my academic strengths and weaknesses 65.9% 71.2% 73.6% 71.6%
I learned skills and strategies to improve my test-taking ability
49.8% 55.5% 59.2% 58.8%

30
Engaged Learning
Source: 2013 SENSE data
Percent of students answering “Never” to the following questions:
CSI Large Colleges
Top Performing
Colleges2013
Cohort
Prepare at least two drafts of a paper or assignment before turning it in
28.1% 28.3% 28.7% 28.2%
Participate in supplemental instruction (extra class sessions with an instructor, tutor, or experienced student)
74.9% 68.2% 64.2% 68.3%
Participate in a student-initiated (not required) study group outside of class
85.7% 82.2% 77% 82.2%

31
Engaged Learning
Source: 2013 SENSE data
Percent of students answering “Never” to the following questions:
CSI Large Colleges
Top Performing
Colleges2013
Cohort
Discuss an assignment or grade with an instructor 35.7% 33.3% 27.5% 33.0%
Ask for help from an instructor regarding questions or problems related to a class
27.2% 23.4% 16.1% 23.5%
Receive prompt written or oral feedback from instructors on your performance
29.9% 24.9% 18.1% 24.9%
Discuss ideas from readings or classes with instructors outside of class
73.8% 65.3% 57.8% 65.7%

32
Academic and Social Support Network
Source: 2013 SENSE data
55
.2%
90
.2%
92
.5%
89
.7%
67
.6%
87
.8%
90
.3%
87
.1%
76
.4%
89
.5%
87
.4%
90
.7%
68
.8%
88
.3%
90
.1%
87
.7%
CSI Large CollegesTop Performing Colleges 2013 Cohort
Agree or Strong Agree

33
Academic and Social Support Network
Source: 2013 SENSE data
At least one other student whom I didn’t previously know learned my name
At least one instructor learned my name
I learned the name of at least one other student in
most of my classes
77.3%
85.9% 85.1%82.3%86.0% 85.3%88.0%
92.8% 90.7%
82.0%86.9% 85.7%
CSI Large CollegesTop Performing Colleges 2013 Cohort
Agree or Strong Agree

34
Benchmarking – and Reaching for ExcellenceThe most important comparison:
where we are now, compared with
where we want to be.

Community College Students and Stories
36
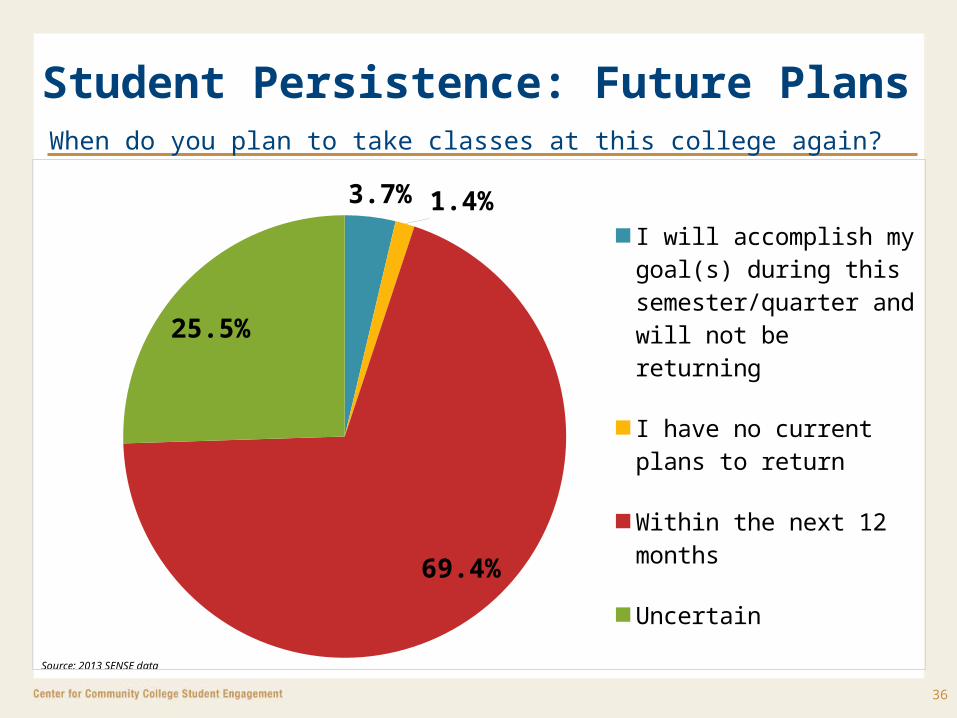
Student Persistence: Future PlansWhen do you plan to take classes at this college again?
Source: 2013 SENSE data
3.7% 1.4%
69.4%
25.5%
I will accomplish my goal(s) during this semester/quar-ter and will not be returning
I have no current plans to return
Within the next 12 months
Uncertain
37
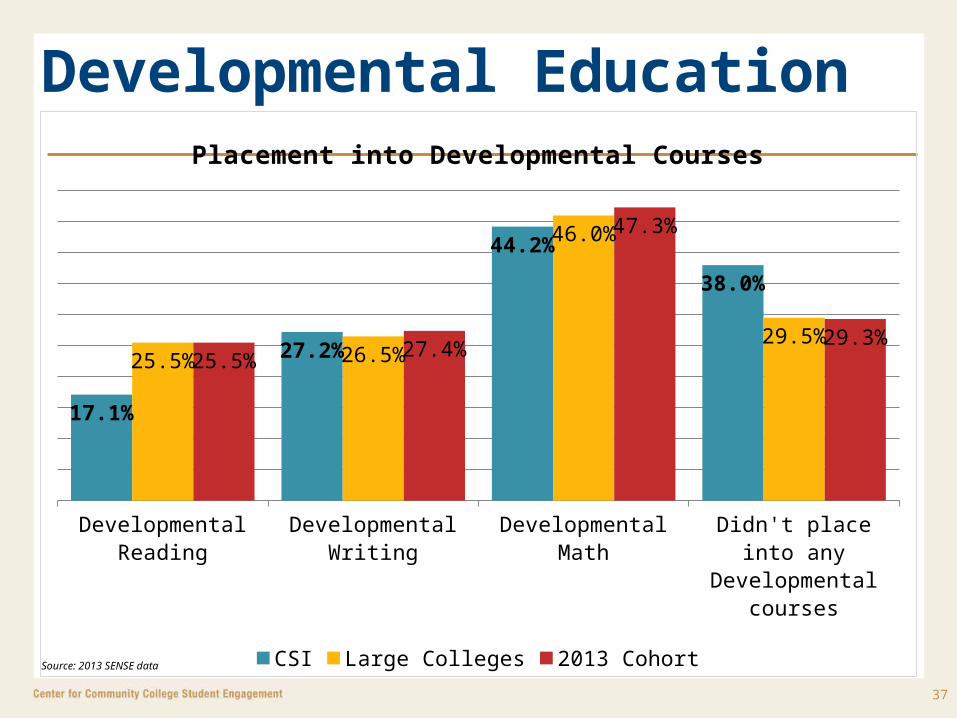
Developmental Education
Source: 2013 SENSE data
Devel
opm
enta
l Rea
ding
Devel
opm
enta
l Writ
ing
Devel
opm
enta
l Mat
h
Didn't
pla
ce in
to a
ny D
evel
opm
enta
l cou
rses
17.1%
27.2%
44.2%38.0%
25.5% 26.5%
46.0%
29.5%25.5% 27.4%
47.3%
29.3%
Placement into Developmental Courses
CSI Large Colleges 2013 Cohort

38
Developmental Education
Source: 2013 SENSE data
Devel
opm
enta
l Rea
ding
Devel
opm
enta
l Writ
ing
Devel
opm
enta
l Mat
h
Stude
nt S
ucce
ss
18.4%
30.4%
49.4%
5.8%
29.6% 32.3%
48.9%
27.8%29.1%32.9%
49.3%
30.3%
Enrollment in the first semester
CSI Large Colleges 2013 Cohort

Strategies to Promote Learning that Matters

40
Strategies to Promote Learning that MattersThe Center describes key strategies to promote strengthened classroom experiences:
Strengthen classroom engagement
Integrate student support into learning experiences
Focus institutional policies on creating the conditions for learning
41
Strengthen Classroom Engagement Raise expectations
Promote active, engaged learning
Build and encourage relationships
Ensure that students know where they stand
42
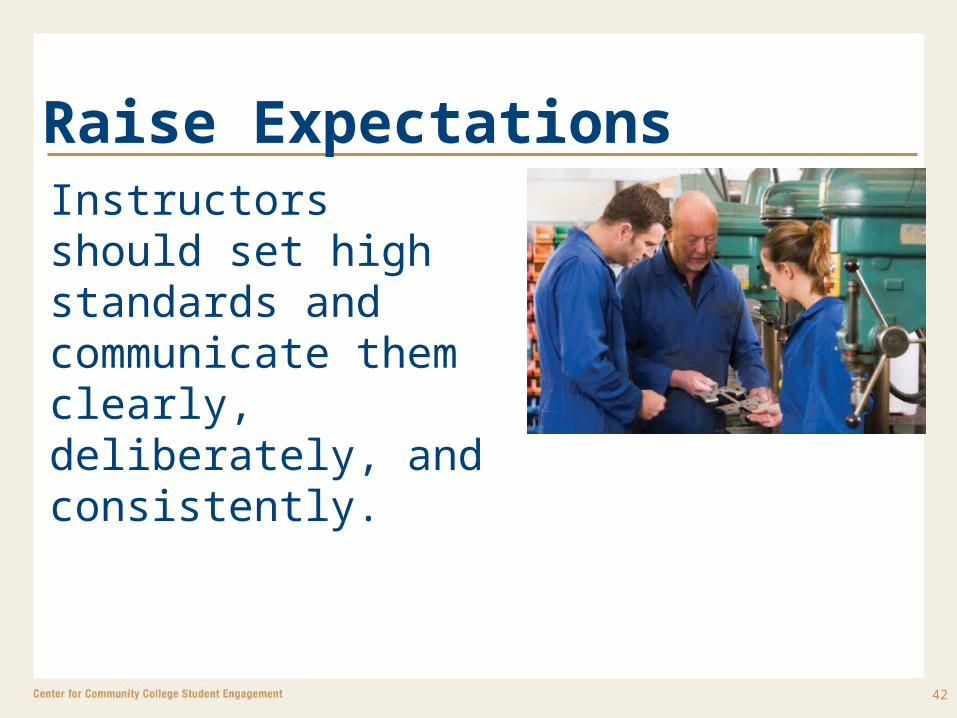
Raise ExpectationsInstructors should set high standards and communicate them clearly, deliberately, and consistently.

43
Raise ExpectationsStudents report that they are motivated to succeed: 91.8% of students “Agree” or “Strongly
Agree” that they have the motivation to do what it takes to succeed in college
Source: 2013 SENSE data

44
Raise ExpectationsBut expectations may not be as high as they need to be:
Source: 2013 SENSE data
61%
39%
Time Spent Studying
Five or fewer hours
More than 5 hours

45
Promote Active, Engaged LearningStudents learn and retain more information — and persist and succeed at higher levels — when they are actively involved in learning rather than passively receiving information.

46
Promote Active, Engaged LearningStudent Perceptions of Engaged Learning
During the first three weeks of your first semester/quarter at this college, about how often have you done each of the following activities?
Source: 2013 SENSE data
Asked questions in class or contributed to class dis-
cussions
Worked with other students on projects during class
Worked with class mates outside of class on class projects or assignments
13.6%
24.7%
67.6%
7.7%
21.5%
66.5%
5.5%12.5%
56.5%
7.8%
21.4%
65.6%
Percentage of students responding NEVER
CSI Large CollegesTop Performing Colleges 2013 Cohort

47
Build and Encourage RelationshipsPersonal connections are a critical factor in student success

48
Build and Encourage RelationshipsEntering Students’ Interaction with Faculty
89.7%
8.1% 2.3%
Agree or Strongly Agree Neutral
Disagree or Strongly Disagree
“I knew how to get in touch with my instructors outside of class.”
73.8%
14.1%
9.0% 3.1%
Never Once Two or Three Times Four or more times
Discussed ideas from readings or classes with instructors outside of class.
Source: 2013 SENSE data

49
Ensure that Students Know Where They StandFeedback on academic performance greatly affects student retention
50
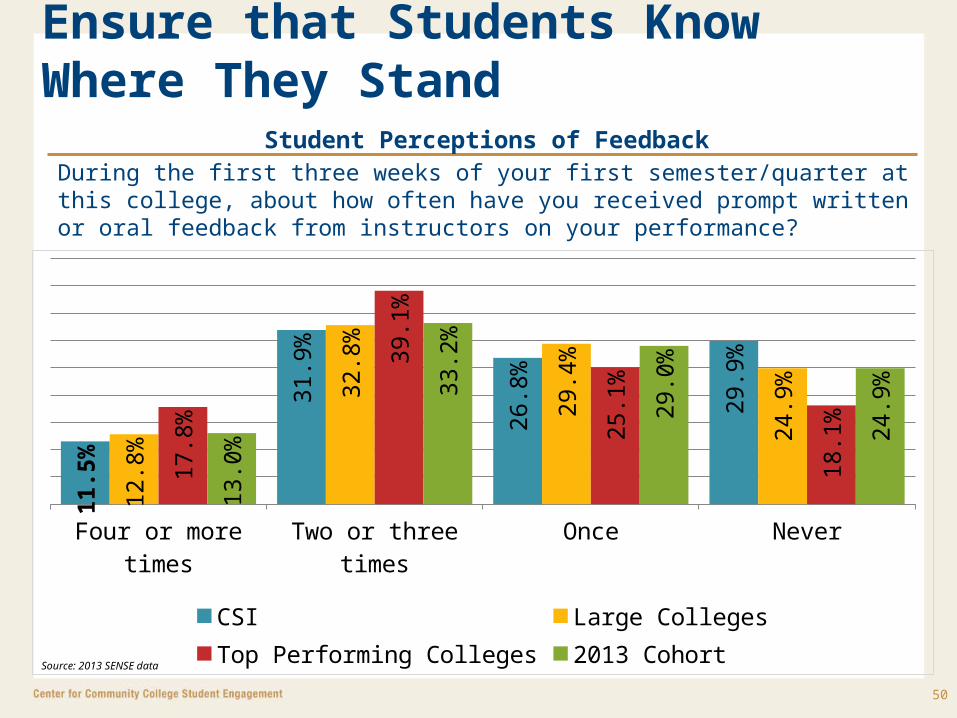
Ensure that Students Know Where They Stand
Source: 2013 SENSE data
Student Perceptions of FeedbackDuring the first three weeks of your first semester/quarter at this college, about how often have you received prompt written or oral feedback from instructors on your performance?
Four or more times Two or three times Once Never
11.5
%
31.9
%
26.8
%
29.9
%
12.8
%
32.8
%
29.4
%
24.9
%
17.8
%
39.1
%
25.1
%
18.1
%
13.0
%
33.2
%
29.0
%
24.9
%
CSI Large CollegesTop Performing Colleges 2013 Cohort

51
Integrate Student Support into Learning ExperiencesStudents are most likely to succeed when expectations are high and they receive the support they need to rise to those expectations

52
Integrate Student Support into Learning Experiences
Never Once Two or Three Times Four or More times
43.5%
35.3%
17.8%
3.3%
45.7%
34.8%
16.6%
3.0%
42.7%
36.0%
18.1%
3.2%
How often did you use Academic Advising?
CSI Large Colleges 2013 Cohort

53
Integrate Student Support into Learning Experiences
Not applicable Not at all Somewhat Very
39.7%
6.2%
33.7%
20.3%
42.3%
4.5%
29.1%
24.1%
39.3%
4.5%
30.1%
26.2%
How satisfied were you with Academic Advising?
CSI Large Colleges 2013 Cohort
54
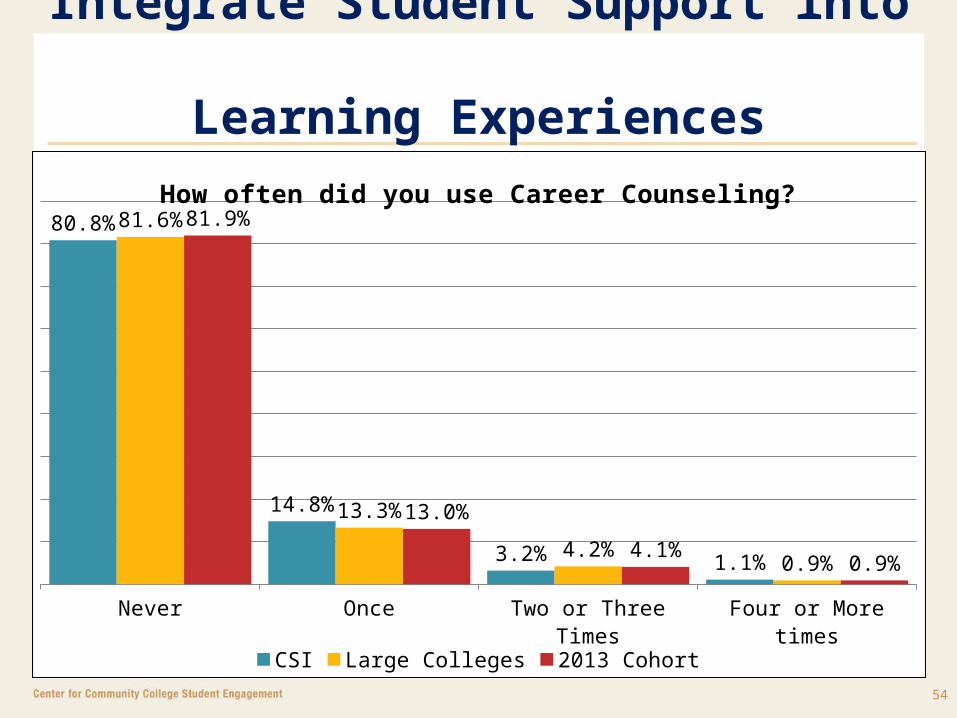
Integrate Student Support into Learning Experiences
Never Once Two or Three Times Four or More times
80.8%
14.8%
3.2% 1.1%
81.6%
13.3%
4.2%0.9%
81.9%
13.0%
4.1%0.9%
How often did you use Career Counseling?
CSI Large Colleges 2013 Cohort

55
Integrate Student Support into Learning Experiences
Not applicable Not at all Somewhat Very
77.4%
3.5%
12.6%6.5%
76.2%
3.6%10.0% 10.2%
76.3%
3.7%9.9% 10.1%
How satisfied were you with Career Counseling?
CSI Large Colleges 2013 Cohort

56
Integrate Student Support into Learning Experiences
Never Once Two or Three Times Four or More times
82.5%
7.6% 6.3% 3.5%
66.2%
12.1% 10.0% 11.7%
64.1%
11.8% 10.7% 13.3%
How often did you use Skill Labs?
CSI Large Colleges 2013 Cohort
57
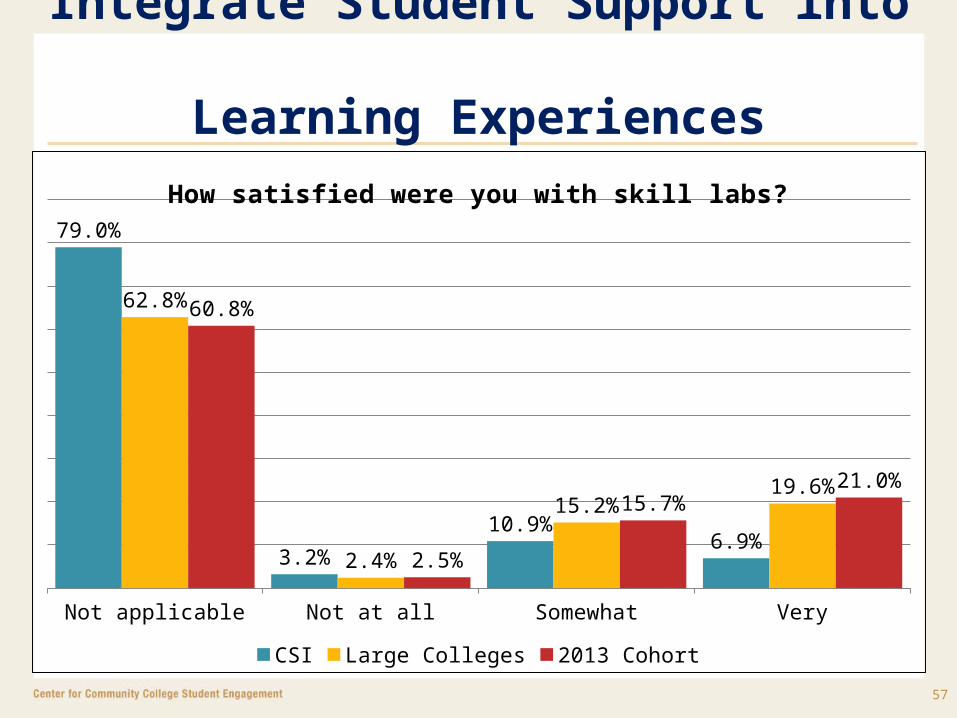
Integrate Student Support into Learning Experiences
Not applicable Not at all Somewhat Very
79.0%
3.2%
10.9%6.9%
62.8%
2.4%
15.2%19.6%
60.8%
2.5%
15.7%21.0%
How satisfied were you with skill labs?
CSI Large Colleges 2013 Cohort

58
Integrate Student Support into Learning Experiences
Never Once Two or Three Times Four or More times
48.5%
26.7%
18.3%
6.5%
56.0%
23.6%
14.3%
6.0%
51.9%
26.3%
15.6%
6.2%
How often did you use Financial Aid Advising?
CSI Large Colleges 2013 Cohort
59
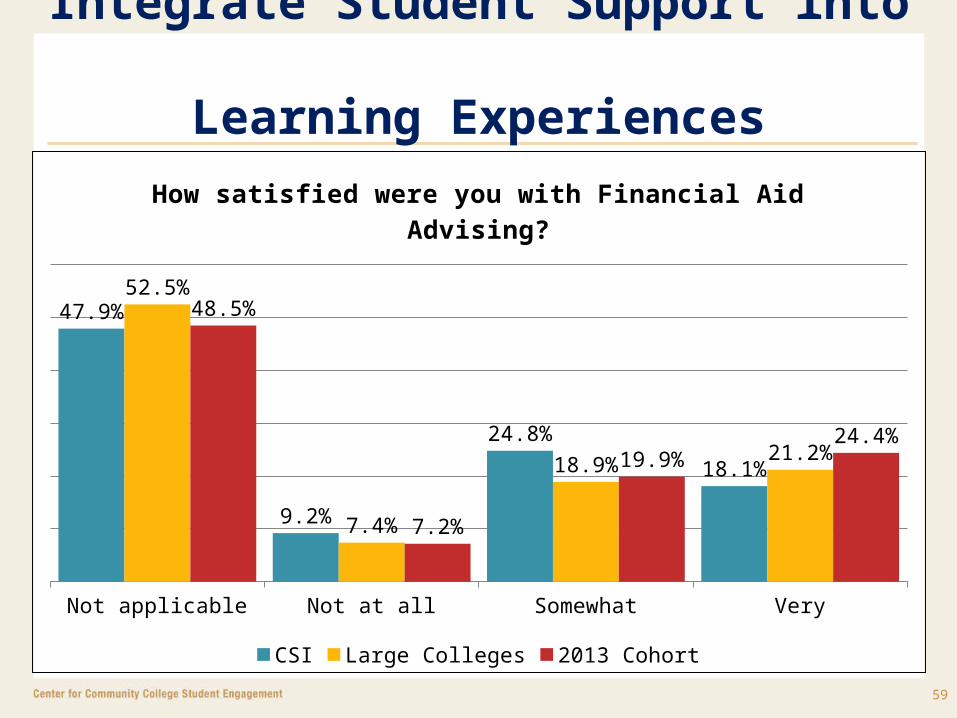
Integrate Student Support into Learning Experiences
Not applicable Not at all Somewhat Very
47.9%
9.2%
24.8%
18.1%
52.5%
7.4%
18.9%21.2%
48.5%
7.2%
19.9%24.4%
How satisfied were you with Financial Aid Advising?
CSI Large Colleges 2013 Cohort

60
Integrate Student Support into Learning Experiences
Never Once Two or Three Times Four or More times
50.0%
13.2%15.4%
21.4%
47.2%
17.2% 17.4% 18.3%
46.7%
16.9% 17.4% 19.1%
How often did you use Computer Lab?
CSI Large Colleges 2013 Cohort
61
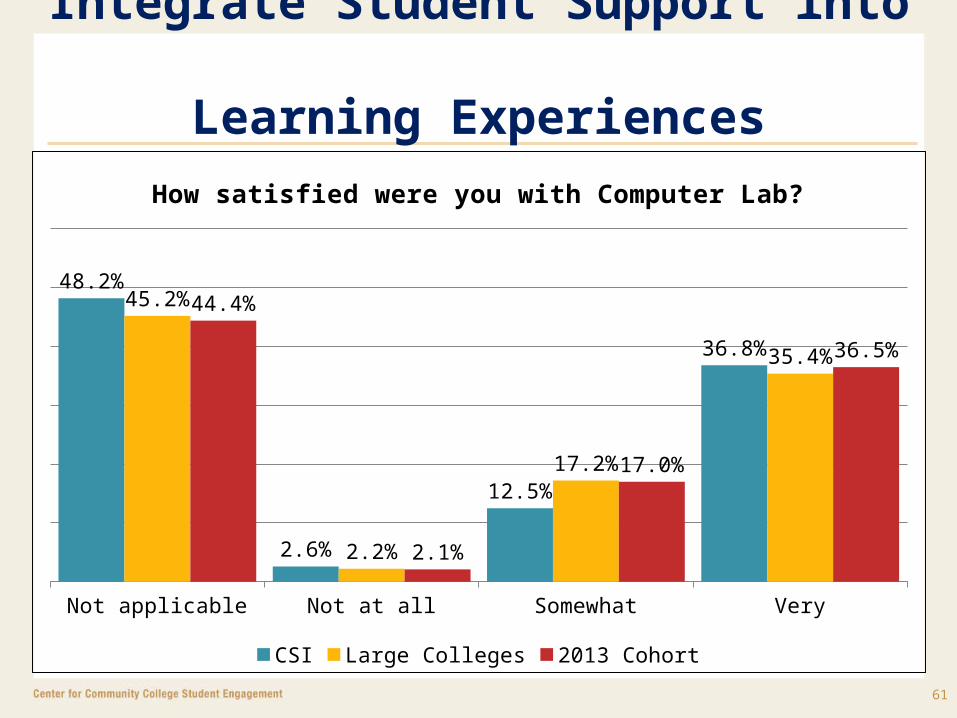
Integrate Student Support into Learning Experiences
Not applicable Not at all Somewhat Very
48.2%
2.6%
12.5%
36.8%
45.2%
2.2%
17.2%
35.4%
44.4%
2.1%
17.0%
36.5%
How satisfied were you with Computer Lab?
CSI Large Colleges 2013 Cohort
62
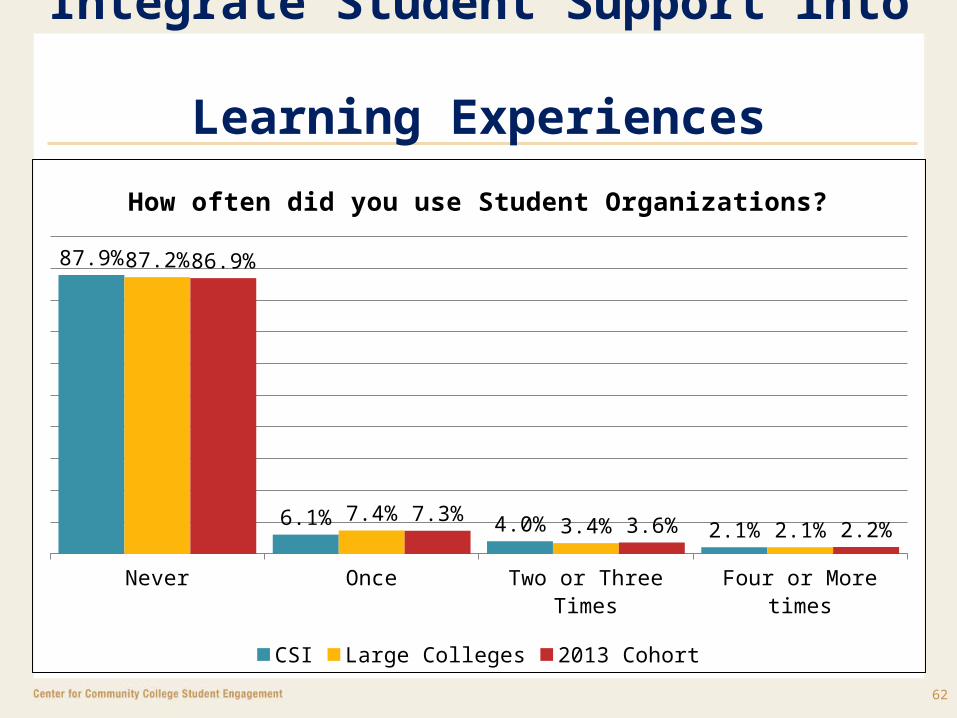
Integrate Student Support into Learning Experiences
Never Once Two or Three Times Four or More times
87.9%
6.1% 4.0% 2.1%
87.2%
7.4%3.4% 2.1%
86.9%
7.3%3.6% 2.2%
How often did you use Student Organizations?
CSI Large Colleges 2013 Cohort

63
Integrate Student Support into Learning Experiences
Not applicable Not at all Somewhat Very
81.1%
3.3%7.0% 8.6%
81.5%
2.9%7.2% 8.4%
80.9%
2.9%7.3% 8.9%
How satisfied were you with Student Organizations?
CSI Large Colleges 2013 Cohort

64
Integrate Student Support into Learning Experiences
Never Once Two or Three Times Four or More times
89.7%
6.8%2.5% 1.0%
88.9%
8.4%1.9% 0.7%
88.3%
9.0%2.0% 0.7%
How often did you use Transfer Credit Assistance?
CSI Large Colleges 2013 Cohort
65
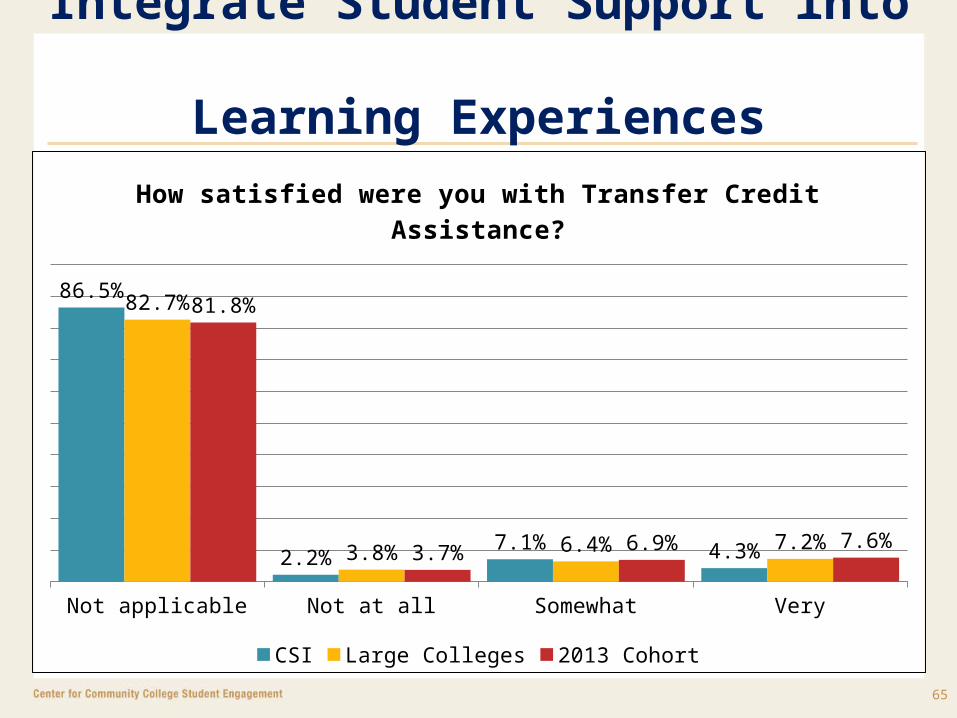
Integrate Student Support into Learning Experiences
Not applicable Not at all Somewhat Very
86.5%
2.2%7.1% 4.3%
82.7%
3.8% 6.4% 7.2%
81.8%
3.7% 6.9% 7.6%
How satisfied were you with Transfer Credit Assistance?
CSI Large Colleges 2013 Cohort

66
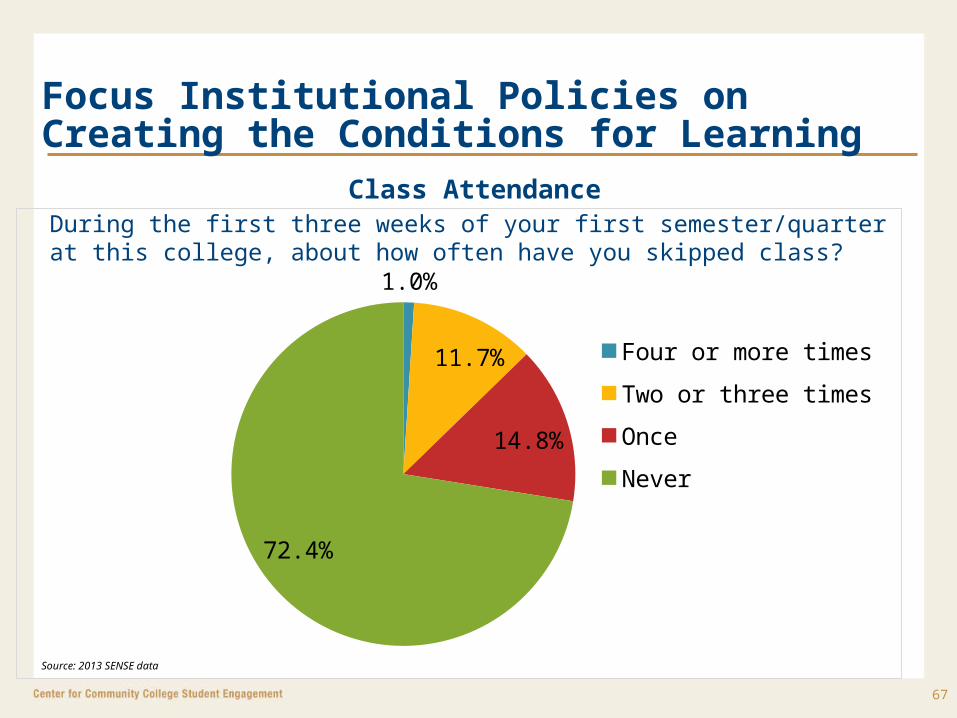
Focus Institutional Policies on Creating the Conditions for LearningInstitutional policies focused on student success are most effective when colleges mandate student participation in activities that are shown to increase persistence and improve student outcomes
67
Focus Institutional Policies on Creating the Conditions for Learning
Class AttendanceDuring the first three weeks of your first semester/quarter at this college, about how often have you skipped class?
1.0%
11.7%
14.8%
72.4%
Four or more times
Two or three times
Once
Never
Source: 2013 SENSE data