Embed Size (px)
Citation preview
Sensemaking TIPERs Instructors Manual A Copyright © 2015 Pearson Education, Inc.
i
INSTRUCTORS MANUAL SECTION A
Answering Ranking Tasks ........................................................................................................................................ iii Example-RT1: Stacked Blocks—Mass of Stack .....................................................................................................iv Practice-RT2: Stacked Blocks—Number of Blocks .................................................................................................v Practice-RT3: Stacked Blocks—Average Mass ......................................................................................................vi Practice-RT4: Stacked Blocks—Number, Total Mass, and Average Mass ........................................................... vii
A1 Preliminaries ..........................................................................................................................................................1 A1-RT01: Line Graph I—Slope ...............................................................................................................................1 A1-RT02: Y-X Graph Lines—Slope ........................................................................................................................2 A1-RT03: Complex Line Graph—Magnitude of Slope............................................................................................3 A1-RT04: Complex Line Graph—Slope ..................................................................................................................4 A1-RT05: Four Rectangles—Slope of Diagonals.....................................................................................................5 A1-WWT06: Rectangle—Slope of Diagonals..........................................................................................................6 A1-CT07: Line Graph II—Slope..............................................................................................................................7 A1-RT08: Curved Line Graph—Slope.....................................................................................................................8 A1-WWT09: Two Columns of Data—Data Graph ..................................................................................................9 A1-WWT10: Monthly Website Visits Graph—Interpretation................................................................................10 A1-WWT11: Cat Moving Away from a Dog Graph—Cat Speed ..........................................................................11 A1-WWT12: Filling a Cylindrical Glass—Height of Water-Time Graph..............................................................12 A1-WWT13: Filling Tapered Glass—Height of Water-Time Graph .....................................................................13 A1-WWT14: Filling Inverted Tapered Glass—Water Height-Time Graph ...........................................................14 A1-SCT15: Water Stream—Time to Fill Glass......................................................................................................15 A1-WWT16: Filling Complex Flask at Constant Rate—Height of Water-Time Graph.........................................16 A1-WWT17: Cars and Trucks in Parking Lot—Statement ....................................................................................17 A1-SCT18: Inches and Feet—Equation .................................................................................................................18 A1-WWT19: Boys and Girls on Dance Floor—Equation ......................................................................................19 A1-WWT20: Students and Teachers—Equation....................................................................................................20 A1-WWT21: Texting and Cost—Statement...........................................................................................................21 A1-WWT22: Line Data Graph—Interpretation......................................................................................................22 A1-QRT23: Statement about Y-X Graphs—Doubling Graph................................................................................23 A1-SCT24: Equation I—Solution...........................................................................................................................24 A1-SCT25: Equation II—Units Analysis ...............................................................................................................25 A1-WWT26: Inverse Quantities—Statement .........................................................................................................26 A1-QRT27: Statement—Doubling Equation..........................................................................................................27 A1-RT28: Lemonade from Concentrate—Flavor Strength ....................................................................................28 A1-RT29: Four Basketball Players—Free-Throw Skills ........................................................................................29 A1-QRT30: Four Basketball Players—Making Teams ..........................................................................................30 A1-SCT31: Large and Small Picture—Size ...........................................................................................................31 A1-CT32: Scale Model Planes—Surface Area and Weight ...................................................................................32 A1-WWT33: Five Kilograms of Pennies—Value of Five Kilograms of Nickels...................................................33 A1-SCT34: Coal Mine Rescue Shaft—Time..........................................................................................................34 A1-QRT35: Pennies—Number of Pennies .............................................................................................................35 A1-TT36: Six Page Physics Test—Weight ............................................................................................................36
A2 Vectors ..................................................................................................................................................................37 A2-QRT01: Vectors on a Grid I—Magnitudes.......................................................................................................37 A2-RT02: Vectors on a Grid II—Magnitudes ........................................................................................................38 A2-QRT03: Vectors on a Grid III—Directions ......................................................................................................39 A2-QRT04: Vector Graphical Addition and Subtraction I—Expression ...............................................................40 A2-QRT05: Vector Graphical Addition and Subtraction II—Expression ..............................................................41 A2-QRT06: Vector Expression of Graphical Relationship—Equation ..................................................................42 A2-WBT07: Resultant—Graphical Addition or Subtraction..................................................................................43
Sensemaking TIPERs Instructors Manual A Copyright © 2015 Pearson Education, Inc.
ii
A2-SCT08: Adding Two Vectors—Magnitude of the Resultant............................................................................44 A2-QRT09: Vectors on a Grid IV—Graphical Representation of Sum .................................................................45 A2-RT10: Vectors on Grid V—Components of Vectors........................................................................................46 A2-WWT11: Addition and Subtraction of Two Vectors—Direction of Resultant.................................................47 A2-RT12: Vectors on Grid VI—Resultant Magnitudes of Adding Two Vectors...................................................48 A2-RT13: Vectors on Grid VII—Resultant Magnitudes of Adding Two Vectors .................................................49 A2-SCT14: Combining Two Vectors—Resultant ..................................................................................................50 A2-CT15: Combining Vectors—Magnitude of Resultant ......................................................................................51 A2-QRT16: Vector Combination I—Direction of Resultant..................................................................................52 A2-QRT17: Vector Combinations II—Components of the Resultant Vector ........................................................53 A2-QRT18: Force Vectors—Properties of Components ........................................................................................54 A2-QRT19: Velocity Vectors—Properties of Components....................................................................................55 A2-SCT20: Two Vectors—Vector Difference .......................................................................................................56 A2-CT21: Two Vectors—Vector Sum and Difference ..........................................................................................57 A2-RT22: Addition and Subtraction of Three Vectors—Direction of Resultant....................................................58 A2-RT23: Addition and Subtraction of Three Vectors—Magnitude of Resultant .................................................59

Sensemaking TIPERs Instructors Manual A Copyright © 2015 Pearson Education, Inc.
iii
ANSWERING RANKING TASKS
Sensemaking TIPERs Instructors Manual A Copyright © 2015 Pearson Education, Inc.
iv
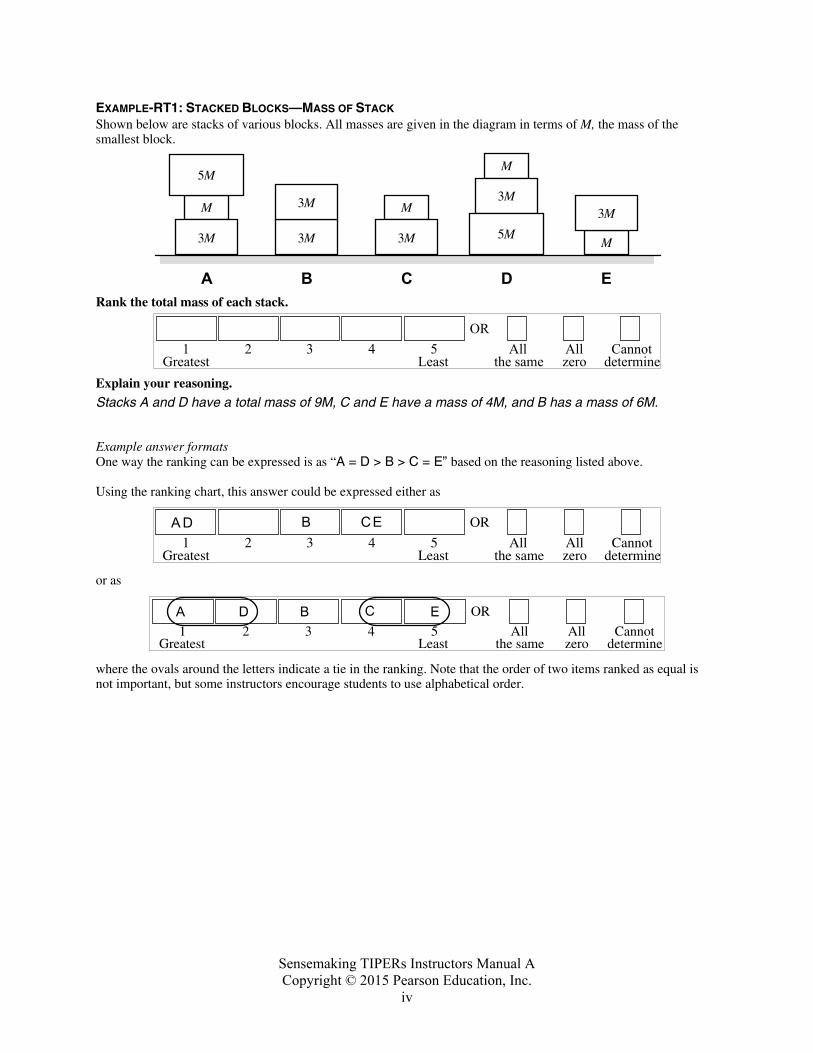
EXAMPLE-RT1: STACKED BLOCKS—MASS OF STACK Shown below are stacks of various blocks. All masses are given in the diagram in terms of M, the mass of the smallest block.
5M
M
3M
A
3M
B
M
3M
C
5M
M
3M
D
M
3M
E
3M
Rank the total mass of each stack.
Greatest1
ORAll
the sameAllzero
Cannotdetermine
2 3 4 5Least
Explain your reasoning.
Stacks A and D have a total mass of 9M, C and E have a mass of 4M, and B has a mass of 6M. Example answer formats One way the ranking can be expressed is as “A = D > B > C = E” based on the reasoning listed above. Using the ranking chart, this answer could be expressed either as
Greatest1
OR
Allthe same
Allzero
Cannotdetermine
2 3 4 5Least
A D B C E
or as
Greatest1
OR
Allthe same
Allzero
Cannotdetermine
2 3 4 5Least
A D B C E
where the ovals around the letters indicate a tie in the ranking. Note that the order of two items ranked as equal is not important, but some instructors encourage students to use alphabetical order.
Sensemaking TIPERs Instructors Manual A Copyright © 2015 Pearson Education, Inc.
v
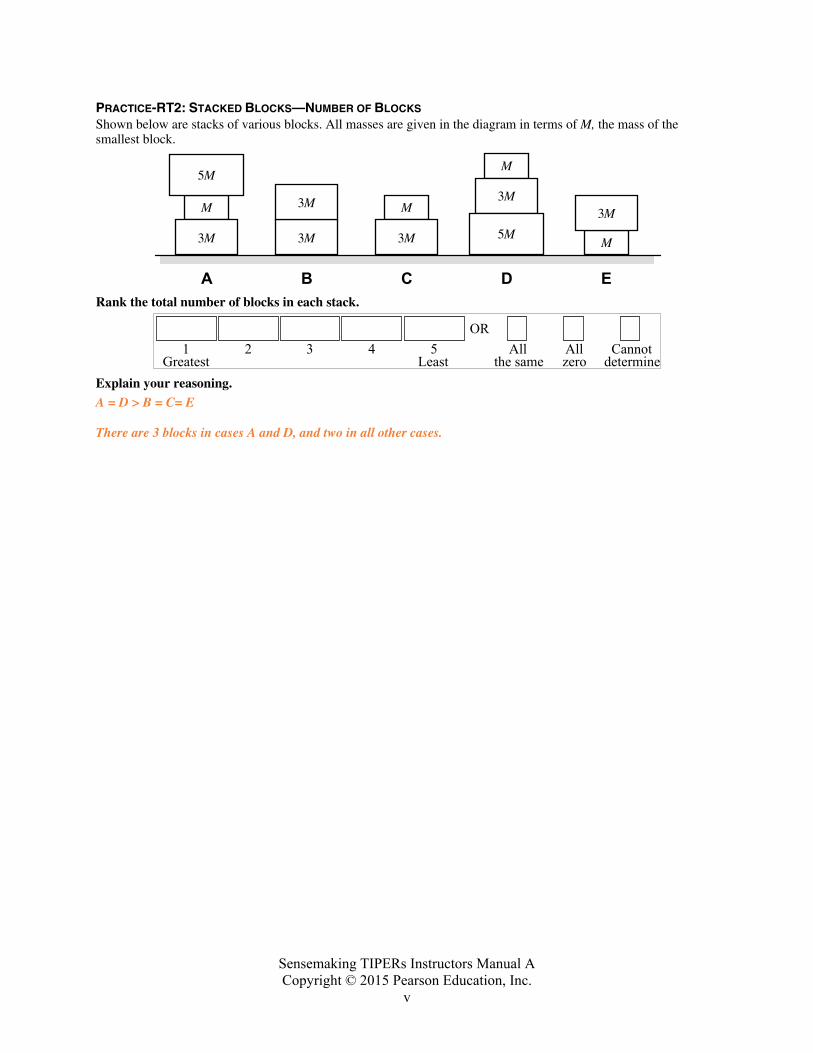
PRACTICE-RT2: STACKED BLOCKS—NUMBER OF BLOCKS Shown below are stacks of various blocks. All masses are given in the diagram in terms of M, the mass of the smallest block.
5M
M
3M
A
3M
B
M
3M
C
5M
M
3M
D
M
3M
E
3M
Rank the total number of blocks in each stack.
Greatest1
ORAll
the sameAllzero
Cannotdetermine
2 3 4 5Least
Explain your reasoning. A = D > B = C= E There are 3 blocks in cases A and D, and two in all other cases.
Sensemaking TIPERs Instructors Manual A Copyright © 2015 Pearson Education, Inc.
vi
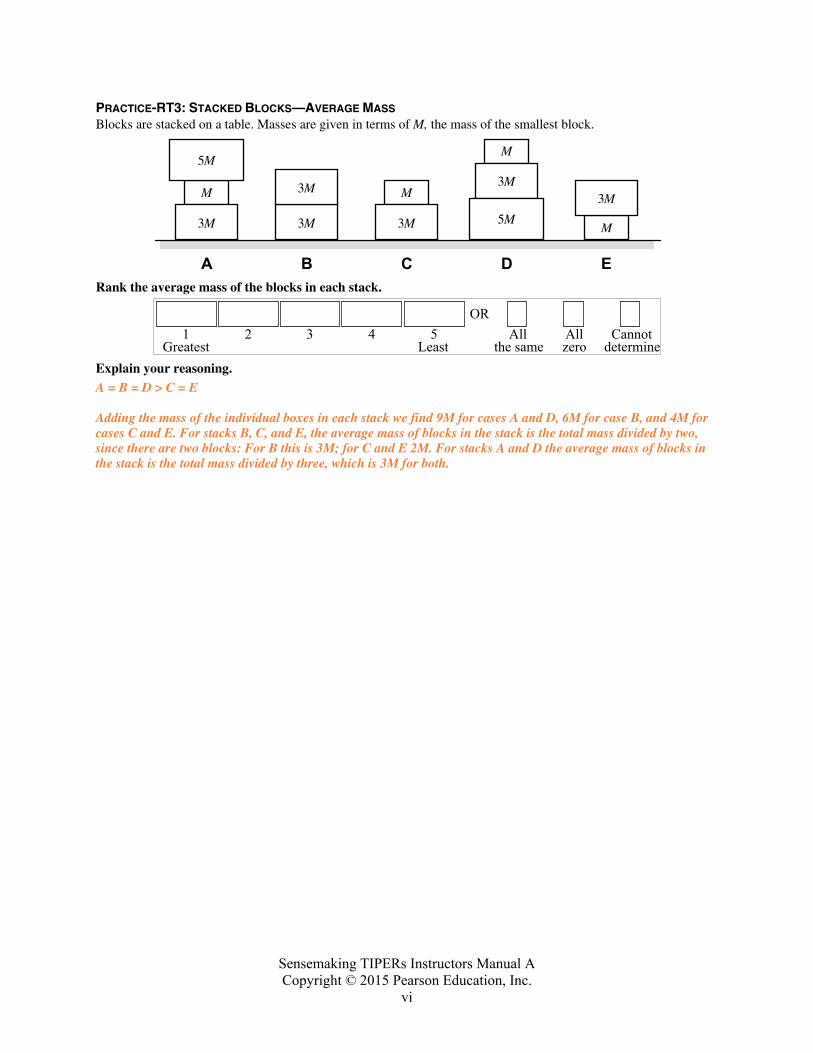
PRACTICE-RT3: STACKED BLOCKS—AVERAGE MASS Blocks are stacked on a table. Masses are given in terms of M, the mass of the smallest block.
5M
M
3M
A
3M
B
M
3M
C
5M
M
3M
D
M
3M
E
3M
Rank the average mass of the blocks in each stack.
Greatest1
ORAll
the sameAllzero
Cannotdetermine
2 3 4 5Least
Explain your reasoning. A = B = D > C = E Adding the mass of the individual boxes in each stack we find 9M for cases A and D, 6M for case B, and 4M for cases C and E. For stacks B, C, and E, the average mass of blocks in the stack is the total mass divided by two, since there are two blocks: For B this is 3M; for C and E 2M. For stacks A and D the average mass of blocks in the stack is the total mass divided by three, which is 3M for both.
Sensemaking TIPERs Instructors Manual A Copyright © 2015 Pearson Education, Inc.
vii
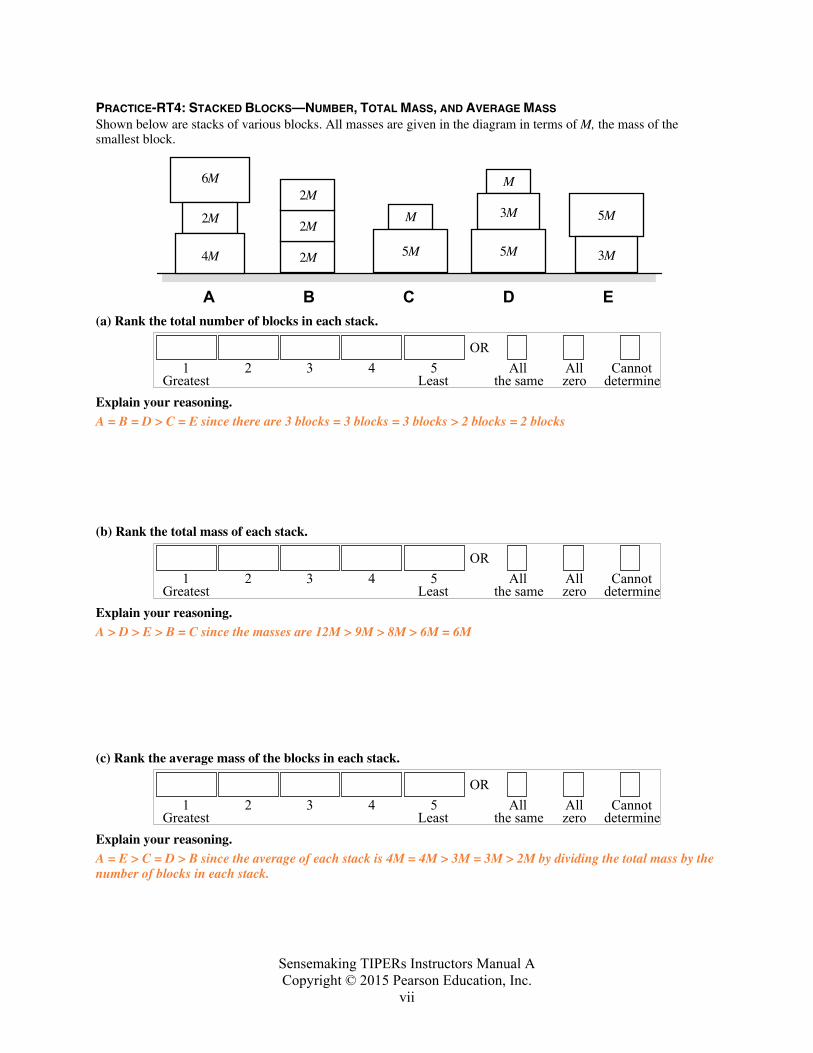
PRACTICE-RT4: STACKED BLOCKS—NUMBER, TOTAL MASS, AND AVERAGE MASS Shown below are stacks of various blocks. All masses are given in the diagram in terms of M, the mass of the smallest block.
5M
A B
M
C
5M
M
3M
D
3M
E
6M
2M
4M 2M
2M
2M
5M
(a) Rank the total number of blocks in each stack.
Greatest1
ORAll
the sameAllzero
Cannotdetermine
2 3 4 5Least
Explain your reasoning. A = B = D > C = E since there are 3 blocks = 3 blocks = 3 blocks > 2 blocks = 2 blocks
(b) Rank the total mass of each stack.
Greatest1
ORAll
the sameAllzero
Cannotdetermine
2 3 4 5Least
Explain your reasoning. A > D > E > B = C since the masses are 12M > 9M > 8M > 6M = 6M (c) Rank the average mass of the blocks in each stack.
Greatest1
ORAll
the sameAllzero
Cannotdetermine
2 3 4 5Least
Explain your reasoning. A = E > C = D > B since the average of each stack is 4M = 4M > 3M = 3M > 2M by dividing the total mass by the number of blocks in each stack.
Sensemaking TIPERs Instructors Manual A Copyright © 2015 Pearson Education, Inc.
1
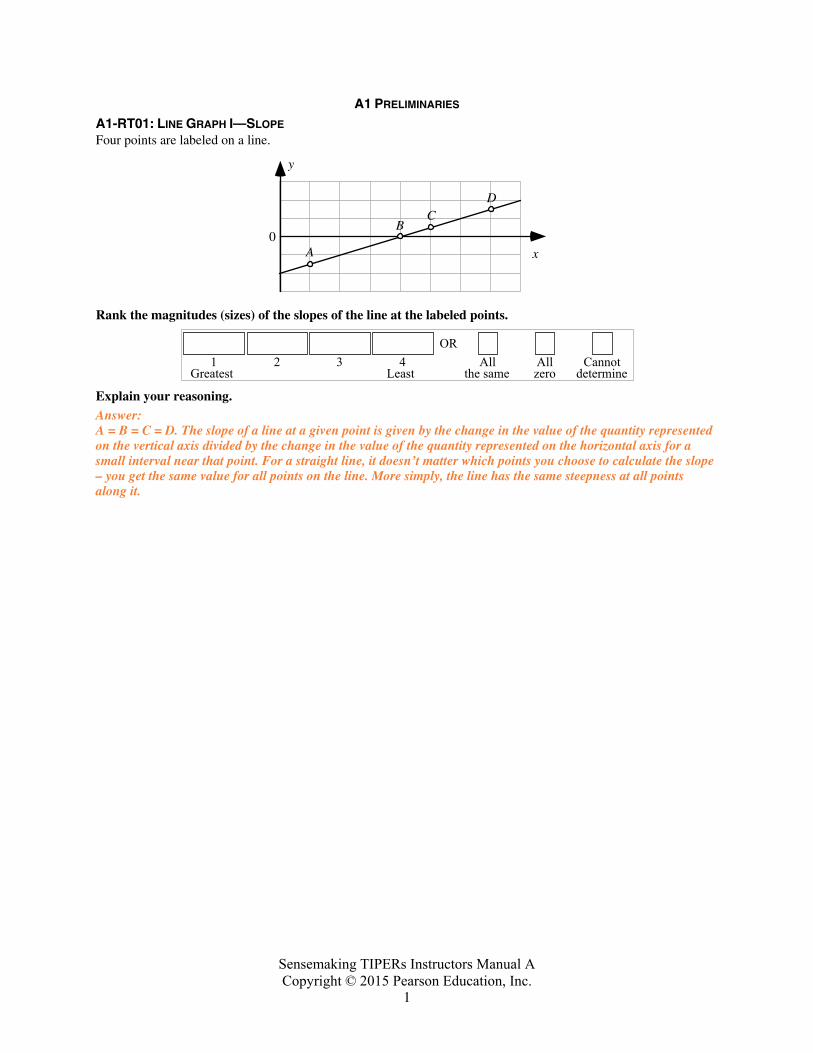
A1 PRELIMINARIES A1-RT01: LINE GRAPH I—SLOPE Four points are labeled on a line.
y
xA
BC
D
0
Rank the magnitudes (sizes) of the slopes of the line at the labeled points.
Greatest1
ORAll
the sameAllzero
Cannotdetermine
2 3 4Least
Explain your reasoning. Answer: A = B = C = D. The slope of a line at a given point is given by the change in the value of the quantity represented on the vertical axis divided by the change in the value of the quantity represented on the horizontal axis for a small interval near that point. For a straight line, it doesn’t matter which points you choose to calculate the slope – you get the same value for all points on the line. More simply, the line has the same steepness at all points along it.
Sensemaking TIPERs Instructors Manual A Copyright © 2015 Pearson Education, Inc.
2
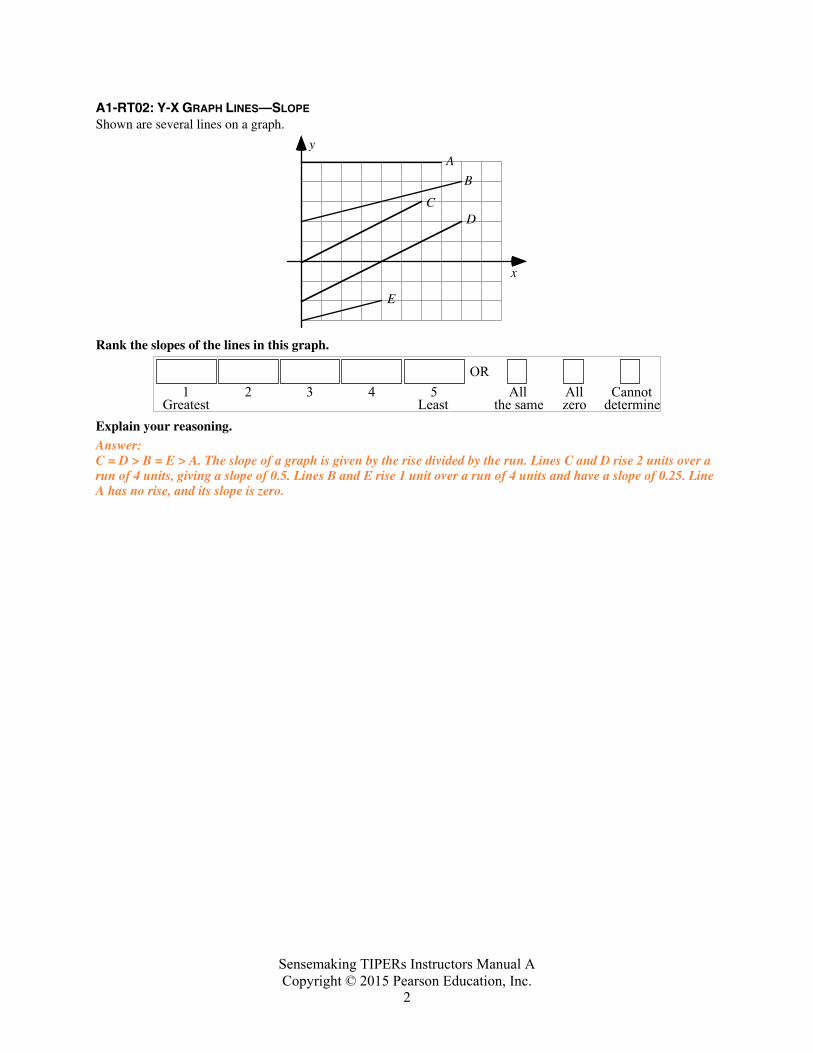
A1-RT02: Y-X GRAPH LINES—SLOPE Shown are several lines on a graph.
y
x
A
B
CD
E
Rank the slopes of the lines in this graph.
Greatest1
ORAll
the sameAllzero
Cannotdetermine
2 3 4 5Least
Explain your reasoning. Answer: C = D > B = E > A. The slope of a graph is given by the rise divided by the run. Lines C and D rise 2 units over a run of 4 units, giving a slope of 0.5. Lines B and E rise 1 unit over a run of 4 units and have a slope of 0.25. Line A has no rise, and its slope is zero.
Sensemaking TIPERs Instructors Manual A Copyright © 2015 Pearson Education, Inc.
3
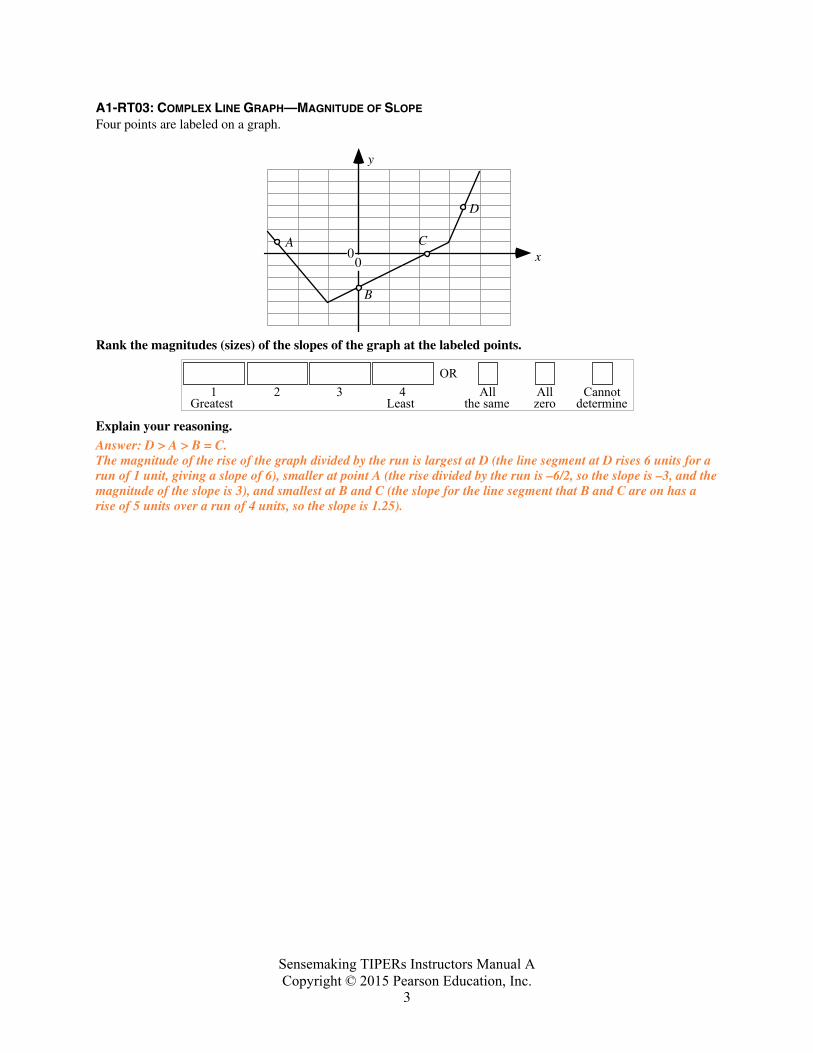
A1-RT03: COMPLEX LINE GRAPH—MAGNITUDE OF SLOPE Four points are labeled on a graph.
x
y
A
B
C
D
00
Rank the magnitudes (sizes) of the slopes of the graph at the labeled points.
Greatest1
ORAll
the sameAllzero
Cannotdetermine
2 3 4Least
Explain your reasoning. Answer: D > A > B = C. The magnitude of the rise of the graph divided by the run is largest at D (the line segment at D rises 6 units for a run of 1 unit, giving a slope of 6), smaller at point A (the rise divided by the run is –6/2, so the slope is –3, and the magnitude of the slope is 3), and smallest at B and C (the slope for the line segment that B and C are on has a rise of 5 units over a run of 4 units, so the slope is 1.25).
Sensemaking TIPERs Instructors Manual A Copyright © 2015 Pearson Education, Inc.
4
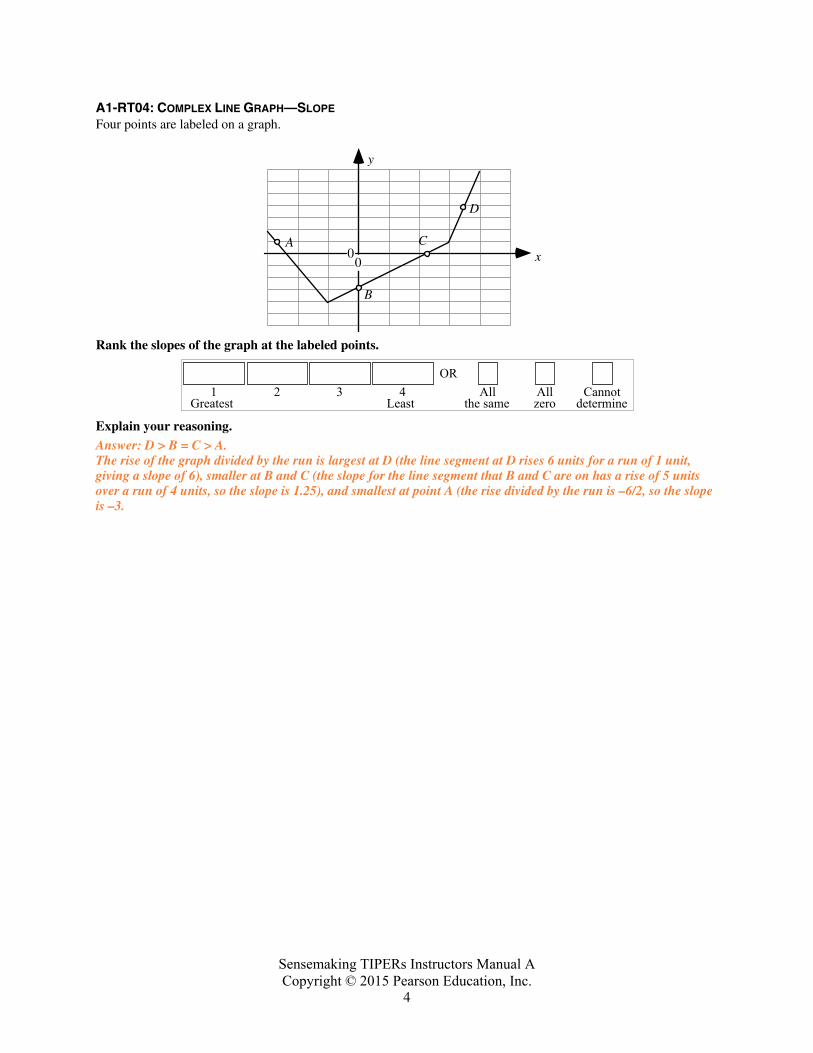
A1-RT04: COMPLEX LINE GRAPH—SLOPE Four points are labeled on a graph.
x
y
A
B
C
D
00
Rank the slopes of the graph at the labeled points.
Greatest1
ORAll
the sameAllzero
Cannotdetermine
2 3 4Least
Explain your reasoning. Answer: D > B = C > A. The rise of the graph divided by the run is largest at D (the line segment at D rises 6 units for a run of 1 unit, giving a slope of 6), smaller at B and C (the slope for the line segment that B and C are on has a rise of 5 units over a run of 4 units, so the slope is 1.25), and smallest at point A (the rise divided by the run is –6/2, so the slope is –3.
Sensemaking TIPERs Instructors Manual A Copyright © 2015 Pearson Education, Inc.
5
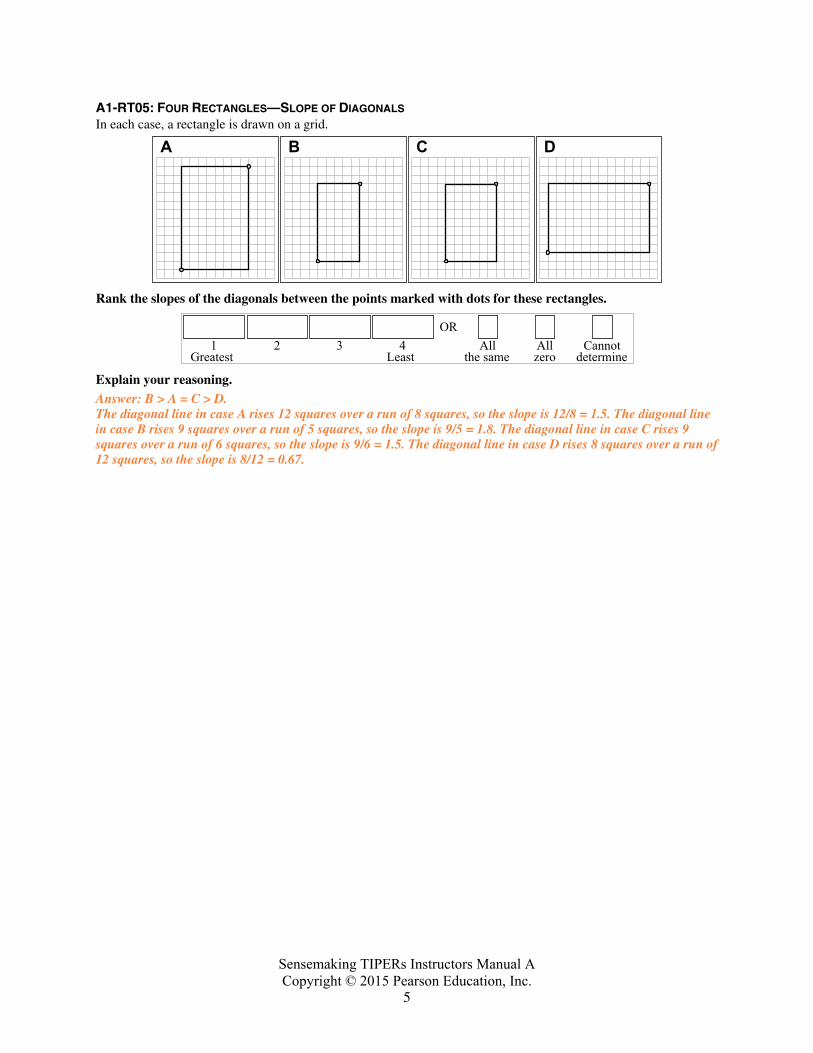
A1-RT05: FOUR RECTANGLES—SLOPE OF DIAGONALS In each case, a rectangle is drawn on a grid.
A B C D
Rank the slopes of the diagonals between the points marked with dots for these rectangles.
Greatest1
ORAll
the sameAllzero
Cannotdetermine
2 3 4Least
Explain your reasoning. Answer: B > A = C > D. The diagonal line in case A rises 12 squares over a run of 8 squares, so the slope is 12/8 = 1.5. The diagonal line in case B rises 9 squares over a run of 5 squares, so the slope is 9/5 = 1.8. The diagonal line in case C rises 9 squares over a run of 6 squares, so the slope is 9/6 = 1.5. The diagonal line in case D rises 8 squares over a run of 12 squares, so the slope is 8/12 = 0.67.
Sensemaking TIPERs Instructors Manual A Copyright © 2015 Pearson Education, Inc.
6
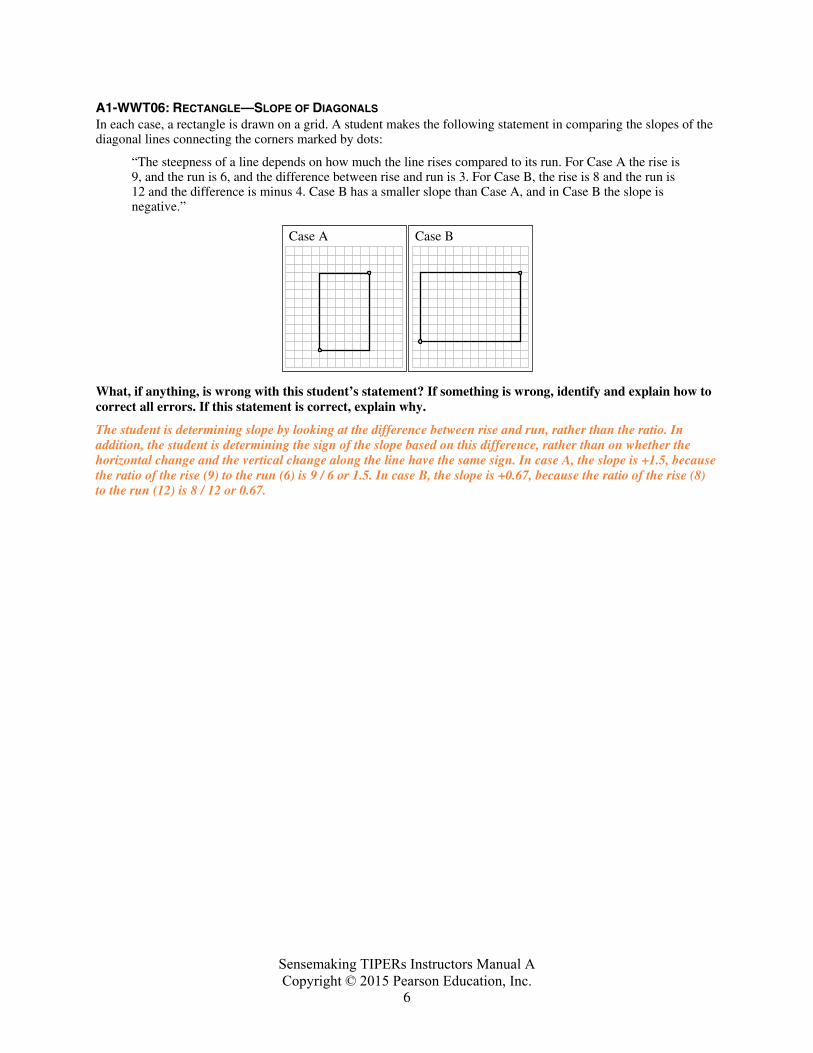
A1-WWT06: RECTANGLE—SLOPE OF DIAGONALS In each case, a rectangle is drawn on a grid. A student makes the following statement in comparing the slopes of the diagonal lines connecting the corners marked by dots:
“The steepness of a line depends on how much the line rises compared to its run. For Case A the rise is 9, and the run is 6, and the difference between rise and run is 3. For Case B, the rise is 8 and the run is 12 and the difference is minus 4. Case B has a smaller slope than Case A, and in Case B the slope is negative.”
Case A Case B
What, if anything, is wrong with this student’s statement? If something is wrong, identify and explain how to correct all errors. If this statement is correct, explain why.
The student is determining slope by looking at the difference between rise and run, rather than the ratio. In addition, the student is determining the sign of the slope based on this difference, rather than on whether the horizontal change and the vertical change along the line have the same sign. In case A, the slope is +1.5, because the ratio of the rise (9) to the run (6) is 9 / 6 or 1.5. In case B, the slope is +0.67, because the ratio of the rise (8) to the run (12) is 8 / 12 or 0.67.
Sensemaking TIPERs Instructors Manual A Copyright © 2015 Pearson Education, Inc.
7
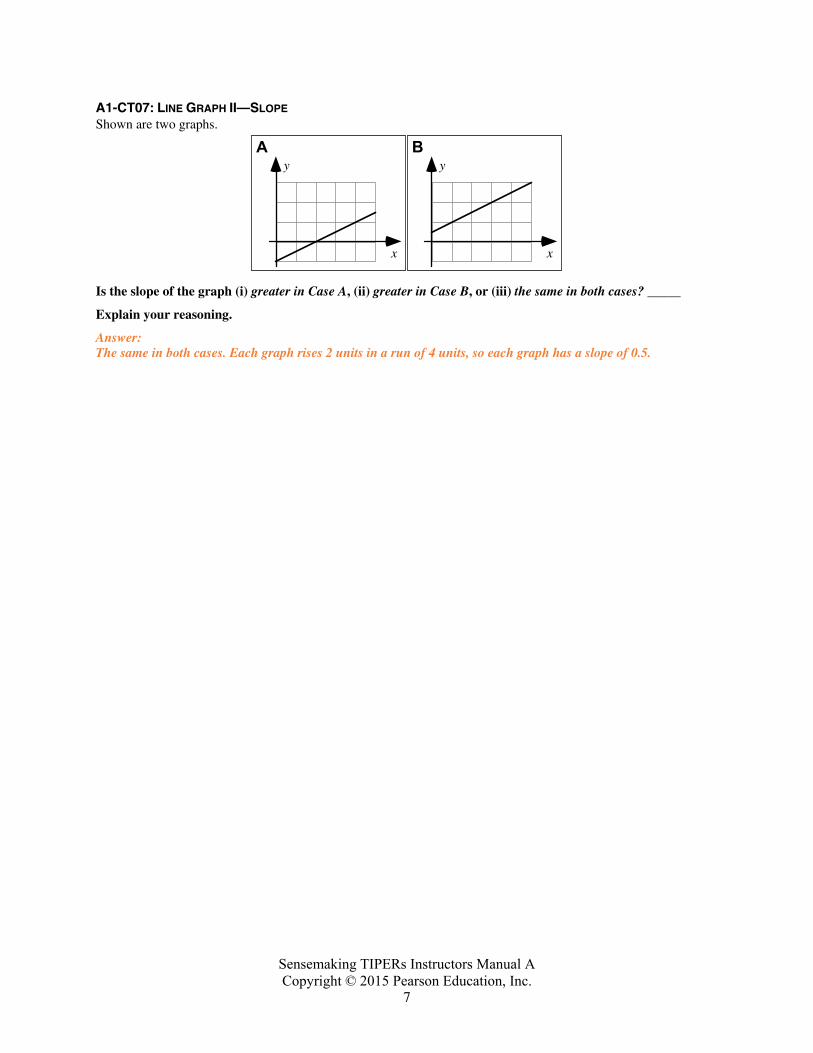
A1-CT07: LINE GRAPH II—SLOPE Shown are two graphs.
x
yA
x
yB
Is the slope of the graph (i) greater in Case A, (ii) greater in Case B, or (iii) the same in both cases? _____
Explain your reasoning.
Answer: The same in both cases. Each graph rises 2 units in a run of 4 units, so each graph has a slope of 0.5.
Sensemaking TIPERs Instructors Manual A Copyright © 2015 Pearson Education, Inc.
8
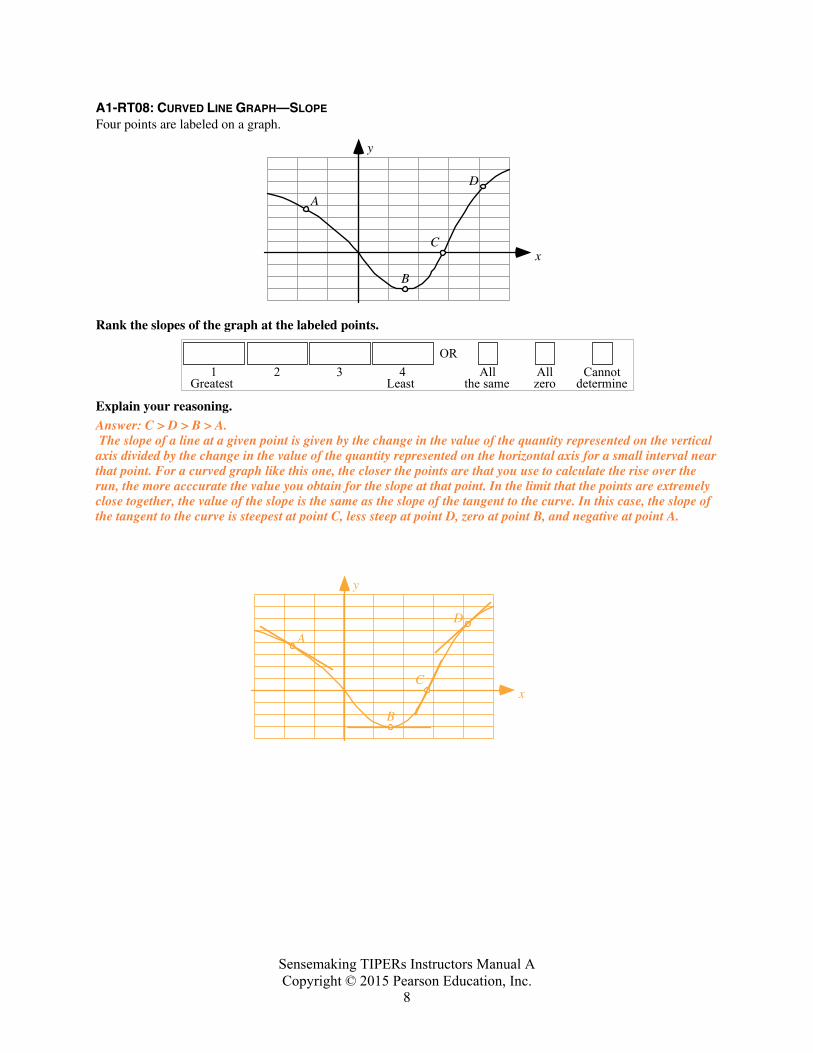
A1-RT08: CURVED LINE GRAPH—SLOPE Four points are labeled on a graph.
x
y
A
B
C
D
Rank the slopes of the graph at the labeled points.
Greatest1
ORAll
the sameAllzero
Cannotdetermine
2 3 4Least
Explain your reasoning. Answer: C > D > B > A. The slope of a line at a given point is given by the change in the value of the quantity represented on the vertical axis divided by the change in the value of the quantity represented on the horizontal axis for a small interval near that point. For a curved graph like this one, the closer the points are that you use to calculate the rise over the run, the more acccurate the value you obtain for the slope at that point. In the limit that the points are extremely close together, the value of the slope is the same as the slope of the tangent to the curve. In this case, the slope of the tangent to the curve is steepest at point C, less steep at point D, zero at point B, and negative at point A.
x
y
A
B
C
D
Sensemaking TIPERs Instructors Manual A Copyright © 2015 Pearson Education, Inc.
9
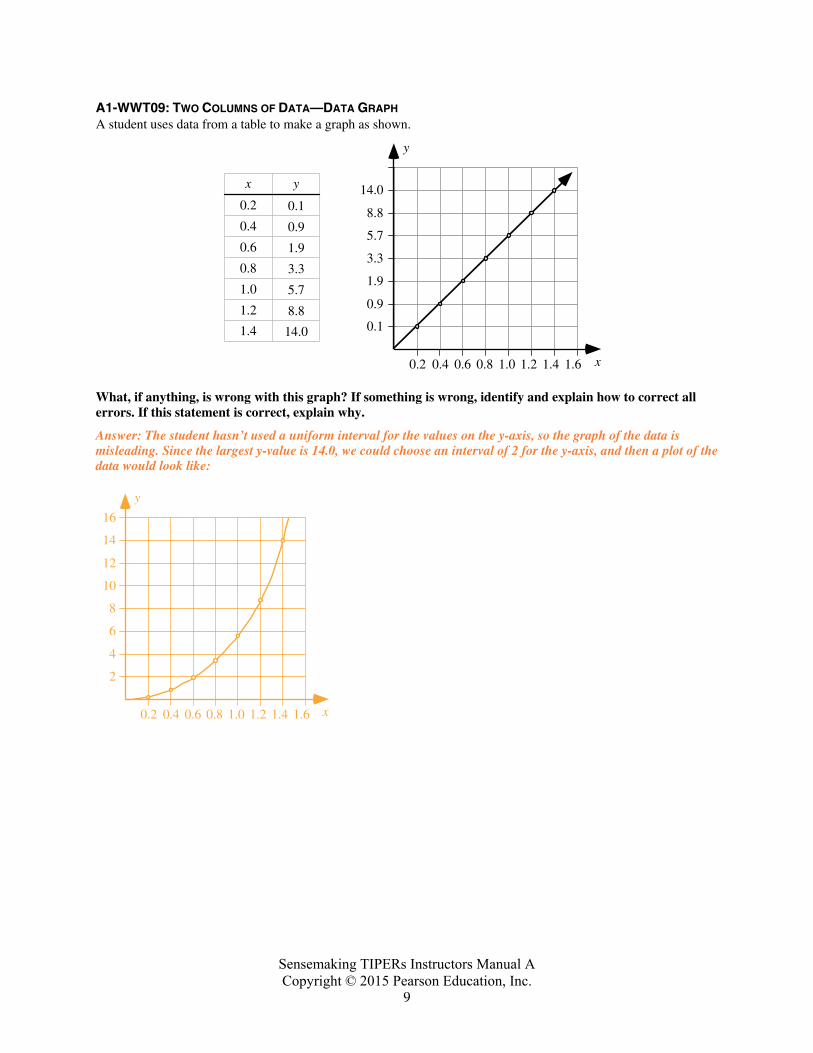
A1-WWT09: TWO COLUMNS OF DATA—DATA GRAPH A student uses data from a table to make a graph as shown.
x y
0.2
0.4
0.6
0.8
1.0
1.2
1.4
0.1
0.9
1.9
3.3
5.7
8.8
14.0
0.2 0.4 0.6 0.8 1.0 1.2 1.4 1.6
0.1
0.9
y
x
1.9
3.3
5.7
8.8
14.0
What, if anything, is wrong with this graph? If something is wrong, identify and explain how to correct all errors. If this statement is correct, explain why.
Answer: The student hasn’t used a uniform interval for the values on the y-axis, so the graph of the data is misleading. Since the largest y-value is 14.0, we could choose an interval of 2 for the y-axis, and then a plot of the data would look like:
0.2 0.4 0.6 0.8 1.0 1.2 1.4 1.6
2
4
y
x
6
8
10
12
14
16
Sensemaking TIPERs Instructors Manual A Copyright © 2015 Pearson Education, Inc.
10
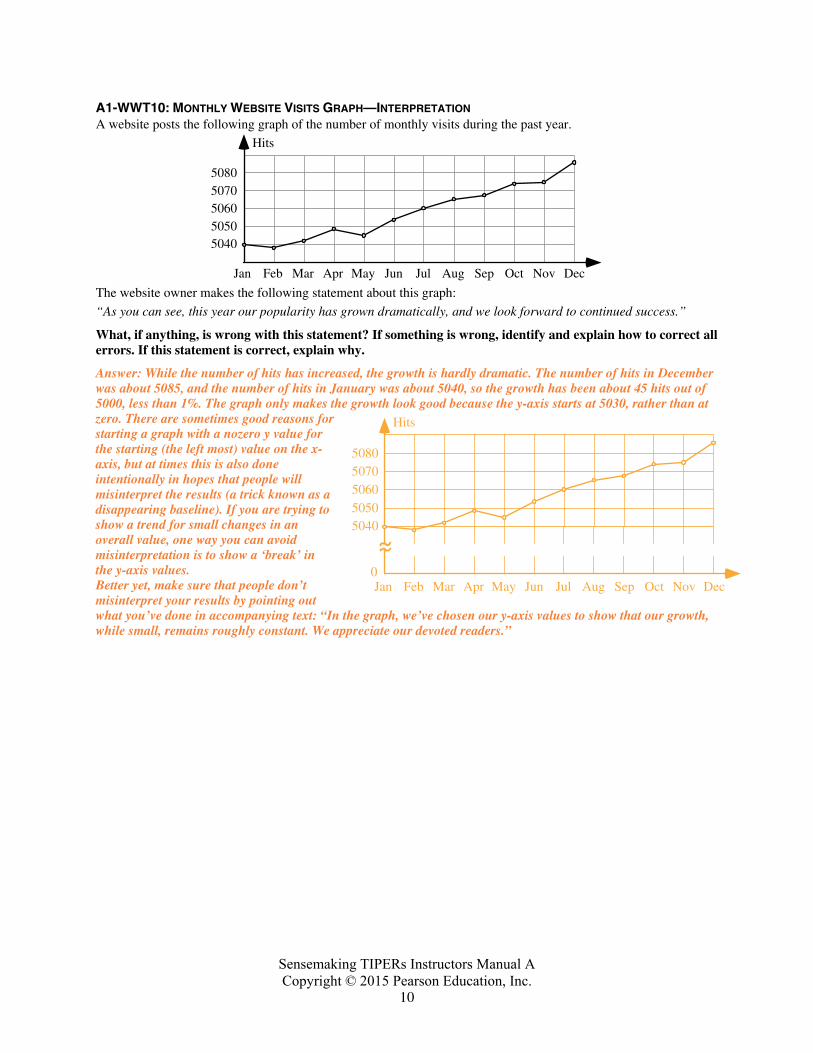
A1-WWT10: MONTHLY WEBSITE VISITS GRAPH—INTERPRETATION A website posts the following graph of the number of monthly visits during the past year.
Hits
Jan
50405050506050705080
Feb Mar Apr May Jun Jul Aug Sep Oct Nov Dec
The website owner makes the following statement about this graph:
“As you can see, this year our popularity has grown dramatically, and we look forward to continued success.”
What, if anything, is wrong with this statement? If something is wrong, identify and explain how to correct all errors. If this statement is correct, explain why.
Answer: While the number of hits has increased, the growth is hardly dramatic. The number of hits in December was about 5085, and the number of hits in January was about 5040, so the growth has been about 45 hits out of 5000, less than 1%. The graph only makes the growth look good because the y-axis starts at 5030, rather than at zero. There are sometimes good reasons for starting a graph with a nozero y value for the starting (the left most) value on the x-axis, but at times this is also done intentionally in hopes that people will misinterpret the results (a trick known as a disappearing baseline). If you are trying to show a trend for small changes in an overall value, one way you can avoid misinterpretation is to show a ‘break’ in the y-axis values. Better yet, make sure that people don’t misinterpret your results by pointing out what you’ve done in accompanying text: “In the graph, we’ve chosen our y-axis values to show that our growth, while small, remains roughly constant. We appreciate our devoted readers.”
Hits
Jan
50405050506050705080
Feb Mar Apr May Jun Jul Aug Sep Oct Nov Dec0
Sensemaking TIPERs Instructors Manual A Copyright © 2015 Pearson Education, Inc.
11
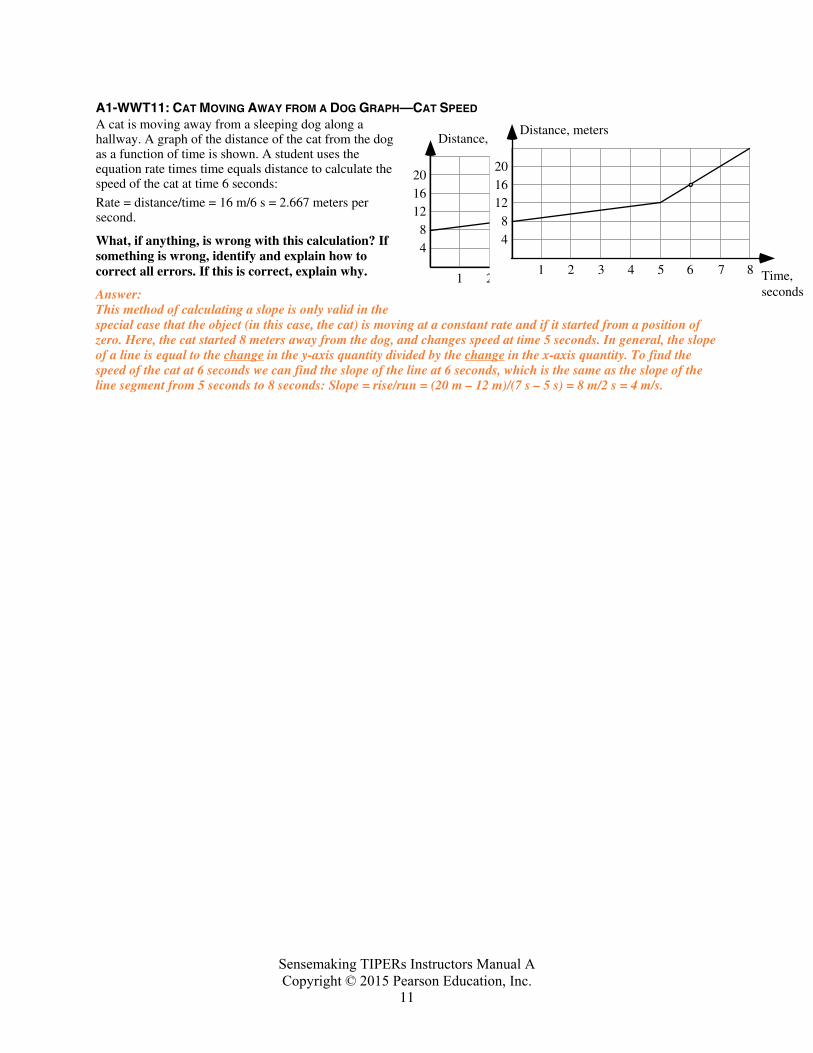
A1-WWT11: CAT MOVING AWAY FROM A DOG GRAPH—CAT SPEED A cat is moving away from a sleeping dog along a hallway. A graph of the distance of the cat from the dog as a function of time is shown. A student uses the equation rate times time equals distance to calculate the speed of the cat at time 6 seconds:
Rate = distance/time = 16 m/6 s = 2.667 meters per second.
What, if anything, is wrong with this calculation? If something is wrong, identify and explain how to correct all errors. If this is correct, explain why.
Answer: This method of calculating a slope is only valid in the special case that the object (in this case, the cat) is moving at a constant rate and if it started from a position of zero. Here, the cat started 8 meters away from the dog, and changes speed at time 5 seconds. In general, the slope of a line is equal to the change in the y-axis quantity divided by the change in the x-axis quantity. To find the speed of the cat at 6 seconds we can find the slope of the line at 6 seconds, which is the same as the slope of the line segment from 5 seconds to 8 seconds: Slope = rise/run = (20 m – 12 m)/(7 s – 5 s) = 8 m/2 s = 4 m/s.
Distance, meters
Time,seconds
1 2 3 4 5 6 7 8
48
121620
Distance, meters
Time,seconds
1 2 3 4 5 6 7 8
48
121620
Sensemaking TIPERs Instructors Manual A Copyright © 2015 Pearson Education, Inc.
12
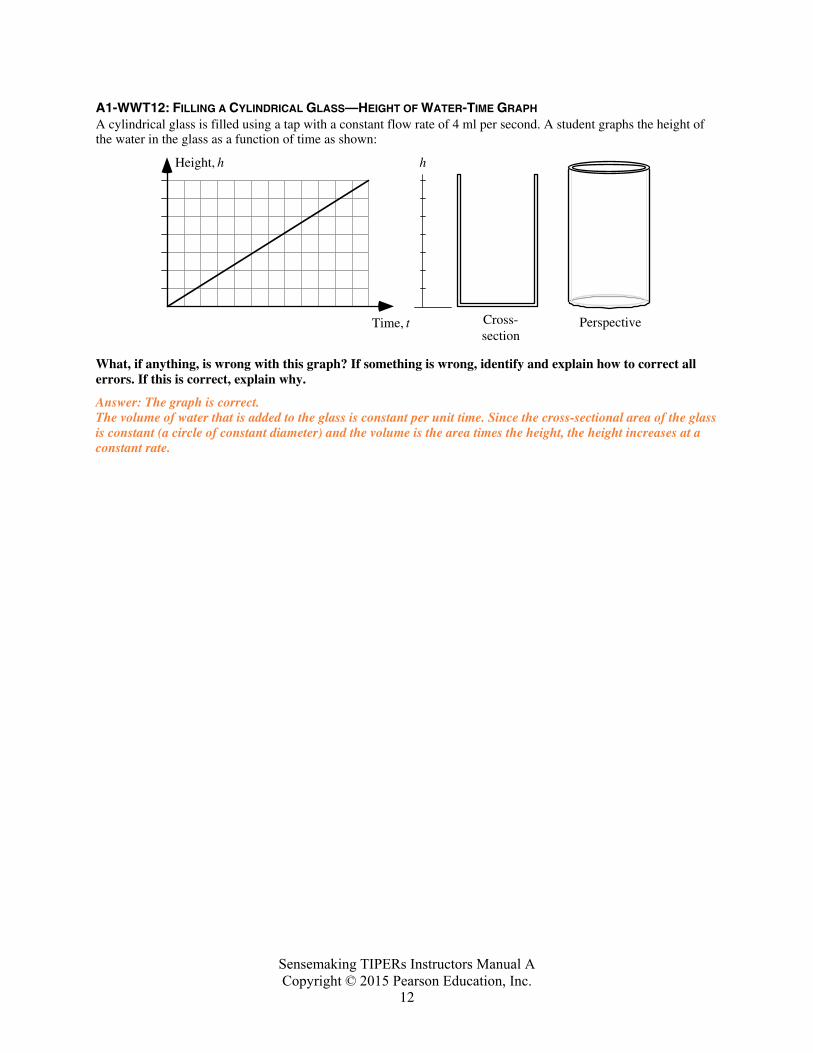
A1-WWT12: FILLING A CYLINDRICAL GLASS—HEIGHT OF WATER-TIME GRAPH A cylindrical glass is filled using a tap with a constant flow rate of 4 ml per second. A student graphs the height of the water in the glass as a function of time as shown:
Cross-section
Perspective
hHeight, h
Time, t
What, if anything, is wrong with this graph? If something is wrong, identify and explain how to correct all errors. If this is correct, explain why.
Answer: The graph is correct. The volume of water that is added to the glass is constant per unit time. Since the cross-sectional area of the glass is constant (a circle of constant diameter) and the volume is the area times the height, the height increases at a constant rate.
Sensemaking TIPERs Instructors Manual A Copyright © 2015 Pearson Education, Inc.
13
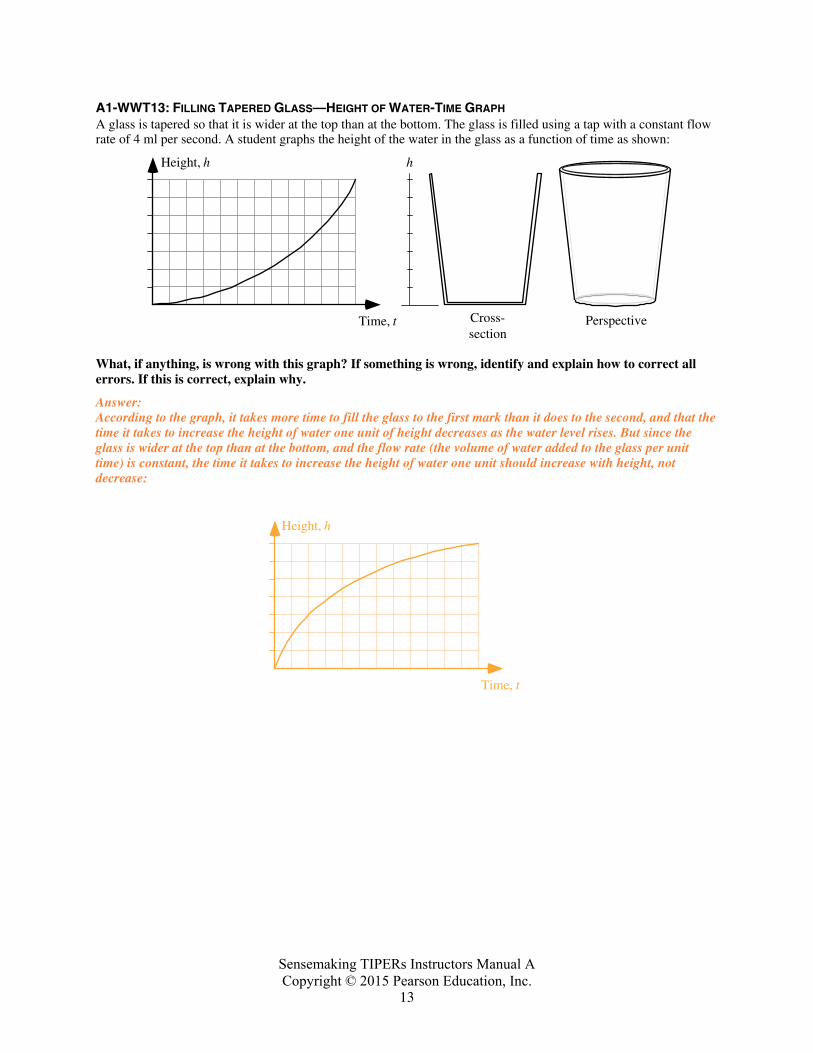
A1-WWT13: FILLING TAPERED GLASS—HEIGHT OF WATER-TIME GRAPH A glass is tapered so that it is wider at the top than at the bottom. The glass is filled using a tap with a constant flow rate of 4 ml per second. A student graphs the height of the water in the glass as a function of time as shown:
Cross-section
Perspective
hHeight, h
Time, t
What, if anything, is wrong with this graph? If something is wrong, identify and explain how to correct all errors. If this is correct, explain why.
Answer: According to the graph, it takes more time to fill the glass to the first mark than it does to the second, and that the time it takes to increase the height of water one unit of height decreases as the water level rises. But since the glass is wider at the top than at the bottom, and the flow rate (the volume of water added to the glass per unit time) is constant, the time it takes to increase the height of water one unit should increase with height, not decrease:
Height, h
Time, t
Sensemaking TIPERs Instructors Manual A Copyright © 2015 Pearson Education, Inc.
14
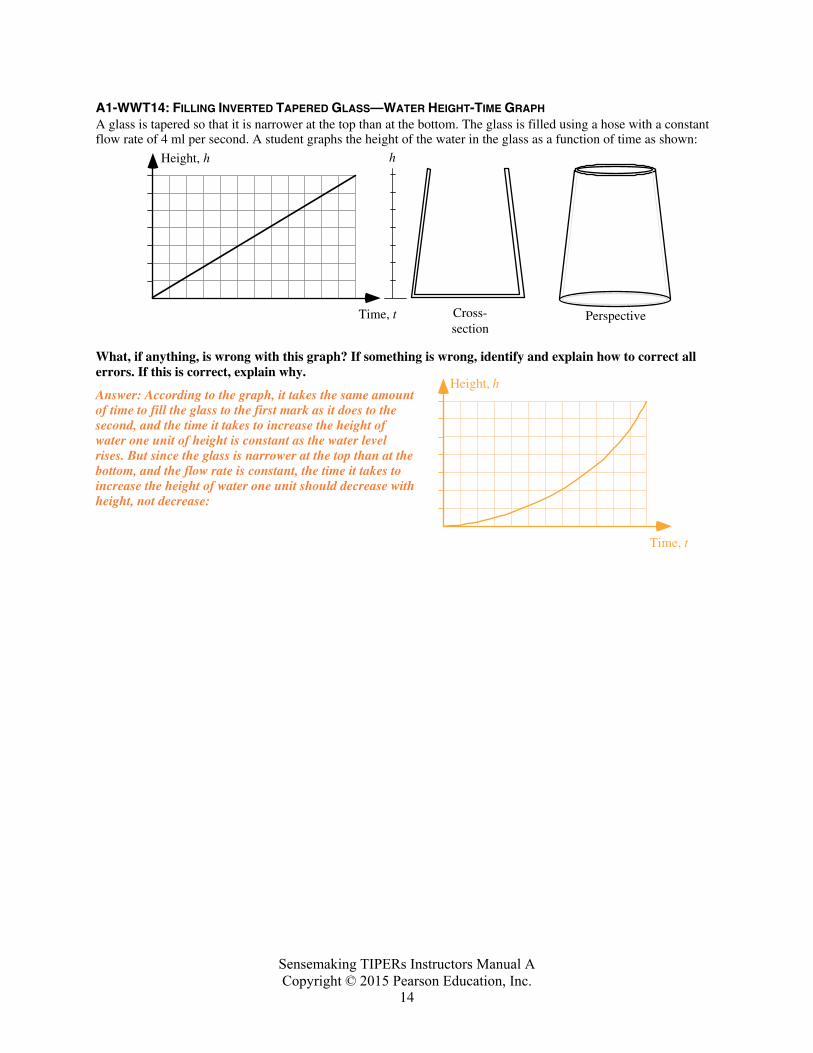
A1-WWT14: FILLING INVERTED TAPERED GLASS—WATER HEIGHT-TIME GRAPH A glass is tapered so that it is narrower at the top than at the bottom. The glass is filled using a hose with a constant flow rate of 4 ml per second. A student graphs the height of the water in the glass as a function of time as shown:
Cross-section
Perspective
hHeight, h
Time, t
What, if anything, is wrong with this graph? If something is wrong, identify and explain how to correct all errors. If this is correct, explain why.
Answer: According to the graph, it takes the same amount of time to fill the glass to the first mark as it does to the second, and the time it takes to increase the height of water one unit of height is constant as the water level rises. But since the glass is narrower at the top than at the bottom, and the flow rate is constant, the time it takes to increase the height of water one unit should decrease with height, not decrease:
Height, h
Time, t
Sensemaking TIPERs Instructors Manual A Copyright © 2015 Pearson Education, Inc.
15
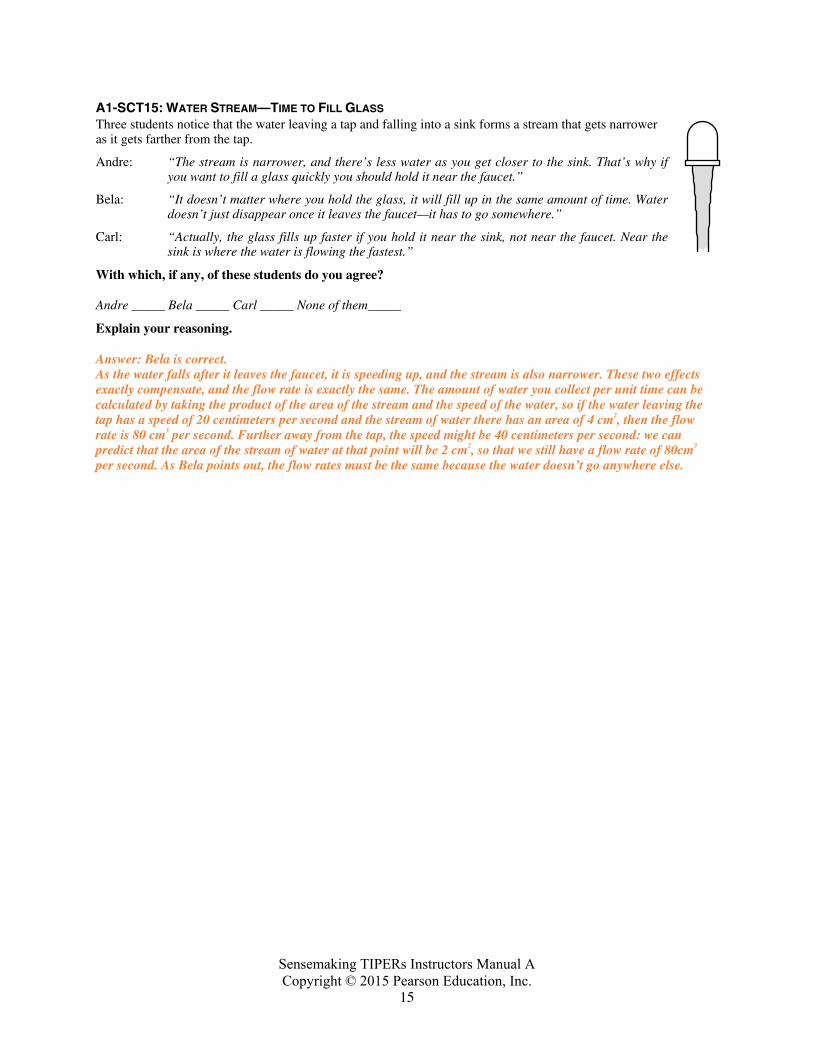
A1-SCT15: WATER STREAM—TIME TO FILL GLASS Three students notice that the water leaving a tap and falling into a sink forms a stream that gets narrower as it gets farther from the tap.
Andre: “The stream is narrower, and there’s less water as you get closer to the sink. That’s why if you want to fill a glass quickly you should hold it near the faucet.”
Bela: “It doesn’t matter where you hold the glass, it will fill up in the same amount of time. Water doesn’t just disappear once it leaves the faucet—it has to go somewhere.”
Carl: “Actually, the glass fills up faster if you hold it near the sink, not near the faucet. Near the sink is where the water is flowing the fastest.”
With which, if any, of these students do you agree?
Andre _____ Bela _____ Carl _____ None of them_____
Explain your reasoning.
Answer: Bela is correct. As the water falls after it leaves the faucet, it is speeding up, and the stream is also narrower. These two effects exactly compensate, and the flow rate is exactly the same. The amount of water you collect per unit time can be calculated by taking the product of the area of the stream and the speed of the water, so if the water leaving the tap has a speed of 20 centimeters per second and the stream of water there has an area of 4 cm2, then the flow rate is 80 cm3 per second. Further away from the tap, the speed might be 40 centimeters per second: we can predict that the area of the stream of water at that point will be 2 cm2, so that we still have a flow rate of 80cm3 per second. As Bela points out, the flow rates must be the same because the water doesn’t go anywhere else.
Sensemaking TIPERs Instructors Manual A Copyright © 2015 Pearson Education, Inc.
16
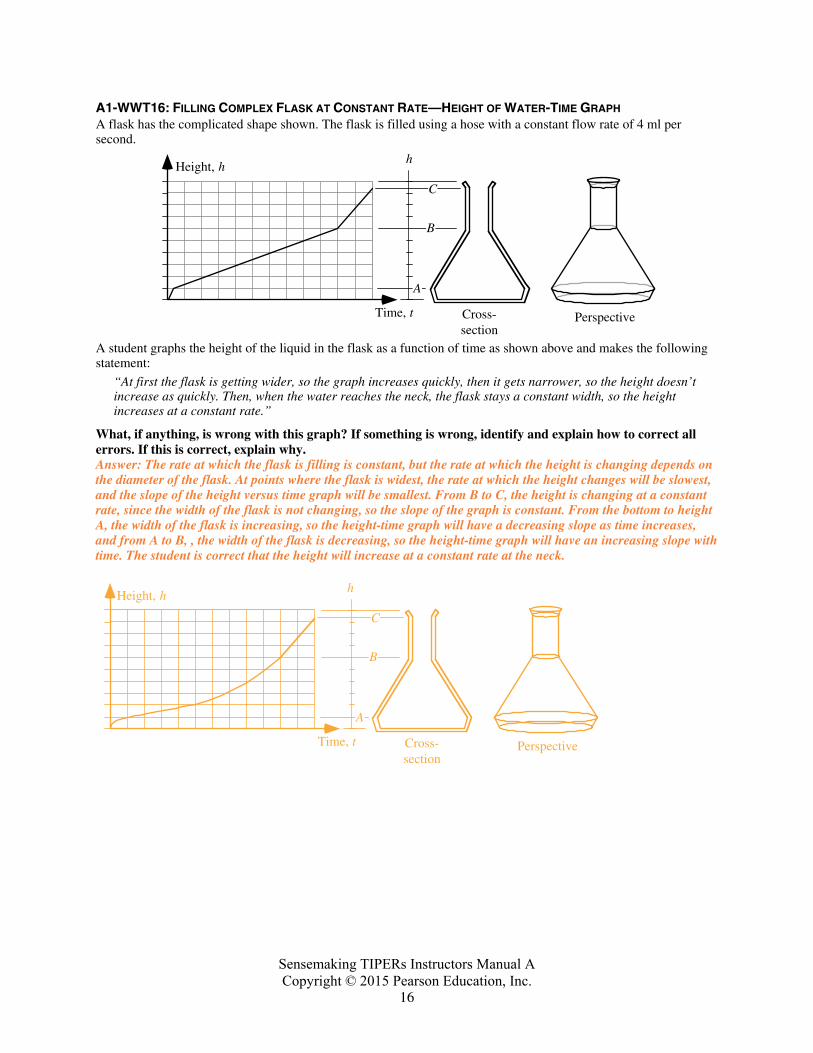
A1-WWT16: FILLING COMPLEX FLASK AT CONSTANT RATE—HEIGHT OF WATER-TIME GRAPH A flask has the complicated shape shown. The flask is filled using a hose with a constant flow rate of 4 ml per second.
Cross-section
Perspective
hHeight, h
Time, t
C
B
A
A student graphs the height of the liquid in the flask as a function of time as shown above and makes the following statement:
“At first the flask is getting wider, so the graph increases quickly, then it gets narrower, so the height doesn’t increase as quickly. Then, when the water reaches the neck, the flask stays a constant width, so the height increases at a constant rate.”
What, if anything, is wrong with this graph? If something is wrong, identify and explain how to correct all errors. If this is correct, explain why. Answer: The rate at which the flask is filling is constant, but the rate at which the height is changing depends on the diameter of the flask. At points where the flask is widest, the rate at which the height changes will be slowest, and the slope of the height versus time graph will be smallest. From B to C, the height is changing at a constant rate, since the width of the flask is not changing, so the slope of the graph is constant. From the bottom to height A, the width of the flask is increasing, so the height-time graph will have a decreasing slope as time increases, and from A to B, , the width of the flask is decreasing, so the height-time graph will have an increasing slope with time. The student is correct that the height will increase at a constant rate at the neck.
Cross-section
Perspective
hHeight, h
Time, t
C
B
A
Sensemaking TIPERs Instructors Manual A Copyright © 2015 Pearson Education, Inc.
17
A1-WWT17: CARS AND TRUCKS IN PARKING LOT—STATEMENT A student is told that the equation 3y = x represents the statement:
“There are three times as many cars as pickup trucks in the parking lot.” She says, “The letter x represents the cars, and the letter y represents the pickups.”
What, if anything, is wrong? If something is wrong, identify and explain how to correct all errors. If this is correct, explain why. Answer: This statement is almost correct: x and y are variables in this equation, and as such, they represent the number of cars and the number of trucks. (They are not labels for the cars or for the trucks.) For example, there might be 50 pickup trucks in the parking lot, in which case we would expect 150 cars in the parking lot. If y = 50 and x = 150 (so that x represents the number of cars and y represents the number of trucks), then 3y = x is a correct equation.
Sensemaking TIPERs Instructors Manual A Copyright © 2015 Pearson Education, Inc.
18
A1-SCT18: INCHES AND FEET—EQUATION To express the relationship between inches and feet, someone writes “12I = 1F.” Three students discussing this relation state:
Amy: “The letter I is used as a unit in this case. There aren’t any variables in this equation.”
Bea: “The letter I is a variable and represents the number of inches.”
Cari: “That can’t be right, because if I let I equal 12 inches, then I get 144 inches equals 1F. And there are only 12 inches in a foot.”
With which, if any, of these students do you agree?
Amy _____ Bea _____ Cari _____ None of them_____ Explain your reasoning.
Answer: Amy and Cari are both correct. If I were used as a variable, then it would be a placeholder in the equation for the number of inches, and F used as a variable would be a placeholder for the number of feet. Then to show the equivalence between (for example) 5 feet and 60 inches, we might write 12F = 1I. But as Cari correctly points out, the relationship as written is incorrect. If I is used as a unit, instead of as a variable, then it is true that 12 inches is equivalent to 1 foot. So Amy would be correct. Unfortunately, we use the same symbol – the equals sign – to represent the equivalence between a foot and 12 inches as we do to represent a true equality!
Sensemaking TIPERs Instructors Manual A Copyright © 2015 Pearson Education, Inc.
19
A1-WWT19: BOYS AND GIRLS ON DANCE FLOOR—EQUATION A student is asked to represent the statement “For every 5 girls on the dance floor there are 3 boys” using G to represent the number of girls and B to represent the number of boys. He writes 5G = 3B.
What, if anything, is wrong? If something is wrong, identify and explain how to correct all errors. If this is correct, explain why.
Answer: The equation the student has written is incorrect. There are more girls than boys on the dance floor, so if there are (for example) 50 girls, we would expect there to be 30 boys. But if we let G represent the number of girls and B the number of boys, and we substitute these numbers into the equation the student has written, we get 5(50) on the left hand side, and 3(30) on the right hand side, and 250 is not equal to 90! A correct equation to represent this statement is 3G = 5B.
Sensemaking TIPERs Instructors Manual A Copyright © 2015 Pearson Education, Inc.
20
A1-WWT20: STUDENTS AND TEACHERS—EQUATION A student is asked to represent the statement “There are 42 more students than teachers in the classroom” using S for the number of students and T for the number of teachers. She writes S = T + 42.
What, if anything, is wrong? If something is wrong, identify and explain how to correct all errors. If this is correct, explain why.
Answer: This equation is correct, and there is nothing wrong. If there are (for example) 3 teachers and 45 students in the classroom, then there are indeed 42 more students than teachers. And if we let T represent the number of teachers and S represent the number of students, then T = 3 and S = 45, and S = T + 42.
Sensemaking TIPERs Instructors Manual A Copyright © 2015 Pearson Education, Inc.
21
A1-WWT21: TEXTING AND COST—STATEMENT A student is told that the equation 7y = 4x represents the statement “For every 7 hours of texting I get charged 4 dollars.” She says, “The letter x represents the number of hours of texting, and the letter y represents the number of dollars I am charged.”
What, if anything, is wrong? If something is wrong, identify and explain how to correct all errors. If this is correct, explain why.
Answer: The interpretation the student has given for this equation is correct. Since for 7 hours of texting the student is charged less than 7 dollars, we expect the number of dollars to be less than the number of hours. If we let x represent the number of hours and y the number of dollars, and we plug these numbers into the equation, we can check the meaning for 1 hour: x = 1, and the equation gives us 7y = 4(1), which leads to y (the number of dollars) = 4/7, or 0.57 dollars (57 cents). Conversely, if we let y = 1, we find x = 7/4 = 1.75, meaning the student can text for 1 hour and 45 minutes for every dollar spent.
Sensemaking TIPERs Instructors Manual A Copyright © 2015 Pearson Education, Inc.
22
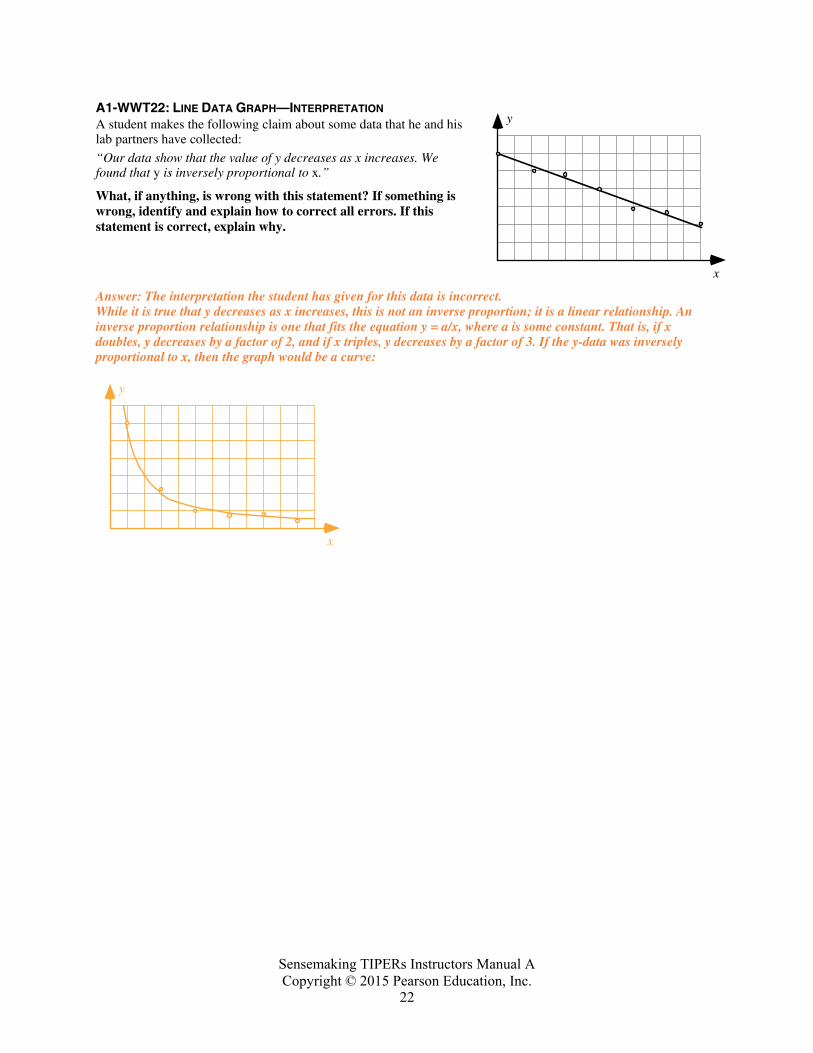
A1-WWT22: LINE DATA GRAPH—INTERPRETATION A student makes the following claim about some data that he and his lab partners have collected:
“Our data show that the value of y decreases as x increases. We found that y is inversely proportional to x.”
What, if anything, is wrong with this statement? If something is wrong, identify and explain how to correct all errors. If this statement is correct, explain why.
Answer: The interpretation the student has given for this data is incorrect. While it is true that y decreases as x increases, this is not an inverse proportion; it is a linear relationship. An inverse proportion relationship is one that fits the equation y = a/x, where a is some constant. That is, if x doubles, y decreases by a factor of 2, and if x triples, y decreases by a factor of 3. If the y-data was inversely proportional to x, then the graph would be a curve:
y
x
y
x
Sensemaking TIPERs Instructors Manual A Copyright © 2015 Pearson Education, Inc.
23
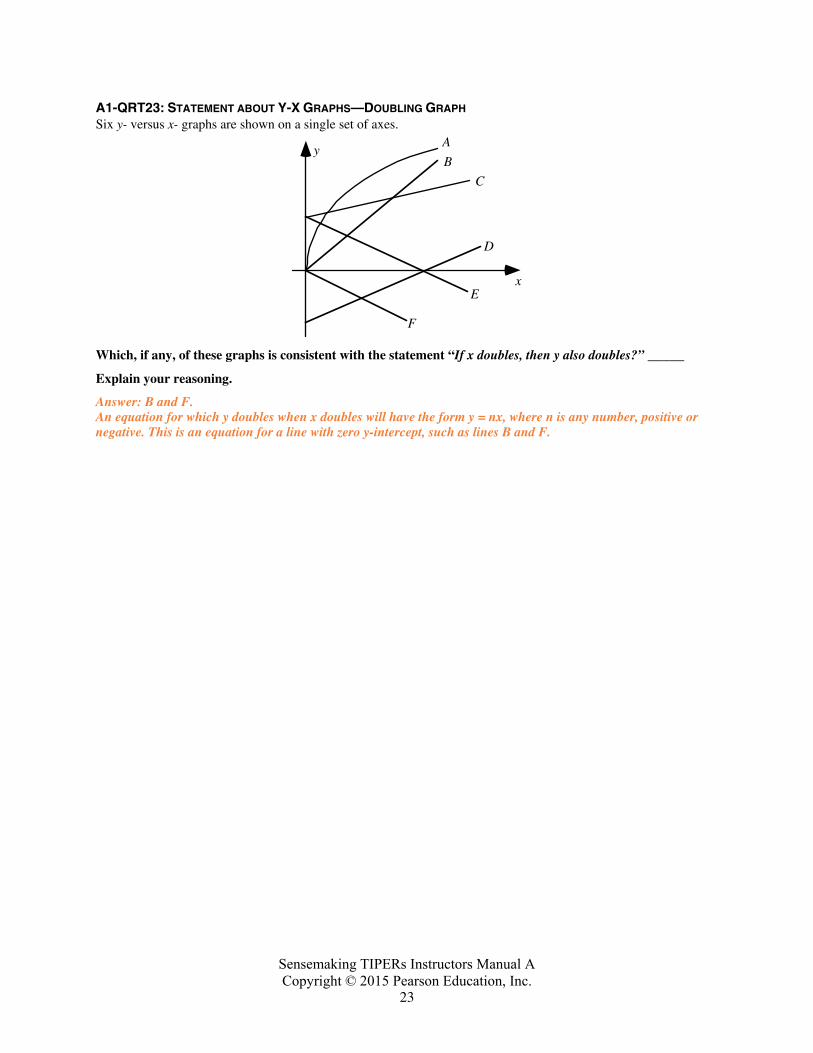
A1-QRT23: STATEMENT ABOUT Y-X GRAPHS—DOUBLING GRAPH Six y- versus x- graphs are shown on a single set of axes.
y
x
A
B
C
D
E
F
Which, if any, of these graphs is consistent with the statement “If x doubles, then y also doubles?” _____
Explain your reasoning.
Answer: B and F. An equation for which y doubles when x doubles will have the form y = nx, where n is any number, positive or negative. This is an equation for a line with zero y-intercept, such as lines B and F.
Sensemaking TIPERs Instructors Manual A Copyright © 2015 Pearson Education, Inc.
24
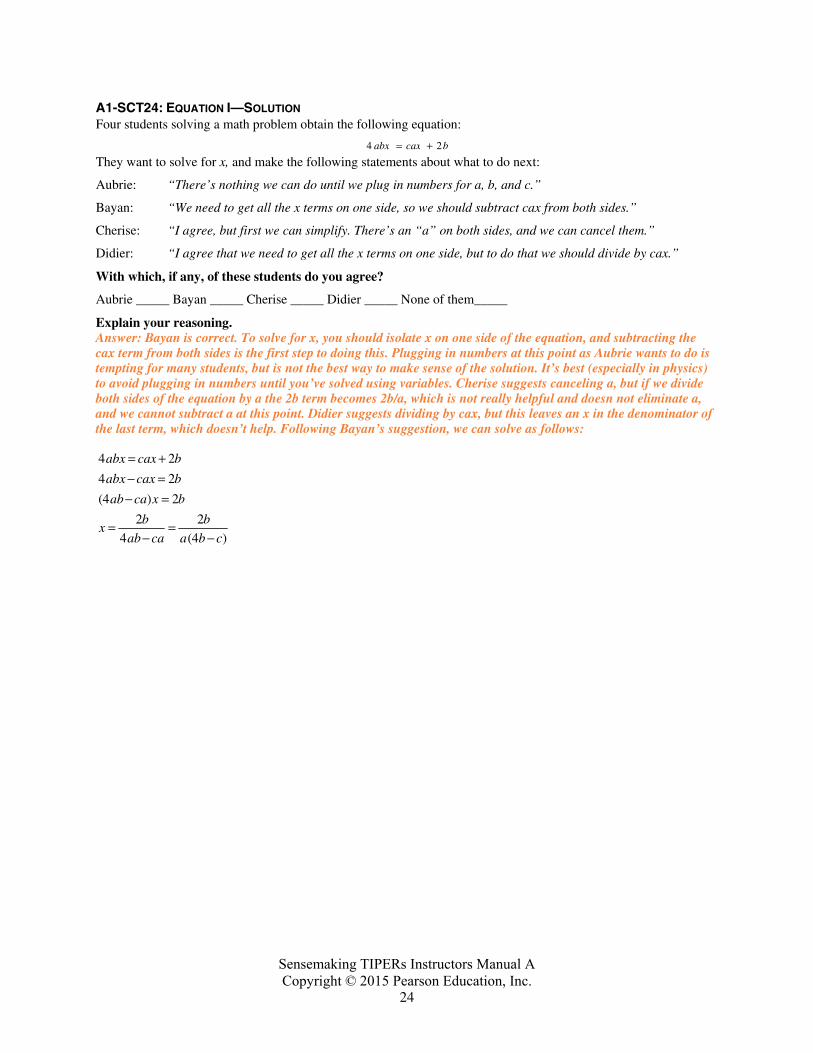
A1-SCT24: EQUATION I—SOLUTION Four students solving a math problem obtain the following equation:
4 abx = cax + 2b They want to solve for x, and make the following statements about what to do next:
Aubrie: “There’s nothing we can do until we plug in numbers for a, b, and c.”
Bayan: “We need to get all the x terms on one side, so we should subtract cax from both sides.”
Cherise: “I agree, but first we can simplify. There’s an “a” on both sides, and we can cancel them.”
Didier: “I agree that we need to get all the x terms on one side, but to do that we should divide by cax.”
With which, if any, of these students do you agree?
Aubrie _____ Bayan _____ Cherise _____ Didier _____ None of them_____
Explain your reasoning. Answer: Bayan is correct. To solve for x, you should isolate x on one side of the equation, and subtracting the cax term from both sides is the first step to doing this. Plugging in numbers at this point as Aubrie wants to do is tempting for many students, but is not the best way to make sense of the solution. It’s best (especially in physics) to avoid plugging in numbers until you’ve solved using variables. Cherise suggests canceling a, but if we divide both sides of the equation by a the 2b term becomes 2b/a, which is not really helpful and doesn not eliminate a, and we cannot subtract a at this point. Didier suggests dividing by cax, but this leaves an x in the denominator of the last term, which doesn’t help. Following Bayan’s suggestion, we can solve as follows: 4abx = cax + 2b
4abx − cax = 2b
(4ab− ca)x = 2b
x = 2b
4ab− ca= 2b
a(4b − c)
Sensemaking TIPERs Instructors Manual A Copyright © 2015 Pearson Education, Inc.
25
A1-SCT25: EQUATION II—UNITS ANALYSIS Four students solving a math problem obtain the following equation:
4 abx = cax + 2b
They are not sure the equation is reasonable, and make the following statements about the units:
Alan: “I don’t think this can work because the different variables should have different units, which means the equation would be inconsistent.”
Bri: “I disagree; I think it could work if a and x are something like m and 1/m.”
Chas: “I agree with Bri, but only if c has the same units as b in addition to what Bri said.”
With which, if any, of these students do you agree? Alan _____ Bri_____ Chas _____ None of them_____
Explain your reasoning.
Answer: Chas is correct. All of the terms—the one on the left of the equal sign and the two that are being added together on the right of the equal sign—must have the same units for the relation to make any sense.
Sensemaking TIPERs Instructors Manual A Copyright © 2015 Pearson Education, Inc.
26
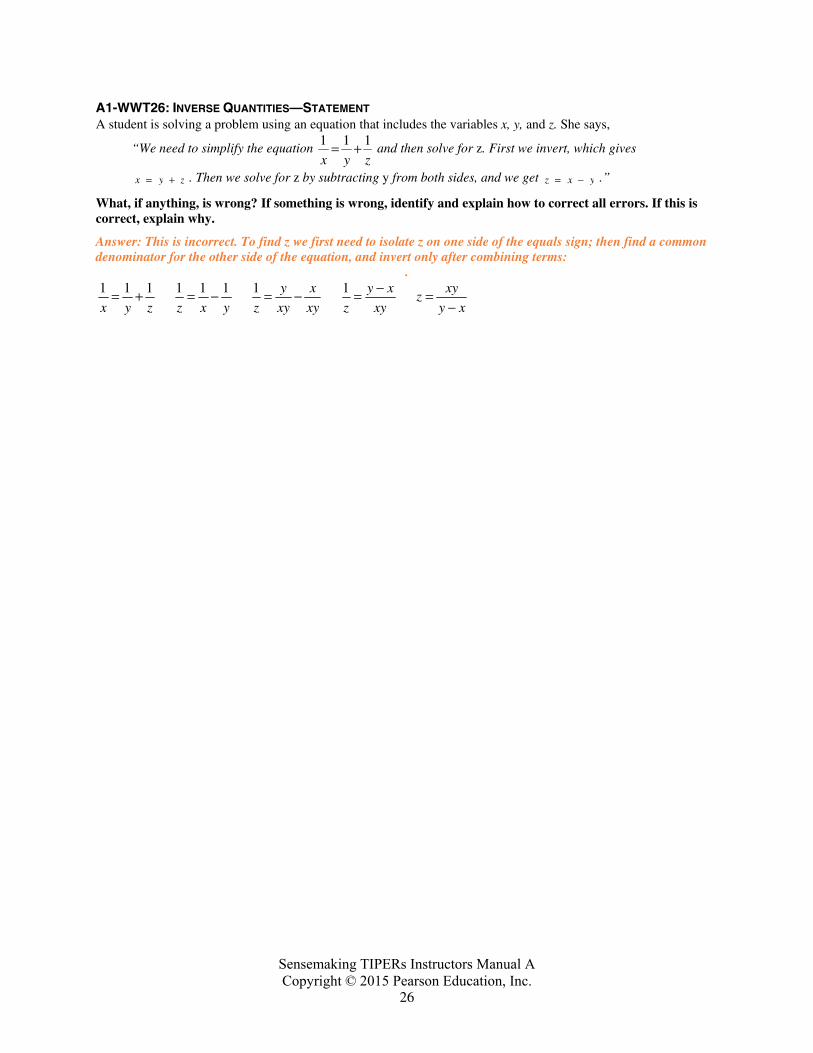
A1-WWT26: INVERSE QUANTITIES—STATEMENT A student is solving a problem using an equation that includes the variables x, y, and z. She says,
“We need to simplify the equation 1
x= 1
y+ 1
z and then solve for z. First we invert, which gives
x = y + z . Then we solve for z by subtracting y from both sides, and we get z = x − y .”
What, if anything, is wrong? If something is wrong, identify and explain how to correct all errors. If this is correct, explain why.
Answer: This is incorrect. To find z we first need to isolate z on one side of the equals sign; then find a common denominator for the other side of the equation, and invert only after combining terms:
. 1
x= 1
y+ 1
z 1
z= 1
x− 1
y 1
z= y
xy− x
xy 1
z= y − x
xy z = xy
y − x
Sensemaking TIPERs Instructors Manual A Copyright © 2015 Pearson Education, Inc.
27
A1-QRT27: STATEMENT—DOUBLING EQUATION
A. y = 2x
B. y = 3x
C. y = 2x + 7
D. y = −4x
E. y = x2
Which, if any, of these equations is consistent with the statement “If x doubles, then y also doubles?”
Explain your reasoning.
Answer: A, B, and D. An equation for which y doubles when x doubles will have the form y = nx, where n is any number, positive or negative. This is an equation for a line with zero y-intercept.
Sensemaking TIPERs Instructors Manual A Copyright © 2015 Pearson Education, Inc.
28
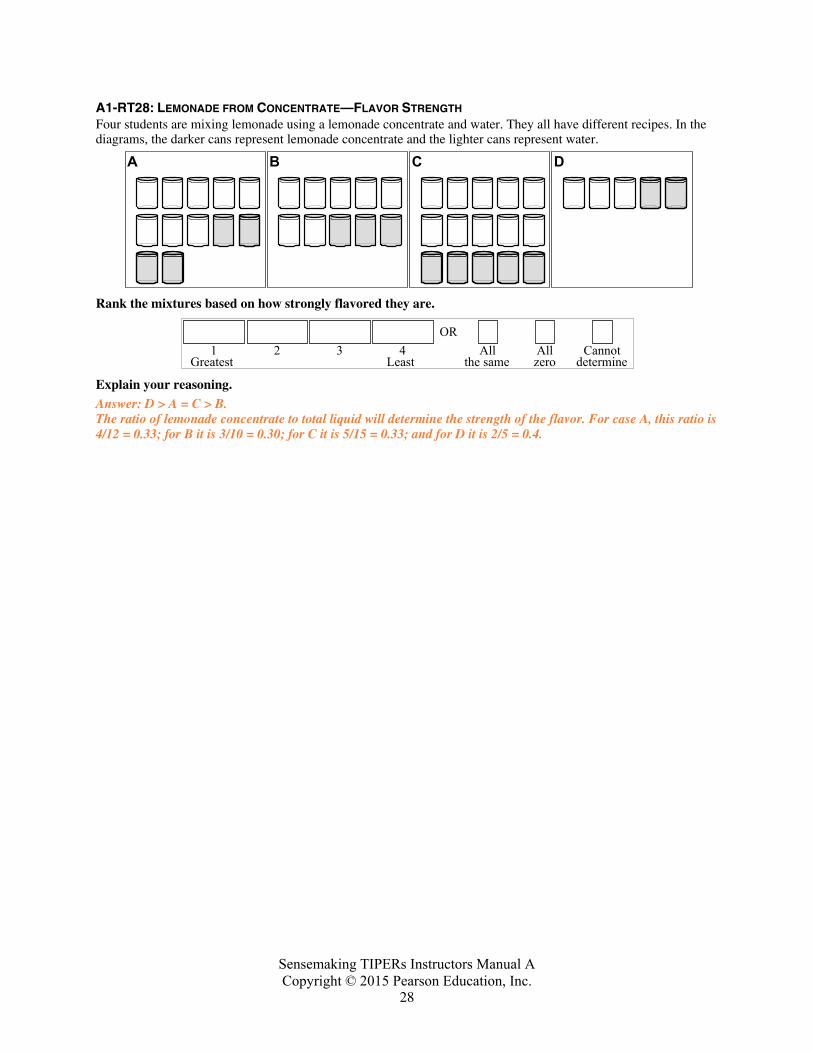
A1-RT28: LEMONADE FROM CONCENTRATE—FLAVOR STRENGTH Four students are mixing lemonade using a lemonade concentrate and water. They all have different recipes. In the diagrams, the darker cans represent lemonade concentrate and the lighter cans represent water.
A B C D
Rank the mixtures based on how strongly flavored they are.
Greatest1
ORAll
the sameAllzero
Cannotdetermine
2 3 4Least
Explain your reasoning. Answer: D > A = C > B. The ratio of lemonade concentrate to total liquid will determine the strength of the flavor. For case A, this ratio is 4/12 = 0.33; for B it is 3/10 = 0.30; for C it is 5/15 = 0.33; and for D it is 2/5 = 0.4.
Sensemaking TIPERs Instructors Manual A Copyright © 2015 Pearson Education, Inc.
29
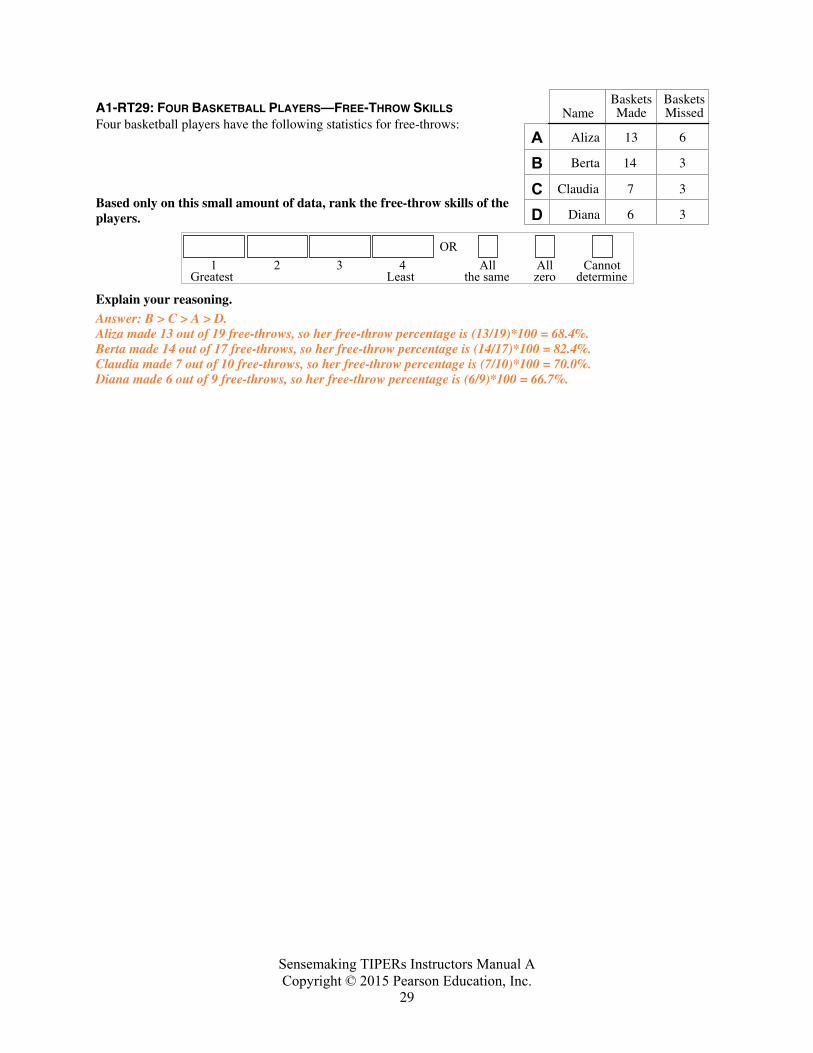
A1-RT29: FOUR BASKETBALL PLAYERS—FREE-THROW SKILLS Four basketball players have the following statistics for free-throws:
Based only on this small amount of data, rank the free-throw skills of the players.
Greatest1
ORAll
the sameAllzero
Cannotdetermine
2 3 4Least
Explain your reasoning. Answer: B > C > A > D. Aliza made 13 out of 19 free-throws, so her free-throw percentage is (13/19)*100 = 68.4%. Berta made 14 out of 17 free-throws, so her free-throw percentage is (14/17)*100 = 82.4%. Claudia made 7 out of 10 free-throws, so her free-throw percentage is (7/10)*100 = 70.0%. Diana made 6 out of 9 free-throws, so her free-throw percentage is (6/9)*100 = 66.7%.
NameBasketsMade
13
14
7
6
ABCD
BasketsMissed
Aliza
Berta
Claudia
Diana
6
3
3
3
Sensemaking TIPERs Instructors Manual A Copyright © 2015 Pearson Education, Inc.
30
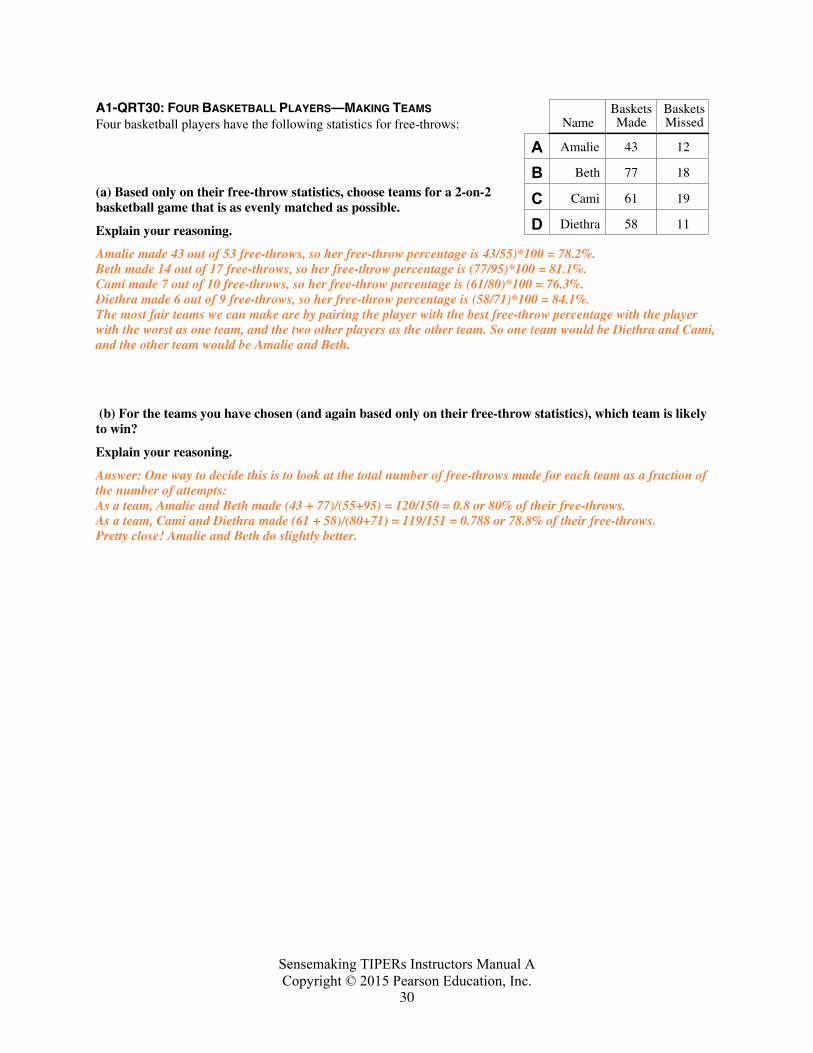
A1-QRT30: FOUR BASKETBALL PLAYERS—MAKING TEAMS Four basketball players have the following statistics for free-throws:
(a) Based only on their free-throw statistics, choose teams for a 2-on-2 basketball game that is as evenly matched as possible.
Explain your reasoning.
Amalie made 43 out of 53 free-throws, so her free-throw percentage is 43/55)*100 = 78.2%. Beth made 14 out of 17 free-throws, so her free-throw percentage is (77/95)*100 = 81.1%. Cami made 7 out of 10 free-throws, so her free-throw percentage is (61/80)*100 = 76.3%. Diethra made 6 out of 9 free-throws, so her free-throw percentage is (58/71)*100 = 84.1%. The most fair teams we can make are by pairing the player with the best free-throw percentage with the player with the worst as one team, and the two other players as the other team. So one team would be Diethra and Cami, and the other team would be Amalie and Beth.
(b) For the teams you have chosen (and again based only on their free-throw statistics), which team is likely to win?
Explain your reasoning.
Answer: One way to decide this is to look at the total number of free-throws made for each team as a fraction of the number of attempts: As a team, Amalie and Beth made (43 + 77)/(55+95) = 120/150 = 0.8 or 80% of their free-throws. As a team, Cami and Diethra made (61 + 58)/(80+71) = 119/151 = 0.788 or 78.8% of their free-throws. Pretty close! Amalie and Beth do slightly better.
NameBasketsMade
43
77
61
58
ABCD
BasketsMissed
Amalie
Beth
Cami
Diethra
12
18
19
11
Sensemaking TIPERs Instructors Manual A Copyright © 2015 Pearson Education, Inc.
31
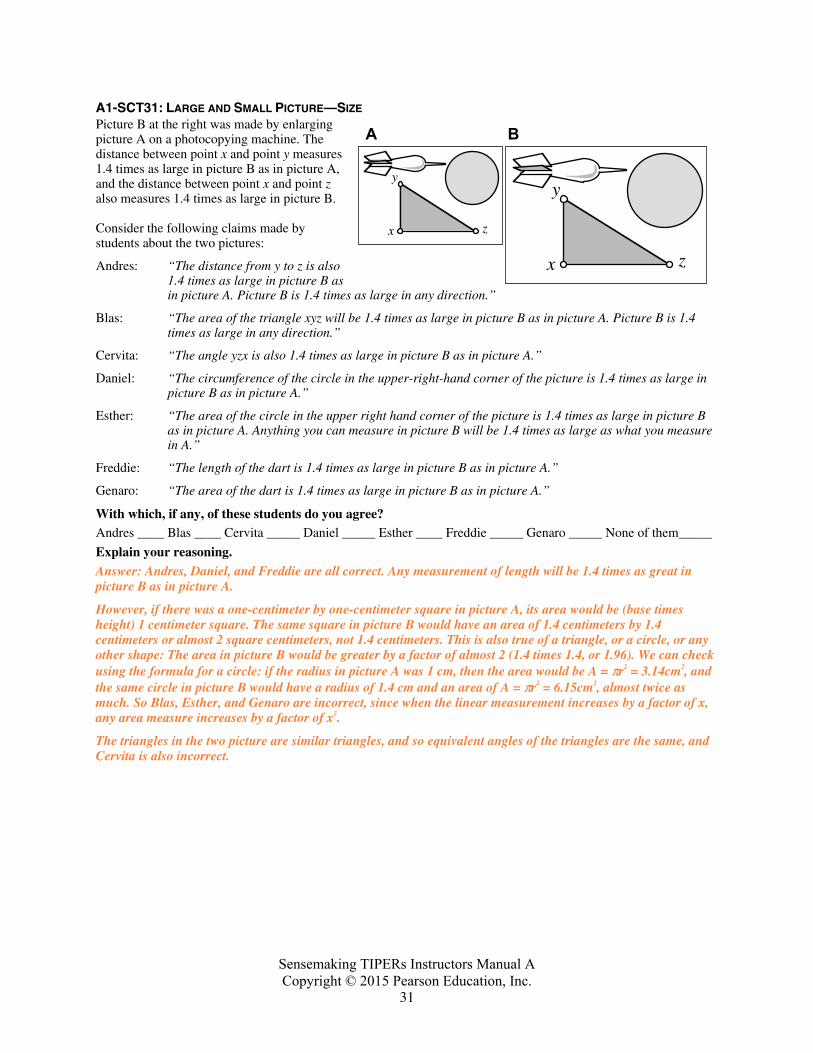
A1-SCT31: LARGE AND SMALL PICTURE—SIZE Picture B at the right was made by enlarging picture A on a photocopying machine. The distance between point x and point y measures 1.4 times as large in picture B as in picture A, and the distance between point x and point z also measures 1.4 times as large in picture B. Consider the following claims made by students about the two pictures:
Andres: “The distance from y to z is also 1.4 times as large in picture B as in picture A. Picture B is 1.4 times as large in any direction.”
Blas: “The area of the triangle xyz will be 1.4 times as large in picture B as in picture A. Picture B is 1.4 times as large in any direction.”
Cervita: “The angle yzx is also 1.4 times as large in picture B as in picture A.”
Daniel: “The circumference of the circle in the upper-right-hand corner of the picture is 1.4 times as large in picture B as in picture A.”
Esther: “The area of the circle in the upper right hand corner of the picture is 1.4 times as large in picture B as in picture A. Anything you can measure in picture B will be 1.4 times as large as what you measure in A.”
Freddie: “The length of the dart is 1.4 times as large in picture B as in picture A.”
Genaro: “The area of the dart is 1.4 times as large in picture B as in picture A.”
With which, if any, of these students do you agree? Andres ____ Blas ____ Cervita _____ Daniel _____ Esther ____ Freddie _____ Genaro _____ None of them_____
Explain your reasoning. Answer: Andres, Daniel, and Freddie are all correct. Any measurement of length will be 1.4 times as great in picture B as in picture A.
However, if there was a one-centimeter by one-centimeter square in picture A, its area would be (base times height) 1 centimeter square. The same square in picture B would have an area of 1.4 centimeters by 1.4 centimeters or almost 2 square centimeters, not 1.4 centimeters. This is also true of a triangle, or a circle, or any other shape: The area in picture B would be greater by a factor of almost 2 (1.4 times 1.4, or 1.96). We can check using the formula for a circle: if the radius in picture A was 1 cm, then the area would be A = πr2 = 3.14cm2, and the same circle in picture B would have a radius of 1.4 cm and an area of A = πr2 = 6.15cm2, almost twice as much. So Blas, Esther, and Genaro are incorrect, since when the linear measurement increases by a factor of x, any area measure increases by a factor of x2.
The triangles in the two picture are similar triangles, and so equivalent angles of the triangles are the same, and Cervita is also incorrect.
x z
y
A
x z
y
B
Sensemaking TIPERs Instructors Manual A Copyright © 2015 Pearson Education, Inc.
32
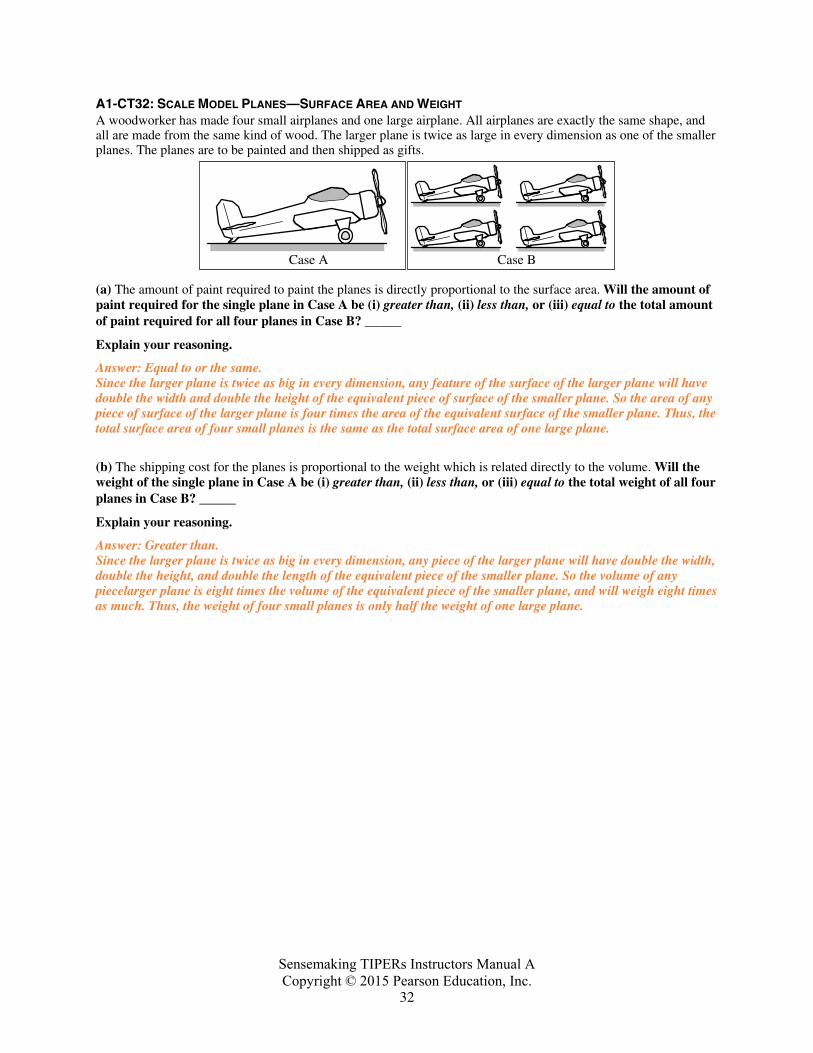
A1-CT32: SCALE MODEL PLANES—SURFACE AREA AND WEIGHT A woodworker has made four small airplanes and one large airplane. All airplanes are exactly the same shape, and all are made from the same kind of wood. The larger plane is twice as large in every dimension as one of the smaller planes. The planes are to be painted and then shipped as gifts.
Case BCase A
(a) The amount of paint required to paint the planes is directly proportional to the surface area. Will the amount of paint required for the single plane in Case A be (i) greater than, (ii) less than, or (iii) equal to the total amount of paint required for all four planes in Case B? _____
Explain your reasoning.
Answer: Equal to or the same. Since the larger plane is twice as big in every dimension, any feature of the surface of the larger plane will have double the width and double the height of the equivalent piece of surface of the smaller plane. So the area of any piece of surface of the larger plane is four times the area of the equivalent surface of the smaller plane. Thus, the total surface area of four small planes is the same as the total surface area of one large plane.
(b) The shipping cost for the planes is proportional to the weight which is related directly to the volume. Will the weight of the single plane in Case A be (i) greater than, (ii) less than, or (iii) equal to the total weight of all four planes in Case B? _____
Explain your reasoning.
Answer: Greater than. Since the larger plane is twice as big in every dimension, any piece of the larger plane will have double the width, double the height, and double the length of the equivalent piece of the smaller plane. So the volume of any piecelarger plane is eight times the volume of the equivalent piece of the smaller plane, and will weigh eight times as much. Thus, the weight of four small planes is only half the weight of one large plane.

Sensemaking TIPERs Instructors Manual A Copyright © 2015 Pearson Education, Inc.
33
A1-WWT33: FIVE KILOGRAMS OF PENNIES—VALUE OF FIVE KILOGRAMS OF NICKELS A student is told that 5 kg of pennies have a value of $20. The student has to find the value of the same mass of nickels, knowing that a nickel has twice the mass of a penny. The student carries out the following calculation:
“$20 is 2000 pennies, and they have a mass of 5 kg. If I have the same mass of nickels that are each twice the mass of a penny, then I will only have 1,000 nickels. That means I would have $50.”
What, if anything, is wrong with this student’s analysis? If something is wrong, identify it and explain how to correct it. If nothing is wrong, complete the explanation.
Answer: The student’s analysis is correct
Sensemaking TIPERs Instructors Manual A Copyright © 2015 Pearson Education, Inc.
34
A1-SCT34: COAL MINE RESCUE SHAFT—TIME Three students are working on the following problem:
“If it takes 70 hours to dig a coal mine rescue shaft 300 feet deep, how long should it take to dig another coal mine rescue shaft 1,500 feet deep?”
The students make the following contentions:
Ally: “Since it took 70 hours to dig 300 feet it will take five times as long to dig five times as deep, so it will take 350 hours.”
Bill: “It takes them a little less than a quarter of an hour to dig one foot, so I get 349.5 hours, which almost agrees with Ally, but I am not sure who has the right answer.”
Clyde: “The workers were able to dig at a rate of 4.29 feet per hour for the first shaft, so if they can do the same for the second it will take 349.7 hours. So I think we all agree and the numbers only differ because of rounding errors.”
With which, if any, of these students do you agree?
Ally _____ Bill _____ Clyde _____ None of them _____
Explain.
Answer: All three students are correct. Assuming the same rate of digging, the new shaft is five times as long as the first shaft and should take five times as long to dig. Five times 70 hours is 350 hours. Bill and Carl have simply done the same calculation in a different way.
Sensemaking TIPERs Instructors Manual A Copyright © 2015 Pearson Education, Inc.
35
A1-QRT35: PENNIES—NUMBER OF PENNIES
Since 2,000 pennies have a mass of n kg, how many pennies would be needed to produce a mass of 1.6n kg?
Explain.
Answer: 3200 pennies. If 2000 pennies have a mass of n kg, then there would be 2000/n pennies for each kilogram, and 1.6n kilograms of pennies would amount to (2000/n)(1.6n) = 3200 pennies.
Sensemaking TIPERs Instructors Manual A Copyright © 2015 Pearson Education, Inc.
36
A1-TT36: SIX PAGE PHYSICS TEST—WEIGHT A certain physics test, which is several pages long, is copied on 20-pound paper (500 sheet have a weight of 20 pounds) so the weight per test is 0.25 pounds. The class has 39 students, so the instructor makes 40 copies of this test. What is the weight of the paper that he brings to class on test day?
A student presented with this problem carries out the following analysis:
“To find the total weight of the paper in the tests I need to divide the 40 copies by the 0.25 test/pound, and that will give me 16 pounds.”
The student’s analysis is wrong; identify the problem and explain how to correct it.
Answer:The student divided by the conversion factor when he/she should have multiplied since (40 tests)(0.25 pounds/test) = 10 pounds.
Sensemaking TIPERs Instructors Manual A Copyright © 2015 Pearson Education, Inc.
37
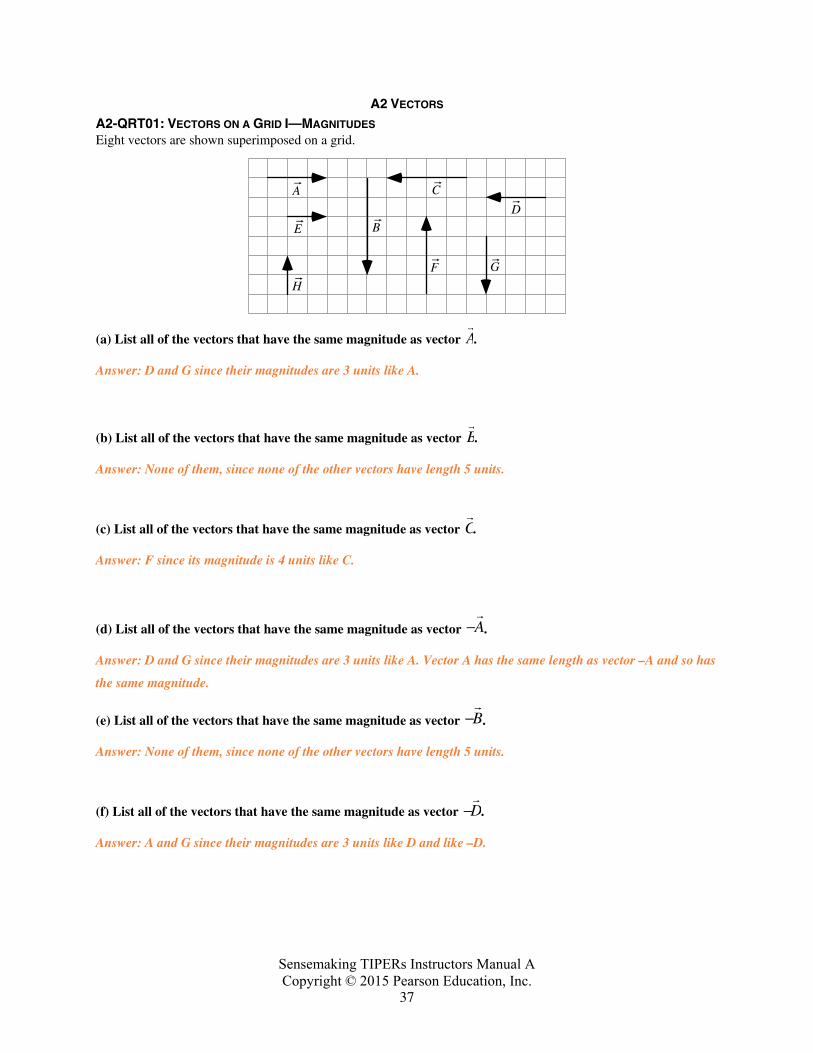
A2 VECTORS A2-QRT01: VECTORS ON A GRID I—MAGNITUDES Eight vectors are shown superimposed on a grid.
A
E
H
B
C
F G
D
(a) List all of the vectors that have the same magnitude as vector A.
Answer: D and G since their magnitudes are 3 units like A.
(b) List all of the vectors that have the same magnitude as vector B.
Answer: None of them, since none of the other vectors have length 5 units.
(c) List all of the vectors that have the same magnitude as vector C.
Answer: F since its magnitude is 4 units like C.
(d) List all of the vectors that have the same magnitude as vector −
A.
Answer: D and G since their magnitudes are 3 units like A. Vector A has the same length as vector –A and so has
the same magnitude.
(e) List all of the vectors that have the same magnitude as vector −
B.
Answer: None of them, since none of the other vectors have length 5 units.
(f) List all of the vectors that have the same magnitude as vector −
D.
Answer: A and G since their magnitudes are 3 units like D and like –D.
Sensemaking TIPERs Instructors Manual A Copyright © 2015 Pearson Education, Inc.
38
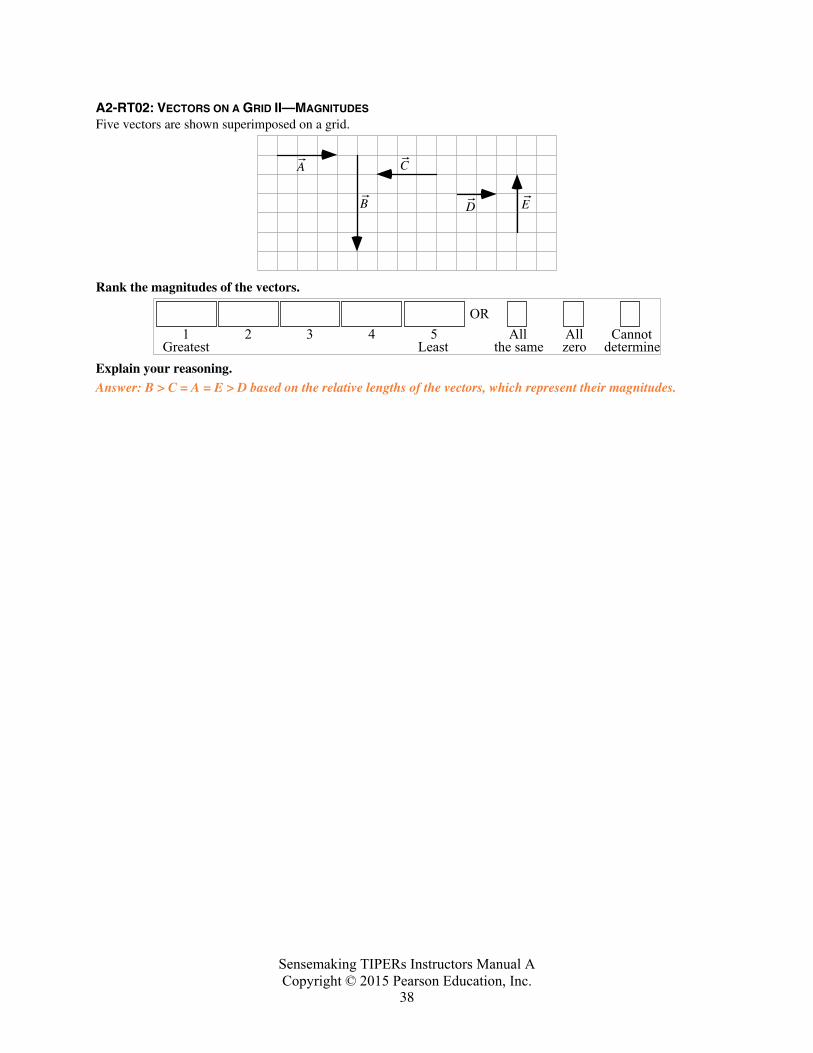
A2-RT02: VECTORS ON A GRID II—MAGNITUDES Five vectors are shown superimposed on a grid.
A
B
C
D E
Rank the magnitudes of the vectors.
Greatest1
ORAll
the sameAllzero
Cannotdetermine
2 3 4 5Least
Explain your reasoning. Answer: B > C = A = E > D based on the relative lengths of the vectors, which represent their magnitudes.
Sensemaking TIPERs Instructors Manual A Copyright © 2015 Pearson Education, Inc.
39
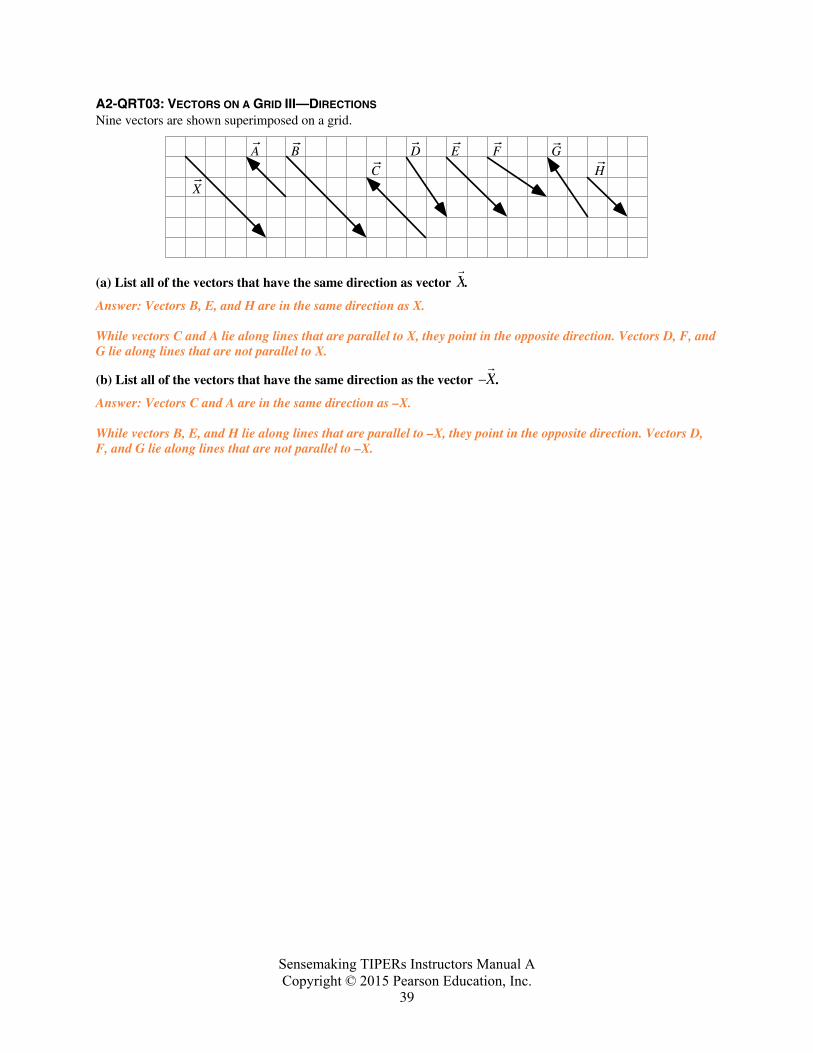
A2-QRT03: VECTORS ON A GRID III—DIRECTIONS Nine vectors are shown superimposed on a grid.
H
GFED
C
BA
X
(a) List all of the vectors that have the same direction as vector X.
Answer: Vectors B, E, and H are in the same direction as X. While vectors C and A lie along lines that are parallel to X, they point in the opposite direction. Vectors D, F, and G lie along lines that are not parallel to X.
(b) List all of the vectors that have the same direction as the vector –
X.
Answer: Vectors C and A are in the same direction as –X. While vectors B, E, and H lie along lines that are parallel to –X, they point in the opposite direction. Vectors D, F, and G lie along lines that are not parallel to –X.
Sensemaking TIPERs Instructors Manual A Copyright © 2015 Pearson Education, Inc.
40
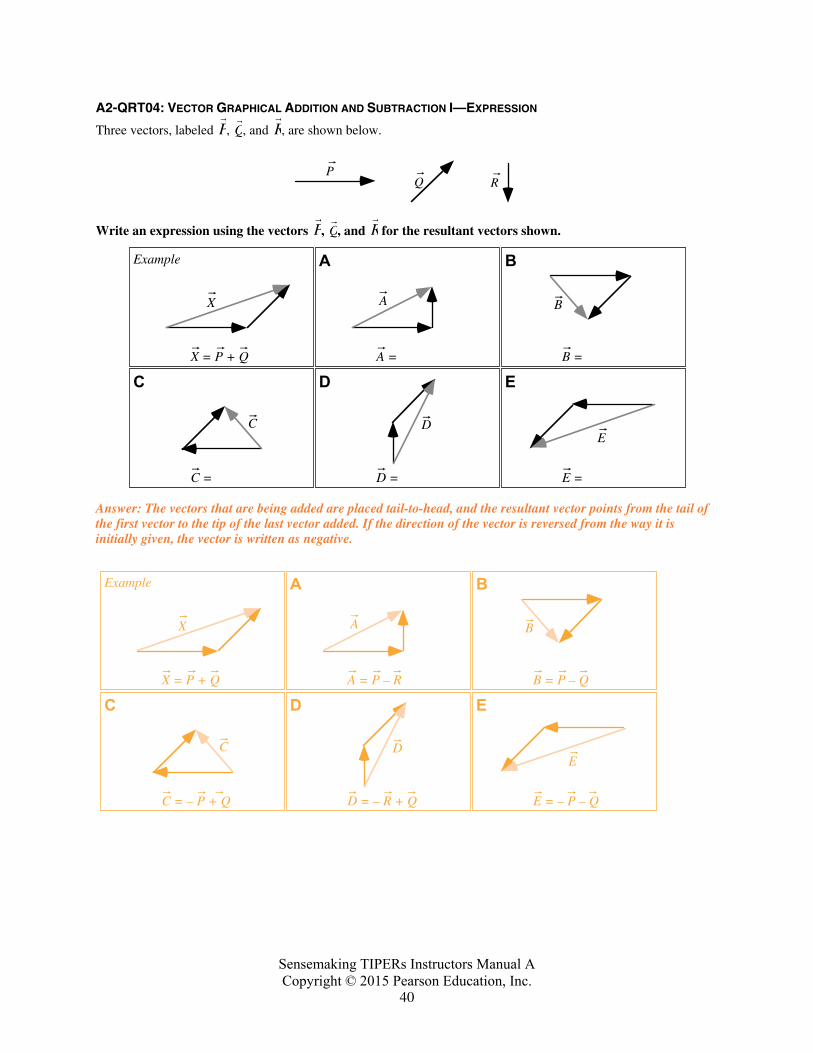
A2-QRT04: VECTOR GRAPHICAL ADDITION AND SUBTRACTION I—EXPRESSION
Three vectors, labeled P, Q, and R, are shown below.
PQ R
Write an expression using the vectors P,
Q, and R for the resultant vectors shown.
Example
X = P + Q
X
A
A =
A
B
B =
B
D
D =
D
C
C =
C
E
E =
E
Answer: The vectors that are being added are placed tail-to-head, and the resultant vector points from the tail of the first vector to the tip of the last vector added. If the direction of the vector is reversed from the way it is initially given, the vector is written as negative.
Example
X = P + Q
X
A
A = P – R
A
B
B = P – Q
B
D
D = – R + Q
D
C
C = – P + Q
C
E
E = – P – Q
E
Sensemaking TIPERs Instructors Manual A Copyright © 2015 Pearson Education, Inc.
41
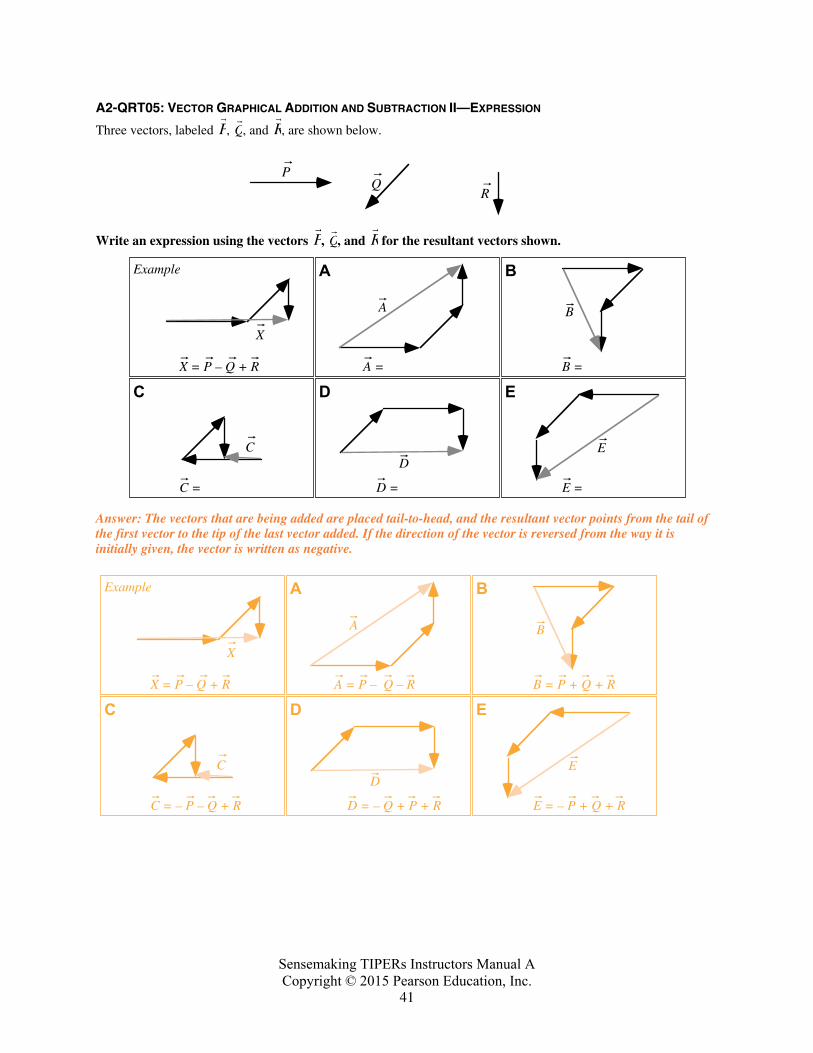
A2-QRT05: VECTOR GRAPHICAL ADDITION AND SUBTRACTION II—EXPRESSION
Three vectors, labeled P,
Q, and R, are shown below.
PQ
R
Write an expression using the vectors P,
Q, and R for the resultant vectors shown.
Example
X = P – Q + R
X
A
A =
A
B
B =
B
D
D =
D
C
C =
C
E
E =
E
Answer: The vectors that are being added are placed tail-to-head, and the resultant vector points from the tail of the first vector to the tip of the last vector added. If the direction of the vector is reversed from the way it is initially given, the vector is written as negative.
Example
X = P – Q + R
X
A
A = P – Q – R
A
B
B = P + Q + R
B
D
D = – Q + P + R
D
C
C = – P – Q + R
C
E
E = – P + Q + R
E
Sensemaking TIPERs Instructors Manual A Copyright © 2015 Pearson Education, Inc.
42
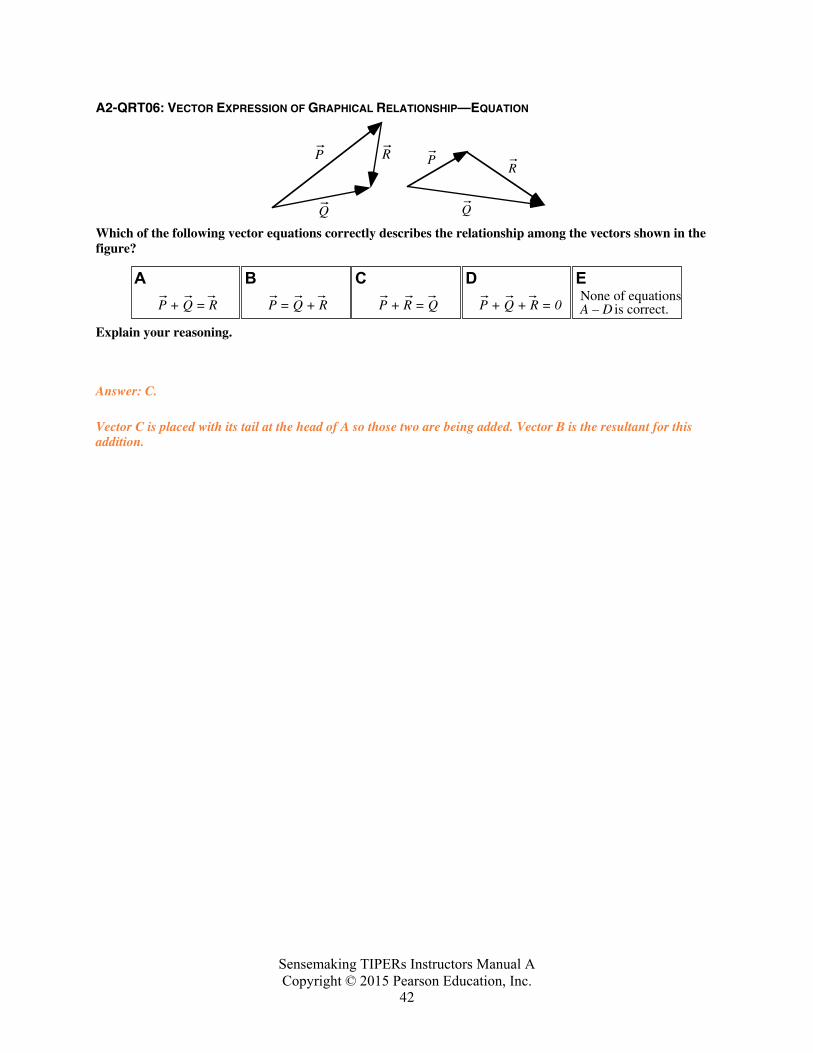
A2-QRT06: VECTOR EXPRESSION OF GRAPHICAL RELATIONSHIP—EQUATION
P R
Q
PR
Q
Which of the following vector equations correctly describes the relationship among the vectors shown in the figure?
AP + Q = R
BP = Q + R
CP + R = Q
DP + Q + R = 0
ENone of equationsA – D is correct.
Explain your reasoning.
Answer: C. Vector C is placed with its tail at the head of A so those two are being added. Vector B is the resultant for this addition.
Sensemaking TIPERs Instructors Manual A Copyright © 2015 Pearson Education, Inc.
43
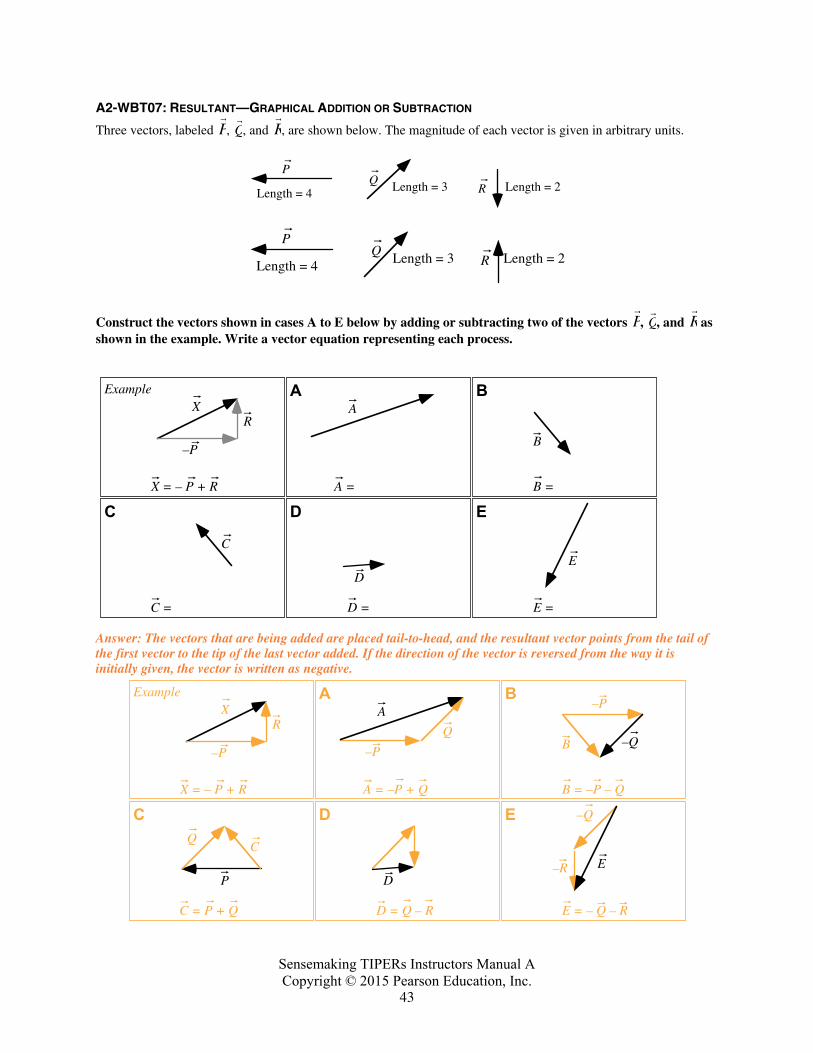
A2-WBT07: RESULTANT—GRAPHICAL ADDITION OR SUBTRACTION
Three vectors, labeled P, Q, and R, are shown below. The magnitude of each vector is given in arbitrary units.
P
Length = 4Q Length = 3 R Length = 2
P
Length = 4Q Length = 3 R Length = 2
Construct the vectors shown in cases A to E below by adding or subtracting two of the vectors P,
Q, and R as shown in the example. Write a vector equation representing each process.
Example
X = – P + R
XA
A =
AB
B =
B
D
D =
D
C
C =
C
E
E =
E
R
–P
Answer: The vectors that are being added are placed tail-to-head, and the resultant vector points from the tail of the first vector to the tip of the last vector added. If the direction of the vector is reversed from the way it is initially given, the vector is written as negative.
Example
X = – P + R
XA
A = –P + Q
AB
B = –P – Q
B
D
D = Q – R
D
C
C = P + Q
C
E
E = – Q – R
E
–P
R
–P
–P
–Q
Q–Q
P
Q
–R
Sensemaking TIPERs Instructors Manual A Copyright © 2015 Pearson Education, Inc.
44
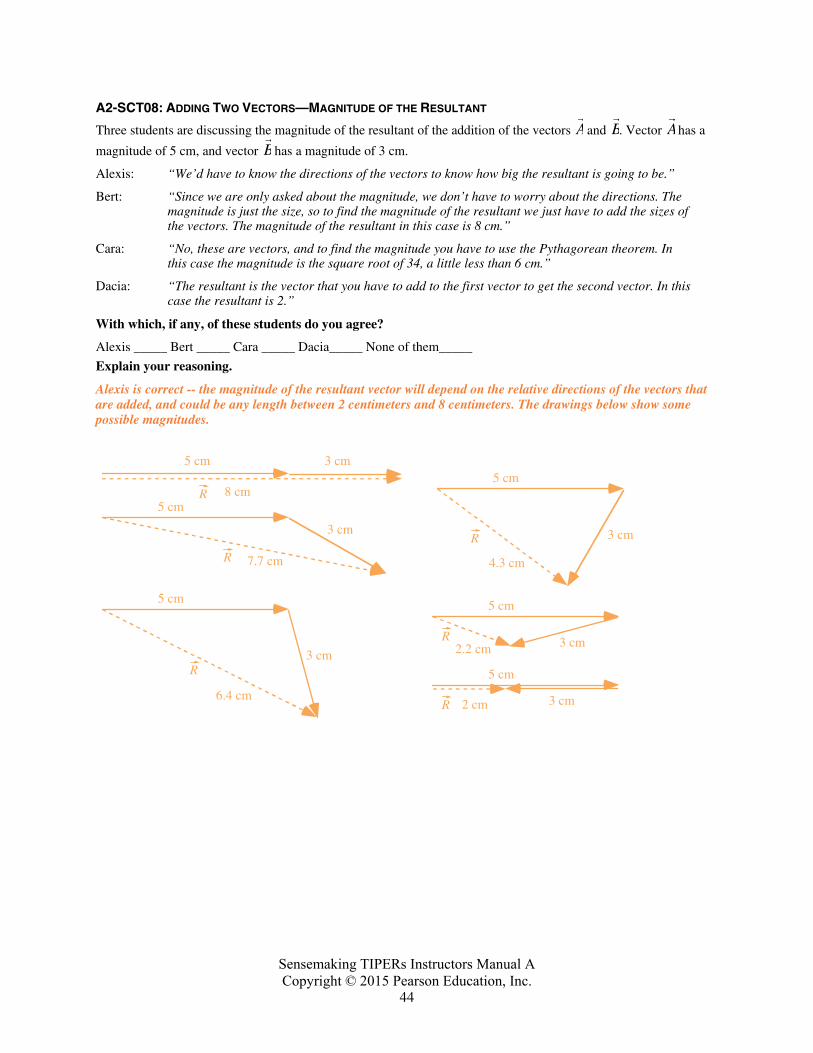
A2-SCT08: ADDING TWO VECTORS—MAGNITUDE OF THE RESULTANT
Three students are discussing the magnitude of the resultant of the addition of the vectors A and B. Vector A has a
magnitude of 5 cm, and vector B has a magnitude of 3 cm.
Alexis: “We’d have to know the directions of the vectors to know how big the resultant is going to be.”
Bert: “Since we are only asked about the magnitude, we don’t have to worry about the directions. The magnitude is just the size, so to find the magnitude of the resultant we just have to add the sizes of the vectors. The magnitude of the resultant in this case is 8 cm.”
Cara: “No, these are vectors, and to find the magnitude you have to use the Pythagorean theorem. In this case the magnitude is the square root of 34, a little less than 6 cm.”
Dacia: “The resultant is the vector that you have to add to the first vector to get the second vector. In this case the resultant is 2.”
With which, if any, of these students do you agree?
Alexis _____ Bert _____ Cara _____ Dacia_____ None of them_____
Explain your reasoning.
Alexis is correct -- the magnitude of the resultant vector will depend on the relative directions of the vectors that are added, and could be any length between 2 centimeters and 8 centimeters. The drawings below show some possible magnitudes.
5 cm 3 cm
8 cmR
7.7 cmR
5 cm
3 cm
R
5 cm
3 cm
6.4 cm
R
5 cm
3 cm
4.3 cm
R
5 cm
3 cm2.2 cm
R
5 cm
3 cm2 cm
Sensemaking TIPERs Instructors Manual A Copyright © 2015 Pearson Education, Inc.
45
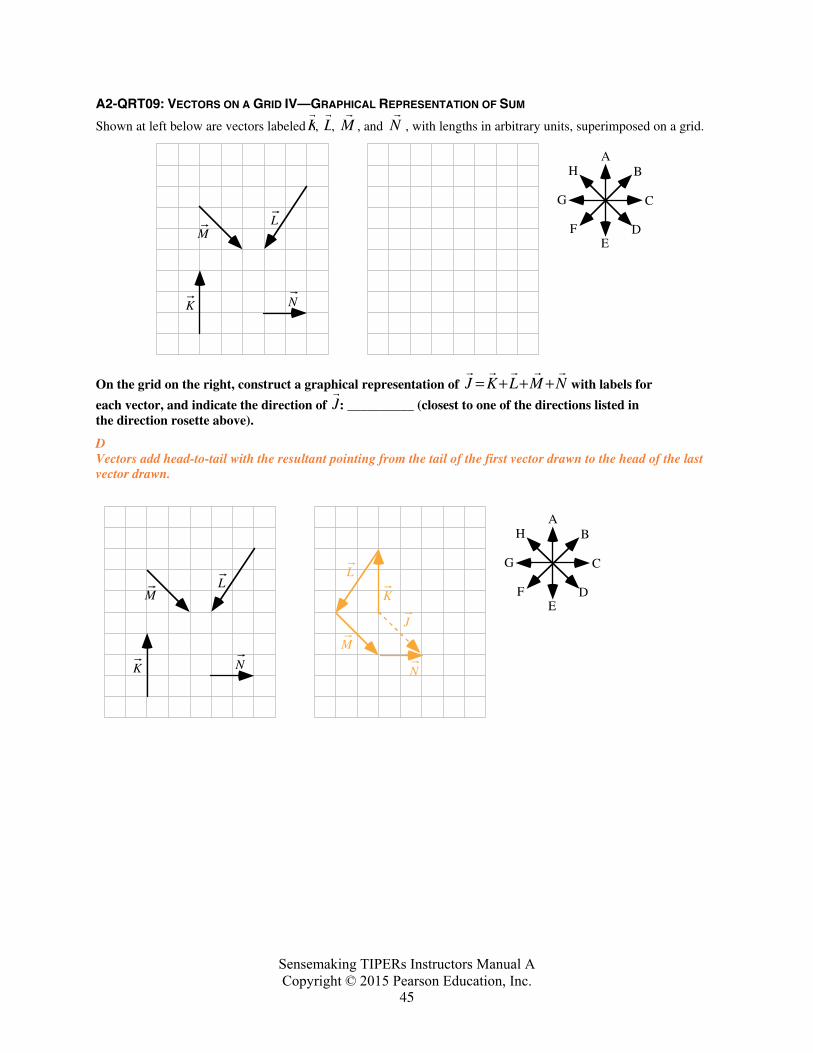
A2-QRT09: VECTORS ON A GRID IV—GRAPHICAL REPRESENTATION OF SUM
Shown at left below are vectors labeled K, L,
M , and
N , with lengths in arbitrary units, superimposed on a grid.
LM
K N
AB
C
DE
F
G
H
On the grid on the right, construct a graphical representation of
J =
K +
L +
M +
N with labels for
each vector, and indicate the direction of J : __________ (closest to one of the directions listed in the direction rosette above).
D Vectors add head-to-tail with the resultant pointing from the tail of the first vector drawn to the head of the last vector drawn.
L
K
M
N
LM
K N
AB
C
DE
F
G
H
J
Sensemaking TIPERs Instructors Manual A Copyright © 2015 Pearson Education, Inc.
46
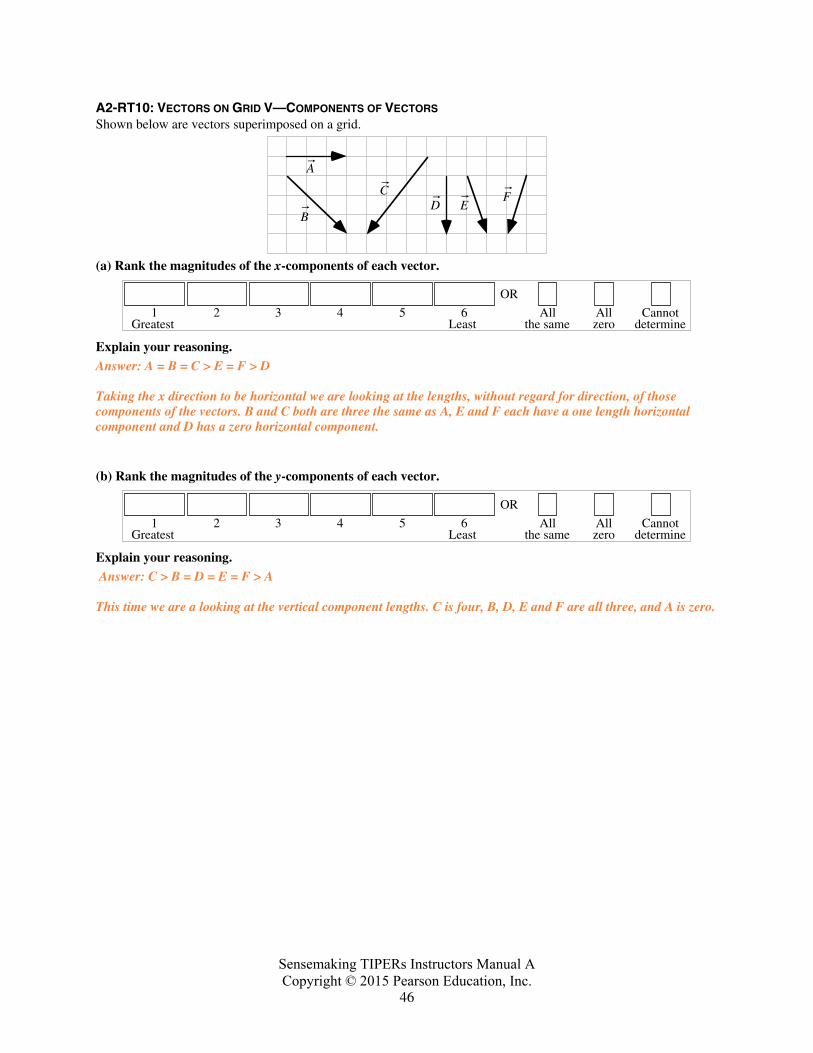
A2-RT10: VECTORS ON GRID V—COMPONENTS OF VECTORS Shown below are vectors superimposed on a grid.
A
CD E
B
F
(a) Rank the magnitudes of the x-components of each vector.
Greatest1
OR
Allthe same
Allzero
Cannotdetermine
2 3 4 5Least
6
Explain your reasoning. Answer: A = B = C > E = F > D Taking the x direction to be horizontal we are looking at the lengths, without regard for direction, of those components of the vectors. B and C both are three the same as A, E and F each have a one length horizontal component and D has a zero horizontal component.
(b) Rank the magnitudes of the y-components of each vector.
Greatest1
OR
Allthe same
Allzero
Cannotdetermine
2 3 4 5Least
6
Explain your reasoning. Answer: C > B = D = E = F > A This time we are a looking at the vertical component lengths. C is four, B, D, E and F are all three, and A is zero.
Sensemaking TIPERs Instructors Manual A Copyright © 2015 Pearson Education, Inc.
47
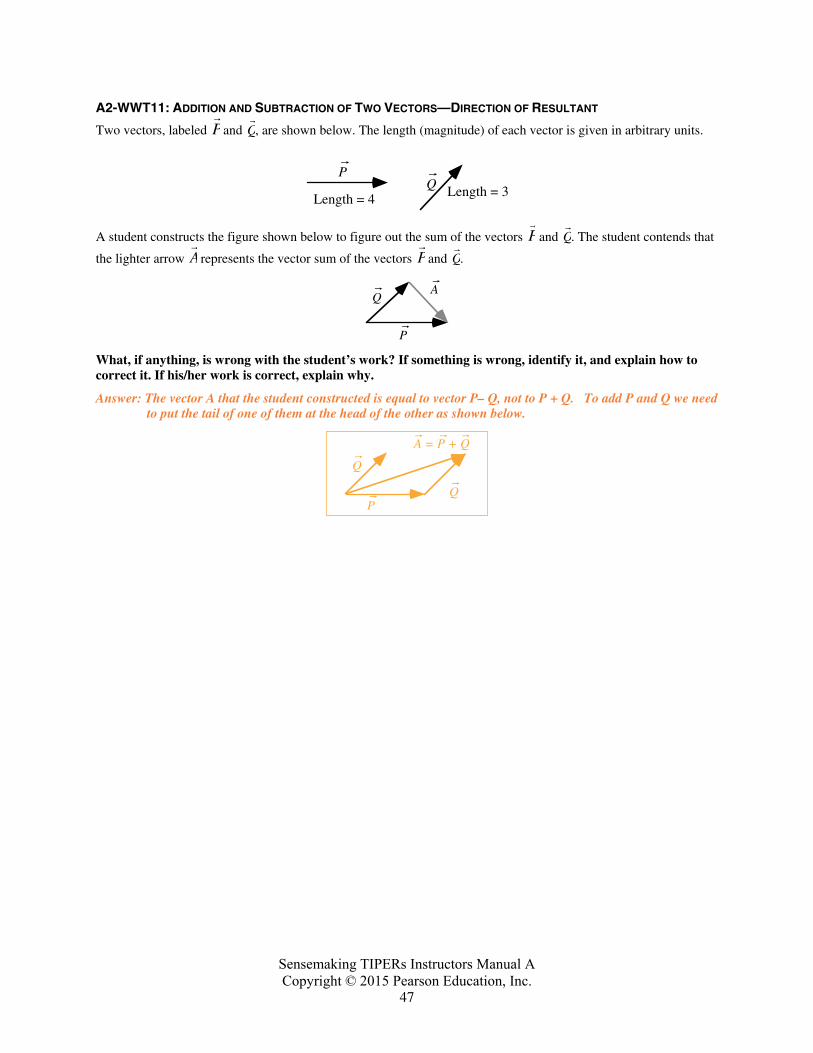
A2-WWT11: ADDITION AND SUBTRACTION OF TWO VECTORS—DIRECTION OF RESULTANT
Two vectors, labeled P and Q, are shown below. The length (magnitude) of each vector is given in arbitrary units.
P
Length = 4Q Length = 3
A student constructs the figure shown below to figure out the sum of the vectors P and
Q. The student contends that
the lighter arrow A represents the vector sum of the vectors P and
Q.
A
P
Q
What, if anything, is wrong with the student’s work? If something is wrong, identify it, and explain how to correct it. If his/her work is correct, explain why.
Answer: The vector A that the student constructed is equal to vector P– Q, not to P + Q. To add P and Q we need to put the tail of one of them at the head of the other as shown below.
P
Q
Q
A = P + Q
Sensemaking TIPERs Instructors Manual A Copyright © 2015 Pearson Education, Inc.
48
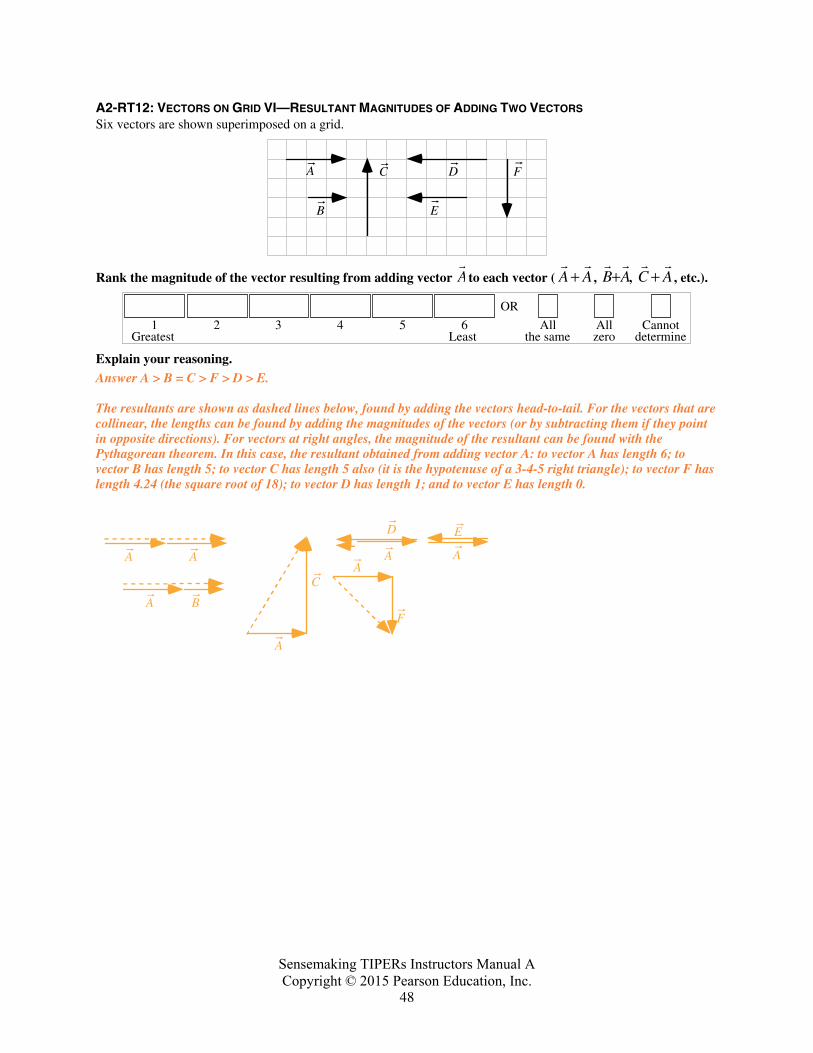
A2-RT12: VECTORS ON GRID VI—RESULTANT MAGNITUDES OF ADDING TWO VECTORS Six vectors are shown superimposed on a grid.
A C D
EB
F
Rank the magnitude of the vector resulting from adding vector A to each vector (
A +
A ,
B +A,
C +
A , etc.).
Greatest1
OR
Allthe same
Allzero
Cannotdetermine
2 3 4 5Least
6
Explain your reasoning. Answer A > B = C > F > D > E. The resultants are shown as dashed lines below, found by adding the vectors head-to-tail. For the vectors that are collinear, the lengths can be found by adding the magnitudes of the vectors (or by subtracting them if they point in opposite directions). For vectors at right angles, the magnitude of the resultant can be found with the Pythagorean theorem. In this case, the resultant obtained from adding vector A: to vector A has length 6; to vector B has length 5; to vector C has length 5 also (it is the hypotenuse of a 3-4-5 right triangle); to vector F has length 4.24 (the square root of 18); to vector D has length 1; and to vector E has length 0.
A A
A
A
D
A
E
A
C
BF
A
Sensemaking TIPERs Instructors Manual A Copyright © 2015 Pearson Education, Inc.
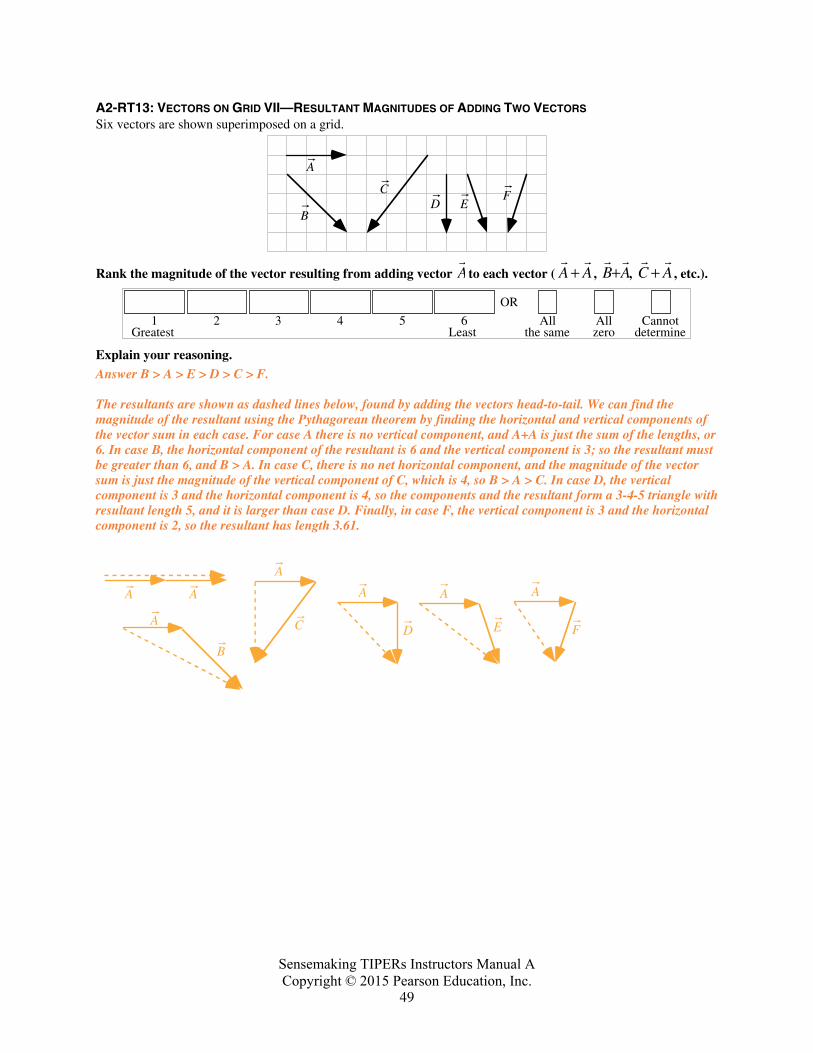
49
A2-RT13: VECTORS ON GRID VII—RESULTANT MAGNITUDES OF ADDING TWO VECTORS Six vectors are shown superimposed on a grid.
A
CD E
B
F
Rank the magnitude of the vector resulting from adding vector A to each vector (
A +
A ,
B +A,
C +
A , etc.).
Greatest1
OR
Allthe same
Allzero
Cannotdetermine
2 3 4 5Least
6
Explain your reasoning. Answer B > A > E > D > C > F. The resultants are shown as dashed lines below, found by adding the vectors head-to-tail. We can find the magnitude of the resultant using the Pythagorean theorem by finding the horizontal and vertical components of the vector sum in each case. For case A there is no vertical component, and A+A is just the sum of the lengths, or 6. In case B, the horizontal component of the resultant is 6 and the vertical component is 3; so the resultant must be greater than 6, and B > A. In case C, there is no net horizontal component, and the magnitude of the vector sum is just the magnitude of the vertical component of C, which is 4, so B > A > C. In case D, the vertical component is 3 and the horizontal component is 4, so the components and the resultant form a 3-4-5 triangle with resultant length 5, and it is larger than case D. Finally, in case F, the vertical component is 3 and the horizontal component is 2, so the resultant has length 3.61.
A A
A
A
B
D
A
C E
A
F
A
Sensemaking TIPERs Instructors Manual A Copyright © 2015 Pearson Education, Inc.
50
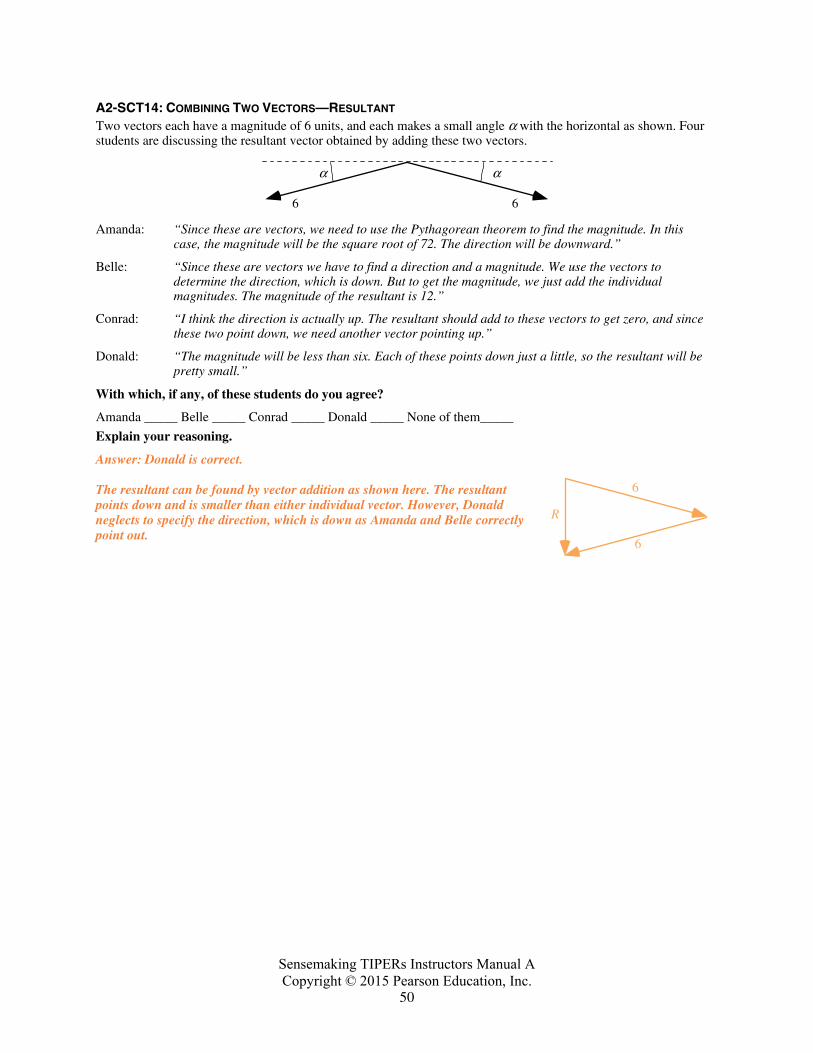
A2-SCT14: COMBINING TWO VECTORS—RESULTANT Two vectors each have a magnitude of 6 units, and each makes a small angle α with the horizontal as shown. Four students are discussing the resultant vector obtained by adding these two vectors.
α
66
α
Amanda: “Since these are vectors, we need to use the Pythagorean theorem to find the magnitude. In this case, the magnitude will be the square root of 72. The direction will be downward.”
Belle: “Since these are vectors we have to find a direction and a magnitude. We use the vectors to determine the direction, which is down. But to get the magnitude, we just add the individual magnitudes. The magnitude of the resultant is 12.”
Conrad: “I think the direction is actually up. The resultant should add to these vectors to get zero, and since these two point down, we need another vector pointing up.”
Donald: “The magnitude will be less than six. Each of these points down just a little, so the resultant will be pretty small.”
With which, if any, of these students do you agree?
Amanda _____ Belle _____ Conrad _____ Donald _____ None of them_____
Explain your reasoning.
Answer: Donald is correct. The resultant can be found by vector addition as shown here. The resultant points down and is smaller than either individual vector. However, Donald neglects to specify the direction, which is down as Amanda and Belle correctly point out.
6
6
R
Sensemaking TIPERs Instructors Manual A Copyright © 2015 Pearson Education, Inc.
51
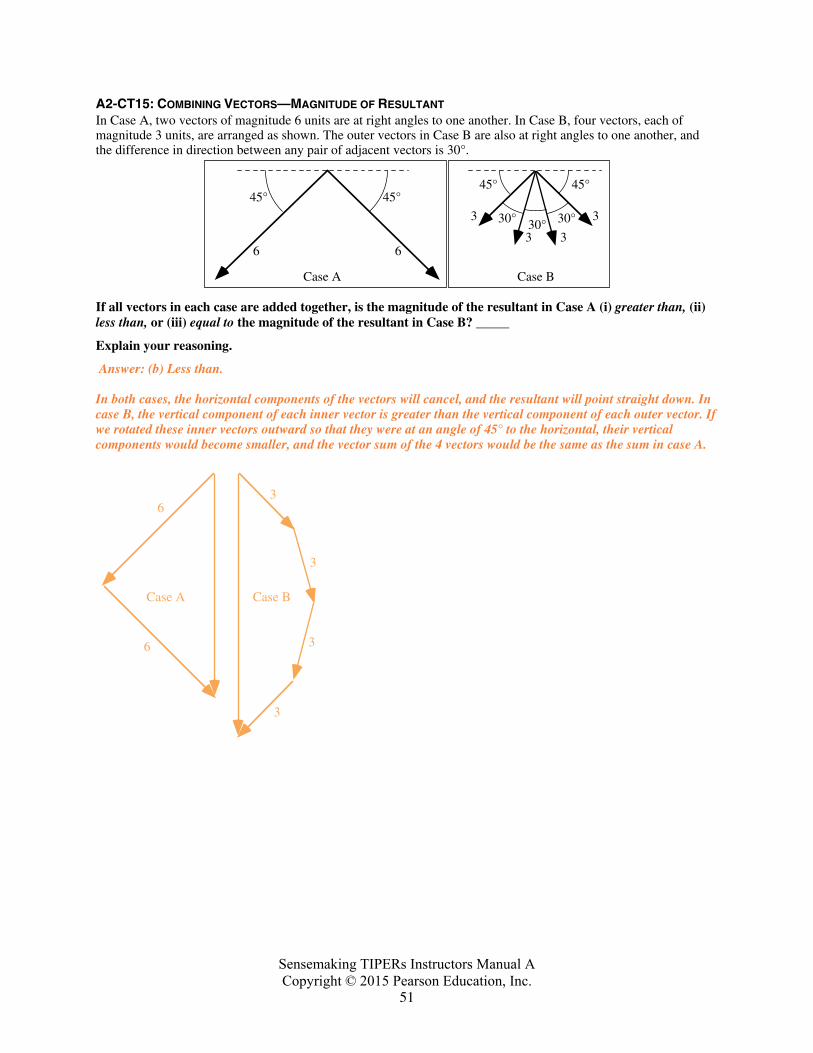
A2-CT15: COMBINING VECTORS—MAGNITUDE OF RESULTANT In Case A, two vectors of magnitude 6 units are at right angles to one another. In Case B, four vectors, each of magnitude 3 units, are arranged as shown. The outer vectors in Case B are also at right angles to one another, and the difference in direction between any pair of adjacent vectors is 30°.
45°
6
45°
3
45°
30°30° 30°
45°
6
3
33
Case BCase A
If all vectors in each case are added together, is the magnitude of the resultant in Case A (i) greater than, (ii) less than, or (iii) equal to the magnitude of the resultant in Case B? _____
Explain your reasoning.
Answer: (b) Less than. In both cases, the horizontal components of the vectors will cancel, and the resultant will point straight down. In case B, the vertical component of each inner vector is greater than the vertical component of each outer vector. If we rotated these inner vectors outward so that they were at an angle of 45° to the horizontal, their vertical components would become smaller, and the vector sum of the 4 vectors would be the same as the sum in case A.
6
6
Case A
3
3
3
3
Case B
Sensemaking TIPERs Instructors Manual A Copyright © 2015 Pearson Education, Inc.
52
A2-QRT16: VECTOR COMBINATION I—DIRECTION OF RESULTANT
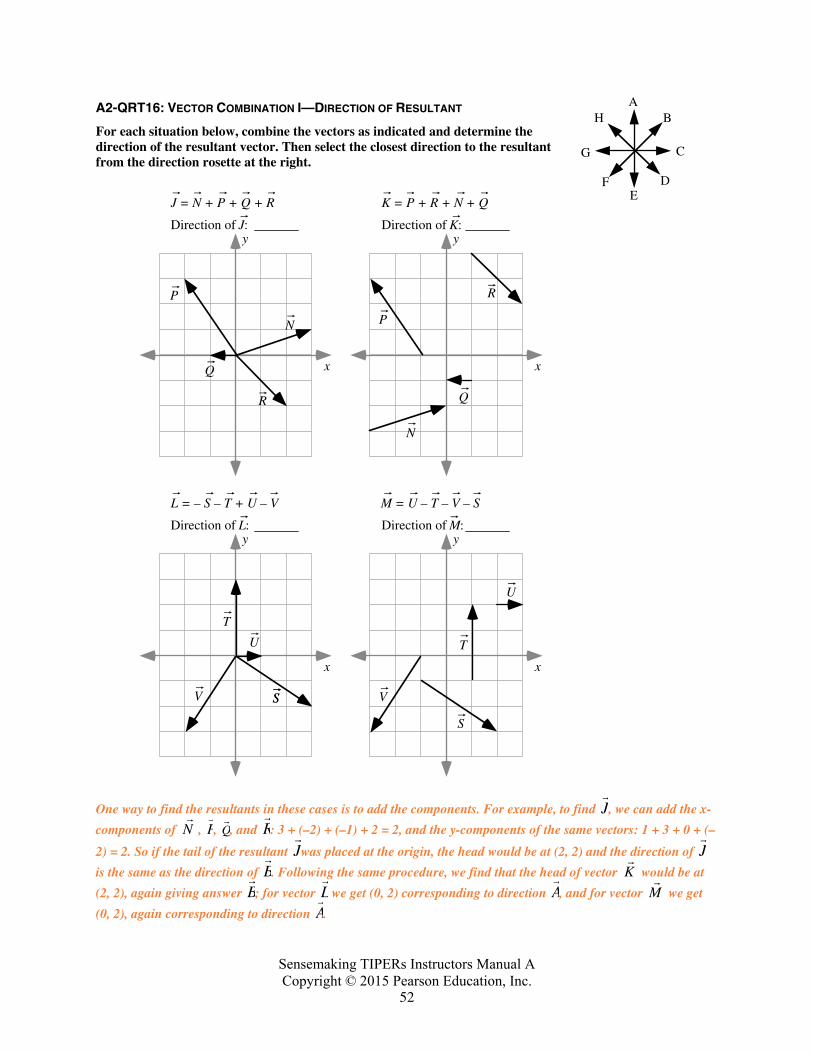
For each situation below, combine the vectors as indicated and determine the direction of the resultant vector. Then select the closest direction to the resultant from the direction rosette at the right.
R
Q
P
N
x
y
J = N + P + Q + R
Direction of J:
x
y
K = P + R + N + Q
Direction of K:
x
y
L = – S – T + U – V
Direction of L:
x
y
M = U – T – V – S
Direction of M:
S
T
U
V
P
Q
R
N
T
S
U
S
V
One way to find the resultants in these cases is to add the components. For example, to find J , we can add the x-
components of
N , P,
Q, and R: 3 + (–2) + (–1) + 2 = 2, and the y-components of the same vectors: 1 + 3 + 0 + (–
2) = 2. So if the tail of the resultant J was placed at the origin, the head would be at (2, 2) and the direction of J is the same as the direction of B. Following the same procedure, we find that the head of vector
K would be at
(2, 2), again giving answer B; for vector L we get (0, 2) corresponding to direction A, and for vector
M we get
(0, 2), again corresponding to direction A.
AB
C
DE
F
G
H
Sensemaking TIPERs Instructors Manual A Copyright © 2015 Pearson Education, Inc.
53
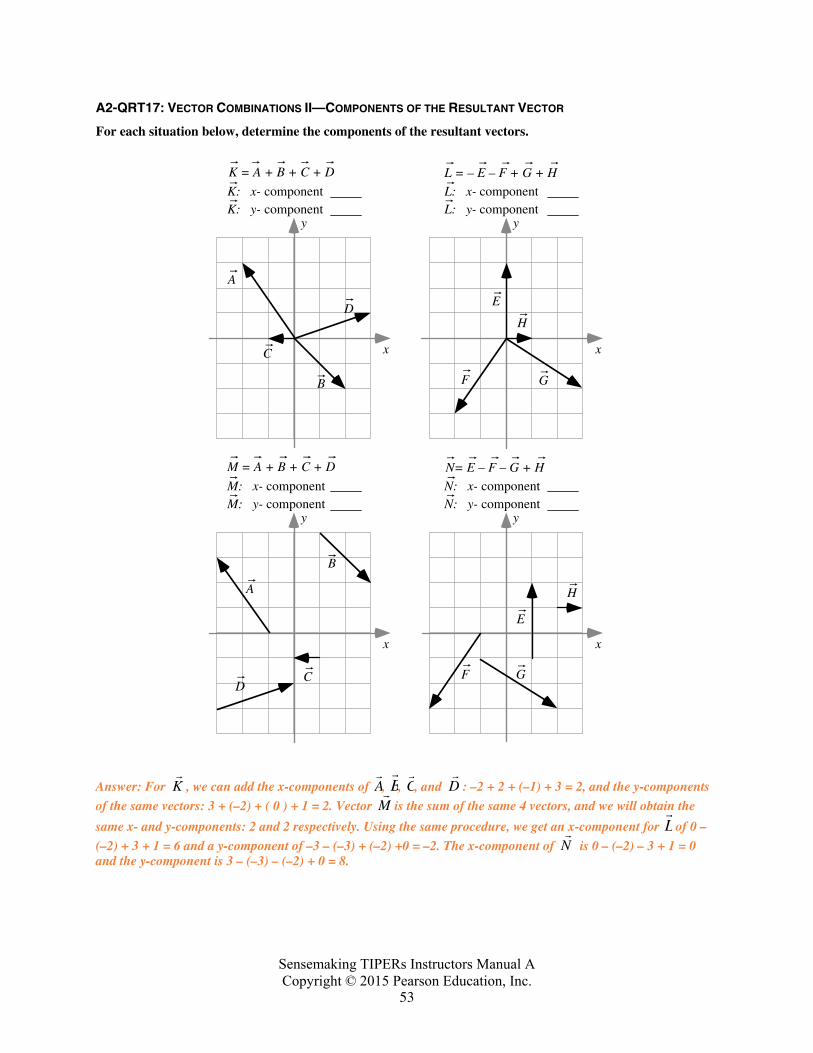
A2-QRT17: VECTOR COMBINATIONS II—COMPONENTS OF THE RESULTANT VECTOR
For each situation below, determine the components of the resultant vectors.
B
C
A
D
x
y
K = A + B + C + D
K: x- component
x
y
L = – E – F + G + H
E
H
GF
K: y- componentL: x- componentL: y- component
B
C
A
D
x
y
M = A + B + C + D
M: x- component
x
y
N= E – F – G + H
E
H
GF
M: y- componentN: x- componentN: y- component
Answer: For
K , we can add the x-components of A, B, C, and
D : –2 + 2 + (–1) + 3 = 2, and the y-components
of the same vectors: 3 + (–2) + ( 0 ) + 1 = 2. Vector
M is the sum of the same 4 vectors, and we will obtain the
same x- and y-components: 2 and 2 respectively. Using the same procedure, we get an x-component for L of 0 –
(–2) + 3 + 1 = 6 and a y-component of –3 – (–3) + (–2) +0 = –2. The x-component of
N is 0 – (–2) – 3 + 1 = 0 and the y-component is 3 – (–3) – (–2) + 0 = 8.
Sensemaking TIPERs Instructors Manual A Copyright © 2015 Pearson Education, Inc.
54
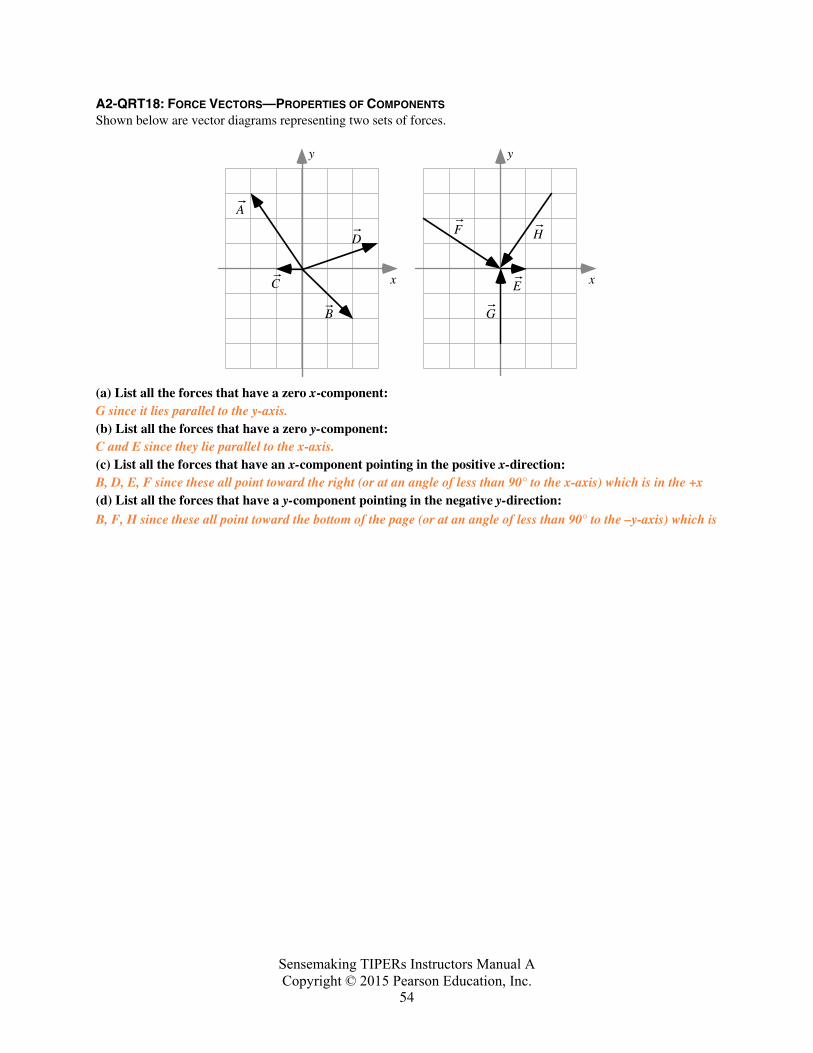
A2-QRT18: FORCE VECTORS—PROPERTIES OF COMPONENTS Shown below are vector diagrams representing two sets of forces.
B
C
A
D
x
y
x
y
E
H
G
F
(a) List all the forces that have a zero x-component: G since it lies parallel to the y-axis. (b) List all the forces that have a zero y-component: C and E since they lie parallel to the x-axis. (c) List all the forces that have an x-component pointing in the positive x-direction: B, D, E, F since these all point toward the right (or at an angle of less than 90° to the x-axis) which is in the +x (d) List all the forces that have a y-component pointing in the negative y-direction: B, F, H since these all point toward the bottom of the page (or at an angle of less than 90° to the –y-axis) which is
Sensemaking TIPERs Instructors Manual A Copyright © 2015 Pearson Education, Inc.
55
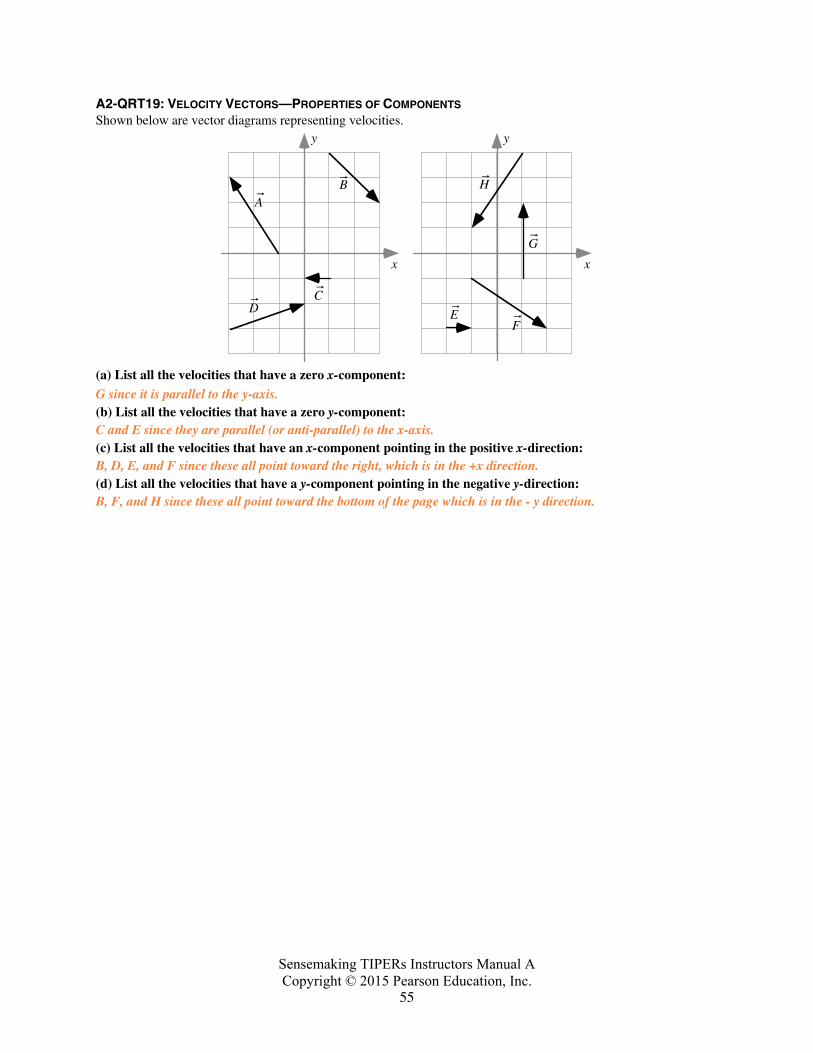
A2-QRT19: VELOCITY VECTORS—PROPERTIES OF COMPONENTS Shown below are vector diagrams representing velocities.
B
C
A
D
x
y
x
y
E
H
G
F
(a) List all the velocities that have a zero x-component: G since it is parallel to the y-axis. (b) List all the velocities that have a zero y-component: C and E since they are parallel (or anti-parallel) to the x-axis. (c) List all the velocities that have an x-component pointing in the positive x-direction: B, D, E, and F since these all point toward the right, which is in the +x direction. (d) List all the velocities that have a y-component pointing in the negative y-direction: B, F, and H since these all point toward the bottom of the page which is in the - y direction.
Sensemaking TIPERs Instructors Manual A Copyright © 2015 Pearson Education, Inc.
56
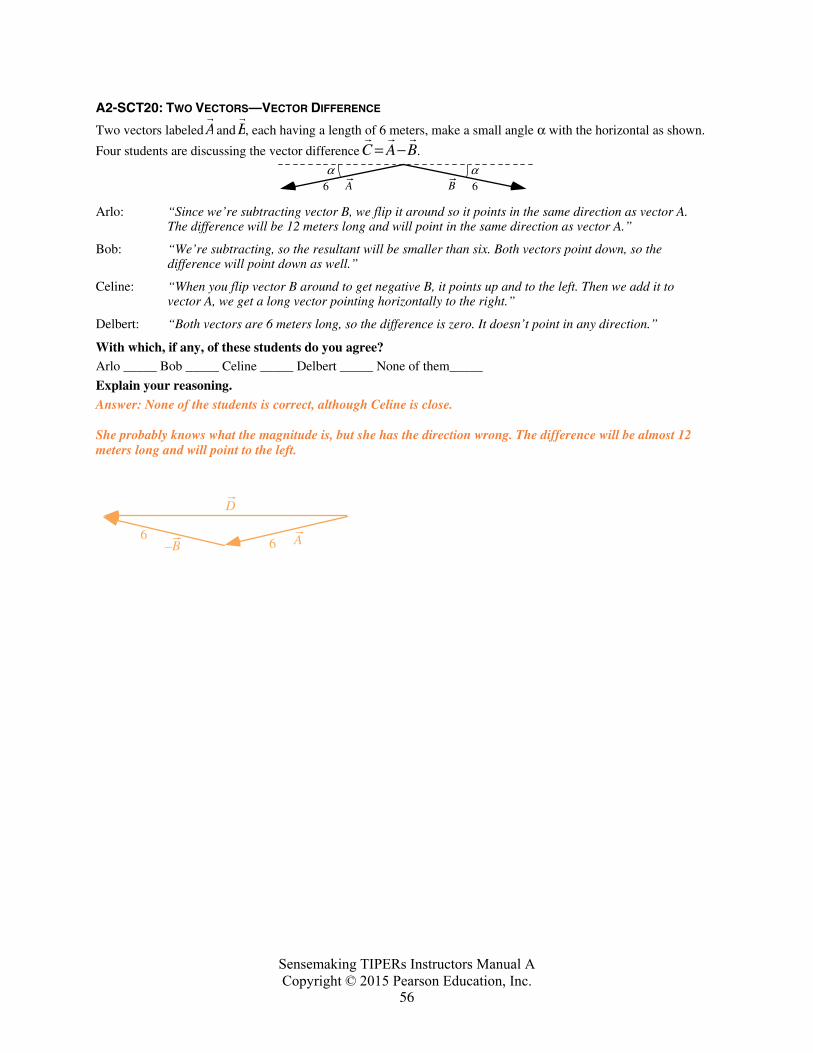
A2-SCT20: TWO VECTORS—VECTOR DIFFERENCE
Two vectors labeled A and B, each having a length of 6 meters, make a small angle α with the horizontal as shown.
Four students are discussing the vector difference
C =
A −
B.
α6α
6A B
Arlo: “Since we’re subtracting vector B, we flip it around so it points in the same direction as vector A. The difference will be 12 meters long and will point in the same direction as vector A.”
Bob: “We’re subtracting, so the resultant will be smaller than six. Both vectors point down, so the difference will point down as well.”
Celine: “When you flip vector B around to get negative B, it points up and to the left. Then we add it to vector A, we get a long vector pointing horizontally to the right.”
Delbert: “Both vectors are 6 meters long, so the difference is zero. It doesn’t point in any direction.”
With which, if any, of these students do you agree? Arlo _____ Bob _____ Celine _____ Delbert _____ None of them_____
Explain your reasoning. Answer: None of the students is correct, although Celine is close. She probably knows what the magnitude is, but she has the direction wrong. The difference will be almost 12 meters long and will point to the left.
A–B
D
66
Sensemaking TIPERs Instructors Manual A Copyright © 2015 Pearson Education, Inc.
57
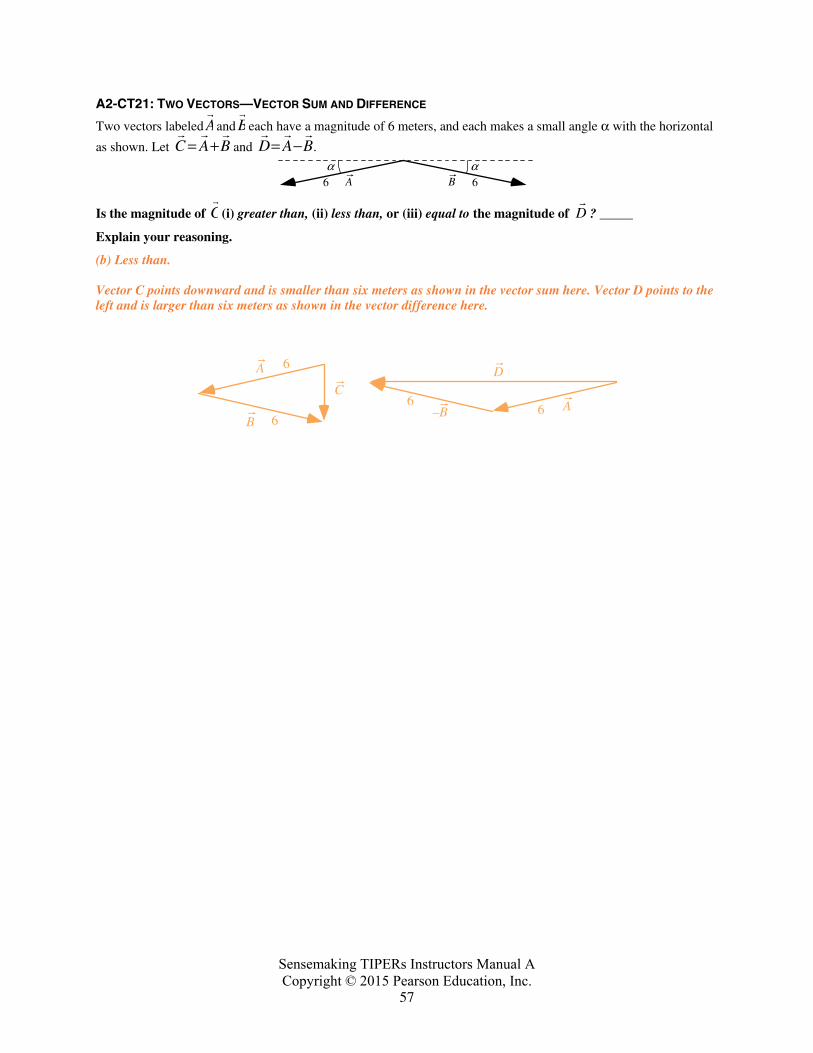
A2-CT21: TWO VECTORS—VECTOR SUM AND DIFFERENCE
Two vectors labeled A and B each have a magnitude of 6 meters, and each makes a small angle α with the horizontal
as shown. Let
C =
A +
B and
D =
A −
B . α
6α
6A B
Is the magnitude of C (i) greater than, (ii) less than, or (iii) equal to the magnitude of
D ? _____
Explain your reasoning.
(b) Less than. Vector C points downward and is smaller than six meters as shown in the vector sum here. Vector D points to the left and is larger than six meters as shown in the vector difference here.
A–B
D6
6
A
B
C6
6
Sensemaking TIPERs Instructors Manual A Copyright © 2015 Pearson Education, Inc.
58
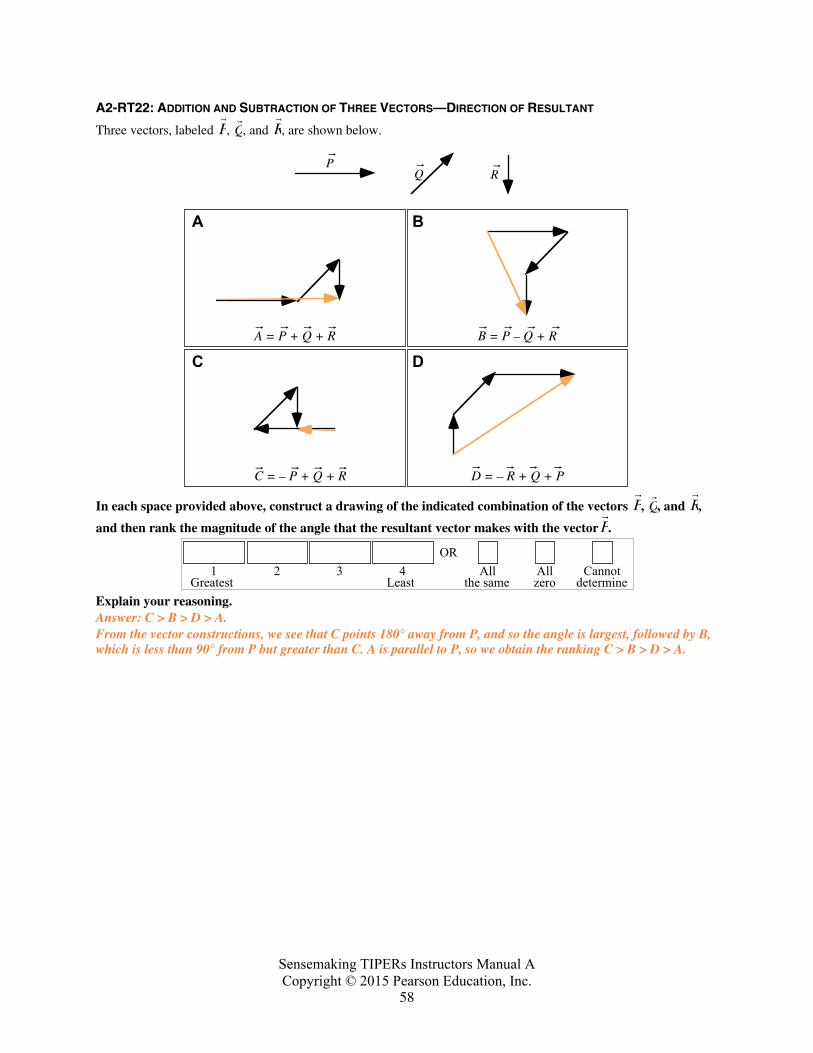
A2-RT22: ADDITION AND SUBTRACTION OF THREE VECTORS—DIRECTION OF RESULTANT
Three vectors, labeled P,
Q, and R, are shown below.
PQ R
A = P + Q + R
A B
B = P – Q + R
D = – R + Q + P
D
C = – P + Q + R
C
In each space provided above, construct a drawing of the indicated combination of the vectors P,
Q, and R,
and then rank the magnitude of the angle that the resultant vector makes with the vector P.
Greatest1
ORAll
the sameAllzero
Cannotdetermine
2 3 4Least
Explain your reasoning. Answer: C > B > D > A. From the vector constructions, we see that C points 180° away from P, and so the angle is largest, followed by B, which is less than 90° from P but greater than C. A is parallel to P, so we obtain the ranking C > B > D > A.
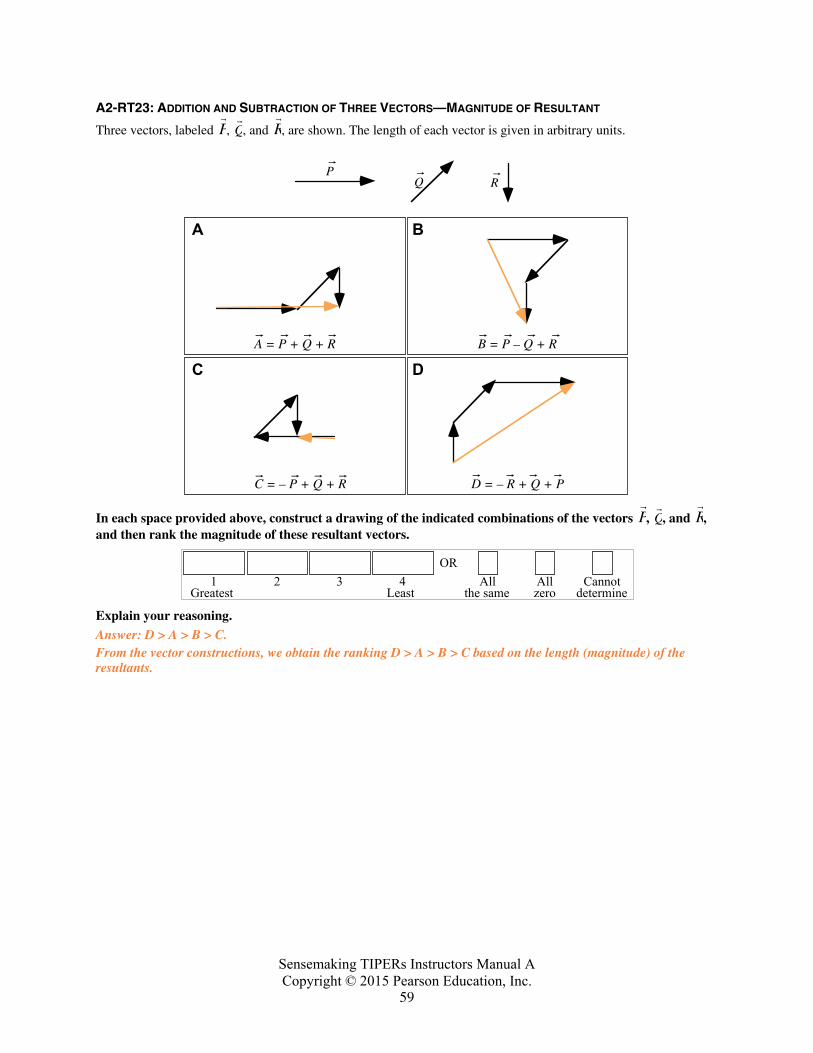
Sensemaking TIPERs Instructors Manual A Copyright © 2015 Pearson Education, Inc.
59
A2-RT23: ADDITION AND SUBTRACTION OF THREE VECTORS—MAGNITUDE OF RESULTANT
Three vectors, labeled P,
Q, and R, are shown. The length of each vector is given in arbitrary units.
PQ R
A = P + Q + R
A B
B = P – Q + R
D = – R + Q + P
D
C = – P + Q + R
C
In each space provided above, construct a drawing of the indicated combinations of the vectors P,
Q, and R, and then rank the magnitude of these resultant vectors.
Greatest1
ORAll
the sameAllzero
Cannotdetermine
2 3 4Least
Explain your reasoning. Answer: D > A > B > C. From the vector constructions, we obtain the ranking D > A > B > C based on the length (magnitude) of the resultants.