Embed Size (px)
Citation preview

Sensing and Sensors
RSS Lecture 4
Monday, Feb 14 2011
Cagdas Onal
Lecture Notes Prepared by Daniela Rus
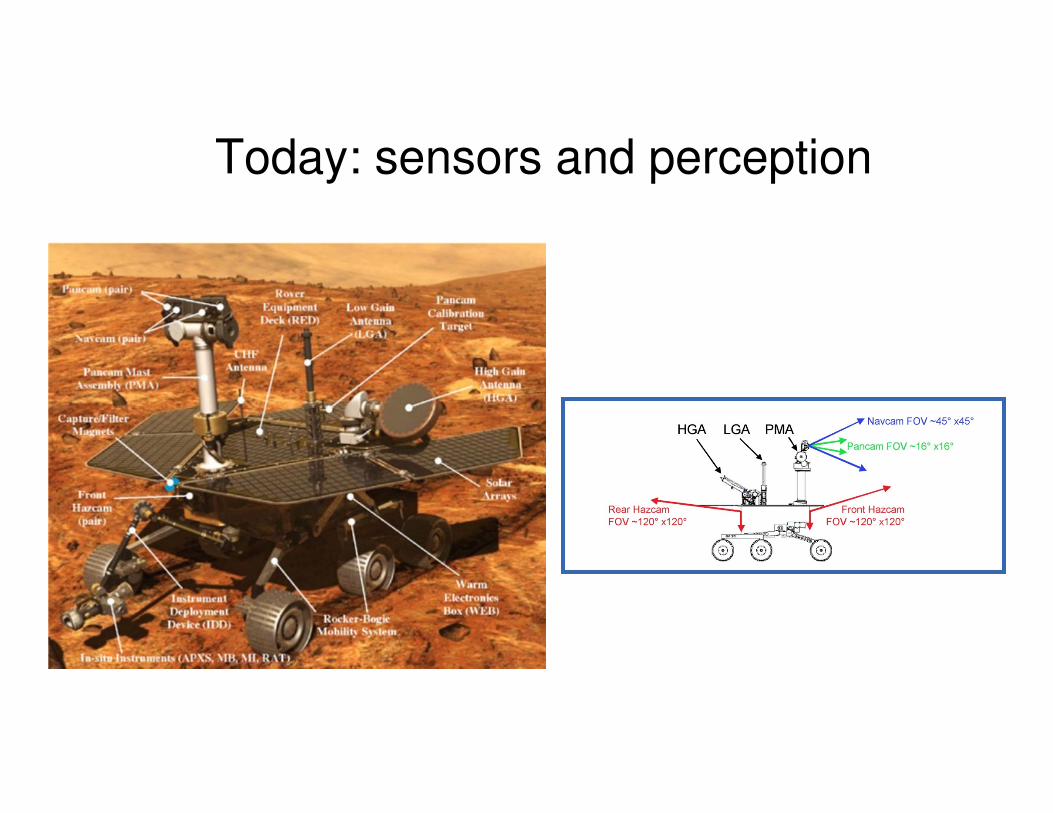
Today: sensors and perception

• What are sensors?
• Types of sensors (many examples)
• Sensor details
Outline
• Examples

• Sensors are limited and crude
• Effectors are limited and crude
Why is robotics hard?
• State is partially-observable
• Environment is dynamic
• Environment is full of potentially-useful (and useless) information
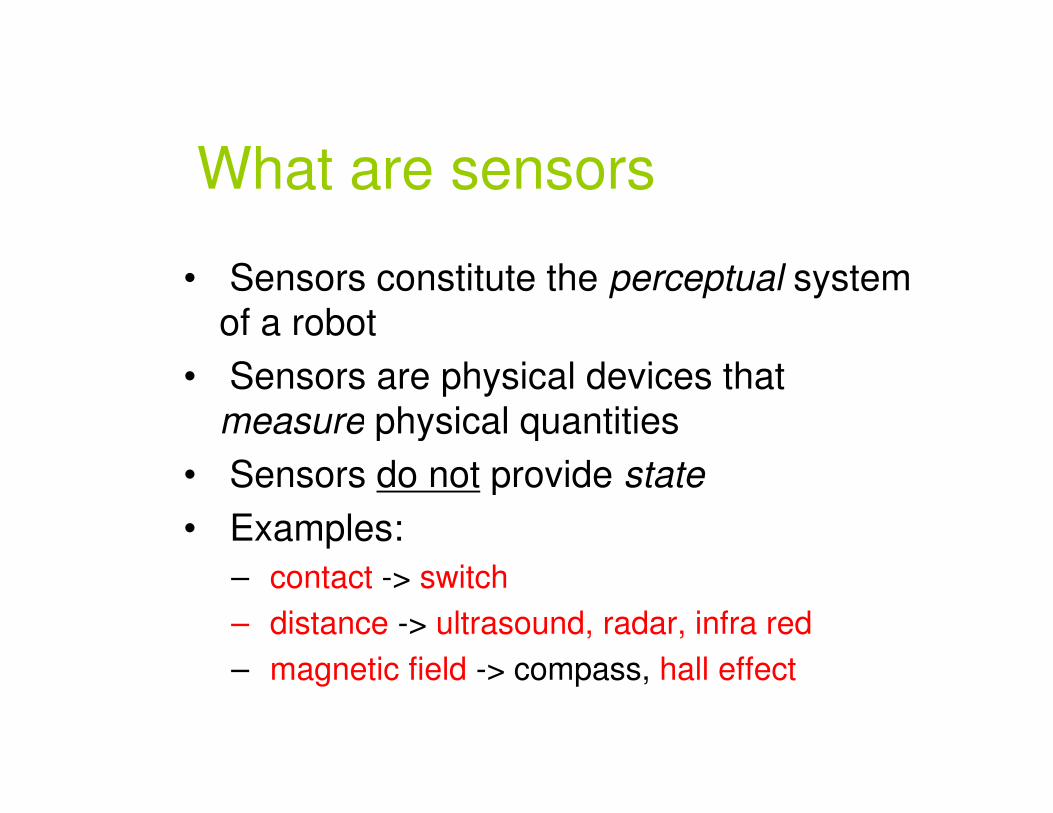
• Sensors constitute the perceptual systemof a robot
• Sensors are physical devices that measure physical quantities
What are sensors
measure physical quantities
• Sensors do not provide state
• Examples:
– contact -> switch
– distance -> ultrasound, radar, infra red
– magnetic field -> compass, hall effect

• More examples:– light level -> photo cells, cameras
– sound level -> microphones
– strain -> strain gauges
Examples of Sensors
– strain -> strain gauges
– rotation -> encoders, switch, potentiometer
– temperature -> thermometer
– gravity -> inclinometers
– acceleration -> accelerometers
– acceleration -> rate gyroscopes
– flames -> UV detector
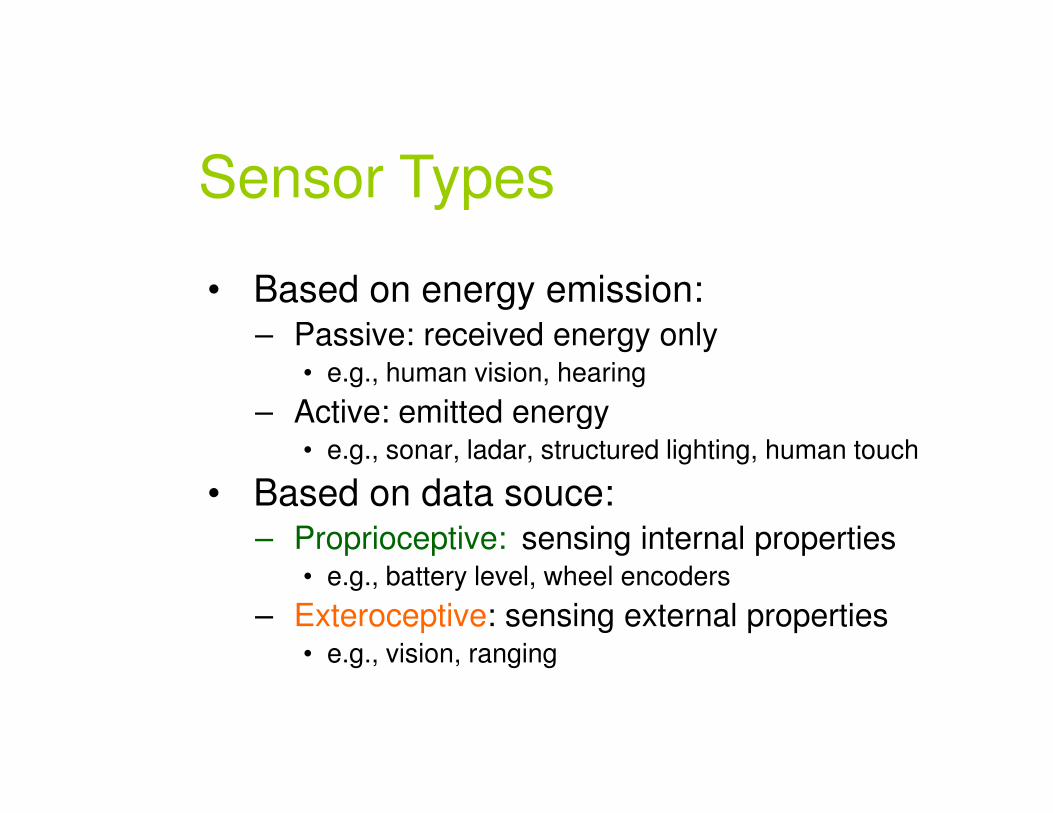
• Based on energy emission:– Passive: received energy only
• e.g., human vision, hearing
– Active: emitted energy
Sensor Types
– Active: emitted energy • e.g., sonar, ladar, structured lighting, human touch
• Based on data souce:– Proprioceptive: sensing internal properties
• e.g., battery level, wheel encoders
– Exteroceptive: sensing external properties• e.g., vision, ranging
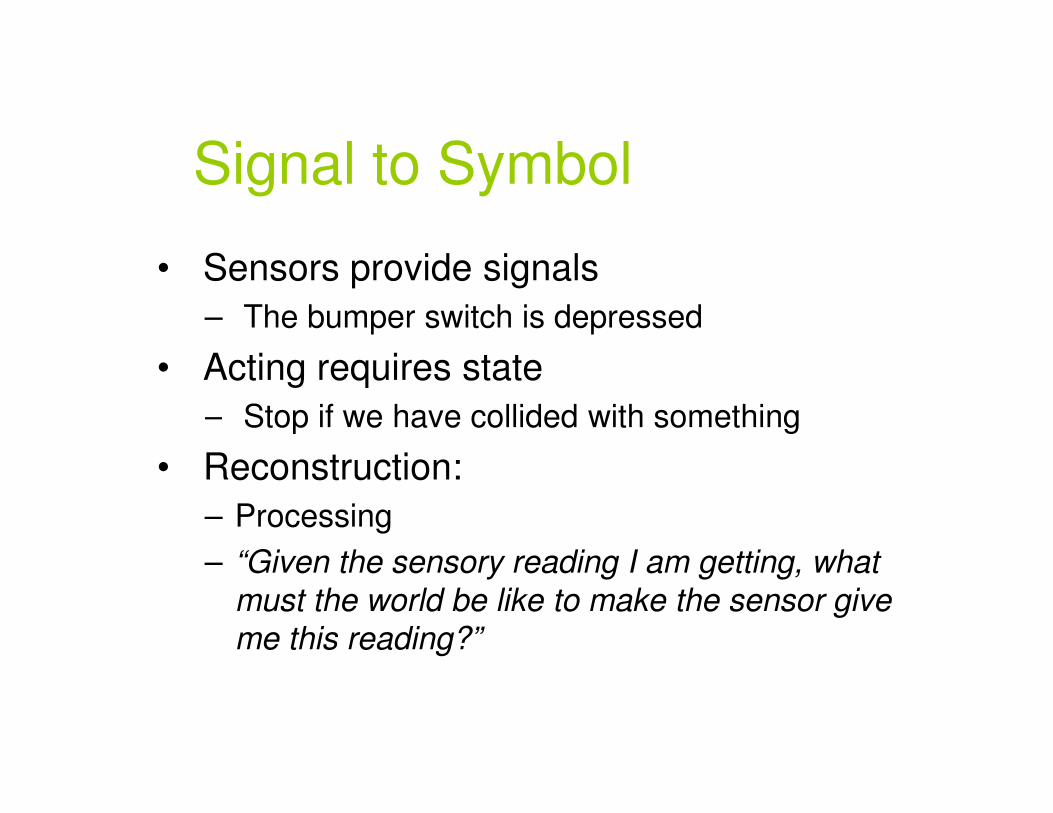
• Sensors provide signals
– The bumper switch is depressed
• Acting requires state
– Stop if we have collided with something
Signal to Symbol
– Stop if we have collided with something
• Reconstruction:
– Processing
– “Given the sensory reading I am getting, what
must the world be like to make the sensor give
me this reading?”

• Determine position of switch from voltage in circuit => electronics
• Using a microphone, separate voice from
Levels of Processing
• Using a microphone, separate voice from noise => signal processing
• Using a camera, find people in the image and recognize “persons of interest” => computation
• temperature: pyro-electric sensors detect special temperature ranges
• movement: if everything else is static or slower/faster
Example: Detecting People
slower/faster
• color: if people wear uniquely colored clothing in your environment
• shape: now you need to do complex vision processing

• Two cameras (i.e., stereo) can give you distance/depth
• Ultrasound sensors (sonar) give distance directly (time of flight)
Example: Measuring Distance
directly (time of flight)
• Infra red provides return signal intensity
• Use perspective projection with 1 camera
• Use structured light; overlying grid patterns on the world

Analog and Digital Signals
• Sensors may output signals in different formats:– Analog level (voltage or resistance)
– Analog waveform
– Digital level
– Digital waveform
– Examples?
• Modern computers require digital inputs
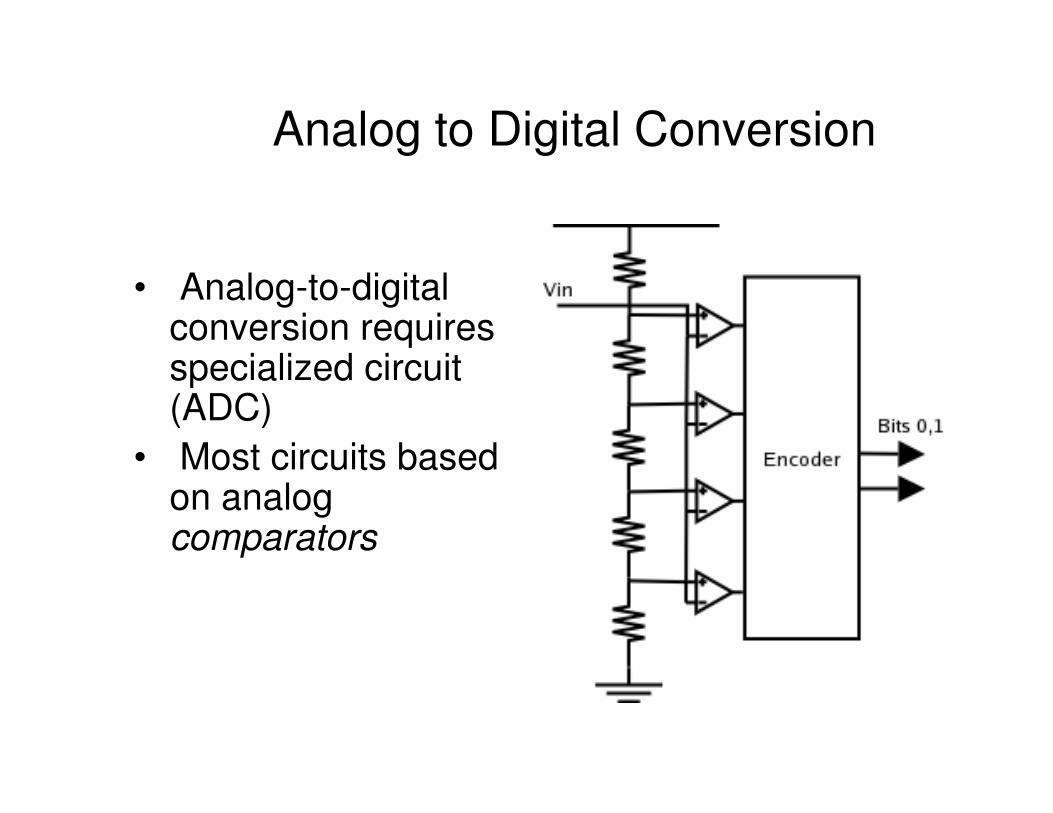
Analog to Digital Conversion
• Analog-to-digital conversion requires specialized circuit (ADC)(ADC)
• Most circuits based on analog comparators
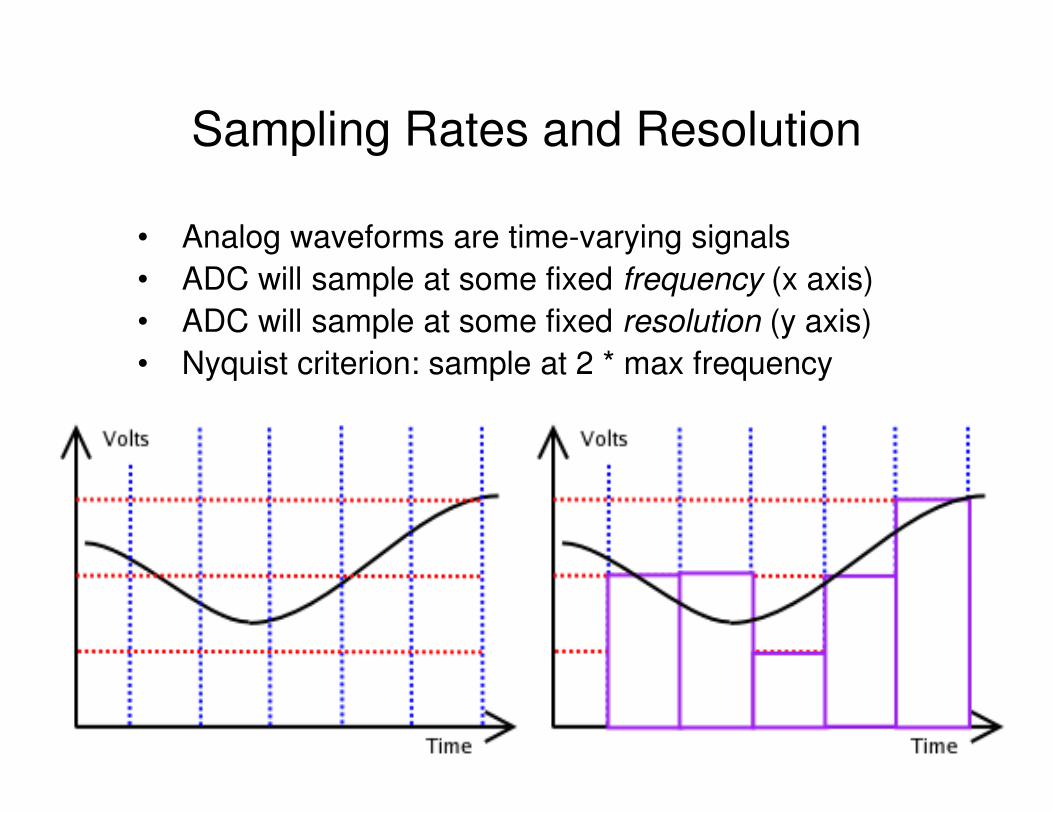
Sampling Rates and Resolution
• Analog waveforms are time-varying signals
• ADC will sample at some fixed frequency (x axis)
• ADC will sample at some fixed resolution (y axis)
• Nyquist criterion: sample at 2 * max frequency
Simple Analog Sensors: Photocells for Light
• Passive sensors for measuring light intensity
• Two technologies:
– Photoresistor: light-dependent resistor
– Photodiode: light-dependent diode– Photodiode: light-dependent diode
• Photoresistor:
– increasing light => decreasing resistance
• Photodiode (forward bias):
– increasing light => increasing current
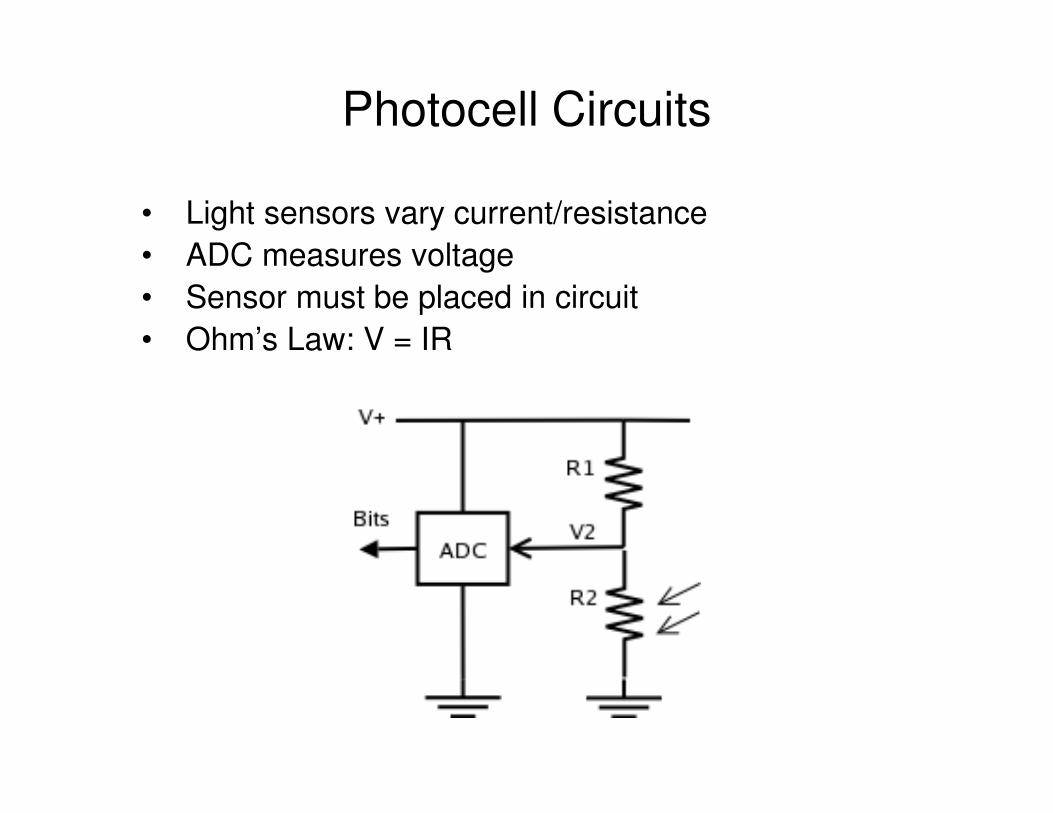
Photocell Circuits
• Light sensors vary current/resistance
• ADC measures voltage
• Sensor must be placed in circuit
• Ohm’s Law: V = IR

Detecting Position

Simple Analog Sensors: Potentiometers for Position
• Potentiometers (pots) vary resistance with shaft position – e.g. volume control on stereo
• Mechanical armature on resistive coil/patter• Mechanical armature on resistive coil/patter
• Relatively simple sensor: single analog value
• Requires ADC

Potentiometer Circuit
• Pots vary resistance
• Attach wire to A; no voltage drop
Avoltage drop
• Attach wire to B: big voltage drop
• ADC measures voltage and is converted to digital value
• Uses?
B

Potentiometer Uses
• Position:
– Joint angle
– Shaft angle
– Linear travel– Linear travel

Detecting Objects

Simple Digital Sensors: Switches for Contact
• Simplest sensor: 1-bit digital
• Minimal circuitry, processing – De-bounce hardware or software
• Normally open (NO):
– Current flows when switch is pressed
• Normally closed (NC):– Current flows when switch is released
• Many types:– Press, toggle, rocker, knife
– Reed, mercury

Switch Uses
• Contact– Trigger on contact with object
• Limit– Trigger when joints are at end of range
• Shaft encoder• Shaft encoder– Count revolutions of shaft (reed)
• Orientation– Detect if robot is tipped over (mercury)

Skin: Electric-conductive fabric

Skin Sensor
• Position of the top of the sensor gives an estimation of the force applied
• Magnetic: – A magnet on the dome, 4 hall effect sensors on the base
• Optical version– A LED and 4 photo receptors on the base

Skin
• 6 tactile sensors on the fingers and thumb
• A tactile sensor has 4 domes with 4 hall domes with 4 hall effect sensors in each dome
• Palm: 16 domes, each with 4 hall effect sensors

Simple Sensors: IR for Object Detection
• Optosensors have emitter detector pair in same package (non-contact switch)
• Reflective and break-beam configurations
• Digital and analog versions
• Video
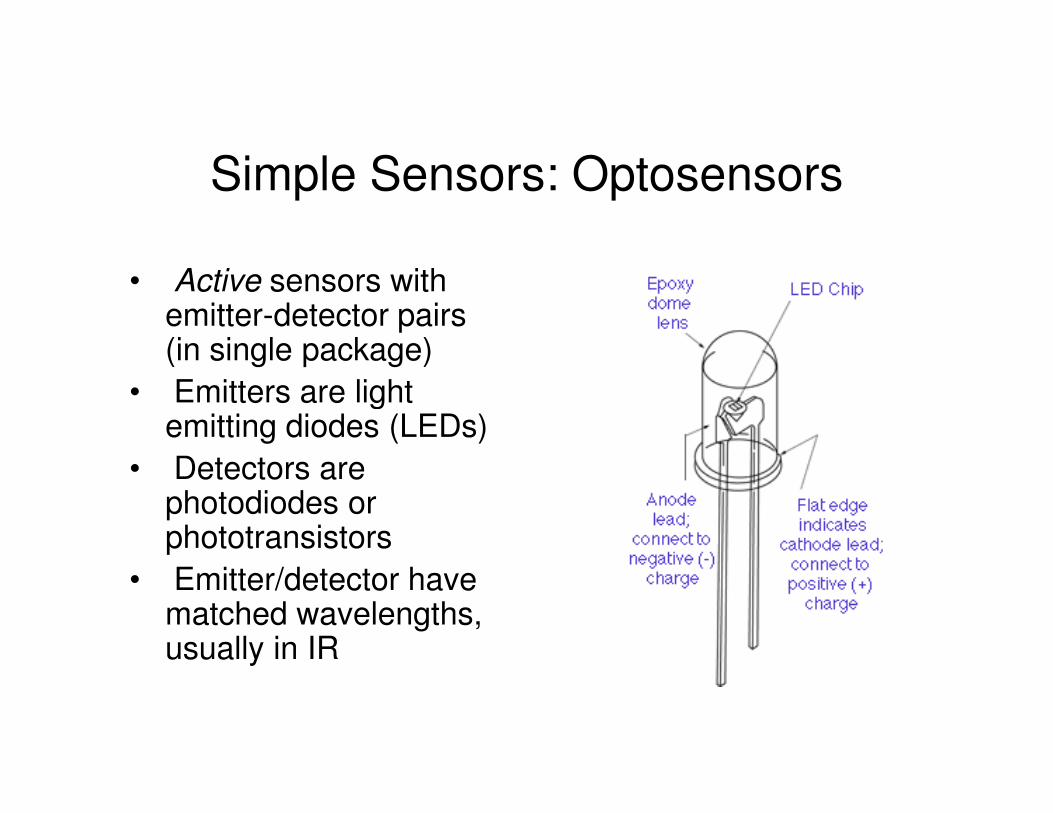
Simple Sensors: Optosensors
• Active sensors with emitter-detector pairs (in single package)
• Emitters are light • Emitters are light emitting diodes (LEDs)
• Detectors are photodiodes or phototransistors
• Emitter/detector have matched wavelengths, usually in IR

Optosensor Uses
• Reflectance– Object proximity
– Feature detection (e.g., retro reflector)
– Bar-code reading
– Shaft encoding– Shaft encoding
• Break-beam– Object presence (e.g., gripper)

Reflectance
• Optosensors measure reflected intensity
• Intensity is a function of range and material properties
• For measuring proximity:– Light objects appear closer– Light objects appear closer
– Dark objects may be invisible
• Require calibration/testing

How do we get distance from the measured
Measuring Distance
How do we get distance from the measured time-of-flight?
Sound/light travels at a constant speed, which varies slightly based on ambient temperature
At room temperature, sound travels at 331 m/sec, or around 30 cm/msec

• Ultrasound range sensing is based on the time-of-flight principle
• The emitter produces a "chirp" of sound (at very high frequency)
Ultrasound
very high frequency)
• Sound travels away from emitter, bounces off barrier, returns to detector
• The time elapsed is measured
Sonar sensor construction
• Some sensors have single emitter/detector pair
• Other sensors have common emitter/detector
• How SONAR works video

Angular Resolution
• Typical sensors have 30 degree angular resolution
• Diffraction limited: wavelength is comparable to emitter size
• e.g., Polaroid transducer: • e.g., Polaroid transducer: – Frequency 50 kHz
– Wavelength 7 mm
– Sensor diameter ~ 40 mm
– Max range ~ 10 m
Limitations? How do we overcome them?

Laser range finders (ladar)
• Sonar sensors measure range using time-of-flight of sound– Sound: 330 m/sec in air
• Laser range finders measure time-of-flight of lightlight– Light: 300,000,000 m/sec in vacuum

Scanning laser range-finders
• Scanning laser range-finder:– Laser range finder
– Rotating mirror(s)– Rotating mirror(s)
• E.g., SICK– 3D planar scan, 180 degree
FOV
• E.g., Riegl– 3D volume scan, 360/80
degree FOV
Fizeau Experiment315,000km/s
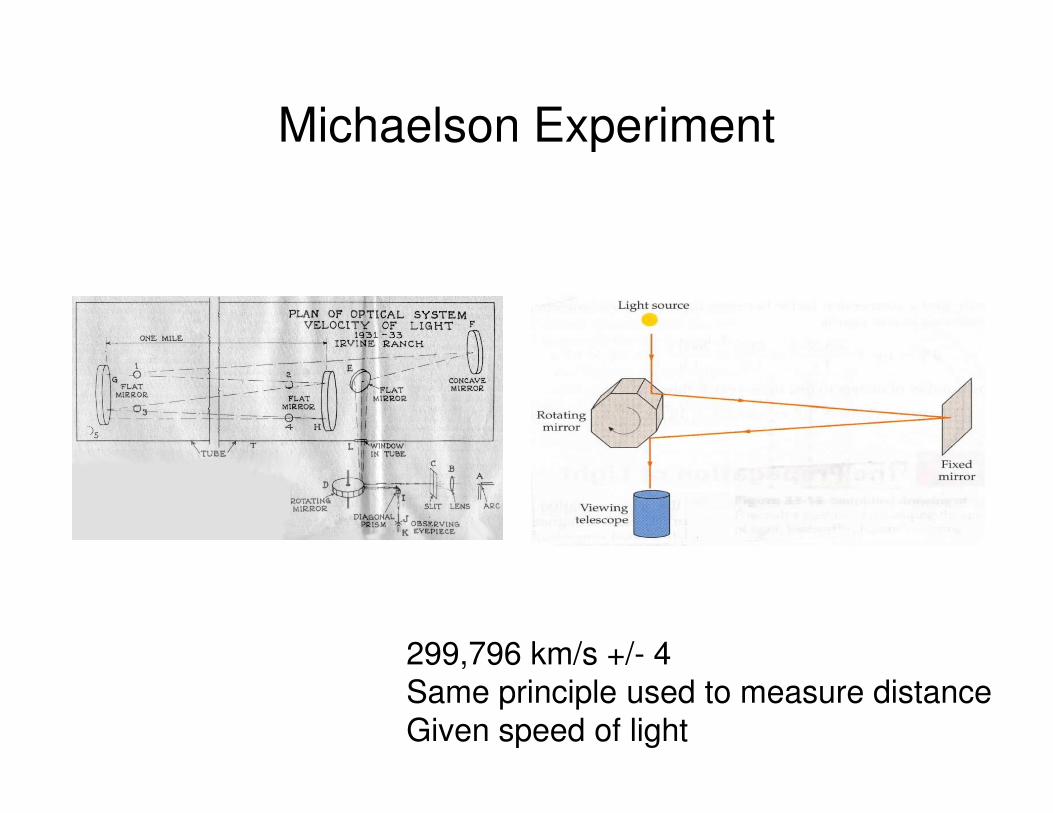
Michaelson Experiment
299,796 km/s +/- 4Same principle used to measure distanceGiven speed of light
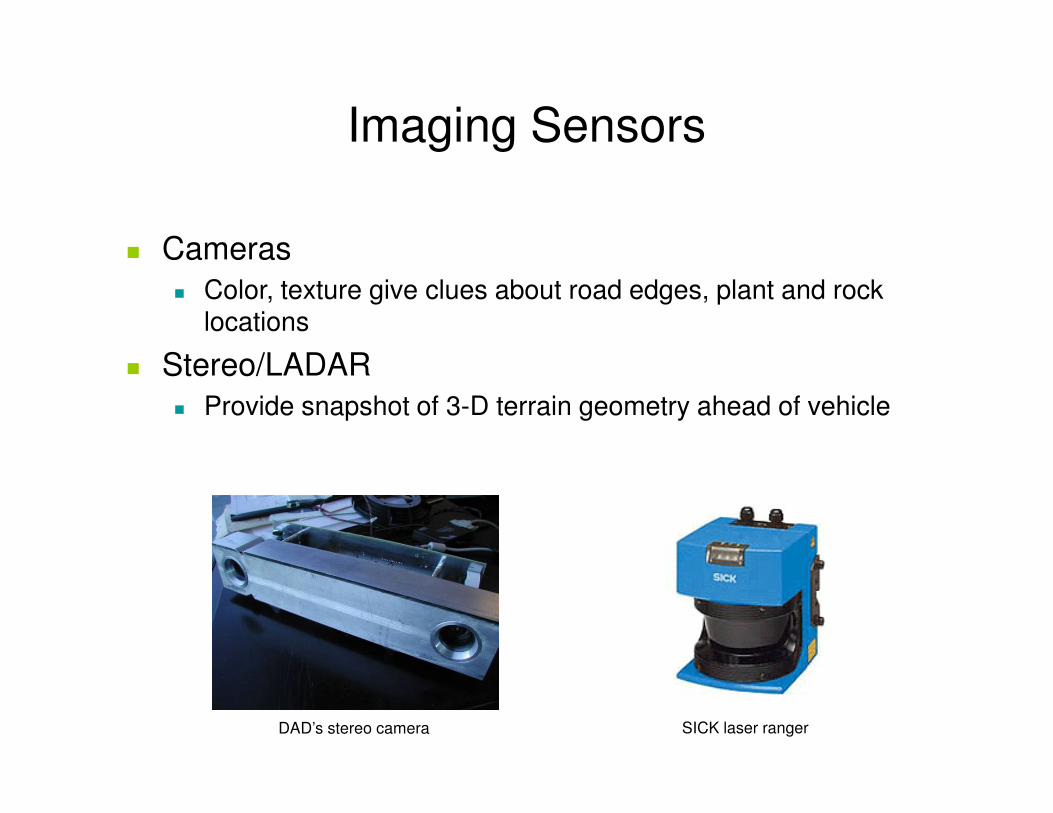
Imaging Sensors
� Cameras� Color, texture give clues about road edges, plant and rock
locations
� Stereo/LADAR
� Provide snapshot of 3-D terrain geometry ahead of vehicle� Provide snapshot of 3-D terrain geometry ahead of vehicle
DAD’s stereo camera SICK laser ranger

LADAR
� LALAser ser DDetection etection AAnd nd RRanginganging
� How it works

LADAR
LMS 291-S05 2D LADAR Scanner; Cost: $3,014
Physical Specifications
� Weight: approx. 19.8 lb
Environment: Outdoor
Data Specifications� Data Interface RS 232 /
RS 422 (configurable)
BACCIGALOPI
� Environment: Outdoor
(Fog Correction)
Electrical Specifications
� Supply Voltage:
24 V DC ± 15%
RS 422 (configurable) � Transfer Rate 9.6 / 19.2
/ 38.4 / 500 kBdSensing Specifications
� Scanning Speed: 75 Hz� Angular View:
100o,180°� Angular Resolution:
0.25° / 0 .50° / 1.00°� Measurement Resolution
10 mm

One-scan Data

Several-scan Data
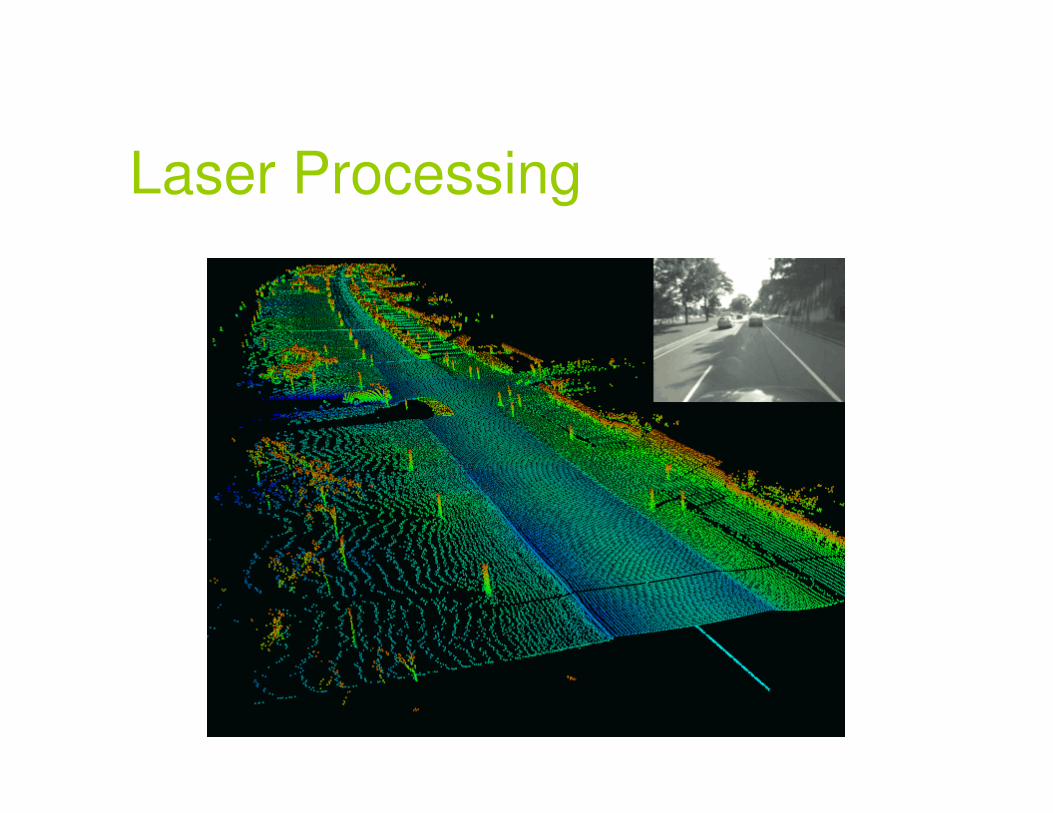
Laser Processing

LADAR (versus SONAR)
• Pros:– Small spot size (good angular resolution)
– High sample rate
– Short wavelength (fewer specular reflections)
• Cons:– Large/heavy
– Complex/expensive

MIT Vehicle: Talos (Land Rover LR3)
• Approach: Perception-based navigation and planning
• Power: 6 kW gas-fueled generator
• Computation: blade cluster (40 processing cores)
• Sensing: 13 lidars, 15 radars, 5 cameras
• Planning and control: rapidly-exploring random tree (RRT), pure-pursuit
• Software: powerful new UDP messaging, visualization architecture• Software: powerful new UDP messaging, visualization architecture

System Architecture
• Perception
– Vehicle surroundings
– Vehicle location w.r.t.surroundings, RNDF
• Planning & Control
– Codified driving rules
Perception
NavigatorMDF
Goal
TrajectoryDrivable surface, lane markings, Obstacles;
Local mapDrivableSurface, Hazards
SituationalPlanner
SensorsSensorsSensorsSensorsSensorsSensorsSensorsRNDF
(DARPA)
– Codified driving rules
– How to reach the goal
• AEVIT Vehicle Conversion (EMC) control unit– Continuous signal (steering, gas/brake)
– Discrete signal (turn signals, gear shift)
Trajectory
Shifter, steer, gas/brake
Vehicle states
markings, Obstacles; Traffic vehicle
Vehicle Controller
Vehicle
Vehicle State
Estimator

One (64x) Velodyne Lidar
• 64 lasers, 360° HFOV• Unit spins at 15 Hz• Vertical FOV
-24° , +2°• Redundant (albeit
relatively noisy) lidar

Sample Velodyne Data
False colored by height

Video Cameras
• 5 Firewire Cameras
– Point Grey Firefly MV
• 720x480 8bpp Bayer pattern @ 22.8 fps
• ~40 MB/s (2.5 GB/min)
Forward left Forward center Forward right
• ~40 MB/s (2.5 GB/min)
– Significant I/O Bandwidth
• Purpose: Detection ofpainted lane markings
Rear view Narrow forward view
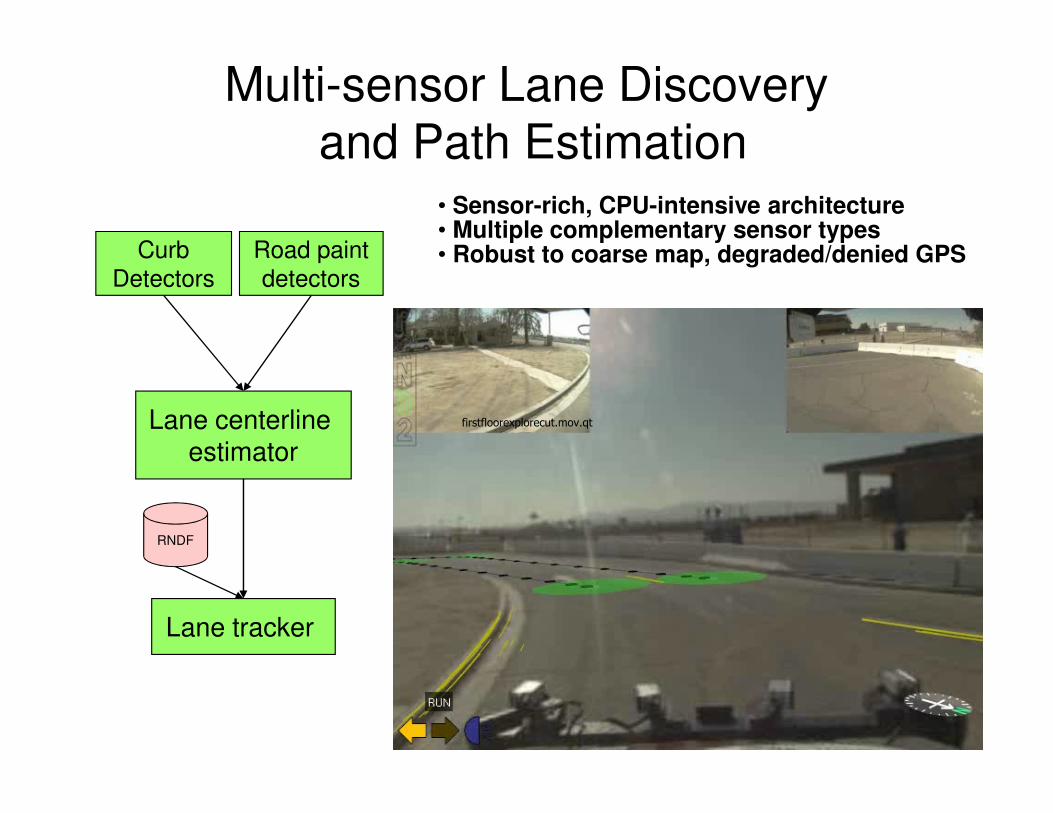
Multi-sensor Lane Discoveryand Path Estimation
Road paintdetectors
CurbDetectors
Lane centerline
• Sensor-rich, CPU-intensive architecture• Multiple complementary sensor types• Robust to coarse map, degraded/denied GPS
Lane centerline estimator
Lane tracker
RNDF
firstfloorexplorecut.mov.qt
Detecting Location
Position Sensors
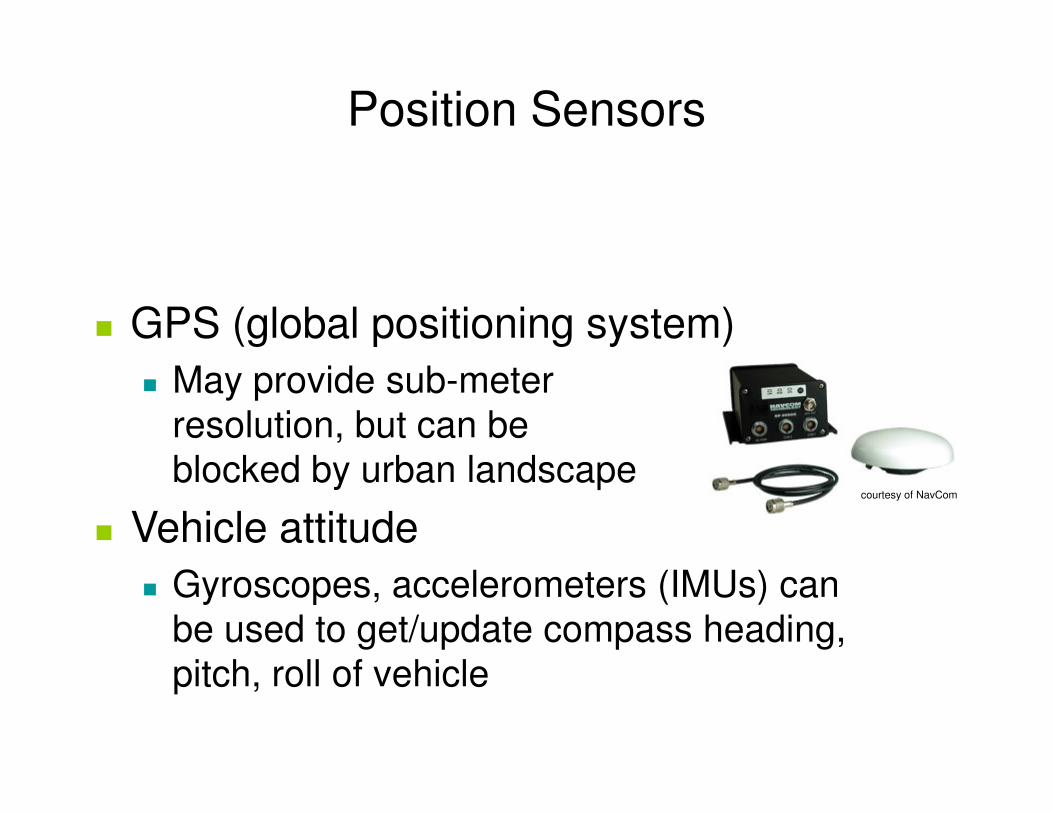
� GPS (global positioning system)
� May provide sub-meter resolution, but can be resolution, but can be blocked by urban landscape
� Vehicle attitude
� Gyroscopes, accelerometers (IMUs) can be used to get/update compass heading, pitch, roll of vehicle
courtesy of NavCom