Embed Size (px)
Citation preview

PUBLISHED VERSION
Monro, Tanya Mary; Moore, Rachel Louise; Nguyen, Mai-Chi; Ebendorff-Heidepriem, Heike; Skouroumounis, George Kyriakos; Elsey, Gordon Michael; Taylor, Dennis Kenwyn Sensing free sulfur dioxide in wine, Sensors, 2012; 12(8):10759-10773.
© 2012 by the authors; licensee MDPI, Basel, Switzerland. This article is an open access article distributed under the terms and conditions of the Creative Commons Attribution license (http://creativecommons.org/licenses/by/3.0/).
http://hdl.handle.net/2440/73696
PERMISSIONS
http://www.mdpi.com/about/openaccess All articles published by MDPI are made available under an open access license worldwide immediately. This means:
• everyone has free and unlimited access to the full-text of all articles published in MDPI journals, and
• everyone is free to re-use the published material given proper accreditation/citation of the original publication.
• open access publication is supported by authors' institutes or research funding agency by payment of a comparatively low Article Processing Charge (APC) for accepted articles.
17th May 2013

Sensors 2012, 12, 10759-10773; doi:10.3390/s120810759
sensors ISSN 1424-8220
www.mdpi.com/journal/sensors
Article
Sensing Free Sulfur Dioxide in Wine
Tanya M. Monro 1, Rachel L. Moore
1, Mai-Chi Nguyen
1, Heike Ebendorff-Heidepriem
1,
George K. Skouroumounis 2, Gordon M. Elsey
2 and Dennis K. Taylor
2,*
1 Institute for Photonics & Advanced Sensing and School of Chemistry & Physics,
The University of Adelaide, Adelaide, SA 5005, Australia;
E-Mails: [email protected] (T.M.); [email protected] (R.M.);
[email protected] (M.-C.N.); [email protected] (H.E.-H.) 2
School of Agriculture, Food and Wine, The University of Adelaide, Waite Campus, PMB 1,
Glen Osmond, SA 5064, Australia; E-Mails: [email protected] (G.K.S.);
[email protected] (G.M.E.)
* Author to whom correspondence should be addressed; E-Mail: [email protected];
Tel.: +61-8-8303-7239; Fax: +61-8-8303-7116.
Received: 26 June 2012; in revised form: 24 July 2012 / Accepted: 25 July 2012 /
Published: 6 August 2012
Abstract: Sulfur dioxide (SO2) is important in the winemaking process as it aids in
preventing microbial growth and the oxidation of wine. These processes and others
consume the SO2 over time, resulting in wines with little SO2 protection. Furthermore, SO2
and sulfiting agents are known to be allergens to many individuals and for that reason their
levels need to be monitored and regulated in final wine products. Many of the current
techniques for monitoring SO2 in wine require the SO2 to be separated from the wine prior
to analysis. This investigation demonstrates a technique capable of measuring free sulfite
concentrations in low volume liquid samples in white wine. This approach adapts a known
colorimetric reaction to a suspended core optical fiber sensing platform, and exploits the
interaction between guided light located within the fiber voids and a mixture of the wine
sample and a colorimetric analyte. We have shown that this technique enables measurements
to be made without dilution of the wine samples, thus paving the way towards real time
in situ wine monitoring.
Keywords: sulfur dioxide; potassium (sodium) metabisulfite; wine; microstructured
optical fiber; sensors; wine sensing; pararosaniline
OPEN ACCESS

Sensors 2012, 12 10760
1. Introduction
In the wine industry, sulfur dioxide (SO2) is frequently added to must and juice as a preservative to
prevent bacterial growth and slow down the process of oxidation by inhibiting oxidative enzymes. SO2 also
improves the taste and retains the wine’s fruity flavors and freshness of aroma [1]. It is commonly
added as either potassium or sodium metabisulfite which, upon addition, forms a pH dependent
speciation in solution.
At low pH, the predominant species is molecular sulfur dioxide (SO2), which exhibits germicidal
properties. However, at the pH of wine (between 3.0 and 3.8) the major species is the bisulfite
anion (HSO3−), which acts as an antioxidant [2]. In this work the collective term used for all species of
SO2 found in wine is ‘sulfites’.
Two classes of sulfites are found in wine: free and bound. The free sulfites are those available to
react and thus exhibit both germicidal and antioxidant properties. The bound sulfites are those that
have reacted (both reversibly and irreversibly) with other molecules within the wine medium. The sum
of the free and bound sulfites defines the total sulfite concentration.
Most countries have strict guidelines as to the maximum levels of total sulfites permissible in wine.
From a winemaking point of view, high concentrations of sulfites can affect the sensory attributes or
characteristics of the wine. Additionally, too much sulfur in the must also delays the malolactic
fermentation of wine, particularly in wines with low pH [1]. For these reasons, the concentration of
sulfites in wine must be closely monitored and regulated.
There are two internationally recognized methods for the quantification of free and total sulfites in
wine or must [3]. The traditional method is the Monier-Williams method [4], where the sample of wine
is acidified and aspirated into a solution containing hydrogen peroxide, which forms sulfuric acid that
is then titrated against a sodium hydroxide solution where a mixed indicator is used to determine the
‘end point’. Several variations of the Monier-Williams method exist for wine analysis including the
Modified Monier Williams method [5], the Optimized Monier-Williams method [6] and the aspiration
(aeration-oxidation) method [7]. The latter is most often employed for sulfite determination of wine
and must in Australia [7]. The aspiration method gives reproducible results and is accurate up to 5%
compared to the Monier-Williams method for both red and white wines [8]. However, this method has
several drawbacks including the requirement for use of a relatively large sample volume (20 mL for
each sample) and the 15 min reaction time, and is also sensitive and thus susceptible to experimental
error. The second method for the analysis of free and total sulfites in wine is the Ripper method [9]
utilizing a direct titration of the wine sample with iodine using a starch indicator. This method is less
accurate than the Monier-Williams method and has several drawbacks [8]. This method is suitable for use
as a quick method estimating the sulfite concentration in wine [10].
Other techniques have also been developed to detect sulfites in wines. These include colorimetric
[11–13], electrochemical [14,15], chemiluminescence [16], chromatrographic [17], fluorometric [18]
and enzymatic [19] methods. Many of these methods are implemented using flow injection systems
that incorporate a gas diffusion unit to remove the molecular SO2 from the liquid prior to detection.
One of the colorimetric techniques that have been used to detect free sulfites utilizes pararosaniline
hydrochloride (PRA), which is a highly conjugated amine salt and one of the components of the
dye ‘basic fuschin’. The addition of hydrochloric acid and formaldehyde to aqueous PRA produces a

Sensors 2012, 12 10761
solution, light purple in color, which turns deep violet when exposed to sulfites. This reagent can be
used as a quantitative test for sulfites based on absorption spectroscopy [20].
Microstructured optical fibers (MOFs) have an array of micron-scale air holes that run along the
length of the fiber [21]. These fibers can be designed such that a significant fraction of the light that is
guided along the fiber is located within the holes, where it is then available to interact with gases or
liquids that are loaded into these holes (Figure 1) [22]. One variant of microstructured fiber that has
been extensively used for sensing is the suspended-core optical fiber, where the core is solid glass [23].
The interaction of the light with the species filling the fiber air holes allows the fibers to be used for
sensing techniques such as absorption [22,24] and fluorescence-based sensing [23,25]. These fibers
can serve as platforms that allow for sensitive, low volume sensing.
Figure 1. (a) Cross section of the suspended core optical fiber used in this wine sensing
platform; (b) Red light being launched into the fiber; some of this light overlaps with the
analyte and is absorbed.
(a) (b)
Here, for the first time, we demonstrate a novel dip sensing platform for wine based on a
colorimetric technique deployed within a microstructured optical fiber. This technique enables the
quantification of free sulfites in small volume samples, including liquid model wine solutions
and several finished white wine samples. This technique utilizes colorimetric reaction between
pararosaniline (PRA), formaldehyde and sulfites [20]. This reaction was first characterized in cuvettes
employing a UV−Vis spectrophotometer, and was then incorporated into a platform based on
suspended core optical fibers to enable sensitive and low volume absorption analysis of wine samples.
2. Experimental Section
2.1. Chemical Reagents
All chemicals were of analytical reagent grade with no further purification. Millipore water was
used throughout the experiments. The PRA solutions and model wine solutions were made fresh on
each day of analysis.

Sensors 2012, 12 10762
2.2. Pararosaniline Solutions
A concentrated pararosaniline stock solution (3.088 × 10⁻³
mol/L) was made by dissolving
pararosaniline hydrochloride (Sigma Aldrich, Sydney, Australia) in a 10% aqueous ethanol solution.
The concentrated stock solution was used to make PRA working solutions. Working solutions
contained pararosaniline hydrochloride, hydrochloric acid (HCl) and formaldehyde in the molar ratio
of 1:1255:125 respectively [11]. For example, a working solution with PRA concentration of
4.68 × 10⁻⁴
mol/L in 25 mL contained 3,790 μL of concentrated PRA stock (3.088 × 10⁻³
mol/L),
1,439 μL of 32% HCl and 189 μL of 36% formaldehyde solution; the volume was then completed
to 25 mL with water. The concentration of PRA in the working solution was adjusted to ensure that
enough PRA molecules were present in solution to react with all of the sulfite molecules.
2.3. Model Wine
Model wine solutions were made via dilution from a stock model wine. The stock model wine
solution contained sodium metabisulfite dissolved in 10% ethanol in saturated potassium bitartrate
(>5.7 g/L in water) solution. The purity of the sodium metabisulfite had previously been determined
(via the aspiration method) to be 92% and the final concentration of sulfites in the stock was adjusted
accordingly. The required volume of model wine stock solution was pipetted into volumetric flasks
and topped with 10% ethanol in saturated potassium bitartrate solution to produce model wine
solutions in the range of 1–100 ppm of sulfites.
2.4. Wine Samples
Two white wines were sourced from local supermarkets; Jacob’s Creek Sauvignon Blanc (12% alcohol)
and Hardys Pinot Grigio (12% alcohol). The wine samples were stored at room temperature and
opened on the day that they were used.
2.5. Fiber
The suspended core optical fibers used for this study was fabricated in-house from commercially
sourced lead silicate glass (Schott F2 glass) using the billet extrusion and fiber drawing technique [26].
Two different fibers with different core sizes were utilized. Figure 2 shows a scanning electron
micrograph (SEM) of the core of the fabricated fibers. The first fiber had an outer diameter of 160 μm
and a core diameter of 2.1 μm, Figure 2(a), and the second fiber, Figure 2(b), had an outer diameter of
130 μm and a core diameter of 1.4 μm. Smaller cores enable access to larger light-liquid overlap, and
thus higher sensitivity in principle, whilst larger cores offer more straightforward optical coupling and
lower loss. The standard absorption of these fibers at 532 nm is approximately 1.12 ± 0.1 dB/m.
2.6. In-Cuvette Measurements
A Varian Cary 500 spectrophotometer (Varian Australia, Melbourne, Australia) was used for all
in-cuvette absorbance measurements. Measurements utilized double beam mode at full slit height in
the UV–Vis mode through plastic cuvettes (4 mL internal volume) with a 1 cm path length. Varian UV

Sensors 2012, 12 10763
Scan application software version 3.00 (399) was used for single time point data acquisition. Varian
scanning kinetics software was used when absorbance was measured as a function of time. Water was
used as the baseline correction, and a heated cell block was used to control the temperature during
analysis.
Figure 2. Scanning electron micrograph (SEM) of the cores of the fabricated F2 glass
suspended core optical fibers used for this study. (a) Fiber 1, core diameter 2.1 μm;
(b) Fiber 2, core diameter 1.39 μm.
(a) (b)
Both single point and kinetic analyses were performed. For the single time point absorption
analysis, equal volumes of PRA working solution and model wine samples were pipetted into a cuvette
and completed to 3 mL with water and left to develop for 10 minutes. When performing kinetic
experiments, equal volumes of the solutions were mixed directly in-cuvette and diluted to 3 mL. A
small magnetic stirrer was used to ensure adequate mixing of the sample during analysis. The cuvette
was sealed with tape to avoid evaporation or potential loss of SO2 gas and assist with obtaining
reproducible results.
The dilution factor used was selected depending on the concentration of the PRA working solution
and model wine solutions to ensure that the absorption values obtained were within the optimal range
of the spectrometer. Model wine samples were analyzed without replication, however, white wine
samples were analyzed in triplicate as a means of testing the reproducibility of this novel sensing
platform.
2.7. In-Fiber Measurements
The schematic of the in-fiber experimental set up is shown in Figure 3(a). The two ends of the fiber
were placed in fiber holders on three-axis nano-translation stages for accurate alignment of the light
into and out of the fiber. Light from the 25 mW 532 nm laser (CrystaLaser, Reno, NV, USA) was
attenuated using a neutral density filter (ND 2) and launched into the core of the fiber using a 60× objective
lens. At the other end of the fiber, a pinhole was used to ensure that any light guided within the
cladding of optical fiber (rather than the core) is not incident on the detector. The transmitted light
guided by the core was focused at the pinhole plane using a 60× objective lens. The pinhole was set to
let the light from the fiber core to pass through to the detector, which was connected to a power meter.
The solutions used in the cuvette experiments were also used for the in-fiber measurements. Equal
volumes of the PRA stock solution and the model wine solution were pipetted into a vial and left for at

Sensors 2012, 12 10764
least 10 minutes to allow the color to develop. It should be noted that for the in-fiber measurements, no
further dilution was found to be necessary. This is one advantage of the optical fiber sensing platform;
by choosing the size of the core of the optical fiber appropriately, it is possible to reduce the light-liquid
interactions to the point where concentrated samples can be analyzed without dilution.
For each absorbance measurement, a piece of optical fiber was cleaved and put on the fiber holders
and held in place with magnets. Approximately 2 cm of the fiber on the filling end was left to protrude
from the edge of the fiber holder (Figure 3(b)). The laser input translation stage was adjusted to
optimize the launch of the laser light into the core of the fiber. The coupling was then maximized by
focusing the transmitted light at the pinhole plane and launched onto the detector and adjusting the
translation stage on the laser end to maximize the optical power. The power was recorded over a 30 second
period. The microscope objective at the filling end was then removed and the vial containing the mixed
solution was put in a holder to allow the fiber tip to be immersed in the liquid whilst maintaining the
alignment of the laser light into the fiber. The fiber was left to fill via capillary forces for a set time
before the vial was taken away. The objective was then replaced on the filling end, and refocused on
the pinhole plane with the laser as before. The power was recorded over a 30 second period.
Immediately after this measurement, the filled length of the fiber was measured under a microscope. A
new length of fiber was used for each measurement.
Figure 3. (a) Experimental set up for the in-fiber absorption measurement (not to scale).
(b) Schematic of the filling phase of the absorption measurement.
(a) (b)
The fiber lengths and filling times were different for the two different fibers used as a result of
differences between the sizes of the holes in each fiber, and this information is summarized in Table 1.
The differences in length were taken into account by calculating the absorbance per cm of filled fiber.
Initial results obtained with fiber 1 produced results with a lot of scatter and therefore in an effort to
reduce the spread in the data, subsequent solutions analyzed with fiber 2 were first filtered through
a 0.45 μm pore filter prior to filling the fiber to ensure that any particulates present did not interfere
with the measurements.
Table 1. Parameters utilized when using fibers 1 and 2.
Fiber
Number
Fiber length
(cm)
Filling time
(minutes)
PRA concentration in
working solution (mol/L)
Sample
filtering
1 19 ± 0.2 7 7.80 × 10⁻⁴ No
2 16 ± 0.2 5 6.24 × 10⁻⁴ Yes

Sensors 2012, 12 10765
3. Results and Discussion
3.1. Preliminary In-Cuvette Optimization
Prior to performing any in-fiber measurements, preliminary experiments were performed in-cuvette
to optimize the experimental technique using model wine.
3.2. Reaction Mechanism
Pararosaniline hydrochloride forms a bright magenta solution (Figure 4(a)) when dissolved in
aqueous solution. Upon acidification with hydrochloric acid, the solution is essentially bleached due to
diminished conjugation resulting in a pale biscuit colored solution (Figure 4(b)). The addition of
formaldehyde results in initial formation of the iminium ion and affords a pale purple solution
(working solution) (Figure 4(c)), which reacts extremely readily with sulfites to ultimately form the
highly conjugated alkyl amino sulfonic acid (colored solution) (Figure 4(d)) as a rich purple solution
which has a peak absorbance between 550 and 560 nm.
The stoichiometry of this reaction between PRA to sulfites is not well understood. It has been
suggested that when PRA is present in large excess, that the mono-substituted product is formed [27],
however Huitt and Lodge [28] claim that the spectrally active product is an equilibrium mixture of
mono-, di-, and tri-substituted pararosaniline and hence it was important to identify the effect of PRA
concentration on the absorbance values of the final product, as well as the time required to achieve the
optimal absorbance.
Figure 4. Chemical structures of the four compounds produced throughout the
pararosaniline reaction and its corresponding colors. (a) Pararosaniline hydrochloride;
(b) Acidified pararosaniline; (c) Pararosaniline working solution; (d) Sulfonic acid mixture
with model wine with 30 ppm sulfite solution in a 1:1 ratio.

Sensors 2012, 12 10766
3.3. Stoichiometry
In order to investigate the level of substitution and its impact on the maximum absorbance obtained,
three PRA working solutions were produced with PRA concentrations of 1.56 × 10⁻⁴
, 3.12 × 10⁻⁴
and
4.68 × 10⁻⁴
mol/L. These concentrations are equivalent to sulfite concentration of 10, 20 and 30 ppm
(1:1 ratio). The latter sulfite concentration is typical of a finished white wine whilst the former would
be considered to be a level where the wine is highly susceptible to oxidation or spoilage. Each of
the PRA solutions (300 μL) was mixed with model wine solutions (300 μL) containing 0–60 ppm of
sulfites and diluted with water. Absorbance was measured over a 400 nm wavelength range to identify
the position of the maximum absorbance obtained and also to investigate peak shape. Figure 5 illustrates
the highest absorbance value obtained for each resultant colored solution plotted against sulfite
concentration. This clearly illustrates the importance of the stoichiometry for this reaction. The graph
illustrates the point where there are insufficient PRA molecules available to react with all of the
sulfites in solution and hence the development of color, and therefore absorbance, begins to plateau. It
is interesting to note that until this point, the absorbance values of the three PRA colored solutions
were similar, suggesting that the maximum absorbance values obtained are independent of the PRA
concentration provided that enough PRA exists to react with the sulfites. Figure 5 shows that the
absorbance values of the lowest concentration of PRA (1.56 × 10⁻⁴
mol/L) begins to deviate from the
trend between 10 and 15 ppm of sulfites, and by 20 ppm the plateau effect is more evident, a similar
observation can be made for the mid-strength PRA solution at a concentration between 30–40 ppm
sulfite concentration. The most concentrated PRA working solution was able to maintain linearity in
absorbance until 60 ppm, suggesting that the di-substituted alkyl amino sulfonic acid predominates.
From this point forward, a 1:2 molar ratio of PRA:sulfite was used to find the appropriate
concentration in the working solution for the detection of sulfites in wine.
Figure 5. Maximum absorbance reading for three concentrations of working solution as a
function of model wine sulfite concentration.
3.4. Color Development
The color development of the final solution was analyzed as a function of time. In order to
investigate the color development, equal volumes of working solution (300 μL of 6.24 × 10⁻⁴
mol/L
PRA) and model wine samples were combined, diluted to a final volume of 3 mL and allowed to

Sensors 2012, 12 10767
develop in-cuvette using a small magnetic stirrer for mixing. Absorbance measurements were taken at
2 minutes intervals, and the highest absorbance value obtained at each time point were plotted against
the development time for 3 concentrations of model wine solutions (Figure 6). This graph illustrates
that color development is essentially complete by 10 minutes for these solutions. Consequently, a
development time of 10 minutes was used.
Figure 6. Maximum absorbance values obtained as a function of time for three
concentrations of sulfites in solution. Hollow data points illustrate the maximum
absorbance value obtained.
3.5. Wavelength Dependence
Initial analysis revealed that the concentration of PRA in the working solution can alter the shape of
the spectra at wavelengths larger than the maximum (greater than ~550 nm). However, at wavelengths
shorter than the maximum, large differences were not observed. In order to observe the maximum
peak height and to establish a calibration curve, a concentrated PRA working solution (150 μL of
7.80 × 10⁻⁴
mol/L) was mixed with model wine solutions (150 μL) ranging in sulfite concentration
from 1–100 ppm and diluted to a final volume of 3 mL. The colored solution was developed for 10 minutes
in-cuvette and the absorbance was recorded from 700–350 nm. The spectra revealed that the maximum
absorbance occurred at approximately 550 nm. However, in order to use this colorimetric technique
within the suspended core optical fiber platform, it was important to ensure that a linear calibration
curve could be achieved at the available laser wavelength, which in this case was 532 nm.
Figure 7 illustrates the full absorbance spectra of each of the colored solutions (0, 1, 10, 20,
30 100 ppm of sulfites). The resulting calibration curves for the maximum absorbance and the
absorbance at 532 nm can be seen in Figure 8. These calibration curves show that the absorbance is
linear, at both positions of the spectra (with an R2 of 0.9977 at 532 nm and 0.9983 at the maximum
peak) and hence the results obtained in cuvette were suitable for use within the fiber sensing platform.
These experiments demonstrate that a linear calibration curve exists at several wavelengths shorter
than the maximum peak height and additionally, these calibration curves will still be valid for several
concentrations of PRA working solution, provided that that concentration of sulfites does not exceed
the concentration of PRA by more than 2:1.

Sensors 2012, 12 10768
Figure 7. Full absorption spectra of colored solution with 0–100 ppm of model wine
solution. Vertical lines illustrate the maximum absorbance obtained, and the absorbance at
532 nm.
Figure 8. Calibration curves obtained at the maximum absorbance and at 532 nm for
solutions containing 0–100 ppm of sulfites using a 7.8 × 10⁻⁴
mol/L working solution.
3.6. Preliminary Fiber Work
Based on the cuvette absorption measurements and the methodology developed above, this
approach was then adapted for use with the convenient optical fiber sensing platform.
The absorbance of the mixture in the fiber, A, was calculated using:
A = [log10(Punfilled/Pfilled)]/L (1)
where Punfilled is the transmitted power of the unfilled fiber, Pfilled is the transmitted power when it is
filled with the mixture of colored solution, and L is path length (the filled length of the fiber).
According to the Beer-Lambert law, the absorbance is defined as A = εLcPF, where ε is the molar
absorptivity of the absorbing material, L is the path length, c is the concentration of the sample and PF
is the power fraction. The power fraction is the fraction of the guided light within the fiber that is
available to interact with the absorbing material (i.e., the fraction of the guided light that is located
within the liquid-filled holes).
For cuvette measurements, all the light interacts with the sample, so the power fraction can be
considered to be equal to 1.0. However, for a MOF with a core of >1 micron in diameter, for visible
Sensors 2012, 12 10769
wavelengths most of the light is confined within the core with only a small fraction spreading into the
holes of the fiber, allowing interaction with the solution that fills these holes. The power fraction is
dependent on wavelength, material type and fiber structure [29]. As mentioned previously, fibers with
a relatively large core diameter have a smaller power fraction compared to fibers with a smaller core
diameter. Thus, to determine if the cuvette measurements agree with the fiber measurements, one can
keep all parameters constant (same samples, path length, sulfur dioxide concentration) and compare
the fiber’s theoretical power fraction with the calculated power fraction by estimating the ratio of the
slopes of the two calibration curves). The power fraction for fiber 1 was calculated to be 1.8 × 10⁻³
and
the power fraction for the smaller core fiber 2 was calculated to be 8 × 10⁻³
. These calculated were
performed analytically by approximating the MOFs by an air-suspended rod surrounded by water and
excited with light at 532 nm.
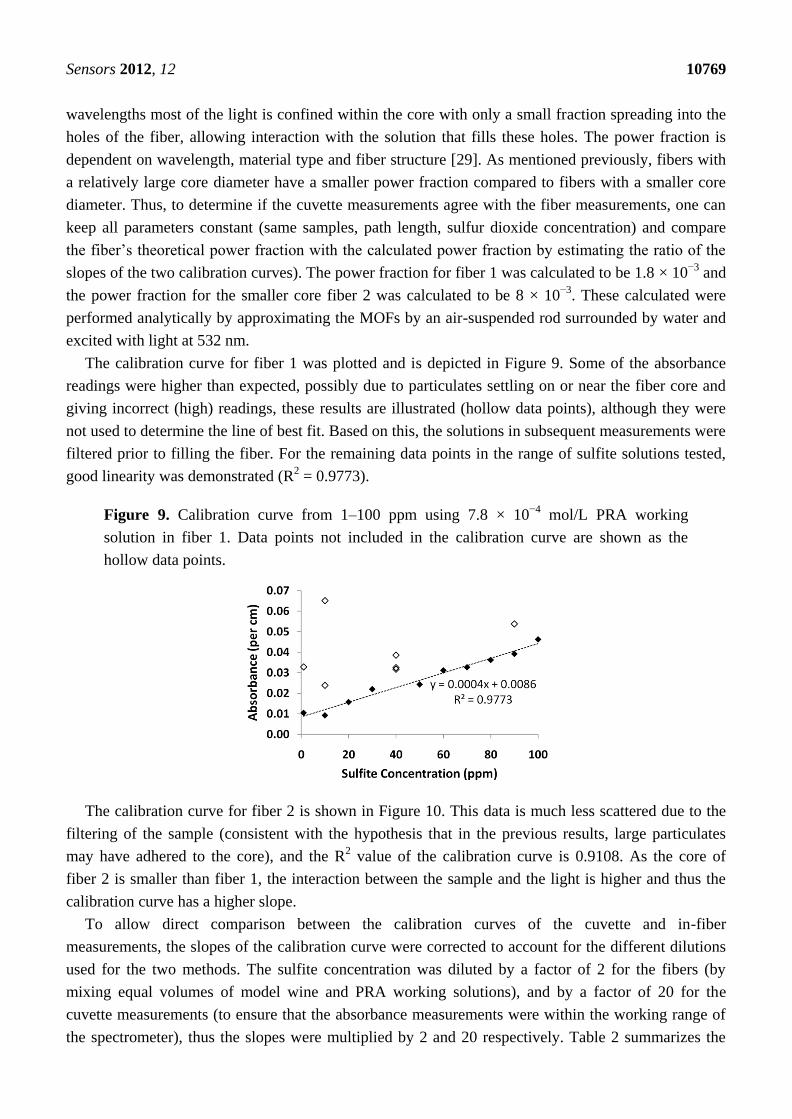
The calibration curve for fiber 1 was plotted and is depicted in Figure 9. Some of the absorbance
readings were higher than expected, possibly due to particulates settling on or near the fiber core and
giving incorrect (high) readings, these results are illustrated (hollow data points), although they were
not used to determine the line of best fit. Based on this, the solutions in subsequent measurements were
filtered prior to filling the fiber. For the remaining data points in the range of sulfite solutions tested,
good linearity was demonstrated (R2 = 0.9773).
Figure 9. Calibration curve from 1–100 ppm using 7.8 × 10⁻⁴
mol/L PRA working
solution in fiber 1. Data points not included in the calibration curve are shown as the
hollow data points.
The calibration curve for fiber 2 is shown in Figure 10. This data is much less scattered due to the
filtering of the sample (consistent with the hypothesis that in the previous results, large particulates
may have adhered to the core), and the R2 value of the calibration curve is 0.9108. As the core of
fiber 2 is smaller than fiber 1, the interaction between the sample and the light is higher and thus the
calibration curve has a higher slope.
To allow direct comparison between the calibration curves of the cuvette and in-fiber
measurements, the slopes of the calibration curve were corrected to account for the different dilutions
used for the two methods. The sulfite concentration was diluted by a factor of 2 for the fibers (by
mixing equal volumes of model wine and PRA working solutions), and by a factor of 20 for the
cuvette measurements (to ensure that the absorbance measurements were within the working range of
the spectrometer), thus the slopes were multiplied by 2 and 20 respectively. Table 2 summarizes the

Sensors 2012, 12 10770
comparison of the theoretical and calculated power fraction. For the measurements with fiber 2 where
sample filtering was used, the measured power fraction was close to the theoretical power fraction
(showing just a 1% difference). This shows that the results achieved in cuvette can be translated to the
fiber platform.
Figure 10. Calibration curve from 1–40 ppm using 6.24 × 10⁻⁴
mol/L PRA working
solution in fiber 2.
Table 2. Comparison of the fiber power fraction and ratio of the slopes. The slope of the
cuvette calibration curve (0.0177) is taken from Figure 8 at 532 nm.
Corrected calibration
curve slope Slopefiber/Slopecuvette
Theoretical power
fraction % Difference
Fiber 1 0.0008 2.3 × 10⁻³ 1.8 × 10⁻³ +26
Fiber 2 0.0028 7.9 × 10⁻³ 8 × 10⁻³ −1
3.7. White Wine Samples
The sulfite concentration for two different white wines was analyzed and quantified using three
different techniques; the aspiration method (aeration-oxidation), PRA method in cuvette and the PRA
method in MOF. The average results for the three methods are illustrated in Figure 11.
Figure 11. Sulfite concentration in two white wine samples utilizing three quantification
methods. Graphical representation of the average results and error bars represent the
maximum and minimum results obtained.

Sensors 2012, 12 10771
The aspiration analysis was performed as outlined by Iland et al. [10] however the suggested
concentration of the sodium hydroxide solution was diluted 10 fold in an attempt to achieve greater
accuracy in the titration results. Each wine was tested in duplicate.
The PRA analysis performed in cuvette utilized a 7.80 × 10⁻⁴
mol/L working solution which was
mixed in equal amount with the white wine sample (150 μL), diluted, developed and analyzed in
triplicate. The absorbance measurements at the maximum peak height were used in conjunction with
the calibration curve illustrated in Figure 8 to determine the concentration of free sulfites in the wine.
The PRA method in MOF utilized a 7.80 × 10⁻⁴
mol/L, which was mixed in a 1:1 ratio with the
white wine sample and analyzed in quadruplicate using fiber 2. The absorbance measurements were
made according to the method outlined previously. Development times for each of the samples ranged
from 17 minutes to 80 minutes. The calibration curve for fiber 2 (Figure 10) was then used to
determine the sulfite concentration in the wine.
The quantitative comparison of the three analysis techniques presented here for sensing free sulfur
dioxide in wine is promising. The results for each of the methods illustrate the same trend; with the
Hardys wine containing a higher concentration of sulfites. It is possible that absorbance spectra of the
wine influenced the absorbance of the colored solution, and if this were to be substantiated this effect
could be removed by changing the sensor design, for example by using a different laser wavelength.
4. Conclusions
The results reported here indicate that the detection of sulfites in model wine with suspended core
optical fibers has the potential to be developed into a platform that can achieve constant, near real-time
wine monitoring cheaply and autonomously. By tailoring the core size of the fiber, the sensitivity of
the system can be modified such that the detection of the sulfites can be carried out without dilution of
the solution. The fibers can also be bundled and utilized to do the same analysis at the same time point.
This will enable an accurate average readout of the sulfite level in the wine with minimal volume loss,
an excellent improvement on current laboratory procedures. The non-intrusive system reported here
will also reduce the risk of spoilage, as a result of oxygen being introduced into the barrel headspace
when large volumes of wine are removed for analysis and causing substantial ullage. Sulfite
measurement is considered the most important measurement in wine analysis, and guides the
winemaker on the wine’s protected state, i.e., microbial spoilage and potential oxidative destruction.
When considering barrel storage areas, containing thousands of barrels, only a randomly selected set of
barrels is usually analyzed by the current techniques due to the sheer number of barrels and the time
and cost of analysis. MOF technology will enable all barrels to be analyzed, not a selected subset, and
at a fraction of the time. Furthermore, the MOF technology developed herein has the ability to be
developed for different analyses, such as acidity, temperature, sugar content and microorganism or
wine taint detection, all of which could be bundled together. It is this attraction that will become the
forefront of modern chemical analysis of wines in the near future after further development. It is the
simplicity of this technique that may enable it to be utilized on a large scale and allow winemakers to
ensure the health of their wines throughout the wine making process, not just wines in barrel storage
and at minimal cost. Clearly there are many potential applications including, but not limited to, an
early warning device that could alert the winemaker when levels of sulfites are outside of the desired range.

Sensors 2012, 12 10772
Acknowledgments
This project was supported by the School of Agriculture, Food and Wine, University of Adelaide,
by Adelaide University’s Wine 2030 Research Network as well as by Australia’s grapegrowers and
winemakers through their investment body, the Grape and Wine Research and Development
Corporation, wi0th matching funds from the Australian Government. T. Monro acknowledges the
support of an ARC Federation Fellowship. We would like to acknowledge Erik Schartner for valuable
discussions and advice with experiments, and Roger Moore for fiber fabrication.
References
1. Peynaud, E. Knowing and Making Wine; John Wiley & Sons: New York, NY, USA, 1984;
pp. 135–136, 267–269.
2. Stockley, C. Sulfur dioxide and the wine consumer. Aust. N. Z. Grapegrow. Winemaker 2005,
501, 73–76.
3. Compendium of International Methods of Wine and Must Analysis; O.I.V.: Paris, France, 2006;
Volume 2.
4. Monier, W.G.W. The determination of sulfur dioxide in foods. Analyst 1927, 52, 343–344.
5. Method 962.16. in Official Methods of Analysis, 16th ed.; AOAC International: Gaithersburg,
MD, USA, 1995.
6. Method 990.28. in Official Methods of Analysis, 16th ed.; AOAC International: Gaithersburg,
MD, USA, 1995.
7. Rankine, B.C.; Pocock, K.J. Alkalimetric determination of sulfur dioxide in wine. Austral. Wine
Brew. Spirits Rev. 1970, 88, 40–44.
8. Buechsenstein, J.; Ough, C. SO2 Determination by aeration-oxidation: A comparison with ripper.
Am. J. Enol. Vitic. 1978, 29, 161–164.
9. Ripper, M. Schweflige säure in weinen und deren bestimmung. J. Prakt. Chem. 1892, 46, 428–473.
10. Iland, P.; Bruer, N.; Edwards, G.; Weeks, S.; Wilkes, E. Analysis Method In Chemical Analysis of
Grapes and Wine: Techniques and Concepts; Patrick Iland Wine Promotions: Campbelltown,
Australia, 2004; p. 57.
11. Segundo, M.; Rangel, A. A gas diffusion sequential injection system for the determination of
sulphur dioxide in wines. Anal. Chim. Acta 2001, 427, 279–286.
12. Oliveira, S.; Lopes, T.; Tóth, I.; Rangel, A. Development of a gas diffusion multicommuted flow
injection system for the determination of sulfur dioxide in wines, comparing malachite green and
pararosaniline chemistries. J. Agric. Food Chem. 2009, 57, 3415–3422.
13. Prieto, A.; Pavón, J.; Cordero, B. Gas diffusion and micellar catalysis in the flow injection
determination of sulphite. Analyst 1994, 119, 2447–2452.
14. Cardwell, T.; Cattall, R.; Chen, G.; Scollary G.; Hamilton, I. Determination of free sulphur
dioxide in red wine by alternating current voltammetry. Analyst 1991, 116, 253–256.
15. Azevedo, C.; Araki, K.; Toma, H.; Angnes, L. Determination of sulfur dioxide in wines by
gas-diffusion flow injection analysis utilizing modified electrodes with electrostatically assembled
films of tetraruthenated porphyrin. Anal. Chim. Acta 1999, 387, 175–180.

Sensors 2012, 12 10773
16. Huang, Y.; Zhang, C.; Zhang, X.; Zhang, Z. Chemiluminescence of sulfite based on
auto-oxidation sensitized by rhodamine 6G. Anal. Chim. Acta 1999, 391, 95–100.
17. Koch, M.; Köppen, R.; Siegel, D.; Witt, A.; Nehls, I. determination of total sulfite in wine by ion
chromatography after in-sample oxidation. J. Agric. Food Chem. 2010, 58, 9463–9467.
18. Yang, X.; Guo, X.; Zhao, Y. Novel spectrofluorimetric method for the determination of sulfite
with rhodamine B hydrazide in a micellar medium. Anal. Chim. Acta 2002, 456, 121–128.
19. Smith, V. Determination of sulfite using a sulfite oxidase enzyme electrode. Anal. Chem. 1987,
59, 2256–2259.
20. West, P.; Gaeke, G. Fixation of sulfur dioxide as disulfitomercurate (II) and subsequent
colorimetric estimation. Anal. Chem. 1956, 28, 1816–1819.
21. Russell, P. Photonic crystal fibers. Science 2003, 299, 358–362.
22. Euser, T.G.; Chen, J.S.Y.; Scharrer, M.; Russell, T.S.J.; Farrer, N.J.; Sadler P.J. Quantitative
broadband chemical sensing in air-suspended solid-core fibers. J. Appl. Phys. 2008, 103, 103108.
23. Monro, T.M.; Warren, S.S.C.; Schartner, E.P.; François, A.; Heng, S.; Ebendorff, H.H.;
Afshar, V.S. Sensing with suspended-core optical fibers. Opt. Fiber Technol. 2010, 16, 343–356.
24. Yu, X.; Kwok, Y.; Amirah, K.N.; Shum, P. Absorption detection of cobalt(II) ions in an
index-guiding microstructured optical fiber. Sens. Actuators B 2009, 137, 462–466.
25. Coscelli, E.; Sozzi, M.; Poli, F.; Passaro, D.; Cucinotta, A.; Selleri, S.; Corradini, R.; Marchelli, R.
Toward a highly specific dna biosensor: Pna-modified suspended-core photonic crystal fibers.
IEEE J. Sel. Top. Quantum Electron. 2010, 16, 967–972.
26. Ebendorff, H.H.; Warren, S.S.; Monro, T.M. Suspended nanowires: Fabrication, design and
characterization of fibers with nanoscale cores. Opt. Express 2009, 17, 2646–2657.
27. Pate, J.; Lodge, J.; Wartburg, A. Effect of pararosaniline in the trace determination of sulfur
dioxide. Anal. Chem. 1962, 34, 1660–1662.
28. Huitt, H.; Lodge, J. Equilibrium effects in determination of sulfur dioxide with pararosaniline and
formaldehyde. Anal. Chem. 1964, 36, 1305–1308.
29. Warren, S.S.; Heng, S.; Ebendorff, H.H.; Abell, A.; Monro, T.M. Fluorescence-based aluminum
ion sensing using a surface-functionalized microstructured optical fiber. Langmuir 2011, 27,
5680–5685.
© 2012 by the authors; licensee MDPI, Basel, Switzerland. This article is an open access article
distributed under the terms and conditions of the Creative Commons Attribution license
(http://creativecommons.org/licenses/by/3.0/).