Embed Size (px)
Citation preview

University of Central Florida University of Central Florida
STARS STARS
Electronic Theses and Dissertations, 2004-2019
2006
Sensitivity Analysis Of Aashto's 2002 Flexible And Rigid Pavement Sensitivity Analysis Of Aashto's 2002 Flexible And Rigid Pavement
Design Methods Design Methods
Sanjay Shahji University of Central Florida
Part of the Civil Engineering Commons
Find similar works at: https://stars.library.ucf.edu/etd
University of Central Florida Libraries http://library.ucf.edu
This Masters Thesis (Open Access) is brought to you for free and open access by STARS. It has been accepted for
inclusion in Electronic Theses and Dissertations, 2004-2019 by an authorized administrator of STARS. For more
information, please contact [email protected].
STARS Citation STARS Citation Shahji, Sanjay, "Sensitivity Analysis Of Aashto's 2002 Flexible And Rigid Pavement Design Methods" (2006). Electronic Theses and Dissertations, 2004-2019. 1062. https://stars.library.ucf.edu/etd/1062

SENSITIVITY ANALYSIS OF AASHTO’S 2002 FLEXIBLE AND RIGID PAVEMENT DESIGN METHODS
by
SANJAY SHAHJI B.E. Mumbai University, 2002
A thesis submitted in partial fulfillment of the requirements for the degree of Master of Science
in the Department of Civil & Environmental Engineering in the College of Engineering and Computer Science
at the University of Central Florida Orlando, Florida
Spring Term 2006

ii
© 2006 Sanjay Shahji

iii
ABSTRACT
Over the years pavement design has been based on empirical equations developed from
the American Association of State Highway Transportation Officials (AASHTO) road tests. The
various editions of the AASHTO pavement design guide have served well for several decades;
nevertheless many serious limitations existed for their continued use as the nation’s primary
pavement design procedure. For example, the traffic loads and truck sizes have increased over
the years, the AASHTO design equations were derived based on the climatic conditions present
at the Road Tests site, and the issue of aging materials was not addressed in the design.
To overcome these limitations AASHTO finally proposed the AASHTO 2002 design
guide which is based on mechanistic – empirical approach and serves to address the
shortcomings and limitations of the earlier empirical design equations developed from the Road
Tests.
In this report, sensitivity analyses were conducted of the new AASHTO 2002 method for
both flexible and rigid pavements, to understand its performance with respect to the various
design parameters. Several important design parameters were selected and were varied one at a
time and their effect on the pavement distresses was found. The sensitivity analysis included
different amount of traffic loads, base materials, base material thicknesses, surface/slab layer
thicknesses and subgrade materials. Some of the illogical results obtained from the sensitivity
analyses were also addressed.
.

iv
.
ACKNOWLEDGMENTS
The writer wishes to express his sincere appreciation and gratitude to his major advisor,
Dr. Shiou-San Kuo, for his guidance and assistance during investigation and preparation of this
research report and for his constant inspiration throughout the graduate program. Special thanks
to the other members of the writer’s guidance committee – Dr. Manoj Chopra and Dr. Hesham
Mahgoub.

v
TABLE OF CONTENTS
LIST OF FIGURES ..................................................................................................................... viii
LIST OF TABLES....................................................................................................................... xiii
CHAPTER ONE: INTRODUCTION............................................................................................. 1
1.1 Problem Statement ................................................................................................................ 1
1.2 Thesis Organisation .............................................................................................................. 2
1.3 Objective ............................................................................................................................... 3
CHAPTER TWO: LITERATURE REVIEW................................................................................. 4
2.1 Introduction........................................................................................................................... 4
2.2 AASHTO Design Equations ................................................................................................. 5
2.2.1 Original AASHTO Design Equations for flexible pavements....................................... 6
2.2.2 Original AASHTO Design Equations for Rigid pavements .......................................... 8
2.3 Need for Mechanistic- Empirical Design ........................................................................... 10
2.4 2002 Mechanistic Empirical Design Models...................................................................... 11
2.4.1 Models for flexible pavement distresses...................................................................... 12
2.4.1.1 Permanent Deformation in Asphalt mixtures ....................................................... 12
2.4.1.2 Permanent Deformation in Unbound Materials ................................................... 14
2.4.1.3 Permanent Déformation of Total Pavement Structure ......................................... 17
2.4.1.4 Fatigue Cracking in Asphalt Mixtures.................................................................. 18
2.4.2 Models for Rigid Pavement Distresses ........................................................................ 21
2.4.2.1 JPCP Cracking Model .......................................................................................... 21
2.4.2.2 JPCP Faulting Model ........................................................................................... 22
2.4.2.3 CRCP Punchout Model......................................................................................... 24
vi
CHAPTER THREE: AASHTO 2002 DESIGN METHODOLOGY ........................................... 27
3.1 Introduction......................................................................................................................... 27
3.2 Pavement Design Components ........................................................................................... 28
3.2.1 Design Inputs ............................................................................................................... 28
3.2.2 Processing of inputs over design analysis period ........................................................ 29
3.2.3 Pavement Response Model .......................................................................................... 30
3.2.4 Incremental Distress and Damage accumulation......................................................... 30
3.2.5 Distress Prediction ....................................................................................................... 31
3.2.5.1 International Roughness Index (IRI) ................................................................... 31
3.2.5.2 Bottom-up Fatigue cracking or Alligator cracking .............................................. 32
3.2.5.3 Surface-down fatigue cracking or Longitudinal Cracking ................................... 33
3.2.5.4 Thermal Cracking ................................................................................................. 34
3.2.5.5 Permanent Deformation........................................................................................ 34
3.2.5.6 Joint Faulting for JPCP........................................................................................ 35
3.2.5.7 Transverse Slab Cracking in JPCP ...................................................................... 35
3.2.5.8 Punchouts in CRCP .............................................................................................. 36
3.2.6 Design Reliability: ....................................................................................................... 36
CHAPTER FOUR: RESULTS OF SENSITIVITY ANALYSIS................................................. 37
4.1 Flexible Pavement Sensitivity Analysis.............................................................................. 37
4.2 Rigid Pavement Sensitivity Analysis................................................................................ 101
4.2.1 Jointed Plain Concrete Pavement (JPCP) .................................................................. 101
4.2.2 Continuous Reinforced Concrete Pavement (CRCP) ................................................ 135
CHAPTER FIVE: COMPARISON OF METHODS.................................................................. 152

vii
CHAPTER SIX: SUMMARY OF RESULT AND CONCLUSION ......................................... 156
6.1 Flexible Pavements ........................................................................................................... 156
6.1.1 Tabulated Results....................................................................................................... 156
6.1.2 Conclusions on Flexible Pavement............................................................................ 159
6.2 Rigid Pavements ............................................................................................................... 162
6.2.1 Tabulated Results (Jointed Plain Concrete Pavement) .............................................. 162
6.2.2 Conclusions on Jointed Plain Concrete Pavement (JPCP) ........................................ 165
6.2.3 Tabulated Results (Continuous Reinforced Concrete Pavement).............................. 166
6.2.4 Conclusions on Continuous Reinforced Concrete Pavement (CRCP) ...................... 167
APPENDIX: AASHTO 2002 SOFTWARE OUTPUT FOR FLEXIBLE PAVEMENT
EXAMPLE.................................................................................................................................. 169
LIST OF REFERENCES............................................................................................................ 210

viii
LIST OF FIGURES
Figure 1: Terminal IRI vs AADTT............................................................................................... 42
Figure 2: AC surface down cracking vs AADTT ......................................................................... 43
Figure 3: AC bottom up cracking vs AADTT .............................................................................. 44
Figure 4: AC Thermal Fracture vs AADTT ................................................................................. 45
Figure 5: Permanent Deformation (AC only) vs AADTT............................................................ 46
Figure 6: Permanent Deformation (Total Pavement) vs AADTT ................................................ 47
Figure 7: Permanent Deformation in different pavement layers over the design life................... 48
Figure 8: Terminal IRI vs AC Layer Thickness .......................................................................... 49
Figure 9: AC Surface down cracking vs AC Layer Thickness..................................................... 50
Figure 10: AC bottom up cracking vs AC layer thickness ........................................................... 51
Figure 11: AC thermal fracture vs Asphalt Layer thickness......................................................... 52
Figure 12: Permanent Deformation (AC only) vs Asphalt Layer Thickness................................ 53
Figure 13: Permanent Deformation (Total Pavement) vs AC layer thickness.............................. 54
Figure 14: Terminal IRI vs Base layer thickness.......................................................................... 55
Figure 15: AC surface down cracking vs Base layer thickness .................................................... 56
Figure 16: AC bottom up cracking vs Base layer thickness ......................................................... 57
Figure 17: AC thermal fracture vs Base layer thickness............................................................... 58
Figure 18: Permanent Deformation (AC only) vs Base layer thickness....................................... 59
Figure 19: Permanent deformation (total) pavement vs Base Layer thickness ............................ 60
Figure 20: Terminal IRI vs Base layer modulus........................................................................... 61
Figure 21: AC surface down cracking vs Base layer modulus ..................................................... 62

ix
Figure 22:AC bottom up cracking vs Base layer modulus ........................................................... 63
Figure 23: AC thermal fracture vs Base layer modulus................................................................ 64
Figure 24: Permanent Deformation (AC only) vs Base layer modulus ........................................ 65
Figure 25: Permanent deformation (Total Pavement) vs Base layer modulus ............................. 66
Figure 26: Terminal IRI vs Subbase thickness ............................................................................. 67
Figure 27: AC surface down cracking vs Subbase layer thickness .............................................. 68
Figure 28:AC bottom up cracking vs Subbase layer thickness..................................................... 69
Figure 29:AC thermal fracture vs Subbase layer thickness .......................................................... 70
Figure 30: Permanent deformation (AC only) vs Subbase layer thickness .................................. 71
Figure 31: Permanent deformation (Total Pavement) vs Subbase layer thickness....................... 72
Figure 32: Terminal IRI vs Subbase layer modulus ..................................................................... 73
Figure 33: AC surface down cracking vs Subbase layer modulus................................................ 74
Figure 34: AC bottom up cracking vs Subbase layer modulus..................................................... 76
Figure 35: AC thermal fracture vs Subbase layer thickness ......................................................... 77
Figure 36: Permanent deformation (AC only) vs Subbase layer Modulus................................... 78
Figure 37: Permanent deformation (Total Pavement) vs Subbase layer thickness....................... 79
Figure 38: Terminal IRI vs Subgrade modulus............................................................................. 80
Figure 39: AC surface down cracking vs Subgrade Modulus ...................................................... 81
Figure 40: AC bottom up cracking vs Subgrade modulus............................................................ 82
Figure 41: AC thermal fracture vs Subgrade modulus ................................................................. 83
Figure 42: Permanent deformation (AC only) vs Subgrade modulus........................................... 84
Figure 43: Permanent deformation vs Subgrade modulus........................................................... 85
Figure 44: Sensitivity of Total pavement rutting to Asphalt layer thickeness.............................. 86
x
Figure 45: Sensitivity of Total Pavement Rutting with Base thickness........................................ 87
Figure 46: Sensitivity of total pavement rutting with the subbase thickness................................ 88
Figure 47: Sensitivity of Terminal IRI with AC layer thickness .................................................. 89
Figure 48: Sensitivity of Surface down cracking with Asphalt layer thickness ........................... 90
Figure 49: Sensitivity of Bottom up cracking vs Asphalt thickness............................................. 91
Figure 50: Sensitivity of AC layer rutting with AC layer thickness............................................. 92
Figure 51: Sensitivity of Terminal IRI with base layer thickness ................................................ 93
Figure 52: Sensitivity of Bottom up cracking with base layer thickness...................................... 94
Figure 53: Sensitivity of AC rut with base layer thickness .......................................................... 95
Figure 54: Terminal IRI vs AC layer thickness ( for Subgrade Modulus of 5k psi and 10k psi). 96
Figure 55: AC surface down cracking vs AC layer thickness ( for subgrade modulus of 5k and
10k psi).................................................................................................................................. 97
Figure 56: AC bottom up cracking vs AC layer thickness ( for subgrade modulus of 5k and 10k
psi)......................................................................................................................................... 98
Figure 57: Permanent deformation (AC only) vs AC layer thickness ( for subgrade modululs of
5k and 10k psi)...................................................................................................................... 99
Figure 58: Perm. Deformation (Total Pavement) vs AC layer thickness ( for subgrade modulus
of 5k and 10k psi) ............................................................................................................... 100
Figure 59: Sensitivity of Terminal IRI with AADTT................................................................. 105
Figure 60: Sensitivity of Transverse Cracking with AADTT..................................................... 106
Figure 61: Sensitivity of Mean Joint Faulting with AADTT...................................................... 107
Figure 62: Sensitivity of Terminal IRI with Slab thickness ....................................................... 108
Figure 63: Sensitivity of Transverse Cracking with Slab Thickness.......................................... 109

xi
Figure 64: Sensitivity of Mean Joint Faulting with Slab Thickness........................................... 110
Figure 65: Sensitivity of Terminal IRI with Joint Spacing......................................................... 111
Figure 66: Sensitivity of Transverse Cracking with Joint Spacing............................................. 112
Figure 67: Sensitivity of Mean Joint Faulting with Joint Spacing.............................................. 113
Figure 68: Sensitivity of Terminal IRI with Dowel Bar Spacing ............................................... 114
Figure 69: Sensitivity of Transverse Cracking with Dowel Bar Spacing................................... 115
Figure 70: Sensitivity of Mean Joint Faulting with Dowel Bar Spacing.................................... 116
Figure 71: Sensitivity of Terminal IRI with Dowel Bar Diameter ............................................. 117
Figure 72: Sensitivity of Transverse Cracking with Dowel Bar Diameter................................. 118
Figure 73: Sensitivity of Mean Joint Faulting with Dowel Bar Diameter.................................. 119
Figure 74: Sensitivity of Terminal IRI with layer 2 (Cement Stabilized base) thickness .......... 120
Figure 75: Sensitivity of Transverse Cracking with Layer – 2 (Cement Stabilized) thickness.. 121
Figure 76: Sensitivity of Mean Joint Faulting with Layer 2 (Cement Stabilized) thickness...... 122
Figure 77: Sensitivity of Terminal IRI with Layer 3 (Crushed Stone Subbase) thickness......... 123
Figure 78: Sensitivity of Transverse Cracking with Layer 3 (subbase layer) thickness............. 124
Figure 79: Sensitivity of Mean Joint Faulting with Layer 3 (Crushed Stone) thickness............ 125
Figure 80: Sensitivity of Terminal IRI with Subgrade Modulus ................................................ 126
Figure 81: Sensitivity of Transverse Cracking with Subgrade Modulus.................................... 127
Figure 82: Sensitivity of Mean Joint Faulting with Subgrade .................................................... 128
Figure 83: Effect of Tied/Untied PCC shoulder on Terminal IRI .............................................. 129
Figure 84: Effect of Tied/Untied PCC shoulder on Transverse Cracking .................................. 130
Figure 85: Effect of Tied/Untied PCC shoulder on Mean Joint Faulting ................................... 131
Figure 86: Sensitivity of Terminal IRI with Base Modulus ....................................................... 132

xii
Figure 87: Sensitivity of Transverse Cracking with Base layer modulus................................... 133
Figure 88: Sensitivity of Mean Joint Faulting with Base layer modulus.................................... 134
Figure 89: Sensitivity of Terminal IRI with AADTT................................................................. 138
Figure 90: Sensitivity of Punchouts with AADTT ..................................................................... 139
Figure 91: Sensitivity of Terminal IRI with Slab Thickness ...................................................... 140
Figure 92: Sensitivity of Punchouts with Slab Thickness .......................................................... 141
Figure 93: Sensitivity of Terminal IRI with Base Layer Thickness ........................................... 142
Figure 94: Sensitivity of Punchouts with Base layer thickness .................................................. 143
Figure 95: Sensitivity of Terminal IRI with Compacted Subgrade layer thickness ................... 144
Figure 96: Sensitivity of Punchouts with Compacted Subgrade Thickness ............................... 145
Figure 97: Sensitivity of Terminal IRI with Percent Steel ......................................................... 146
Figure 98: Sensitivity of Punchouts with Percent Steel.............................................................. 147
Figure 99: Sensitivity of Terminal IRI with Steel Depth............................................................ 148
Figure 100: Sensitivity of Punchouts with Steel Depth ............................................................. 149
Figure 101: Sensitivity of Terminal IRI with Uncompacted Subgrade Modulus...................... 150
Figure 102: Sensitivity of CRCP Punchouts with Subgrade Modulus ....................................... 151
Figure 103: Flexible Pavement Design Example........................................................................ 152
xiii
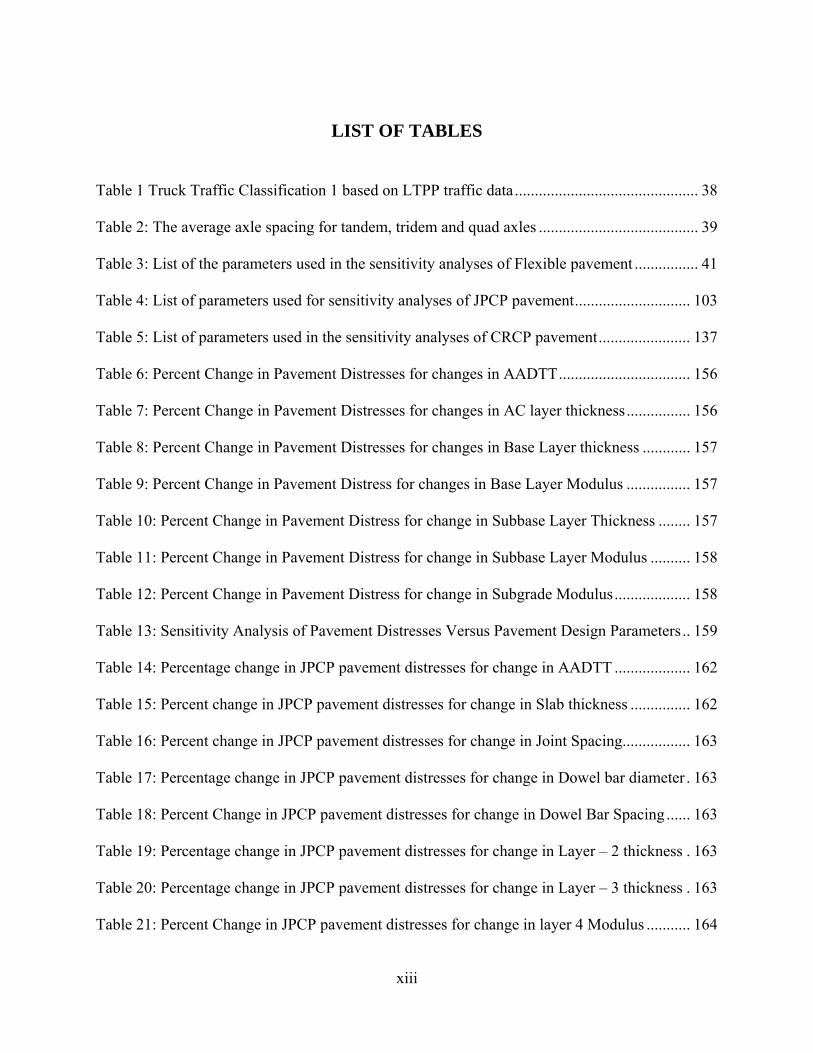
LIST OF TABLES
Table 1 Truck Traffic Classification 1 based on LTPP traffic data.............................................. 38
Table 2: The average axle spacing for tandem, tridem and quad axles ........................................ 39
Table 3: List of the parameters used in the sensitivity analyses of Flexible pavement ................ 41
Table 4: List of parameters used for sensitivity analyses of JPCP pavement............................. 103
Table 5: List of parameters used in the sensitivity analyses of CRCP pavement....................... 137
Table 6: Percent Change in Pavement Distresses for changes in AADTT................................. 156
Table 7: Percent Change in Pavement Distresses for changes in AC layer thickness................ 156
Table 8: Percent Change in Pavement Distresses for changes in Base Layer thickness ............ 157
Table 9: Percent Change in Pavement Distress for changes in Base Layer Modulus ................ 157
Table 10: Percent Change in Pavement Distress for change in Subbase Layer Thickness ........ 157
Table 11: Percent Change in Pavement Distress for change in Subbase Layer Modulus .......... 158
Table 12: Percent Change in Pavement Distress for change in Subgrade Modulus................... 158
Table 13: Sensitivity Analysis of Pavement Distresses Versus Pavement Design Parameters.. 159
Table 14: Percentage change in JPCP pavement distresses for change in AADTT ................... 162
Table 15: Percent change in JPCP pavement distresses for change in Slab thickness ............... 162
Table 16: Percent change in JPCP pavement distresses for change in Joint Spacing................. 163
Table 17: Percentage change in JPCP pavement distresses for change in Dowel bar diameter . 163
Table 18: Percent Change in JPCP pavement distresses for change in Dowel Bar Spacing ...... 163
Table 19: Percentage change in JPCP pavement distresses for change in Layer – 2 thickness . 163
Table 20: Percentage change in JPCP pavement distresses for change in Layer – 3 thickness . 163
Table 21: Percent Change in JPCP pavement distresses for change in layer 4 Modulus ........... 164

xiv
Table 22: Percentage change in JPCP pavement distresses for Tied/Untied PCC Shoulder...... 164
Table 23: Percentage change in JPCP pavement distresses for change in Base Modulus.......... 164
Table 24: Sensitivity of pavement distresses with change in JPCP pavement design parameters
............................................................................................................................................. 164
Table 25: Percentage change in CRCP pavement distresses for change in AADTT.................. 166
Table 26: Percentage change in CRCP pavement distresses for change in Slab Thickness....... 166
Table 27: Percentage change in CRCP pavement distresses for change in Base Layer Thickness
............................................................................................................................................. 166
Table 28: Percentage change in CRCP pavement distresses for change in Compacted Subgrade
............................................................................................................................................. 166
Table 29: Percentage change in CRCP pavement distresses for change in Percent Steel .......... 167
Table 30: Percentage change in CRCP pavement distresses for change in Steel Depth ............ 167
Table 31: Percentage change in CRCP pavement distresses for change in Uncompacted Subgrade
Modulus .............................................................................................................................. 167
Table 32: Sensitivity of pavement distresses with changes in CRCP pavement design parameters
............................................................................................................................................. 167

1
CHAPTER ONE: INTRODUCTION
1.1 Problem Statement
Earliest years pavement design solely depended on rule-of-thumb procedures based on
past experiences. The same thickness was designed for a section of highway even though widely
different soils were encountered. From 1920’s to 1940’s engineers made efforts to evaluate the
structural properties of soil and correlations were established relating the pavement performance
with the subgrade types. In the early 1950’s gear loads imposed by heavy aircrafts and the
increased truck traffic necessitated a more rational approach towards the design of pavements.
This resulted in the construction of several test roads for the purpose of evaluating the effect of
load and materials on pavement design. The Bureau of Public Roads and AASHO as well as
many state highway departments have been responsible for several test roads constructed in the
United States. These road tests yielded pavement design formulas for the Interstate Highway
System that were based on observations of the performance of pavement test sections.
With the availability of computers, high speed and memory it was possible to do complex
calculations and operations in quick time. This resulted in the development of computer
programs and applications for the design of pavements in a more mechanistic way. But theory
alone had not proven sufficient to design pavements realistically and there was still a need to rely
on observed performance. Therefore, efforts were made to design the pavements in a mechanistic
– empirical way to realistically predict pavement responses. The AASHTO Joint force on
Pavements in cooperation with National Cooperative Highway Research Program (NCHRP) and
Federal Highway Authority (FHWA) sponsored the “Workshop on Pavement Design” in March
2
1996 at Irvine California. At the workshop many of the top pavement engineers were charged
with identifying the means for developing an AASHTO mechanistic empirical pavement design
procedure by 2002. Based on the conclusions developed at the March 1996 meeting the
Development of the 2002 guide for Design of New and Rehabilitated Pavement Structures was
awarded to ERES Consultants Division of Applied Research and Associates Inc. in February
1998.
This resulted in the development of the new AASHTO 2002 design guide that utilizes
existing mechanistic-based models and databases reflecting current state of the art pavement
design procedures. A mechanistic- empirical design approach relates an input such as a wheel
load to an output or pavement response, such as a stress or strain. The responses are used to
predict distress based on laboratory test and field performance data. This was the first pavement
design procedure that incorporated both the impact of climate and aging on materials properties
in an iterative and comprehensive manner throughout the entire design life. However, prior to the
use of this guide in practice it is necessary to investigate and evaluate the pavement response
models incorporated in the design guide. This is required so that design guide yields realistic
pavement responses for the design inputs.
1.2 Thesis Organization
The thesis is organized into six chapters. Chapter 2 includes the literature review related
to the various pavement response models for the new AASHTO 2002 design guide. It also
includes the design equations used in the earlier AASHTO design guides.

3
Chapter 3 includes a very brief summary of the new AASHTO design methodology. It
discusses in general the steps involved in the mechanistic empirical design approach for both
flexible and rigid pavement designs.
Chapter 4 presents the sensitivity analysis of AASHTO 2002 design guide for both
flexible and rigid pavements. It includes various design parameters including traffic loads,
thicknesses and moduli of pavement components. Chapter 5 presents a design example solved
using earlier AASHTO design methods and new AASHTO 2002 design guide, and Chapter 6
presents the results and the conclusions of this research study.
1.3 Objective
The report aims at understanding the new AASHTO 2002 pavement design guide by
conducting a sensitivity analysis of its mechanistic-empirical design approach for both flexible
and rigid pavements. In order to achieve this objective, major pavement distresses were selected
and their sensitivity with respect to the design parameters for both flexible and rigid pavement
design methods was found. This was done to understand the pavement response models to
changes in various design parameters including traffic, layer properties etc. and to check if the
pavement response models yielded realistic responses to changes in the design inputs.

4
CHAPTER TWO: LITERATURE REVIEW
Literature review was conducted through information search using electronic databases
and documented publications. This chapter clearly distinguishes the theories and approaches
between the old various (1960 – 1993) design guides and the new 2002 design method.
2.1 Introduction
Over the past years, empiricism had played a significant role in the design of road
pavements. The thickness of road pavements was based purely on experience. The same
thickness was used for pavement design along a highway despite encountering different types of
soils along the length of the highway. As experience was gained over a period of years in
pavement design, various methods were adopted by different agencies for determining the
thickness of pavement under different conditions.
From 1958 to 1960 American Association of State Highway Officials (AASHO)
sponsored the full-scale road test in Ottawa, Illinois, which yielded pavement design formulas
for the Interstate highway system that were based on observations of the performance of
pavement test sections. Tests were conducted to determine the effects of a wide range of design
factors. Test sections were subjected to thousands of load repetitions before being taken out of
the test; surviving test sections received more than a million load applications. The most
significant road test finding was that pavement damage was related to the accumulation of axle
repetitions of all types, even if ultimate strength of the pavement was not exceeded by any one
axle load. In other words, even though the load of an axle passing the pavement was less than the
ultimate strength of the pavement, damage to the pavement will still occur on account of the

5
repetition of axle load of all types through the pavement. Furthermore the road tests
demonstrated that the damage caused by heavier loads is exponentially greater than damage
caused by lighter loads.
One of the key products of the road test was the concept of load equivalency, which
accounts for the effects of the axle loads on pavements in terms of an equivalent single axle load
(ESAL). Under this concept the damage imposed by any vehicle is based on its axle weights
compared with a standard 18,000 lb axle load. The ESAL values for other axles express their
relative effect on pavement wear. If the number and types of vehicles using the pavement can be
predicted, then engineers can design the pavement for anticipated number of 18 kips equivalent
single axle loads (18 kips ESAL). Virtually, all heavy-duty pavements built in the United States
since the mid-1960s have been designed using the principles and formulas developed from the
Road Test.
The adoption of 20 year design life as the standard for the Interstate system enabled the
state highway agencies to design the Interstate Highway Pavements to the same service criteria.
On the basis of the information available at that time 20 years was considered a reasonable
length of service for such a major highway network and was about as far into the future as
designers wished to project traffic growth or extrapolate the road test findings. However, many
pavements did not endure 20 years design life and had to undergo some rehabilitation.
2.2 AASHTO Design Equations
The empirical design equations developed from the AASHO road tests are discussed in
the following sections (Reference: Pavement Analysis and Design, Yuang H Huang (1)):
6
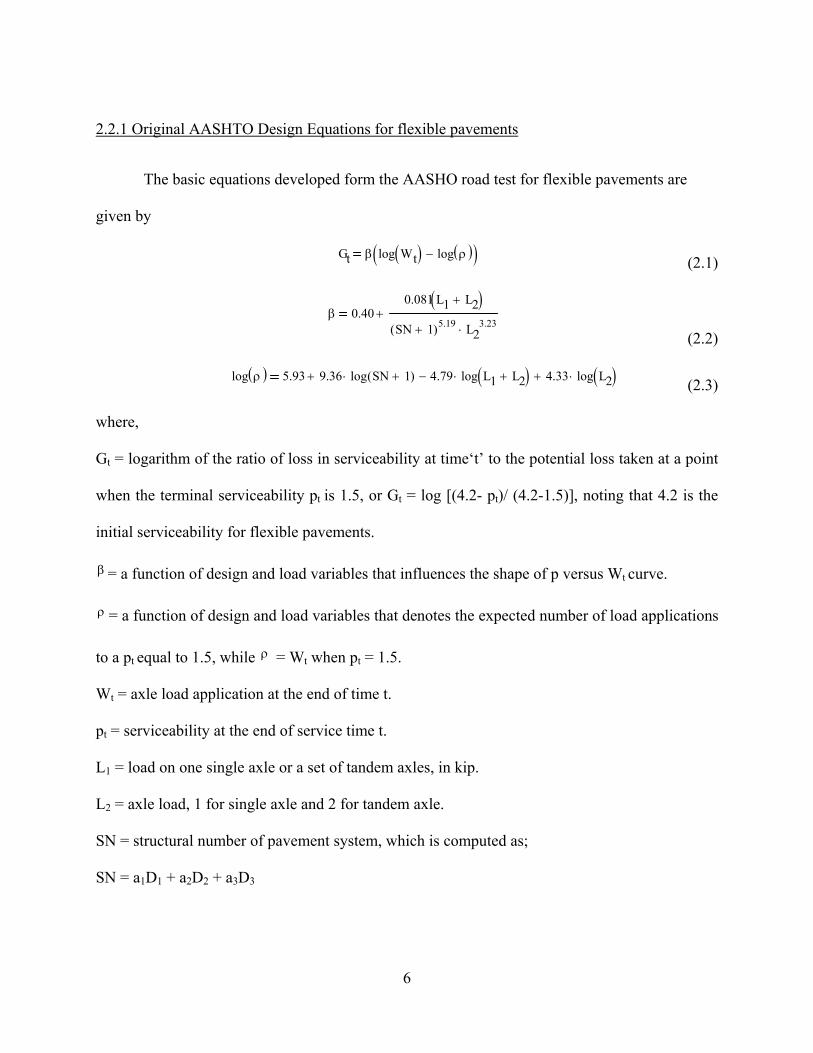
2.2.1 Original AASHTO Design Equations for flexible pavements
The basic equations developed form the AASHO road test for flexible pavements are
given by
Gt β log Wt( ) log ρ( )−( ) (2.1)
β 0.400.081 L1 L2+( )
SN 1+( )5.19 L23.23⋅
+
(2.2)
log ρ( ) 5.93 9.36 log SN 1+( )⋅+ 4.79 log L1 L2+( )⋅− 4.33 log L2( )⋅+ (2.3)
where,
Gt = logarithm of the ratio of loss in serviceability at time‘t’ to the potential loss taken at a point
when the terminal serviceability pt is 1.5, or Gt = log [(4.2- pt)/ (4.2-1.5)], noting that 4.2 is the
initial serviceability for flexible pavements.
β = a function of design and load variables that influences the shape of p versus Wt curve.
ρ = a function of design and load variables that denotes the expected number of load applications
to a pt equal to 1.5, while ρ = Wt when pt = 1.5.
Wt = axle load application at the end of time t.
pt = serviceability at the end of service time t.
L1 = load on one single axle or a set of tandem axles, in kip.
L2 = axle load, 1 for single axle and 2 for tandem axle.
SN = structural number of pavement system, which is computed as;
SN = a1D1 + a2D2 + a3D3

7
in which a1, a2 and a3 are layer coefficients for the surface, base and subbase, respectively; and
D1, D2 and D3 are the thicknesses of the surface, base, and subbase respectively. The procedure is
greatly simplified if an equivalent 18 kip (80-kN) single-axle load is used. By setting L1 = 18 and
L2 = 1 the following equation is obtained as:
log Wt18( ) 9.36 log SN 1+( )⋅ 0.20−
log4.2 pt−
4.2 1.5−
⎛⎜⎝
⎞⎟⎠
0.41094
SN 1+( )5.19+
+
(2.4)
in which Wt18 is the number of 18-kip single axle load application to time t and pt is the terminal
serviceability index. The above equation is applicable only to flexible pavements in the AASHO
road test with an effective subgrade modulus of 3000 psi.
For other subgrade and environmental conditions, the equation (2.4) is modified to
log Wt18( ) 9.36 log SN 1+( )⋅ 0.20−
log4.2 pt−
4.2 1.5−
⎛⎜⎝
⎞⎟⎠
0.41094
SN 1+( )5.19+
+ 2.32 log MR( )⋅+ 8.07−
(2.5)
in which MR is the effective roadbed soil resilient modulus.
To take local precipitation and drainage conditions into account, the equation of structural
number was modified to
SN = a1D1 + a2D2m2 + a3D3m3 (2.6)
in which m2 is the drainage coefficient of base course and m3 is the drainage coefficient of
subbase course.
The modified equation is the performance equation which gives the allowable number of
18-kip single-axle load applications Wt18 to cause the reduction of PSI to pt. If the predicted
number of applications W18 is equal to Wt18 the reliability of design is only 50% because all

8
variables in the equation are based on mean values. To achieve a higher level of reliability, W18
must be smaller than Wt18 by a normal deviate ZR as:
ZRlog W18( ) log Wt18( )−
So (2.7)
in which, ZR is the normal deviate for a given reliability R, and So is the standard deviation.
Combining these two equations and replacing (4.2 - pt) by ΔPSI, equation (2.5) yields
log Wt18( ) ZR So⋅ 9.36 log SN 1+( )⋅+ 0.20−
logΔPSI
4.2 1.5−⎛⎜⎝
⎞⎟⎠
0.41094
SN 1+( )5.19+
+ 2.32 log MR( )⋅+ 8.07−
(2.8)
This is the final equation used for flexible pavement design or analysis.
2.2.2 Original AASHTO Design Equations for Rigid pavements
The basic equations developed from the AASHO road test for rigid pavements are given
by
Gt β log Wt( ) log ρ( )−( ) (2.9)
β 1003.63 L1 L2+( )5.2
D 1+( )8.46 L23.52⋅
+
(2.10)
log ρ( ) 5.85 7.35 log D 1+( )⋅+ 4.62 log L1 L2+( )⋅− 3.28 log L2( )⋅+ (2.11)
Gt = log[(4.5- pt)/(4.5-1.5)], where 4.5 is the initial serviceability and 1.5 is terminal
serviceability for rigid pavement at the AASHO Road Test, and pt is the serviceability at time t.
D = slab thickness in inches.

9
Using an equivalent 18 kip single axle load with L1 = 18 and L2 = 1 and combining Equations
(2.9) through (2.11) it yields,
log Wt18( ) 7.35 log D 1+( )⋅ 0.06−
log4.5 pt−
4.5 1.5−
⎛⎜⎝
⎞⎟⎠
11.624 107⋅
D 1+( )8.46+
+
(2.12)
In order to account for conditions other than those that existed in the road test, the above
equation was modified using experience and theory. The modified equation is given as:
log Wt18( ) ZR So⋅ 7.35 log D 1+( )⋅+ 0.06−
logΔPSI
4.5 1.5−⎛⎜⎝
⎞⎟⎠
11.624 107⋅
D 1+( )8.46+
+ 4.22 0.32pt−( ) logSc Cd⋅ D0.75 1.132−( )⋅⎡⎣ ⎤⎦
215.63 J⋅ D0.75 18.42
Eck
⎛⎜⎝
⎞⎟⎠
0.25−⎡⎢
⎢⎢⎣
⎤⎥⎥⎥⎦
⋅
⎡⎢⎢⎢⎢⎢⎣
⎤⎥⎥⎥⎥⎥⎦
⋅+
(2.13)
where,
Sc = Modulus of rupture of concrete
Ec = Modulus of elasticity of concrete
k = Modulus of subgrade reaction
J = load transfer coefficient
Cd = drainage coefficient
This is the final design equation for rigid pavements.

10
2.3 Need for Mechanistic- Empirical Design
Pavement design methods were constantly updated by the AASHTO through research
findings; thus, the most recent AASHTO 2002 design guide was developed based on mechanistic
- empirical design approach.
The system of highways designed using the earlier AASHTO Design Guide has matured.
Some have exceeded 20 years life and other may have been rehabilitated and reconstructed
before reaching the design life. Although those pavements performed well, the experience with
the interstate pavements has revealed some serious limitations to the design methods, such as
shortcoming in the quality of basic design inputs to the design process, problems with the
materials and construction control, and an inability to predict how well alternative rehabilitation
schemes.
The needs for and the benefits of a mechanistically based pavement design procedure
were clearly recognized and the AASHTO Joint Task Force on pavements, in cooperation with
NCHRP and FHWA, sponsored the workshop on pavement design in March 1996 at Irvine,
California. The workshop participants included many top pavement design engineers from
United States who were charged with identifying the means for developing an AASHTO
mechanistic-empirical design procedure by 2002. Based on the conclusions developed at the
March 1996 meeting, NCHRP Project 1-37A, Development of the 2002 Guide for the Design of
New and Rehabilitated Pavement Structures was awarded to ERES Consultants, division of
Applied Research Associates, Inc. in February 1998. The project called for the development of a
guide that utilized existing mechanistic based models and databases reflecting current state-of-

11
the-art design pavement design procedures. This guide addressed all new and rehabilitation
design issues and provided an equitable design basis for all pavement types.
2.4 2002 Mechanistic Empirical Design Models
This was the first pavement design procedure that incorporated both the impact of climate
and aging of materials properties in an iterative and comprehensive manner throughout the entire
design life. Most of the existing models have limited usage with equivalent or worst case
material properties being used as inputs. When varying material properties and climatic
conditions are applied using an incremental damage approach over the design period, some of
the models give erroneous results. As a result significant resources are required to modify and
adapt these models to work within the incremental damage approach. In addition, the hourly,
monthly and annual variations in traffic loadings are superimposed on changes to materials and
climate to more realistically reflect the ways in which pavements exist in-service.
The performance models (Reference: ERES. 2002 Design Guide (2)) that have been
incorporated in the AASHTO 2002 design guide are:
12
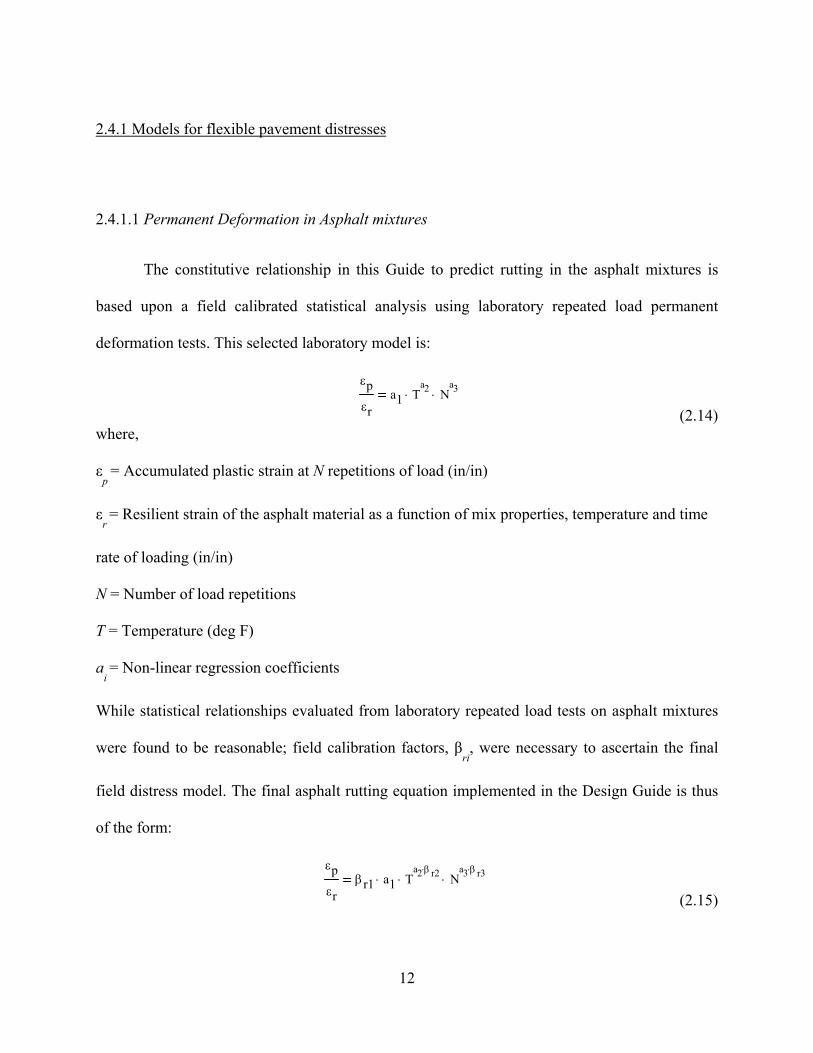
2.4.1 Models for flexible pavement distresses
2.4.1.1 Permanent Deformation in Asphalt mixtures
The constitutive relationship in this Guide to predict rutting in the asphalt mixtures is
based upon a field calibrated statistical analysis using laboratory repeated load permanent
deformation tests. This selected laboratory model is:
εpεr
a1 Ta2⋅ N
a3⋅
(2.14) where,
εp = Accumulated plastic strain at N repetitions of load (in/in)
εr = Resilient strain of the asphalt material as a function of mix properties, temperature and time
rate of loading (in/in)
N = Number of load repetitions
T = Temperature (deg F)
ai = Non-linear regression coefficients
While statistical relationships evaluated from laboratory repeated load tests on asphalt mixtures
were found to be reasonable; field calibration factors, βri, were necessary to ascertain the final
field distress model. The final asphalt rutting equation implemented in the Design Guide is thus
of the form:
εpεr
βr1 a1⋅ Ta2 β r2⋅
⋅ Na3 β r3⋅
⋅
(2.15)
13
This is a relatively simple equation to use in the implementation process. The final lab
expression that was initially selected for the field calibration / validation process was:
εpεr
10 3.15552− T1.734 N0.39937⋅
(2.16)
Where, the sample size, N = 3476 observations and R2 = 0.644
Se = 0.321, where Se = Standard error of estimate
Se/S
y = 0.597, where Sy = Standard deviation of the y scores
This model shown in equation (2.16) was based on extensive research work conducted by Ayers
(3), Leahy (4) and Kaloush (5) (NCHRP 9-19: “Superpave Models”). The national field
calibrated model used in the Design Guide was determined by numerical optimization and other
modes of comparison to result in national calibration factors of:
βr1
= 0.509
βr2
= 0.9
βr3
= 1.2
This results in the final model as:
εpεr
k1 10 3.4488−⋅ T1.5606 N0.479244⋅
(2.17)
A depth parameter “k1” in Equation (2.17) is introduced to provide as accurate a rut depth
prediction model as possible from the following equations:
k1 C1 C2 depth⋅+( ) 0.328196depth⋅ (2.18)
C1 0.1039− hac2⋅ 2.4868 hac⋅+ 17.342− (2.19)

14
C2 0.0172 hac2⋅ 1.7331 hac⋅− 27.428+ (2.20)
where,
k1
= function of total asphalt layers thickness (hac
, in) and depth (in) to computational point, to
correct for the confining pressure at different depths. Equation (2.17) is calibrated from the
sample size of 387 observations with
R2 = 0.648
Se = 0.063 in where, Se = Standard error of estimate
Se/S
y = 0.574, where Sy = Standard deviation of y scores
The rutting model for new pavement systems has been partially calibrated based on 88 LTPP
new sections located in 28 states. Time-series data were available for many of the sections,
making the total number of 387 field rutting observations.
2.4.1.2 Permanent Deformation in Unbound Materials
The initial model framework used to predict the permanent deformation in unbound
material layers was that proposed by Tseng and Lytton (6). The basic relationship is:
δa N( ) β1εο
εr
⎛⎜⎜⎝
⎞⎟⎟⎠
⋅ e
ρN
⎛⎜⎝
⎞⎟⎠
β
−⋅ εv⋅ h⋅
(2.21)
where,
δa = Permanent deformation for the layer/sublayer (in).
N = Number of traffic repetitions.
εo, β, and ρ = Material properties.

15
εr = Resilient strain imposed in laboratory test to obtain the above listed material properties, ε
o, β,
and ρ (in/in).
εv = Average vertical resilient strain in the layer/sublayer as obtained from the primary response
model (in /in)
h = Thickness of the layer/sublayer (in).
β1 = calibration factor for the unbound granular and subgrade materials
During the development process and field calibration studies, numerous modifications were
necessary to determine a final reasonable calibrated relationship. Changes leading to the
elimination of the stress term in the model, major simplifications to the “β” and “ρ” equations
and an eventual combination of all unbound granular and subgrade materials into one model
were accomplished. The modified models developed are:
log β( ) 0.61119− 0.017638Wc− (2.22)
logεο
εr
⎛⎜⎜⎝
⎞⎟⎟⎠
e ρ( )β a1⋅ Erb1⋅⎡
⎣⎤⎦ e
ρ
109⎛⎜⎝
⎞⎟⎠
β
a9⋅ Erb9⋅
⎡⎢⎢⎣
⎤⎥⎥⎦+
2 (2.23)
Co lna1 Er
b1⋅⎛⎝
⎞⎠
a9 Erb9⋅
⎡⎢⎢⎢⎣
⎤⎥⎥⎥⎦ (2.24)
ρ 109 Co
1 109⎛
⎝⎞⎠β
−⎡⎣
⎤⎦
⎡⎢⎢⎣
⎤⎥⎥⎦
1β
⋅
(2.25)
16
Wc 51.712Er
2555⎛⎜⎝
⎞⎟⎠
10.64
⎡⎢⎢⎢⎣
⎤⎥⎥⎥⎦
0.3586− GWT0.1192⋅
⋅
(2.26)
where,
Wc = Water content (%).
Er = Resilient modulus of the layer/sublayer (psi).
GWT = Ground water table depth (ft).
a1 = 0.15
b1 = 0.0
a9 = 20.0
b9 = 0.0
The final calibrated model for the unbound granular base is given by:
δa N( ) βGBεο
ε.r
⎛⎜⎜⎝
⎞⎟⎟⎠
⋅ e
ρN
⎛⎜⎝
⎞⎟⎠
β
−⋅ εv⋅ h⋅
(2.27)
with the national calibration factor of βGB
= 1.673 being determined, where the sample size N =
387 observations,
R2 = 0.677
Se = 0.023 in where, Se = Standard error of estimate
Se/S
y = 0.524 where, Sy = Standard deviation of y scores
The final calibrated model for all subgrade soils is as follows:

17
δa N( ) βSG
εο
ε.r
⎛⎜⎜⎝
⎞⎟⎟⎠
⋅ e
ρN
⎛⎜⎝
⎞⎟⎠
β
−⋅ εv⋅ h⋅
(2.28)
with the national calibration factor of βSG
= 1.35 being determined.
R2 = 0.136
N = 387 observations
Se = 0.045 in where, Se = Standard error of estimate
Se/Sy = 0.850 where, Sy = Standard deviation of the y scores
Both rutting models were calibrated based on 88 Long Term Pavement Performance
(LTPP) new sections located in 28 states. Time-series data were available for many of the
sections, making the total number of 387 field rutting observations. In addition, comparative
studies involving general comparisons of unbound rutting levels for AASHTO Design Guide
(current) pavement structures also, provided valuable insight into the final selection.
2.4.1.3 Permanent Deformation of Total Pavement Structure
The total rutting in the pavement structure is equal to the summation of the individual
layer permanent deformation for each season and to estimate the permanent deformation of each
individual sublayer, the system verifies the type of layer, applies the model corresponding to the
material type of the sublayer and computes the plastic strain accumulated at the end of each
subseason. The overall permanent deformation for a given subseason is the sum of the permanent
deformation for each individual layer and is mathematically expressed as:

18
RD
1
nsublayers
i
εpi hi⋅∑
= (2.29)
where,
RD = Pavement Permanent Deformation
nsublayers = Number of sublayers
εpi
= Total plastic strain in sublayer i
hi = Thickness of sublayer i
The Equation (2.29) for total rutting can also be expressed as:
RDTotal RDAC RDGB+ RDSG+ (2.30)
RDAC, RDGB and RDSG can be found from equations (2.17), (2.27) and (2.28) as discussed
earlier.
2.4.1.4 Fatigue Cracking in Asphalt Mixtures
The most commonly used model form to predict the number of load repetitions to fatigue
cracking is a function of the tensile strain and mix stiffness (modulus). Most of relationships
available have a common basic structure and are function of the stiffness of the mix and the
tensile strain. The commonly used mathematical relationship used for fatigue characterization is
given by:
Nf Ck11εt
⎛⎜⎝
⎞⎟⎠
k2
⋅1E
⎛⎜⎝
⎞⎟⎠
k3
⋅ βf1 k1⋅ εt( )β f2− k2⋅
⋅ E( )β f3− k3⋅
⋅
(2.31)

19
where,
Nf = number of repetitions to fatigue cracking.
εt = tensile strain at the critical location.
E = stiffness of the material.
k1, k
2, k
3 = laboratory regression coefficients.
βf1
, βf2
, βf3
= calibration parameters.
C = laboratory to field adjustment factor.
The national field calibrated model used in the Design Guide was determined by numerical
optimization and other modes of comparison to result in national calibration factors of:
β f1
= k1* β’
f1
β’f1
= 1.0 β
f2 = 1.2
βf3
= 1.5 This results in the following final model as:
Nf 0.00432 k1⋅ C⋅1εt
⎛⎜⎝
⎞⎟⎠
3.9492⋅
1E
⎛⎜⎝
⎞⎟⎠
1.281⋅
(2.32)
Equation (2.32) has the parameter “k” being introduced to provide a correction for different
asphalt layer thickness (hac
) effects given by
a. For the bottom-up cracking :
k11
0.000398 0.003602
1 e11.02 3.49hac⋅−( )
+
+
(2.33) b. For the top-down cracking

20
k11
0.01 12.00
1 e15.676 2.8186hac⋅−( )
+
+
(2.34)
where,
hac
= Total thickness of the asphalt layers, in.
The final transfer function to calculate the fatigue cracking from the fatigue damage is expressed
as:
a. For bottom-up cracking (% of total lane area) :
(2.35) where,
FCbottom
= bottom-up fatigue cracking, percent lane area
D = bottom-up fatigue damage
C1 = 1.0
C1’
’= -2 * C2’
C2 = 1.0
C2’ = -2.40874 – 39.748 * (1 + hac)-2.856
Here,
N = 461 observations
Se = 6.2 percent
Se/Sy = 0.947
b. For top-down cracking (feet/mile);
21
(2.36)
where,
FCtop = top-down fatigue cracking, (ft/mile)
D = top-down fatigue damage, (ft/mile) Here, N = 414 observations S
e = 1242.25
Se/Sy = 0.977 The fatigue-cracking model for the asphalt concrete mixtures has been calibrated based on 82
LTPP sections located in 24 States
2.4.2 Models for Rigid Pavement Distresses
2.4.2.1 JPCP Cracking Model
The percentage of slabs with transverse cracks in a given traffic lane is used as a measure
of transverse cracking and is predicted using the following model for both bottom up and top
down crackings:
CRK1
1 FD 1.68−+ (2.37)
where,
CRK = predicted amount of top – down or bottom-up cracking (fraction)

22
FD = Calculated fatigue Damage
Model Statistics are:
R2 = 0.68
N = 521 observations
SEE = 5.4 percent
The total amount of cracking is determined as follows:
TCRACK CRKTop_down CRKBottom_up+ CRKTop_down CRKBottom_up⋅−( ) 100⋅ % (2.38)
where,
TCRACK = Total Cracking (percent)
CRKBottom_up = Predicted amount of Bottom Up cracking (Fraction)
CRKTop_down = Predicted amount of Top Down cracking (Fraction)
The JPCP transverse cracking model was calibrated based on performance of 196 field sections
located in 24 States.
2.4.2.2 JPCP Faulting Model
The faulting models for Rigid JPCP pavement is as follows p_
Faultm
1
m
i
ΔFaulti∑= (2.39)
ΔFaulti C34 FAULTMAXi 1− Faulti 1−−( )2⋅ DEi⋅ (2.40)
FAULTMAXi FAULTMAX0 C71
m
i
DEj∑=
⋅ log 1 C5 5.0EROD⋅+( )C6
⋅+
(2.41)

23
FAULTMAX0 C12 δcurling⋅ log 1 C5 5.0EROD⋅+( ) logP200 WetDays⋅
ps
⎛⎜⎝
⎞⎟⎠
⋅⎛⎜⎝
⎞⎟⎠
C6
⋅
(2.42)
where,
Faultm = mean joint faulting at the end of the month, in
ΔFaulti = incremental change (monthly) in mean transverse joint faulting during month i, in.
FAULTMAXi = Maximum Mean Transverse Joint Faulting for month i, in
FAULTMAXO = initial maximum mean transverse joint faulting, in
EROD = Base/Subbase erodibility factor
DEi = differential deformation energy accumulated during month i
δcurling = maximum mean monthly slab corner upward deflection PCC due to temperature curling
and moisture warping
Ps = overburden on subgrade, lb.
P200 = percent subgrade material passing #200 sieve
WetDays = average annual number of wet days (greater than 0.1 in of rainfall)
C1 through C8 and C12 and C34 are national calibration constants:
C12 C1 C2 FR0.25⋅+
C34 C3 C4 FR0.25⋅+
C1 1.29 C5 250
C2 1.1 C6 0.4
C3 0.001725 C7 1.2
C4 0.0008

24
FR = base freezing index defined as percentage of time the top base temperature is below
freezing (32 oF) temperature.
Model Statistics are:
R2 = 0.71
SEE = 0.029 inches
N = 564 observations
The JPCP transverse joint faulting model is a result of the calibration based on performance of
248 field sections located in 22 States and is applicable for both doweled and undoweled JPCP.
2.4.2.3 CRCP Punchout Model
CRCP punchout are predicted using a calibrated model, which predicts punchouts as a function
of accumulated fatigue damage due to top-down stresses in transverse direction. The nationally
calibrated model is as follows:
POA
1 α FDβ⋅+ (2.43)
where,
PO = total predicted number of punchouts per mile
FD = accumulated fatigue damage at the end of the yth year
A, α, β = calibration constants (105.26, 4.0, -0.38 respectively)
Model Statistics:
R2 = 0.67
SEE = 4.73 punchouts per mile
N = 220

25
The CRCP punchout model was calibrated based on performance of 74 field sections from 23
states.
The greatest challenge was to calibrate the mechanistic-based conceptual models with
nationally available field performance data. This had never been successfully accomplished
before nationally. After the theoretical distress models were formulated they were compared and
calibrated against the observed data. The results were then evaluated which lead to
improvements to the model, which in turn required another time consuming calibration. This
process was repeated many times to achieve each of the final acceptable mechanistic based
distress prediction models. After model calibration was completed, design reliability was
incorporated into the design procedure by considering the residual between the observed and
predicted distress.
The complex models and the design concepts were finally incorporated into a user
friendly software package. The software package includes climatic database containing an hourly
climatic data from over 800 locations in North America, which allows the user to easily select a
given station or to generate virtual weather stations. Another very important feature of the design
procedure and software is that improvements can be made over time in a piecewise manner to
any of the component models and incorporated into the procedure for recalibration. Ranges and
default values of design inputs can be set by local agencies.
According to the results of sensitivity analysis of the AASHTO 2002 design guide
conducted by Masad (7), the base modulus and thickness have significant influence on the
international roughness index and the longitudinal cracking. However, the base material
properties have almost no influence on the permanent deformation of the pavement.

26
The AASHTO 2002 design guide software is relatively complex and required a longer
time to run. On an average the run time for a 4 - layered flexible pavement system it took about
twenty five (25) minutes and for a rigid pavement system it took about seven (7) minutes. These
run times resulted with a computer configuration of Intel(R) Pentium (R) M processor 1.50 GHz
with 1.0 GB RAM.

27
CHAPTER THREE: AASHTO 2002 DESIGN METHODOLOGY
3.1 Introduction
The AASHTO 2002 Design Guide is based on mechanistic – empirical approach to
pavement design. The design procedure in this guide contributes a major improvement from the
existing empirical design procedure. The procedures in this guide has the capability to both
structurally and climatically model the pavement structure using mechanistic principles and
requires a much more comprehensive input data for analysis. These procedures have been
calibrated using design inputs and performance data largely from the national LTPP database
which includes sections located throughout significant parts of North America.
The mechanistic–empirical design requires an iterative hands-on approach by the
designer. The designer must first establish a performance criterion, then select a trial design, and
finally analyze the design in detail to see if it meets the established performance criteria. If the
trial design does not meet the performance criteria, the design is then modified and reanalyzed
until the design does satisfy all criteria. The designs that meet the applicable criteria are
considered feasible from structural and functional viewpoint.
The major steps in the design process according to this design guide can be summarized
as follows:
1. Assemble a trial design for specific site conditions – define pavement layer material
properties, traffic loads, climate, pavement type and design and construction features.
2. Establish criteria for acceptable pavement performance at the end of the design period. (i.e.
acceptable levels of rutting, fatigue cracking, thermal cracking, faulting, punchouts, IRI etc.)

28
3. Select the desired level of reliability for each of the performance indicators.
4. Process input to obtain monthly values of traffic inputs and seasonal variations of material
and climatic inputs needed in the design evaluations for the entire design period.
5. Compute structural responses (stresses and strains) using multilayer elastic theory or finite
element based pavement response models for each axle type and load and for each damage
calculation increment throughout the design period.
6. Calculate the accumulated distress and/or damage at the end of the each analysis period for
the entire design period.
7. Predict key distresses at the end of the analysis period throughout the design life using the
calibrated mechanistic – empirical performance models provided in the guide.
8. Predict smoothness (IRI) as a function of initial IRI, distresses that accumulate over time, and
site factors at the end of each time increment.
9. Evaluate the expected performance of the trial design at the given reliability level.
10. If the trial design does not meet the performance criteria, modify the design and repeat steps
4 through 9 above until the design does meet the criteria.
3.2 Pavement Design Components
3.2.1 Design Inputs
The ASHTO 2002 design procedure has the capability to consider a wide range of
structural sections. The designer must provide inputs for the project site conditions including
subgrade properties, traffic and climatic data as well as several design inputs related to

29
constructions such as the initial smoothness (IRI), estimated month of construction, and
estimated month that the pavement will be opened to the traffic.
For the convenience of the designer the design inputs are divided into three different
levels of data quality.
Level 1 – refers to the site and/or material specific inputs obtained through direct testing or
measurements.
Level 2 - refers to the use of correlations to establish and determine the required inputs.
Level 3 - refers to the use of national or regional default values to define the input.
Most of the design inputs considered in sensitivity analysis done in this report are level 3
inputs. The input level for a particular parameter is decided based on the criticality of the project,
sensitivity of the pavement performance to the given input, the information available at the time
of the design and also the resources and the time available to the designer to obtain the input.
Sensitivity analysis can be used to determine which parameter should be determined more
precisely for a given project.
3.2.2 Processing of inputs over design analysis period
Seasonal values of traffic, material and climatic inputs are needed for each analysis
increment in the design evaluations. These are obtained by processing the raw design inputs
which is automated in the design guide software and the processed inputs are then directly fed in
to the structural response calculation modules that compute critical pavement responses on a
period by period basis over the entire design period.

30
Analysis inputs that are required on a seasonal basis for flexible pavements consist of the
average daily number of single, tandem, tridem, and quad axles in each axle weight category for
each month, temperature within the asphalt layer, average moduli of all unbound layers (base,
subbase, subgrade) for each analysis period.
The analysis inputs that are required on a seasonal basis for rigid pavements consists of
the average hourly number of single, tandem, tridem and quad axles in each axle weight category
for each month of the analysis period
3.2.3 Pavement Response Model
The purpose of the pavement response model is to determine the structural response of
the pavement system due to traffic loads and environmental influences. Of particular interest are
the critical response variables required as inputs to the pavement distress models in the
mechanistic – empirical design procedure. Examples of the critical response variable include:
Tensile / Horizontal strain at the bottom/top of the HMA layer (for HMA fatigue cracking)
Compressive / Vertical stresses / strains within the HMA layer
Compressive / Vertical stresses / strains within the base / subbase layers
Compressive / Vertical stresses / strains at top of the subgrade
3.2.4 Incremental Distress and Damage accumulation
The design guide is based upon incremental damage approach. The trial design is
analyzed for adequacy by dividing the target design life into shorter design analysis period
beginning with the traffic opening month. Within each increment, all factors that affect pavement

31
responses and damage are held constant. These include Traffic levels, Asphalt Concrete
Modulus, Base and Subbase Moduli and Subgrade Modulus for flexible pavement analysis and
PCC Strength and Modulus, Base Modulus, Subgrade Modulus, Joint Load Transfer and Base
Erosion and Loss of Support for Rigid Pavement Analysis. Incremental distresses and/or damage
are summed over all increments and output at the end of each analysis period by the design guide
software.
3.2.5 Distress Prediction
The cumulative distress calculated and accumulated forms the basis for evaluating the
structural adequacy of the trial designs formulated. A variety of structural distresses are
considered in pavement design and analysis.
The structural distresses considered for flexible pavement design include Bottom-up
fatigue cracking, Surface down fatigue cracking, Permanent Deformation (Rutting), Thermal
Cracking and Terminal IRI.
The rigid pavement structural distresses considered in this guide include Joint Faulting
and Transverse Cracking for JPCP, Punchouts for CRCP, and International Roughness Index
(IRI) for both rigid pavement types.
The following includes a brief explanation of the above distresses:
3.2.5.1 International Roughness Index (IRI)
IRI was developed to provide a common quantitative basis on which different measures
of roughness can be compared. IRI summarizes the longitudinal surface profile in the wheelpath

32
and is computed from surface elevation data collected by either a topographic survey or a
mechanical profilometer. It is defined by the average rectified slope (ARS), which is a ratio of
the accumulated suspension motion to the distance traveled obtained from a mathematical model
of a standard quarter car traversing a measured profile at 50 mph. It is expressed in units of
inches per mile. The initial IRI which defines the as-constructed smoothness of the pavement
typically ranges from 50 to 100 in/mile. The performance criterion for smoothness is defined by
the acceptable IRI at the end of the design life. Typical values for Terminal IRI are chosen in the
range of 150 to 250 in/mile depending on the functional class of the roadway and design
reliability.
The IRI over the design period depends upon the initial as-constructed profile of the
pavement from which the initial IRI is computed and upon the subsequent development of
distresses over time. These distresses include rutting, bottom-up/top-down fatigue cracking and
thermal cracking for flexible pavements and transverse slab cracking, joint spalling and joint
faulting for Jointed Plain Concrete Pavement (JPCP) and punchouts for Continuous Reinforced
Concrete Pavement (CRCP). The IRI over time is predicted by using the distresses predicted
over time by the distress models and site factors. The site factors include the subgrade and
climatic factors to account for the roughness caused by the shrinking or swelling soils and frost
heave conditions.
3.2.5.2 Bottom-up Fatigue cracking or Alligator cracking
This type of fatigue cracking first shows up as short longitudinal cracks in the wheel path
that quickly spread and become interconnected to form an alligator cracking pattern. The cracks

33
initiate at the bottom of the HMA layer and propagate to the surface under repeated load
applications. This type of fatigue cracking is a result of the repeated bending of the HMA layer
under traffic. The pavement and HMA layer deflect under wheel loads that result in tensile
strains and stresses at the bottom of the layer. With continued bending the tensile stresses and
strains cause cracks to initiate at the bottom of the layer and then propagate to the surface. The
performance criterion for bottom up fatigue cracking is defined as the maximum area of alligator
cracking expressed as a percentage of the total lane area that is permitted to occur over the
design period. Typical values of the allowable-bottom up fatigue cracking are in the range of 25
to 50 percent of the total lane area.
3.2.5.3 Surface-down fatigue cracking or Longitudinal Cracking
These are load-related cracks that initiate at the surface and propagate downward. These
cracks initiate and propagate in tension due to the wheelload induced tensile stresses and strains
that occur at the surface. Also high contact pressure near the edge of the tire results in the
shearing of the HMA surface mixture and causes cracks to initiate and propagate both in shear
and tension. Severe aging of HMA mixtures results in high stiffness and combined with high
contacts pressure, adjacent to tire loads results, cause the cracks to initiate at the surface. The
performance criterion for surface-down fatigue cracking is defined as the maximum allowable
length of longitudinal cracking per mile of the pavement that is permitted to occur over the
design period. Typical values of allowable surface-down fatigue cracking are on the order of
1000 ft per mile of pavement.

34
3.2.5.4 Thermal Cracking
Thermal cracking is caused in flexible pavements due to cold temperatures or
temperature cycling. These cracks typically appear as transverse cracks on the pavement surface
roughly perpendicular to the pavement centerline. These cracks can be caused by the shrinkage
of the HMA surface due to low temperatures, hardening of the asphalt and/or daily temperature
cycles. The performance criterion for thermal cracking is defined as the maximum length of
transverse cracking per mile of pavement that is permitted to occur over the design period.
Typical values of the allowable thermal cracking are of the order of 1000 ft per mile of
pavement.
3.2.5.5 Permanent Deformation
Permanent deformation is a surface depression in the wheel paths caused by plastic
deformation in any or all of the pavement layers. These deformations occur mainly due to
densification or one dimensional compression or consolidation and lateral movements or plastic
flow of materials from wheel loads. Rutting is a major contributor of loss of pavement
smoothness. It can also create functional problems such as water ponding and handling problem
for vehicles during lane changes. The performance criterion for total permanent deformation is
defined in terms of the maximum rut depth in the wheel path. Typical maximum rut depths for
total permanent deformation are on the order of 0.3 to 0.5 inches.

35
3.2.5.6 Joint Faulting for JPCP
Repeated heavy axle loads crossing transverse joints create the potential for joint faulting.
The mean transverse joint faulting is a critical factor affecting ride quality. The performance
criteria for joint faulting, defines the allowable amount of mean joint faulting at the end of the
design life and determines the level of joint faulting over the design period. The typical
acceptable levels of mean joint faulting ranges from 0.1 to 0.2 inches depending on the
functional class of roadway and design reliability.
3.2.5.7 Transverse Slab Cracking in JPCP
When the truck axles are near the longitudinal edge of the slab, midway between the
transverse joints, a critical tensile bending stress occurs at the bottom of the slab. With a high
positive gradient through the slab the stress increases greatly and results in fatigue damage along
the bottom edge of the slab which eventually results in a transverse crack that propagates to the
surface of the pavement. Fatigue damage at the top of the slab resulting in transverse cracking at
the surface of the pavement can also be caused due to repeated heavy truck loads with certain
axle spacings, when the pavement is exposed to high negative temperature gradient Inadequate
design to control transverse cracking may result in premature failing of the JPCP. The
performance criterion for transverse cracking defines the maximum allowable percentage of
cracked slabs at the end of the design life. Typical values of allowable cracking range from 10 to
45 percent depending on the functional class of the roadway and design reliability.

36
3.2.5.8 Punchouts in CRCP
When truck axles pass along near the longitudinal edge of the slab between two closely
spaced transverse cracks a high tensile stress occurs at the top of the slab. This stress increases
greatly when there is loss of load transfer across the transverse cracks or loss of support along
the edge of the slab resulting in fatigue damage at the top of the slab which results first in micro-
cracks that initiate at the transverse crack and propagate longitudinally across the slab to the
other transverse crack causing CRCP punchouts. The performance criterion for punchout defines
the acceptable number of punchouts per mile at the end of the design life and also determines the
number of punchouts that may develop over the design period. Typical values of allowable
CRCP punchouts range from 10 to 20 per mile.
3.2.6 Design Reliability:
The desired level of reliability is specified along with the acceptable level of distress at
the end of the design life in defining the performance requirements for a pavement design. For
example, one criterion might be to limit the rut depth to 1” (25 mm) at a design reliability of 90
percent. Thus, if a designer designed 100 projects, 90 of these projects would exhibit rut depths
less than 1” (25 mm) at the end of the design period. Different reliability may be specified for
different distresses in the same design.

37
CHAPTER FOUR: RESULTS OF SENSITIVITY ANALYSIS
Various analyses were done to investigate the sensitivity of various pavement distresses
with respect to changes in the design parameters for flexible and rigid pavements. In order to
achieve this, a sample problem was selected and key design parameters were identified. These
selected parameters were varied one at a time and all the other design parameters were kept
constant and their effect on the various pavement distresses was found.
4.1 Flexible Pavement Sensitivity Analysis
A sample problem is executed as given in the following design.
Analysis Parameters:
Design Life - 20-year design life
Initial IRI - 75 in/mile
Maximum Acceptable Terminal IRI – 200 in/mile
Maximum Acceptable AC surface-down or longitudinal cracking <= 1000 ft/mile
Maximum Acceptable Bottom-up fatigue cracking <= 25 percent
Maximum Acceptable AC thermal fracture (transverse cracking) <= 1000 feet per mile
Maximum Acceptable total permanent deformation in the AC layer <= 0.25 inches

38
Maximum Acceptable permanent deformation pavement (total pavement) <= 0.75 inches
These criteria are to be satisfied at a reliability level of 90 percent
The depth of the water table -10 feet
Traffic Data
Initial two-way average annual daily truck traffic (AADTT) - 1500 trucks
Number of Lanes in the design direction – 2
Percent of Trucks in the Design Lane 50%.
Operational speed - 60 mph.
Pavement will be open to traffic in the month of October
The percentage of AADTT in each vehicle class is assumed to be same as the default Truck
Traffic Classification 1 based on LTPP traffic data as shown in the table below:
Table 1 Truck Traffic Classification 1 based on LTPP traffic data
Vehicle Class Percent AADTT in ClassClass 04 1.3 Class 05 8.5 Class 06 2.8 Class 07 0.3 Class 08 7.6 Class 09 74.0 Class 10 1.2 Class 11 3.4 Class 12 0.6 Class 13 0.3
Traffic growth rate - 4.0% of the preceding year’s traffic (compounded annually).

39
The axle load distribution is identical to the national defaults (derived from LTPP)
provided with the Design Guide software for each vehicle class, axle type, load category, and
months of the year. The number of single, tandem, tridem and quad axles for each vehicle class
is also same as the national defaults derived from LTPP data (provided in the Design Guide and
the software).
Axle configuration:
Average axle width (edge-to-edge outside dimensions, ft) - 8.5
Dual tire spacing (in) -12
Single and dual tire pressures - 120 psi.
Design lane Width - 12 feet wide
Table 2: The average axle spacing for tandem, tridem and quad axles
Axle Type Axle Spacing (in)Tandem 51.6 Tridem 49.2 Quad 49.2
Drainage and Surface Properties:
Cross slope - 2 %
Length drainage path - 12 feet
Shortwave absorptivity of 0.85.
Asphalt Material Properties:
The asphalt concrete mix to be used in this study has material property information in
compliance with level 3 inputs for the Design Guide. Sieve analysis results for the aggregate to

40
be used in the mix suggest that the ¾”, 3/8”, and #4 size sieves have 12, 38, and 50 percentage
aggregate retained on them respectively. 4 percent passes through the #200 sieve. A PG grade
64-22 or 64-28 binder will be used for the asphalt mix design.
The volumetric design of the mix includes 12 percent binder content, 6 percent air voids,
and the mix has a unit weight of 143 lb per cubic foot. Assume a thermal conductivity of 0.67
BTU/hr-ft-oF and a specific heat of 0.23 BTU/lb-oF. Also assume that the poison’s ratio is 0.35.
The reference temperature is 70 deg F. The asphalt layer thickness for the use in the trial design
is 3 in.
Subgrade:
The subgrade in this location is classified as A-7-6 per the AASHTO classification
system, and has a resilient modulus (Mr) value of 10,000 psi estimated at optimum conditions.
The plasticity index of the soil is 40. Results from sieve analysis of this subgrade soil indicated
that 90% of the material passes the #200 sieve, and 99% passes the #4 sieves, the subgrade is
basically clay soil. The D60 of this material is 0.01mm:
Other layers:
The available base and subbase materials for this study are classified as A-1-a and A-2-5,
with modulus of 40,000 psi and 28,000 psi at optimum moisture content respectively. The A-1-a
and A-2-5 materials having a PI of 1.0 and 2.0 have 3% and 20% passing the #200 sieve, 20%
and 80% passing the #4 sieve, and have D60 values of 8 and 0.1mm respectively. The base layer
thickness is taken as 6 in and the subbase layer thickness is 9 in for the trial design. Table 3
shows the list of trial values used in the sensitivity analysis.

41
Table 3: List of the parameters used in the sensitivity analyses of Flexible pavement
Input Parameters Default Value For Sensitivity
Analyses
1 Design Life 20 yrs Constant
2 AADTT 1500 500 – 3000
3 Initial IRI 75 in/mile Constant
4 Maximum Acceptable Terminal IRI 200 in/mile Constant
5 Max. Acceptable AC surface down cracking 1000 ft/mile Constant
6 Max. Acceptable AC bottom up cracking 25% Constant
7 Max. Acceptable AC thermal fracture 1000 ft/mile Constant
8 Max. Acceptable Permanent Deformation (AC
only)
0.25 in Constant
9 Max. Acceptable Permanent Deformation (Total
Pavement)
0.75 in Constant
10 AC layer thickness 3 in 2 – 7 in
11 Base layer thickness 6 in 5 – 10 in
12 Base layer Modulus 40,000 psi 38,500 – 42,000 psi
13 Subbase layer thickness 9 in 7 – 12 in
14 Subbase layer Modulus 28,000 psi 25,000 – 33,000 psi
15 Subgrade Modulus 10000 psi 5,000 – 13,500 psi

42
To conduct a sensitivity analyses, the effects on the pavement distresses were obtained
with changing the values of one parameter while keeping all other parameters constant. The
following is a brief summary result of each of the sensitivity analyses.
1. Terminal IRI vs AADTT
Terminal IRI v/s AADTT
88
90
92
94
96
98
100
500 1000 1500 2000 2500 3000
AADTT
Term
inal
IRI (
in/m
i)
Design Life = 20 yrsAC Layer Thickness = 3 inBase Layer Thickness = 6 inBase Layer Modulus = 40,000 psiSubbase Layer Thickness = 9 inSubbase Layer Modulus = 28,000 psiSubgrade Modulus = 10,000 psi
Figure 1: Terminal IRI vs AADTT
The plot of Terminal IRI versus AADTT is shown in Figure 1. From the graph it can be
seen that the terminal IRI increases with the increase in AADTT. Thus, it concludes that the
increase of the traffic load results in decreasing the terminal smoothness of the pavement. An
increase in AADTT from 500 to 3000 results in an increase of the Terminal IRI from 89.3 to
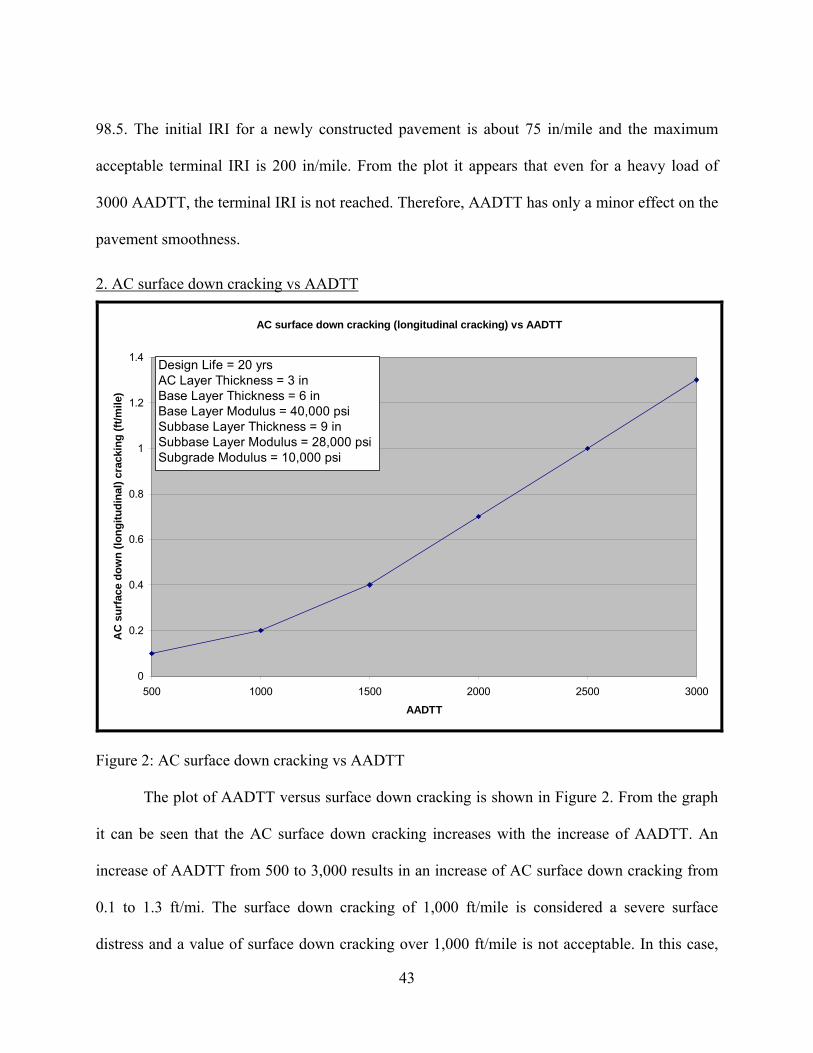
43
98.5. The initial IRI for a newly constructed pavement is about 75 in/mile and the maximum
acceptable terminal IRI is 200 in/mile. From the plot it appears that even for a heavy load of
3000 AADTT, the terminal IRI is not reached. Therefore, AADTT has only a minor effect on the
pavement smoothness.
2. AC surface down cracking vs AADTT
AC surface down cracking (longitudinal cracking) vs AADTT
0
0.2
0.4
0.6
0.8
1
1.2
1.4
500 1000 1500 2000 2500 3000
AADTT
AC
sur
face
dow
n (lo
ngitu
dina
l) cr
acki
ng (f
t/mile
)
Design Life = 20 yrsAC Layer Thickness = 3 inBase Layer Thickness = 6 inBase Layer Modulus = 40,000 psiSubbase Layer Thickness = 9 inSubbase Layer Modulus = 28,000 psiSubgrade Modulus = 10,000 psi
Figure 2: AC surface down cracking vs AADTT
The plot of AADTT versus surface down cracking is shown in Figure 2. From the graph
it can be seen that the AC surface down cracking increases with the increase of AADTT. An
increase of AADTT from 500 to 3,000 results in an increase of AC surface down cracking from
0.1 to 1.3 ft/mi. The surface down cracking of 1,000 ft/mile is considered a severe surface
distress and a value of surface down cracking over 1,000 ft/mile is not acceptable. In this case,

44
even with a heavy load of 3,000 AADTT the surface down cracking is only 1.3 ft/mile. This
indicates that AADTT has a little effect on AC surface down cracking.
3. AC bottom up cracking vs AADTT
AC bottom up cracking (alligator cracking) vs AADTT
0
5
10
15
20
25
30
500 1000 1500 2000 2500 3000
AADTT
AC
bot
tom
up
(alli
gato
r) c
rack
ing
(%)
Design Life = 20 yrsAC Layer Thickness = 3 inBase Layer Thickness = 6 inBase Layer Modulus = 40,000 psiSubbase Layer Thickness = 9 inSubbase Layer Modulus = 28,000 psiSubgrade Modulus = 10,000 psi
Figure 3: AC bottom up cracking vs AADTT
The plot of AADTT versus AC bottom up cracking is shown in Figure 3. From the graph
it can be seen that the AC bottom up cracking increases with the increase of AADTT. An
increase of AADTT from 500 to 3,000 results in an increase of AC bottom up cracking from
2.8% to 25.2%. This indicates that the repeated heavy traffic load applications will initiate cracks
from the tensile stresses and strains at the bottom of the AC layer and propagate to the surface.
The allowable AC bottom up cracking for design is 25%. In this case for an AADTT of 3,000 the

45
cracking at the bottom of AC is 25.2%. The result implies that, the given pavement system
cannot be sustained for an AADTT of 3,000. Thus, AADTT has a major effect on the bottom up
cracking of the Asphalt Concrete layer.
4. AC thermal Fracture vs AADTT
AC thermal fracture vs AADTT
0
0.2
0.4
0.6
0.8
1
1.2
500 1000 1500 2000 2500 3000
AADTT
AC
ther
mal
frac
ture
(ft/m
i)
Design Life = 20 yrsAC Layer Thickness = 3 inBase Layer Thickness = 6 inBase Layer Modulus = 40,000 psiSubbase Layer Thickness = 9 inSubbase Layer Modulus = 28,000 psiSubgrade Modulus = 10,000 psi
Figure 4: AC Thermal Fracture vs AADTT
The plot of AADTT versus AC thermal fracture is shown in Figure 4. From the graph it
can be seen that AADTT has no effect on the AC thermal cracking. An increase in AADTT from
500 to 3,000 results in no change in the AC thermal fracture. These cracks are mostly initiated by
the extremes in the daily and seasonal temperatures.

46
5. Permanent Deformation (AC only) vs AADTT
Permanent Deformation (AC only) vs AADTT
0
0.1
0.2
0.3
0.4
0.5
0.6
500 1000 1500 2000 2500 3000
AADTT
Perm
anen
t Def
orm
atio
n (A
C o
nly)
(in)
Design Life = 20 yrsAC Layer Thickness = 3 inBase Layer Thickness = 6 inBase Layer Modulus = 40,000 psiSubbase Layer Thickness = 9 inSubbase Layer Modulus = 28,000 psiSubgrade Modulus = 10,000 psi
Figure 5: Permanent Deformation (AC only) vs AADTT
The plot of permanent deformation (AC layer only) versus AADTT is shown in Figure 5.
The plot shows that for a constant AC layer thickness of 3 in, an increase of AADTT results in
an increase of the permanent deformation in the AC layer. An increase of the AADTT from 500
to 3,000 results in an increase of the permanent deformation of the AC layer from 0.22 inches to
0.52 inches. The acceptable permanent deformation in AC layer is limited to 0.25 inches for the
given example. From the plot, the given pavement system can only sustain 500 AADTT for
acceptable 0.25 inches of AC permanent deformation. Therefore, the permanent deformation in
AC layer is highly sensitive to AADTT applications.

47
6. Permanent Deformation (Total Pavement) vs AADTT
Permanent Deformation (Total Pavement) vs AADTT
0
0.1
0.2
0.3
0.4
0.5
0.6
0.7
0.8
0.9
1
500 1000 1500 2000 2500 3000
AADTT
Perm
anen
t Def
orm
atio
n (T
otal
Pav
emen
t) (in
)
Design Life = 20 yrsAC Layer Thickness = 3 inBase Layer Thickness = 6 inBase Layer Modulus = 40,000 psiSubbase Layer Thickness = 9 inSubbase Layer Modulus = 28,000 psiSubgrade Modulus = 10,000 psi
Figure 6: Permanent Deformation (Total Pavement) vs AADTT
With all the other input parameters constant, it is seen that the increase of AADTT results
in an increase of the permanent deformation of the pavement. An increase of AADTT from 500
to 3,000 results in an increase of the permanent deformation of the total pavement from 0.5
inches to 0.89 inches. For an acceptable 0.75 inches of total pavement deformation in this
example, not more than 1500 AADTT can be applied for the given pavement system. For an
AADTT of 3000, out of the total permanent deformation of 0.89 inches, 0.52 inches is
contributed by AC layer, 0.07 inches by base layer and 0.30 inches by subgrade layer as can be
seen in the next graph (Figure 7) obtained as an output from AASHTO 2002 Design Guide.

48
Figure 7: Permanent Deformation in different pavement layers over the design life
Design Life = 20 yrsAC Layer Thickness = 3 inBase Layer Thickness = 6 inBase Layer Modulus = 40,000 psiSubbase Layer Thickness = 9 inSubbase Layer Modulus = 28,000 psiSubgrade Modulus = 10,000 psi
Design Life = 20 yrsAC Layer Thickness = 3 inBase Layer Thickness = 6 inBase Layer Modulus = 40,000 psiSubbase Layer Thickness = 9 inSubbase Layer Modulus = 28,000 psiSubgrade Modulus = 10,000 psi
Design Life = 20 yrsAC Layer Thickness = 3 inBase Layer Thickness = 6 inBase Layer Modulus = 40,000 psiSubbase Layer Thickness = 9 inSubbase Layer Modulus = 28,000 psiSubgrade Modulus = 10,000 psi

49
7. Terminal IRI vs AC layer thickness
Terminal IRI vs AC layer thickness
87
88
89
90
91
92
93
94
2 2.5 3 3.5 4 4.5 5 5.5 6 6.5 7
Asphalt Layer Thickness (in)
Term
inal
IRI (
in/m
i)
Design Life = 20 yrsAADTT = 1500Base Layer Thickness = 6 inBase Layer Modulus = 40,000 psiSubbase Layer Thickness = 9 inSubbase Layer Modulus = 28,000 psiSubgrade Modulus = 10,000 psi
Figure 8: Terminal IRI vs AC Layer Thickness
The plot of terminal IRI versus AC layer thickness is shown in Figure 8. The IRI values
were obtained by varying AC layer thickness from 2 to 7 inches. From the plot it reveals that AC
layer thickness has a minor effect on the terminal IRI. It is interesting to see that the terminal IRI
increases as the AC layer thickness is increased from 2 to 3 inches. However, the terminal IRI
decreases with further increase in the AC layer thickness. Thus, for the given data, it is obvious
that a minimum of 3 inches AC thickness should be designed to prevent the increase of the
terminal IRI. This may be the fact that many thinner AC roads have premature cracking.
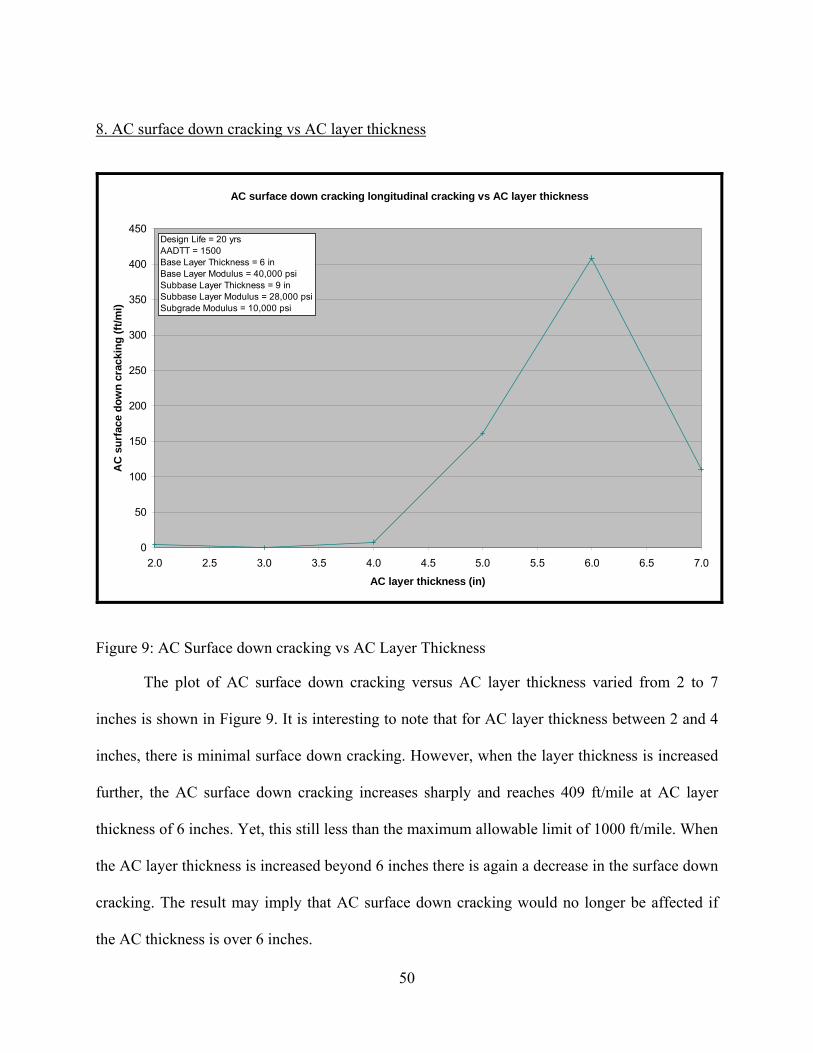
50
8. AC surface down cracking vs AC layer thickness
AC surface down cracking longitudinal cracking vs AC layer thickness
0
50
100
150
200
250
300
350
400
450
2.0 2.5 3.0 3.5 4.0 4.5 5.0 5.5 6.0 6.5 7.0
AC layer thickness (in)
AC
sur
face
dow
n cr
acki
ng (f
t/mi)
Design Life = 20 yrsAADTT = 1500Base Layer Thickness = 6 inBase Layer Modulus = 40,000 psiSubbase Layer Thickness = 9 inSubbase Layer Modulus = 28,000 psiSubgrade Modulus = 10,000 psi
Figure 9: AC Surface down cracking vs AC Layer Thickness
The plot of AC surface down cracking versus AC layer thickness varied from 2 to 7
inches is shown in Figure 9. It is interesting to note that for AC layer thickness between 2 and 4
inches, there is minimal surface down cracking. However, when the layer thickness is increased
further, the AC surface down cracking increases sharply and reaches 409 ft/mile at AC layer
thickness of 6 inches. Yet, this still less than the maximum allowable limit of 1000 ft/mile. When
the AC layer thickness is increased beyond 6 inches there is again a decrease in the surface down
cracking. The result may imply that AC surface down cracking would no longer be affected if
the AC thickness is over 6 inches.

51
9. AC bottom up cracking vs AC layer thickness
AC bottom up cracking (alligator cracking) vs AC layer thickness
0
2
4
6
8
10
12
14
2.0 2.5 3.0 3.5 4.0 4.5 5.0 5.5 6.0 6.5 7.0
Asphalt Layer thickness (in)
AC
bot
tom
up
crac
king
(%)
Design Life = 20 yrsAADTT = 1500Base Layer Thickness = 6 inBase Layer Modulus = 40,000 psiSubbase Layer Thickness = 9 inSubbase Layer Modulus = 28,000 psiSubgrade Modulus = 10,000 psi
Figure 10: AC bottom up cracking vs AC layer thickness
The plot of AC bottom up cracking versus AC layer thickness varied from 2 to 7 inches is
shown in Figure 10. The graph shows that for an AC layer thickness between 2 and 4 inches,
there is a sharp increase in the bottom up cracking. But as the AC layer thickness is increased
beyond 4 inches the bottom up cracking decreases. Yet, an AC layer thickness of 4 inches would
only result in maximum bottom up cracking of 12.40% that is still less than 50% of the
maximum allowable limit of 25%. This implies that for the given data, a 4 inches thickness
would result in no bottom up cracking.

52
10. AC thermal fracture vs AC layer thickness
AC thermal fracture vs Asphalt layer thickness
0.0
0.2
0.4
0.6
0.8
1.0
1.2
2 3 3 4 4 5 5 6 6 7 7
Asphalt layer thickness (in)
AC
ther
mal
frac
ture
(ft/m
i)
Design Life = 20 yrsAADTT = 1500Base Layer Thickness = 6 inBase Layer Modulus = 40,000 psiSubbase Layer Thickness = 9 inSubbase Layer Modulus = 28,000 psiSubgrade Modulus = 10,000 psi
Figure 11: AC thermal fracture vs Asphalt Layer thickness
The plot of AC thermal fracture versus AC layer thickness is shown in Figure 11. From
the Figure it can be seen that the AC layer thickness does not have any effect on the thermal
cracking of AC layer.
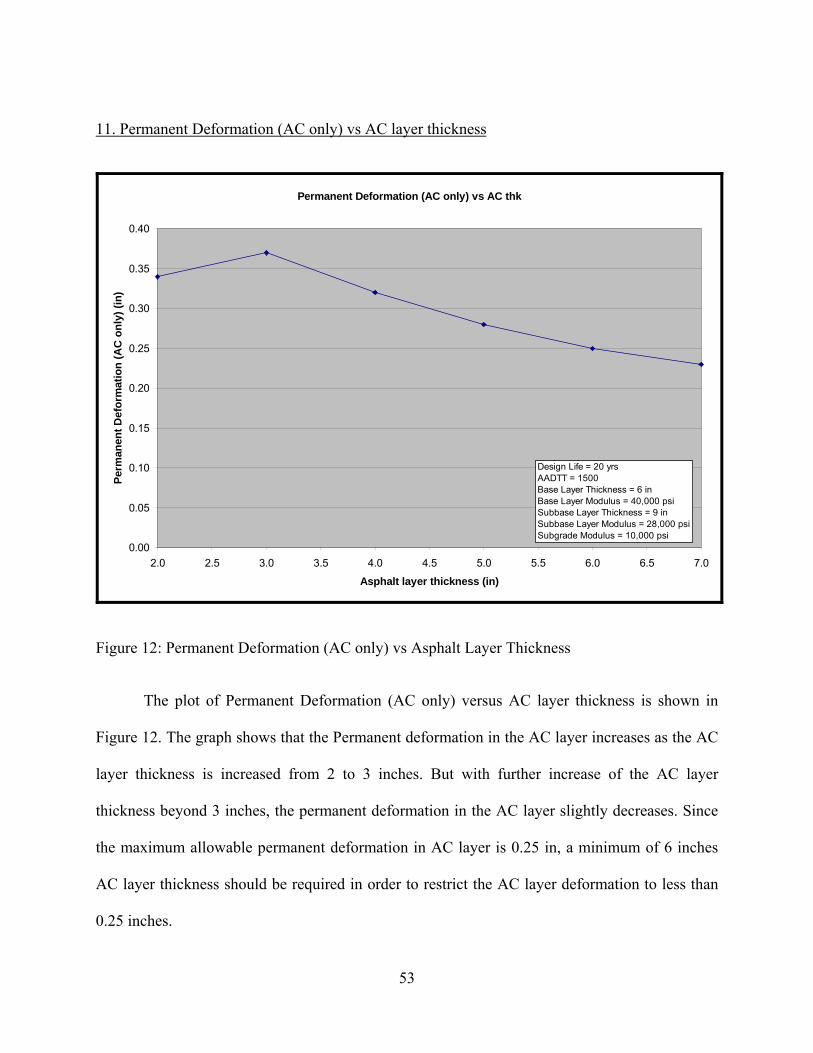
53
11. Permanent Deformation (AC only) vs AC layer thickness
Permanent Deformation (AC only) vs AC thk
0.00
0.05
0.10
0.15
0.20
0.25
0.30
0.35
0.40
2.0 2.5 3.0 3.5 4.0 4.5 5.0 5.5 6.0 6.5 7.0
Asphalt layer thickness (in)
Perm
anen
t Def
orm
atio
n (A
C o
nly)
(in)
Design Life = 20 yrsAADTT = 1500Base Layer Thickness = 6 inBase Layer Modulus = 40,000 psiSubbase Layer Thickness = 9 inSubbase Layer Modulus = 28,000 psiSubgrade Modulus = 10,000 psi
Figure 12: Permanent Deformation (AC only) vs Asphalt Layer Thickness
The plot of Permanent Deformation (AC only) versus AC layer thickness is shown in
Figure 12. The graph shows that the Permanent deformation in the AC layer increases as the AC
layer thickness is increased from 2 to 3 inches. But with further increase of the AC layer
thickness beyond 3 inches, the permanent deformation in the AC layer slightly decreases. Since
the maximum allowable permanent deformation in AC layer is 0.25 in, a minimum of 6 inches
AC layer thickness should be required in order to restrict the AC layer deformation to less than
0.25 inches.
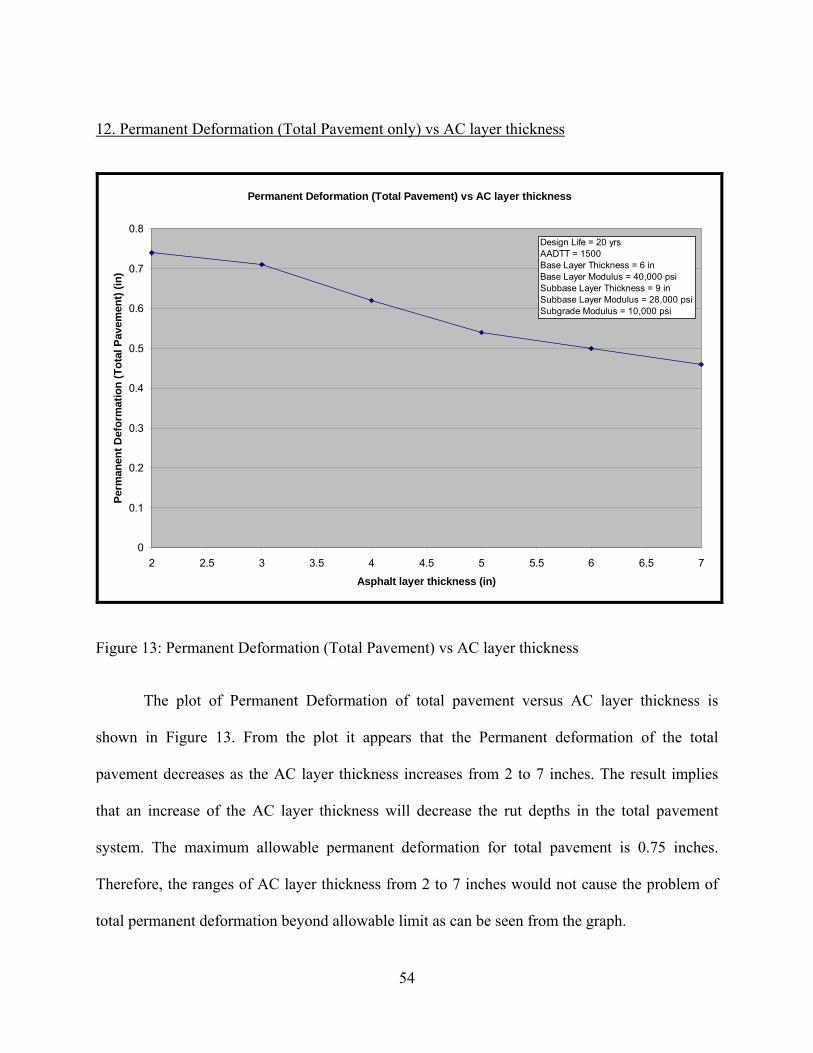
54
12. Permanent Deformation (Total Pavement only) vs AC layer thickness
Permanent Deformation (Total Pavement) vs AC layer thickness
0
0.1
0.2
0.3
0.4
0.5
0.6
0.7
0.8
2 2.5 3 3.5 4 4.5 5 5.5 6 6.5 7
Asphalt layer thickness (in)
Perm
anen
t Def
orm
atio
n (T
otal
Pav
emen
t) (in
)
Design Life = 20 yrsAADTT = 1500Base Layer Thickness = 6 inBase Layer Modulus = 40,000 psiSubbase Layer Thickness = 9 inSubbase Layer Modulus = 28,000 psiSubgrade Modulus = 10,000 psi
Figure 13: Permanent Deformation (Total Pavement) vs AC layer thickness
The plot of Permanent Deformation of total pavement versus AC layer thickness is
shown in Figure 13. From the plot it appears that the Permanent deformation of the total
pavement decreases as the AC layer thickness increases from 2 to 7 inches. The result implies
that an increase of the AC layer thickness will decrease the rut depths in the total pavement
system. The maximum allowable permanent deformation for total pavement is 0.75 inches.
Therefore, the ranges of AC layer thickness from 2 to 7 inches would not cause the problem of
total permanent deformation beyond allowable limit as can be seen from the graph.

55
13. Terminal IRI vs Base Layer Thickness
Terminal IRI vs Base Layer Thickness
92.0
92.2
92.4
92.6
92.8
93.0
93.2
93.4
93.6
93.8
94.0
5.0 5.5 6.0 6.5 7.0 7.5 8.0 8.5 9.0 9.5 10.0
Base Layer Thickness (in)
Term
inal
IRI (
in/m
i)
Design Life = 20 yrsAADTT = 1500AC Layer Thickness = 3 inBase Layer Modulus = 40,000 psiSubbase Layer Thickness = 9 inSubbase Layer Modulus = 28,000 psiSubgrade Modulus = 10,000 psi
Figure 14: Terminal IRI vs Base layer thickness
The plot of Terminal IRI versus Base Layer Thickness is shown in Figure 14. The plot
shows that the Terminal IRI changes abruptly with the changes in the Base Layer Thickness.
However, the general trend of the curve is the decrease in terminal IRI with the increase in the
base layer thickness. The role of base layer is basically to transfer the load from the stronger AC
layer to the relatively weaker subgrade. This concludes that, with the given data of the pavement
system, the change in the base layer thickness does not result in terminal IRI beyond the
maximum allowable limit of 200 in/mile.

56
14. AC surface down cracking vs Base Layer Thickness
AC surface down cracking (longitudinal cracking) vs Base Layer Thickness
0.0
0.1
0.2
0.3
0.4
0.5
0.6
0.7
0.8
0.9
5.0 5.5 6.0 6.5 7.0 7.5 8.0 8.5 9.0 9.5 10.0
Base Layer Thickness (in)
AC
sur
face
dow
n cr
acki
ng (f
t/mile
)
Design Life = 20 yrsAADTT = 1500AC Layer Thickness = 3 inBase Layer Modulus = 40,000 psiSubbase Layer Thickness = 9 inSubbase Layer Modulus = 28,000 psiSubgrade Modulus = 10,000 psi
Figure 15: AC surface down cracking vs Base layer thickness
The plot of AC surface down cracking versus Base Layer Thickness is shown in Figure
15. The plot shows that, as the base layer thickness is increased from 5 to 6 inches the AC
surface down cracking decreases. Then for base layer thickness of 6 to 7 inches, the AC surface
down cracking remains constant. The AC surface down cracking decreases as the base layer
thickness is increased from 7 to 8 inches. With further increase in the base layer thickness
beyond 8 inches the AC surface down cracking remains constant. It can be noted that the

57
maximum allowable limit of 1000 ft/mile for AC surface down cracking is not exceeded when a
range of base layer thicknesses from 5 t 10 inches are used for pavement design.
15. AC bottom up cracking vs Base Layer Thickness
AC bottom up cracking (alligator cracking) vs Base Layer thickness
0.0
2.0
4.0
6.0
8.0
10.0
12.0
14.0
16.0
5.0 5.5 6.0 6.5 7.0 7.5 8.0 8.5 9.0 9.5 10.0
Base Layer Thickness (in)
AC
bot
tom
up
crac
king
(%)
Design Life = 20 yrsAADTT = 1500AC Layer Thickness = 3 inBase Layer Modulus = 40,000 psiSubbase Layer Thickness = 9 inSubbase Layer Modulus = 28,000 psiSubgrade Modulus = 10,000 psi
Figure 16: AC bottom up cracking vs Base layer thickness
The plot of AC bottom up cracking versus Base Layer Thickness varied from 5 to 10
inches is shown in Figure 16. The plot shows that the AC bottom up cracking changes abruptly
with the changes in the Base Layer Thickness. However, the general trend of the curve is the
decrease in AC bottom up cracking with the increase in the Base Layer thickness. This is
because a greater base layer thickness helps in transferring the load to the subbase and subgrade
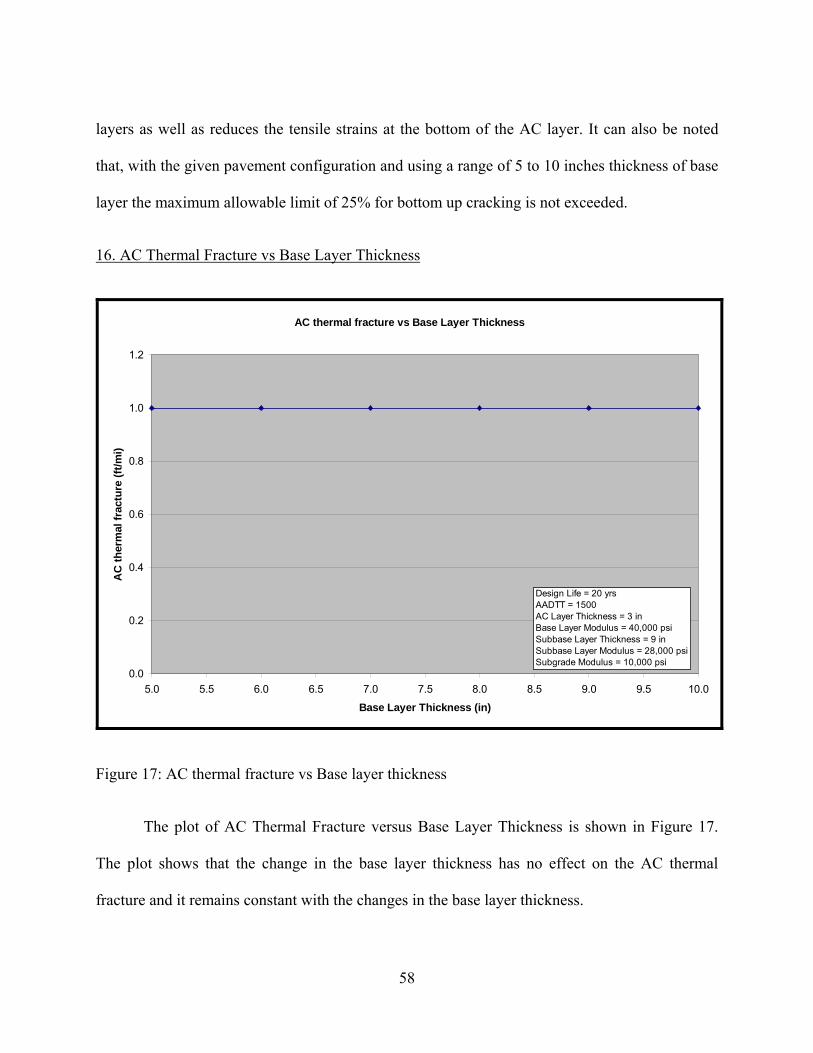
58
layers as well as reduces the tensile strains at the bottom of the AC layer. It can also be noted
that, with the given pavement configuration and using a range of 5 to 10 inches thickness of base
layer the maximum allowable limit of 25% for bottom up cracking is not exceeded.
16. AC Thermal Fracture vs Base Layer Thickness
AC thermal fracture vs Base Layer Thickness
0.0
0.2
0.4
0.6
0.8
1.0
1.2
5.0 5.5 6.0 6.5 7.0 7.5 8.0 8.5 9.0 9.5 10.0
Base Layer Thickness (in)
AC
ther
mal
frac
ture
(ft/m
i)
Design Life = 20 yrsAADTT = 1500AC Layer Thickness = 3 inBase Layer Modulus = 40,000 psiSubbase Layer Thickness = 9 inSubbase Layer Modulus = 28,000 psiSubgrade Modulus = 10,000 psi
Figure 17: AC thermal fracture vs Base layer thickness
The plot of AC Thermal Fracture versus Base Layer Thickness is shown in Figure 17.
The plot shows that the change in the base layer thickness has no effect on the AC thermal
fracture and it remains constant with the changes in the base layer thickness.

59
17. Permanent Deformation AC only vs Base Layer Thickness
Permanent Deformation (AC only) vs Base Layer Thickness
0.358
0.360
0.362
0.364
0.366
0.368
0.370
0.372
5.0 5.5 6.0 6.5 7.0 7.5 8.0 8.5 9.0 9.5 10.0
Base Layer Thickness (in)
Perm
anen
t Def
orm
atio
n (A
C o
nly)
(in)
Design Life = 20 yrsAADTT = 1500AC Layer Thickness = 3 inBase Layer Modulus = 40,000 psiSubbase Layer Thickness = 9 inSubbase Layer Modulus = 28,000 psiSubgrade Modulus = 10,000 psi
Figure 18: Permanent Deformation (AC only) vs Base layer thickness
The plot of permanent deformation (AC only) versus the base layer thickness is shown in
Figure 18. From the plot, it reveals that the Permanent Deformation in the AC layer remains
constant with increase in the base layer thickness from 5 to 8 inches. With further increase in the
base layer thickness from 8 to 9 inches, the Permanent Deformation in the AC layer decreases by
0.01 inch. The permanent deformation in the AC layer remains constant with the increase in the
base layer thickness from 9 to 10 inches. Therefore it can be concluded, that the change in the
base layer thickness has a minor effect on the Permanent Deformation in the AC layer.

60
18. Permanent Deformation (Total Pavement) vs Base Layer Thickness
Permanent Deformation (Total Pavement) vs Base Layer Thickness
0.685
0.690
0.695
0.700
0.705
0.710
0.715
0.720
0.725
5.0 5.5 6.0 6.5 7.0 7.5 8.0 8.5 9.0 9.5 10.0
Base Layer Thickness (in)
Perm
anen
t Def
orm
atio
n (in
)
Design Life = 20 yrsAADTT = 1500AC Layer Thickness = 3 inBase Layer Modulus = 40,000 psiSubbase Layer Thickness = 9 inSubbase Layer Modulus = 28,000 psiSubgrade Modulus = 10,000 psi
Figure 19: Permanent deformation (total) pavement vs Base Layer thickness
The above plot shows that permanent deformation of the total pavement decreases as the
base layer thickness is increased from 5 to 6 inches. For a base thickness of 6 to 7 inches the
permanent deformation remains constant. The permanent deformation decreases for 7 to 8 inches
of base thickness, remains constant for 8 to 9 inches base thickness and again decreases for 9 to
10 inches of base thickness. Thus the general trend of the curve is that the permanent
deformation in the total pavement decreases as the base layer thickness increases. In some cases
the permanent deformation is the same for two different thicknesses. In such cases the smaller of

61
the two thicknesses must be used for pavement design. It can also be concluded, that with the
given data of the pavement system, the change in base layer thicknesses from 5 to 10 inches does
not result in total pavement deformation beyond the maximum allowable limit of 0.75 inch.
19. Terminal IRI vs Base Layer Modulus
Terminal IRI vs # Base Layer Modulus
92.4
92.5
92.6
92.7
92.8
92.9
93.0
93.1
93.2
93.3
93.4
38500 39000 39500 40000 40500 41000 41500 42000
Base Layer Modulus (psi)
Term
inal
IRI (
in/m
i)
Design Life = 20 yrsAADTT = 1500AC Layer Thickness = 3 inBase Layer Thickness = 6 inSubbase Layer Thickness = 9 inSubbase Layer Modulus = 28,000 psiSubgrade Modulus = 10,000 psi
Figure 20: Terminal IRI vs Base layer modulus
The plot of Terminal IRI versus base layer Modulus is shown in Figure 20. The plot
shows that Terminal IRI decreases with the increase in the base layer modulus values. For a
change in base layer modulus from 38,500 psi to 42,000 psi, the terminal IRI decreases from
93.3 to 92.5 in/mile. It can also be noted, that with the given data of pavement system and using

62
different base layer modulus, the maximum acceptable limit of 200 in/mile for the Terminal IRI
is not exceeded at the end of the design life.
20. AC surface down cracking vs Base Layer Modulus
AC surface down cracking longitudinal cracking vs # Base Layer Modulus
0.0
0.1
0.2
0.3
0.4
0.5
0.6
38500 39000 39500 40000 40500 41000 41500 42000
Base Layer Modulus (psi)
AC
sur
face
dow
n C
rack
ing
(ft/m
i)
Design Life = 20 yrsAADTT = 1500AC Layer Thickness = 3 inBase Layer Thickness = 6 inSubbase Layer Thickness = 9 inSubbase Layer Modulus = 28,000 psiSubgrade Modulus = 10,000 psi
Figure 21: AC surface down cracking vs Base layer modulus
The plot of AC surface down cracking versus base layer modulus is shown in Figure 21.
The plot shows that the AC surface down cracking remains constant with the increase in the base
layer modulus from 38500 to 39000 psi. There is a drop in the AC surface down cracking with
the increase in the base layer modulus from 39000 to 40000 psi. There is no change in the AC
surface down cracking with increase in the base layer modulus beyond 40,000 psi. The amount
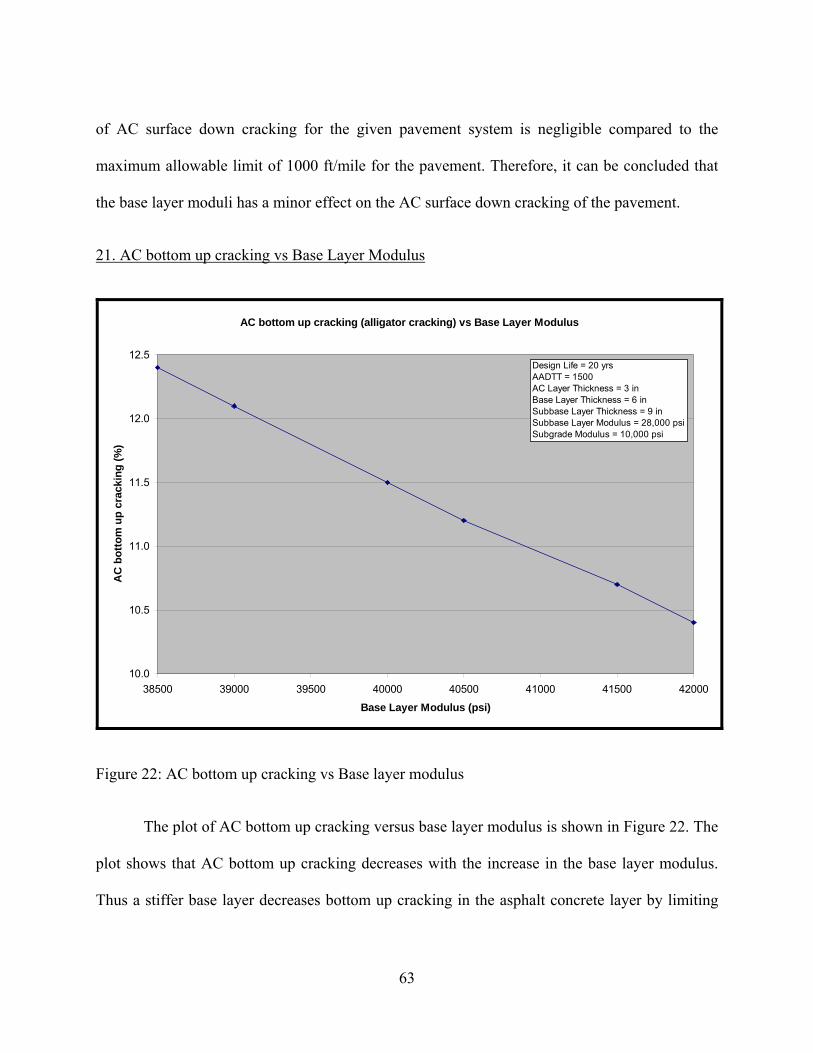
63
of AC surface down cracking for the given pavement system is negligible compared to the
maximum allowable limit of 1000 ft/mile for the pavement. Therefore, it can be concluded that
the base layer moduli has a minor effect on the AC surface down cracking of the pavement.
21. AC bottom up cracking vs Base Layer Modulus
AC bottom up cracking (alligator cracking) vs Base Layer Modulus
10.0
10.5
11.0
11.5
12.0
12.5
38500 39000 39500 40000 40500 41000 41500 42000
Base Layer Modulus (psi)
AC
bot
tom
up
crac
king
(%)
Design Life = 20 yrsAADTT = 1500AC Layer Thickness = 3 inBase Layer Thickness = 6 inSubbase Layer Thickness = 9 inSubbase Layer Modulus = 28,000 psiSubgrade Modulus = 10,000 psi
Figure 22: AC bottom up cracking vs Base layer modulus
The plot of AC bottom up cracking versus base layer modulus is shown in Figure 22. The
plot shows that AC bottom up cracking decreases with the increase in the base layer modulus.
Thus a stiffer base layer decreases bottom up cracking in the asphalt concrete layer by limiting

64
the tensile stresses and strains at the bottom of the AC layer. It can be noted that the maximum
allowable limit of 25% for bottom up cracking is not exceeded for the given pavement system.
22. AC thermal fracture vs Base Layer Modulus
AC thermal fracture vs Base Layer Modulus
0.0
0.2
0.4
0.6
0.8
1.0
1.2
38500 39000 39500 40000 40500 41000 41500 42000
Base Layer Modulus (psi)
AC
ther
mal
Fra
ctur
e (ft
/mi)
Design Life = 20 yrsAADTT = 1500AC Layer Thickness = 3 inBase Layer Thickness = 6 inSubbase Layer Thickness = 9 inSubbase Layer Modulus = 28,000 psiSubgrade Modulus = 10,000 psi
Figure 23: AC thermal fracture vs Base layer modulus
The plot of AC thermal fracture versus base layer modulus is shown in Figure 23. The
plot shows that AC thermal fracture remains unchanged with the increase in the base layer
modulus. Thus AC thermal fracture is independent of the base layer modulus.

65
23. Permanent Deformation (AC only) vs Base Layer Modulus
Permanent Deformation (AC only) vs Base Layer Modulus
0.00
0.05
0.10
0.15
0.20
0.25
0.30
0.35
0.40
38500 39000 39500 40000 40500 41000 41500 42000
Base Layer Modulus (psi)
Pem
anen
t Def
orm
atio
n (A
C o
nly)
(in)
Design Life = 20 yrsAADTT = 1500AC Layer Thickness = 3 inBase Layer Thickness = 6 inSubbase Layer Thickness = 9 inSubbase Layer Modulus = 28,000 psiSubgrade Modulus = 10,000 psi
Figure 24: Permanent Deformation (AC only) vs Base layer modulus
The plot of permanent deformation (AC only) versus base layer modulus is shown in
Figure 24. From the Figure it can be seen that the Permanent Deformation (AC only) remains
constant at 0.37 inches with the increase in the base layer modulus, however it exceeds the
maximum allowable limit of 0.25 inches of permanent deformation in AC layer. Thus, it can be
concluded that the permanent deformation in the AC layer is independent of the stiffness of base
layer modulus.

66
24. Permanent Deformation (Total Pavement) vs Base Layer Modulus
Permanent Deformation (Total Pavement) vs Base Layer Modulus
0.698
0.700
0.702
0.704
0.706
0.708
0.710
0.712
38500 39000 39500 40000 40500 41000 41500 42000
Base Layer Modulus (psi)
Perm
anen
t Def
orm
atio
n (T
otal
Pav
emen
t) (in
)
Design Life = 20 yrsAADTT = 1500AC Layer Thickness = 3 inBase Layer Thickness = 6 inSubbase Layer Thickness = 9 inSubbase Layer Modulus = 28,000 psiSubgrade Modulus = 10,000 psi
Figure 25: Permanent deformation (Total Pavement) vs Base layer modulus
The plot of permanent deformation (Total Pavement) versus base layer is shown in the
Figure 25. The figure shows that permanent deformation in the total pavement remains constant
with the increase in the base layer modulus from 38,500 to 40,000 psi and then it decreases by
0.1 inches as the modulus increases from 40,000 to 40,500 psi. Beyond 40,500 psi the permanent
deformation remains constant. Since the maximum allowable permanent deformation is 0.75
inches, the quality of base course does not cause much impact on total pavement permanent
deformation.

67
25 Terminal IRI vs Subbase layer thickness
Terminal IRI vs Subbase Thickness
92.6
92.7
92.8
92.9
93.0
93.1
93.2
93.3
93.4
7.0 7.5 8.0 8.5 9.0 9.5 10.0 10.5 11.0 11.5 12.0
Subbase Layer Thickness (in)
Term
inal
IRI (
in/m
i)
Design Life = 20 yrsAADTT = 1500AC Layer Thickness = 3 inBase Layer Thickness = 6 inBase Layer Modulus = 40,000 psiSubbase Layer Modulus = 28,000 psiSubgrade Modulus = 10,000 psi
Figure 26: Terminal IRI vs Subbase thickness
The plot of terminal IRI versus subbase layer thickness is shown in Figure 26. From the
figure it can be concluded, that the terminal IRI decreases with the increase in the subbase layer
thickness. However, it is interesting to note that for the subbase layer thickness of 10 and 11
inches the terminal IRI value remains constant. The plot also shows that the effect of subbase
layer thickness on the terminal IRI is not too significant and the maximum allowable terminal
IRI value of 200 in/mile for the given pavement system is not exceeded.

68
26. AC surface down cracking vs Subbase Layer Thickness
AC surface down cracking (longitudinal cracking) vs Subbase Layer thickness
0.0
0.1
0.2
0.3
0.4
0.5
0.6
0.7
0.8
7.0 7.5 8.0 8.5 9.0 9.5 10.0 10.5 11.0 11.5 12.0
Subbase Layer Thickness (in)
AC
sur
face
dow
n cr
acki
ng (l
ongi
tudi
nal)
(ft/m
i)
Design Life = 20 yrsAADTT = 1500AC Layer Thickness = 3 inBase Layer Thickness = 6 inBase Layer Modulus = 40,000 psiSubbase Layer Modulus = 28,000 psiSubgrade Modulus = 10,000 psi
Figure 27: AC surface down cracking vs Subbase layer thickness
The plot of AC surface down cracking versus subbase layer thickness is shown in Figure
27. From the figure it can be seen that the AC surface down cracking decreases with the increase
in the subbase layer thickness. However for the change in subbase layer thickness from 9 to 10
inches and from 11 to 12 inches the AC surface down cracking remains constant. Also the
amount of AC surface down cracking is negligible compared to the maximum allowable limit of
1000 ft/mile of the pavement.
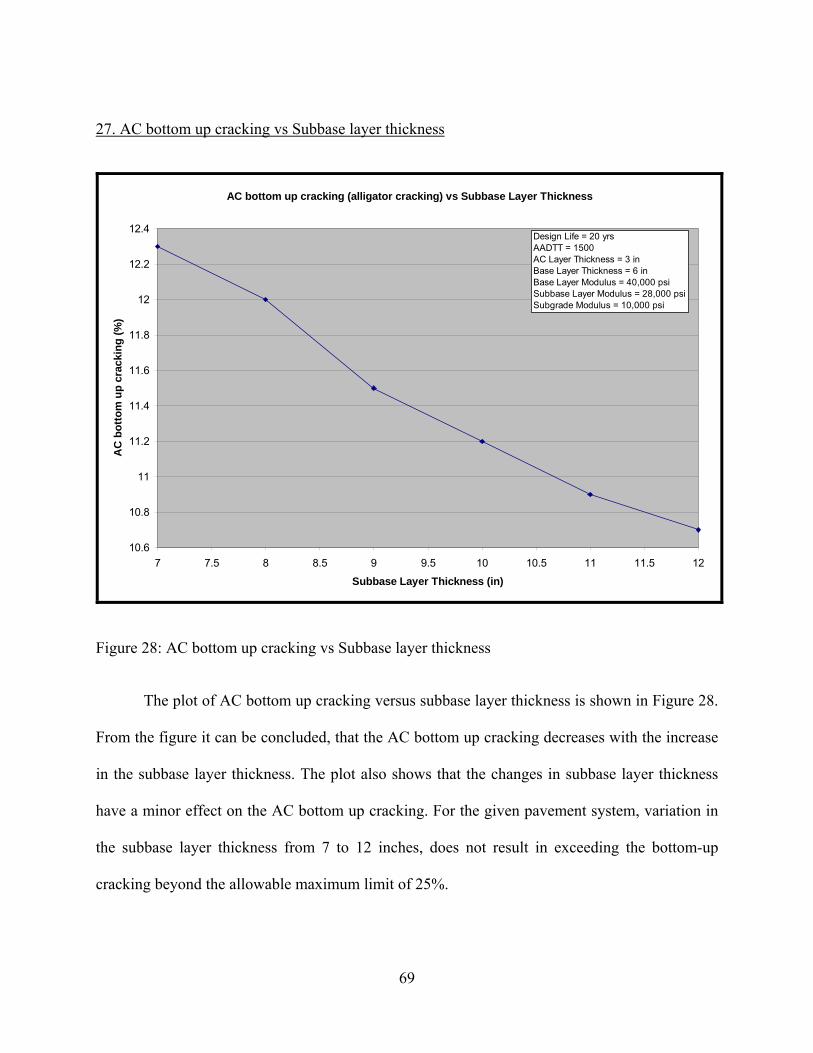
69
27. AC bottom up cracking vs Subbase layer thickness
AC bottom up cracking (alligator cracking) vs Subbase Layer Thickness
10.6
10.8
11
11.2
11.4
11.6
11.8
12
12.2
12.4
7 7.5 8 8.5 9 9.5 10 10.5 11 11.5 12
Subbase Layer Thickness (in)
AC
bot
tom
up
crac
king
(%)
Design Life = 20 yrsAADTT = 1500AC Layer Thickness = 3 inBase Layer Thickness = 6 inBase Layer Modulus = 40,000 psiSubbase Layer Modulus = 28,000 psiSubgrade Modulus = 10,000 psi
Figure 28: AC bottom up cracking vs Subbase layer thickness
The plot of AC bottom up cracking versus subbase layer thickness is shown in Figure 28.
From the figure it can be concluded, that the AC bottom up cracking decreases with the increase
in the subbase layer thickness. The plot also shows that the changes in subbase layer thickness
have a minor effect on the AC bottom up cracking. For the given pavement system, variation in
the subbase layer thickness from 7 to 12 inches, does not result in exceeding the bottom-up
cracking beyond the allowable maximum limit of 25%.

70
28. AC thermal fracture vs Subbase Layer Thickness
AC thermal fracture vs Subbase Layer Thickness
0.0
0.2
0.4
0.6
0.8
1.0
1.2
7.0 7.5 8.0 8.5 9.0 9.5 10.0 10.5 11.0 11.5 12.0
Subbase Layer Thickness (in)
AC
ther
mal
frac
ture
(ft/m
i)
Design Life = 20 yrsAADTT = 1500AC Layer Thickness = 3 inBase Layer Thickness = 6 inBase Layer Modulus = 40,000 psiSubbase Layer Modulus = 28,000 psiSubgrade Modulus = 10,000 psi
Figure 29: AC thermal fracture vs Subbase layer thickness
The plot of AC thermal fracture versus subbase layer thickness is shown in Figure 29.
From the figure it can be seen that the change in subbase layer thickness has no effect on the AC
thermal fracture. Thus the AC thermal fracture is independent of the subbase layer thickness.

71
29. Permanent Deformation (AC only) vs Subbase Layer Thickness
Permanent Deformation (AC only) vs Subbase Layer Thickness
0.00
0.05
0.10
0.15
0.20
0.25
0.30
0.35
0.40
7.0 7.5 8.0 8.5 9.0 9.5 10.0 10.5 11.0 11.5 12.0
Subbase Layer Thickness (in)
Perm
anen
t Def
orm
atio
n (A
C o
nly)
(in)
Design Life = 20 yrsAADTT = 1500AC Layer Thickness = 3 inBase Layer Thickness = 6 inBase Layer Modulus = 40,000 psiSubbase Layer Modulus = 28,000 psiSubgrade Modulus = 10,000 psi
Figure 30: Permanent deformation (AC only) vs Subbase layer thickness
The plot of permanent deformation (AC only) versus subbase layer thickness is shown in
Figure 30. From the figure it can be concluded that the change in subbase layer thickness from 7
to 12 inches has no effect on the Permanent Deformation in the AC layer. The plot also shows,
that for the given pavement configuration and range of subbase layer thickness from 7.0 to 12.0
inches, the permanent deformation in AC layer is more than the allowable maximum limit of
0.25 inches.
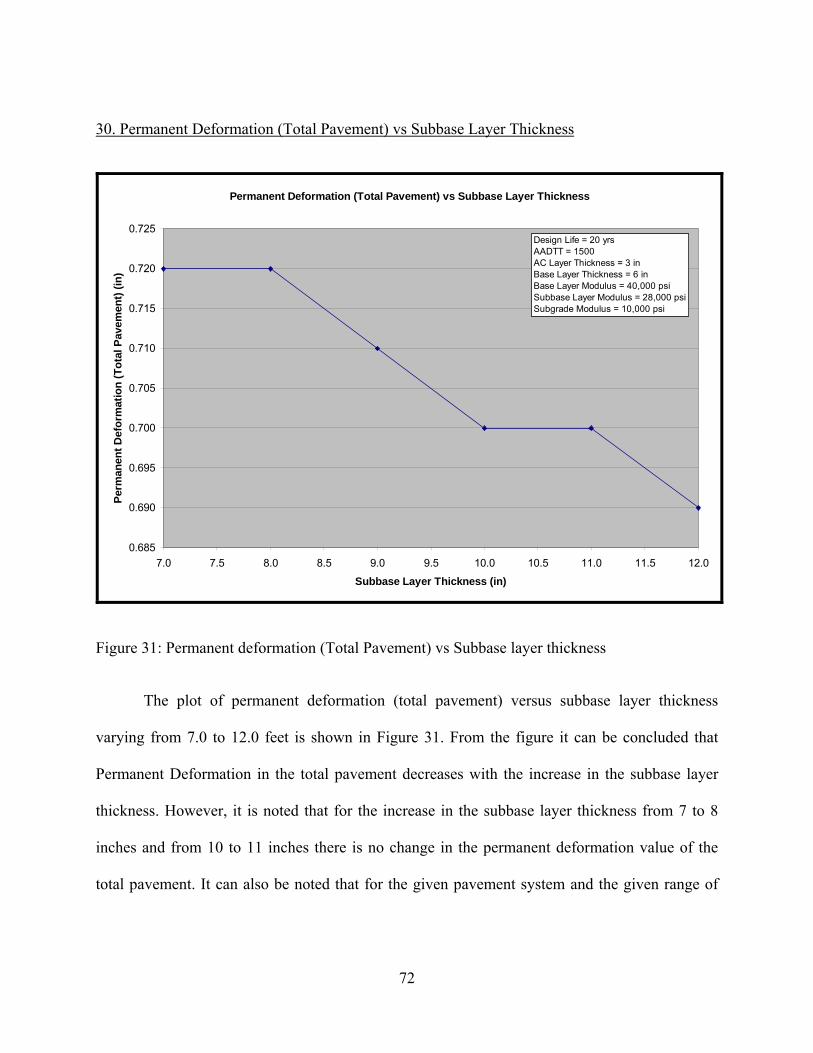
72
30. Permanent Deformation (Total Pavement) vs Subbase Layer Thickness
Permanent Deformation (Total Pavement) vs Subbase Layer Thickness
0.685
0.690
0.695
0.700
0.705
0.710
0.715
0.720
0.725
7.0 7.5 8.0 8.5 9.0 9.5 10.0 10.5 11.0 11.5 12.0
Subbase Layer Thickness (in)
Perm
anen
t Def
orm
atio
n (T
otal
Pav
emen
t) (in
)
Design Life = 20 yrsAADTT = 1500AC Layer Thickness = 3 inBase Layer Thickness = 6 inBase Layer Modulus = 40,000 psiSubbase Layer Modulus = 28,000 psiSubgrade Modulus = 10,000 psi
Figure 31: Permanent deformation (Total Pavement) vs Subbase layer thickness
The plot of permanent deformation (total pavement) versus subbase layer thickness
varying from 7.0 to 12.0 feet is shown in Figure 31. From the figure it can be concluded that
Permanent Deformation in the total pavement decreases with the increase in the subbase layer
thickness. However, it is noted that for the increase in the subbase layer thickness from 7 to 8
inches and from 10 to 11 inches there is no change in the permanent deformation value of the
total pavement. It can also be noted that for the given pavement system and the given range of

73
subbase layer thickness, permanent deformation in the total pavement is less than the maximum
allowable limit of 0.75 inches.
31 Terminal IRI vs Subbase layer Modulus
Terminal IRI vs Subbase Layer Modulus
92.5
92.6
92.7
92.8
92.9
93.0
93.1
93.2
93.3
93.4
25000 26000 27000 28000 29000 30000 31000 32000 33000
Subbase Layer Modulus (psi)
Term
inal
IRI (
in/m
i)
Design Life = 20 yrsAADTT = 1500AC Layer Thickness = 3 inBase Layer Thickness = 6 inBase Layer Modulus = 40,000 psiSubbase Layer Thickness = 9 inSubgrade Modulus = 10,000 psi
Figure 32: Terminal IRI vs Subbase layer modulus
The plot of terminal IRI versus subbase layer modulus varying from 25,000 psi to 33,000
psi is shown in Figure 32. The plot shows that the terminal IRI decreases with the increase in the
subbase layer modulus. Thus, it concludes that the increase in the stiffness of the subbase layer
moduli results in increasing the terminal smoothness of the pavement. An increase in the subbase
layer modulus from 25,000 psi to 33,000 psi results in a decrease of terminal IRI from 93.3 to

74
92.6 in/mile. The initial IRI for a newly constructed pavement is about 75 in/mile and the
maximum acceptable terminal IRI is 200 in/mile. From the plot it appears that for the given
pavement system and the given range of subbase layer thickness the maximum acceptable
terminal IRI is not exceeded. Therefore, change in subbase layer thickness has only a minor
effect on the pavement smoothness.
32. AC surface down cracking vs Subbase Layer Modulus
AC surface down cracking (longitudinal cracking) vs Subbase Layer Modulus
0
0.1
0.2
0.3
0.4
0.5
0.6
0.7
25000 26000 27000 28000 29000 30000 31000 32000 33000
Subbase Layer Modulus (psi)
AC
sur
face
dow
n cr
acki
ng (f
t/mi)
Design Life = 20 yrsAADTT = 1500AC Layer Thickness = 3 inBase Layer Thickness = 6 inBase Layer Modulus = 40,000 psiSubbase Layer Thickness = 9 inSubgrade Modulus = 10,000 psi
Figure 33: AC surface down cracking vs Subbase layer modulus
The plot of AC surface down cracking versus varying subbase layer modulus is shown in
Figure 33. The plot shows that the AC surface down cracking decreases with the increase in the

75
subbase layer modulus. It is to be noted that there is no change in the AC surface down cracking
as the subbase layer modulus is increased from 28,000 psi to 29,500 psi. No change in surface
down cracking is also found when the subbase layer modulus is increased from 31,000 psi to
33,000 psi. The maximum value of surface down cracking from the above plot is 0.6 ft/mile for a
subbase layer modulus of 25000 psi and the given pavement system, which is negligible
compared to maximum allowable value of 1000 ft/mile for failure. Thus, it concludes that the
change in subbase layer thickness has a minor effect on the AC surface down cracking.
33. AC bottom up cracking vs Subbase Layer Modulus
AC bottom up cracking (alligator cracking) vs Subbase Layer Modulus
10.4
10.6
10.8
11.0
11.2
11.4
11.6
11.8
12.0
12.2
12.4
25000 26000 27000 28000 29000 30000 31000 32000 33000
Subbase Layer Modulus (psi)
AC
bot
tom
up
crac
king
(%)
Design Life = 20 yrsAADTT = 1500AC Layer Thickness = 3 inBase Layer Thickness = 6 inBase Layer Modulus = 40,000 psiSubbase Layer Thickness = 9 inSubgrade Modulus = 10,000 psi

76
Figure 34: AC bottom up cracking vs Subbase layer modulus
The plot of AC bottom up cracking versus subbase layer modulus varying from 25,000
psi to 33,000 psi is shown in Figure 34. The plot shows that the AC bottom up cracking
decreases with the increase in the subbase modulus. Thus, it concludes that the use of a stiffer
subbase layer will result in reduced AC bottom up cracking. From the plot it also appears that for
the given pavement system a subbase layer modulus of 25,000 psi or a bit lower stiffness can be
still be used, as the maximum allowable limit of 25% bottom up cracking, set for the given
example, is not exceeded even at subbase modulus of 25000 psi, which is the lowest subbase
modulus value in the above analysis.
34. AC thermal fracture vs Subbase Layer Modulus
AC thermal fracture vs Subbase Layer Modulus
0.0
0.2
0.4
0.6
0.8
1.0
1.2
25000 26000 27000 28000 29000 30000 31000 32000 33000
Subbase Layer Modulus (psi)
AC
The
rmal
frac
ture
(ft/m
i)
Design Life = 20 yrsAADTT = 1500AC Layer Thickness = 3 inBase Layer Thickness = 6 inBase Layer Modulus = 40,000 psiSubbase Layer Thickness = 9 inSubgrade Modulus = 10,000 psi
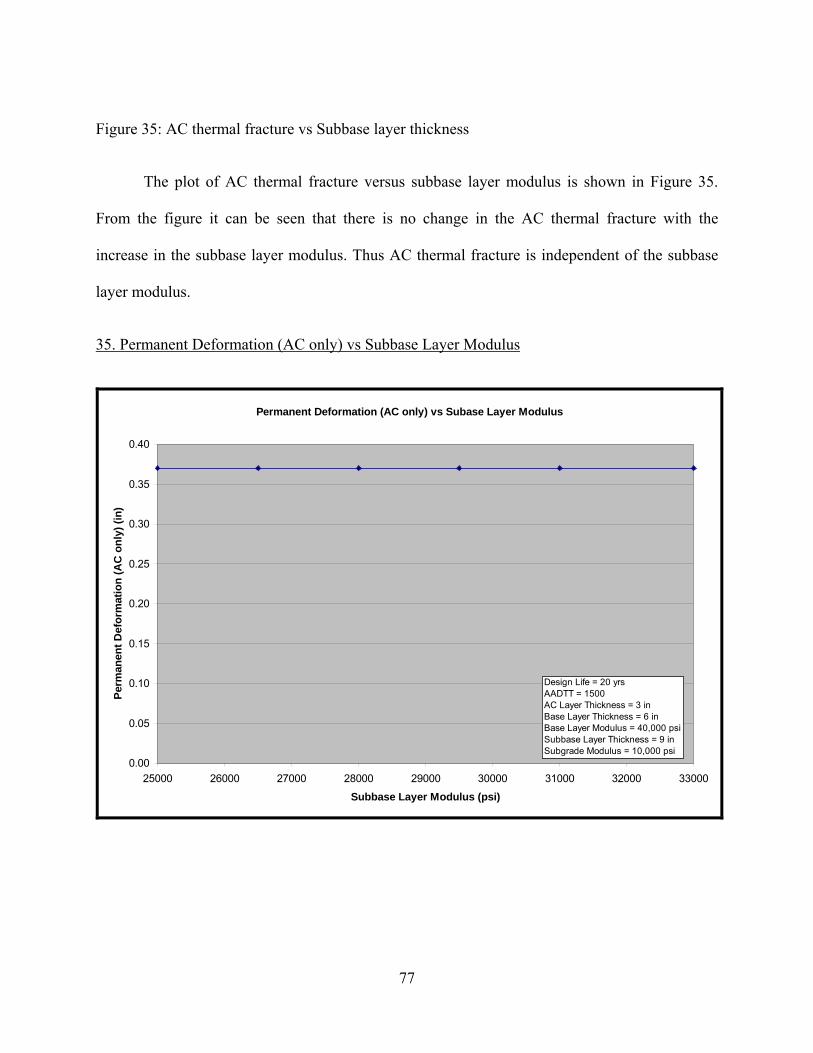
77
Figure 35: AC thermal fracture vs Subbase layer thickness
The plot of AC thermal fracture versus subbase layer modulus is shown in Figure 35.
From the figure it can be seen that there is no change in the AC thermal fracture with the
increase in the subbase layer modulus. Thus AC thermal fracture is independent of the subbase
layer modulus.
35. Permanent Deformation (AC only) vs Subbase Layer Modulus
Permanent Deformation (AC only) vs Subase Layer Modulus
0.00
0.05
0.10
0.15
0.20
0.25
0.30
0.35
0.40
25000 26000 27000 28000 29000 30000 31000 32000 33000
Subbase Layer Modulus (psi)
Perm
anen
t Def
orm
atio
n (A
C o
nly)
(in)
Design Life = 20 yrsAADTT = 1500AC Layer Thickness = 3 inBase Layer Thickness = 6 inBase Layer Modulus = 40,000 psiSubbase Layer Thickness = 9 inSubgrade Modulus = 10,000 psi

78
Figure 36: Permanent deformation (AC only) vs Subbase layer Modulus
The plot of Permanent Deformation (AC only) versus subbase layer modulus is shown in
Figure 36. The plot shows that there is no change in the permanent deformation in the AC layer
with the increase in the subbase modulus. Thus the permanent deformation in the AC layer is
independent of the change in stiffness of subbase layer.
36. Permanent Deformation (Total Pavement) vs Subbase Layer Modulus
Permanent Deformation (Total Pavement) vs Subbase Layer Modulus
0.685
0.690
0.695
0.700
0.705
0.710
0.715
0.720
0.725
25000 26000 27000 28000 29000 30000 31000 32000 33000
Subbase Layer Modulus (psi)
Perm
anen
t Def
orm
atio
n (T
otal
Pav
emen
t) (in
)
Design Life = 20 yrsAADTT = 1500AC Layer Thickness = 3 inBase Layer Thickness = 6 inBase Layer Modulus = 40,000 psiSubbase Layer Thickness = 9 inSubgrade Modulus = 10,000 psi

79
Figure 37: Permanent deformation (Total Pavement) vs Subbase layer thickness
The plot of Permanent Deformation (Total Pavement) versus subbase layer modulus
varying from 25,000 psi to 33,000 psi is shown in Figure 37. The plot shows, that in general the
permanent deformation in the total pavement decreases with the increase in the subbase layer
modulus. However, there is no change in the permanent deformation of the total pavement for
the increase in subbase modulus from 26500 to 28000 psi and from 29500 to 31000 psi. The plot
also reveals that the permanent deformation in total pavement does not exceed the maximum
allowable limit of 0.75 inch set for the given pavement system for the range of subbase layer
modulus used in the analysis.
37. Terminal IRI vs Subgrade Modulus
Terminal IRI vs # Subgrade Modulus
92.7
92.8
92.9
93.0
93.1
93.2
93.3
93.4
93.5
5000 6000 7000 8000 9000 10000 11000 12000 13000
Subgrade Modulus (psi)
Term
inal
IRI (
in/m
i)
Design Life = 20 yrsAADTT = 1500AC Layer Thickness = 3 inBase Layer Thickness = 6 inBase Layer Modulus = 40,000 psiSubbase Layer Thickness = 9 inSubbase Layer Modulus = 28,000 psi

80
Figure 38: Terminal IRI vs Subgrade modulus
The plot of terminal IRI versus subgrade modulus is shown in Figure 38. The plot shows,
that the terminal IRI decreases with the increase in the subgrade modulus. Thus greater the
stiffness of the subgrade, greater will be the smoothness of the pavement at the end of the design
life. For a decrease in the stiffness of the Subgrade Modulus from 5,000 psi to 13,000 psi, the
terminal IRI decreases from 93.4 to 92.8 in/mile. Thus, the change in subgrade modulus does not
have a significant impact on the terminal IRI of the pavement as can be seen from the graph.
38. AC surface down cracking vs Subgrade modulus
AC surface down cracking longitudinal cracking vs Subgrade Modulus
0.0
0.1
0.2
0.3
0.4
0.5
0.6
0.7
0.8
5000 6000 7000 8000 9000 10000 11000 12000 13000
Subgrade Modulus
AC
sur
face
dow
n cr
acki
ng (f
t/mi)
Design Life = 20 yrsAADTT = 1500AC Layer Thickness = 3 inBase Layer Thickness = 6 inBase Layer Modulus = 40,000 psiSubbase Layer Thickness = 9 inSubbase Layer Modulus = 28,000 psi

81
Figure 39: AC surface down cracking vs Subgrade Modulus
The plot of AC surface down cracking versus subgrade modulus is shown in Figure 39.
From the plot it can be noted that the AC surface down cracking increases with the increase in
the modulus of the subgrade, which is not realistic. Conceptually, a stronger subgrade should
help in reducing the stresses and strains within the pavement and reduce the surface down
cracking. This implies some error in the AASHTO 2002 Design Guide Software pertaining to
the AC surface down cracking model.
39. AC bottom up cracking vs Subgrade modulus
AC bottom up cracking (alligator cracking) vs Subgrade Modulus
10.8
11.0
11.2
11.4
11.6
11.8
12.0
12.2
12.4
12.6
12.8
5000 6000 7000 8000 9000 10000 11000 12000 13000
Subgrade Modulus
AC
bot
tom
up
crac
king
(%)
Design Life = 20 yrsAADTT = 1500AC Layer Thickness = 3 inBase Layer Thickness = 6 inBase Layer Modulus = 40,000 psiSubbase Layer Thickness = 9 inSubbase Layer Modulus = 28,000 psi

82
Figure 40: AC bottom up cracking vs Subgrade modulus
The plot of AC bottom up cracking versus subgrade modulus is shown in Figure 40.
From the figure it can be inferred that the AC bottom up cracking decreases with the increase in
the subgrade layer modulus. Thus it implies, that a stronger subgrade helps in limiting the
permanent deformation in the overlying layers and thereby reduces the tensile stress and strains
at the bottom of the AC layer. For an increase in the subgrade modulus from 5,000 psi to 13,500
psi, the AC bottom up cracking decreases from 12.7% to 11.0%.It can be noted that with the
given system of the pavement, and using a subgrade modulus range from 5,000 to 13,500 psi, the
maximum allowable limit of 25% for bottom-up cracking in the pavement is not exceeded.
Therefore, it concludes that the subgrade modulus has a minor effect on AC bottom up cracking.

83
40. AC thermal fracture vs subgrade modulus
AC thermal fracture vs # Subgrade Modulus
0.0
0.2
0.4
0.6
0.8
1.0
1.2
5000 6000 7000 8000 9000 10000 11000 12000 13000
Subgrade Modulus (psi)
AC
ther
mal
Fra
ctur
e (ft
/mi)
Design Life = 20 yrsAADTT = 1500AC Layer Thickness = 3 inBase Layer Thickness = 6 inBase Layer Modulus = 40,000 psiSubbase Layer Thickness = 9 inSubbase Layer Modulus = 28,000 psi
Figure 41: AC thermal fracture vs Subgrade modulus
The plot of AC thermal fracture versus subgrade modulus is shown in Figure 41. From
the figure it can be seen that AC thermal fracture is independent of the subgrade modulus.

84
41. Permanent Deformation (AC only) vs Subgrade modulus
Permanent Deformation (AC only) vs Subgrade Modulus
0.00
0.05
0.10
0.15
0.20
0.25
0.30
0.35
0.40
5000 6000 7000 8000 9000 10000 11000 12000 13000
Subgrade Modulus (psi)
Perm
anen
t Def
orm
atio
n (A
C o
nly)
(in)
Design Life = 20 yrsAADTT = 1500AC Layer Thickness = 3 inBase Layer Thickness = 6 inBase Layer Modulus = 40,000 psiSubbase Layer Thickness = 9 inSubbase Layer Modulus = 28,000 psi
Figure 42: Permanent deformation (AC only) vs Subgrade modulus
The plot of permanent deformation (AC only) versus subgrade modulus is shown in
Figure 42. The plot shows that there is no change in the permanent deformation of the AC layer
with the increase in the subgrade modulus. Thus the Permanent deformation in AC layer is
independent of the subgrade modulus.

85
42. Permanent Deformation (Total Pavement) vs Subgrade modulus
Permanent Deformation (Total Pavement) vs Subgrade Modulus
0.0
0.1
0.2
0.3
0.4
0.5
0.6
0.7
0.8
0.9
1.0
5000 6000 7000 8000 9000 10000 11000 12000 13000
Subgrade Modulus (psi)
Perm
anen
t Def
orm
atio
n (T
otal
Pav
emen
t) (i
n)
Design Life = 20 yrsAADTT = 1500AC Layer Thickness = 3 inBase Layer Thickness = 6 inBase Layer Modulus = 40,000 psiSubbase Layer Thickness = 9 inSubbase Layer Modulus = 28,000 psi
Figure 43: Permanent deformation vs Subgrade modulus
The plot of permanent deformation (Total Pavement) versus subgrade modulus is shown
in Figure 43. The plot shows that the permanent deformation in the total pavement decreases
with the increase in the subgrade modulus. Thus a stiffer subgrade will result in reduced rut
depths in the total pavement structure at the end of the design life. For the given pavement
system, the maximum allowable limit set for permanent deformation of the total pavement is
0.75 inches. From the plot it can noted that the permanent deformation of the total pavement is
less than the maximum allowable limit for subgrade modulus of 8500 psi or greater. Therefore,
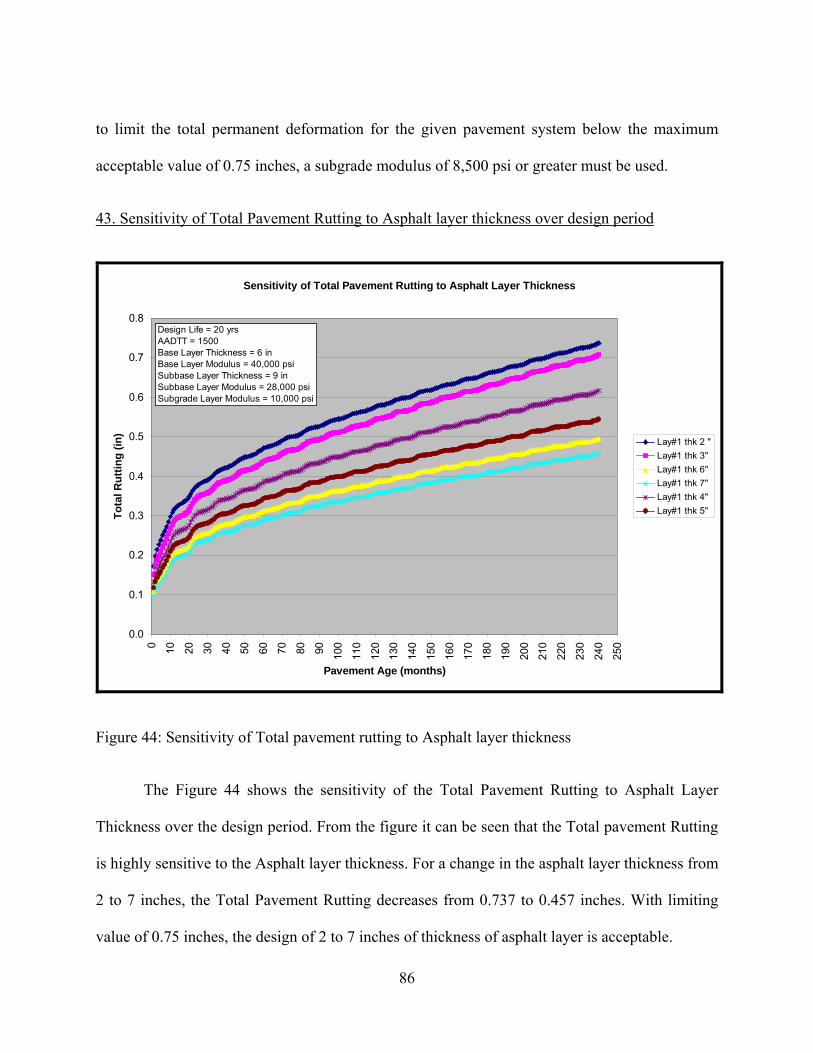
86
to limit the total permanent deformation for the given pavement system below the maximum
acceptable value of 0.75 inches, a subgrade modulus of 8,500 psi or greater must be used.
43. Sensitivity of Total Pavement Rutting to Asphalt layer thickness over design period
Sensitivity of Total Pavement Rutting to Asphalt Layer Thickness
0.0
0.1
0.2
0.3
0.4
0.5
0.6
0.7
0.8
0 10 20 30 40 50 60 70 80 90 100
110
120
130
140
150
160
170
180
190
200
210
220
230
240
250
Pavement Age (months)
Tota
l Rut
ting
(in)
Lay#1 thk 2 "Lay#1 thk 3"Lay#1 thk 6"Lay#1 thk 7"Lay#1 thk 4"Lay#1 thk 5"
Design Life = 20 yrsAADTT = 1500Base Layer Thickness = 6 inBase Layer Modulus = 40,000 psiSubbase Layer Thickness = 9 inSubbase Layer Modulus = 28,000 psi Subgrade Layer Modulus = 10,000 psi
Figure 44: Sensitivity of Total pavement rutting to Asphalt layer thickness
The Figure 44 shows the sensitivity of the Total Pavement Rutting to Asphalt Layer
Thickness over the design period. From the figure it can be seen that the Total pavement Rutting
is highly sensitive to the Asphalt layer thickness. For a change in the asphalt layer thickness from
2 to 7 inches, the Total Pavement Rutting decreases from 0.737 to 0.457 inches. With limiting
value of 0.75 inches, the design of 2 to 7 inches of thickness of asphalt layer is acceptable.

87
44. Sensitivity of Total Pavement Rutting with Base (Layer # 2) Thickness over design period
Sensitivity of Total Pavement Rutting with Base Thickness
0.0
0.1
0.2
0.3
0.4
0.5
0.6
0.7
0.8
0 10 20 30 40 50 60 70 80 90 100
110
120
130
140
150
160
170
180
190
200
210
220
230
240
250
Pavement Age (mon)
Tota
l Rut
ting
(in) Lay#2 Thk 5"
Lay#2 Thk 6"Lay#2 Thk 7"Lay#2 Thk 8"Lay#2 Thk 9"Lay#2 Thk 10"
Design Life = 20 yrsAADTT = 1500AC Layer Thickness = 3 inBase Layer Modulus = 40,000 psiSubbase Layer Thickness = 9 inSubbase Layer Modulus = 28,000 psi Subgrade Layer Modulus = 10,000 psi
Figure 45: Sensitivity of Total Pavement Rutting with Base thickness
The Figure 45 shows the sensitivity of the Total Pavement Rutting to Base layer
thickness over the design period. From the figure it can be seen that the total pavement layer
rutting is not too sensitive to the base layer thickness. For a change in the base layer thickness
from 5 to 10 inches the Total Pavement Rutting changes from 0.72 to 0.691 inches. With limiting
value of 0.75 inches the design of 5 to 10 inches of thickness of base layer thickness is
acceptable.

88
45. Sensitivity of the total pavement rutting with the Subbase thickness over design period
Sensitivity of Total Pavement Rutting with Subbase Thickness
0.0
0.1
0.2
0.3
0.4
0.5
0.6
0.7
0.8
0 10 20 30 40 50 60 70 80 90 100
110
120
130
140
150
160
170
180
190
200
210
220
230
240
250
Pavement Age (mon)
Tota
l Rut
ting
(in)
Lay#3 Thk 7"Lay#3 Thk 8"Lay#3 Thk 9"Lay#3 Thk 10"Lay#3 Thk 11"Lay#3 Thk 12"
Design Life = 20 yrsAADTT = 1500AC Layer Thickness = 3 inBase Layer Thickness = 6 inBase Layer Modulus = 40,000 psiSubbase Layer Modulus = 28,000 psi Subgrade Layer Modulus = 10,000 psi
Figure 46: Sensitivity of total pavement rutting with the subbase thickness
The Figure 46 shows the sensitivity of the Total Pavement Rutting to subbase layer
thickness over the design period. From the figure it can be seen that the total pavement layer
rutting is not too sensitive to the subbase layer thickness. For a change in the subbase layer
thickness from 7 to 12 inches the Total Pavement Rutting changes from 0.723 to 0.695 inches.
With the limiting value of 0.75 5inches, the design of 7 to 12 inches of thickness of subbase layer
is acceptable.
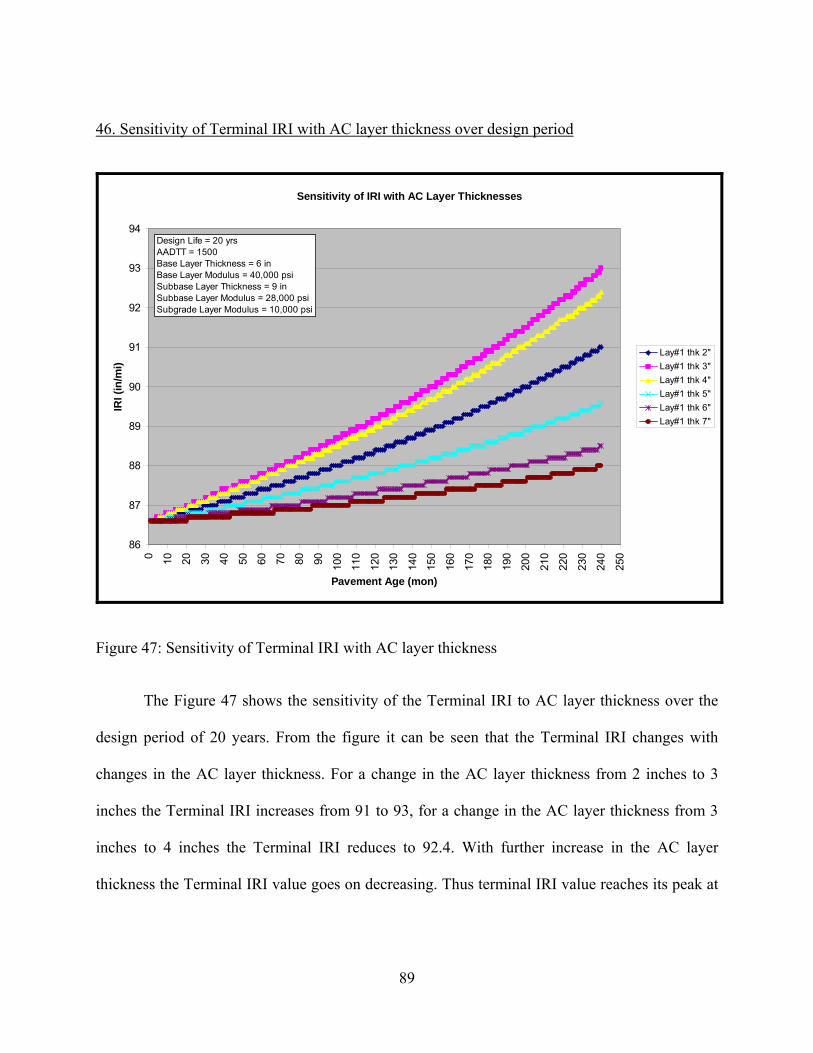
89
46. Sensitivity of Terminal IRI with AC layer thickness over design period
Sensitivity of IRI with AC Layer Thicknesses
86
87
88
89
90
91
92
93
94
0 10 20 30 40 50 60 70 80 90 100
110
120
130
140
150
160
170
180
190
200
210
220
230
240
250
Pavement Age (mon)
IRI (
in/m
i)
Lay#1 thk 2"Lay#1 thk 3"Lay#1 thk 4"Lay#1 thk 5"Lay#1 thk 6"Lay#1 thk 7"
Design Life = 20 yrsAADTT = 1500Base Layer Thickness = 6 inBase Layer Modulus = 40,000 psiSubbase Layer Thickness = 9 inSubbase Layer Modulus = 28,000 psi Subgrade Layer Modulus = 10,000 psi
Figure 47: Sensitivity of Terminal IRI with AC layer thickness
The Figure 47 shows the sensitivity of the Terminal IRI to AC layer thickness over the
design period of 20 years. From the figure it can be seen that the Terminal IRI changes with
changes in the AC layer thickness. For a change in the AC layer thickness from 2 inches to 3
inches the Terminal IRI increases from 91 to 93, for a change in the AC layer thickness from 3
inches to 4 inches the Terminal IRI reduces to 92.4. With further increase in the AC layer
thickness the Terminal IRI value goes on decreasing. Thus terminal IRI value reaches its peak at

90
3 inches of Asphalt concrete layer. With a limiting value of terminal IRI of 200 in/mile, the
design of 2 to 7 inches of AC layer thickness is acceptable.
47. Sensitivity of Surface Down (Long.) cracking with Asphalt Layer thickness
Sensitivity of Surface Down (Long. ) cracking with Asphalt thickness
0
50
100
150
200
250
300
350
400
450
0 10 20 30 40 50 60 70 80 90 100
110
120
130
140
150
160
170
180
190
200
210
220
230
240
250
Pavement Age (mon)
Surf
ace
Dow
n C
rack
ing
(ft/m
ile)
Lay#1 thk 2"Lay#1 thk 3"Lay#1 thk 4"Lay#1 thk 5"Lay#1 thk 6"Lay#1 thk 7"
Design Life = 20 yrsAADTT = 1500Base Layer Thickness = 6 inBase Layer Modulus = 40,000 psiSubbase Layer Thickness = 9 inSubbase Layer Modulus = 28,000 psi Subgrade Layer Modulus = 10,000 psi
Figure 48: Sensitivity of Surface down cracking with Asphalt layer thickness
The Figure 48 shows the sensitivity of the surface down longitudinal cracking to AC
layer thickness over the design period of 20 years. From the figure it can be seen that the AC
surface down cracking is highly sensitive to the AC layer thickness. The maximum surface down
cracking of 409 ft/mile occurs for an AC layer thickness of 6 inches at the end of design life of
20 years whereas the minimum surface down cracking of 0.40 ft/mile occurs for an asphalt layer
thickness of 3inches.

91
48. Sensitivity of Bottom up (Alligator) cracking with Asphalt (Layer # 1) thickness over design period
Sensitivity of Bottom up Cracking with AC layer Thickness
0
2
4
6
8
10
12
14
0 50 100 150 200 250 300
Pavement Age (mon)
Bot
tom
up
crac
king
(%)
Lay#1 thk 2"Lay#1 thk 3"Lay#1 thk 4"Lay#1 thk 5"Lay#1 thk 6"Lay#1 thk 7"
Design Life = 20 yrsAADTT = 1500Base Layer Thickness = 6 inBase Layer Modulus = 40,000 psiSubbase Layer Thickness = 9 inSubbase Layer Modulus = 28,000 psi Subgrade Layer Modulus = 10,000 psi
Figure 49: Sensitivity of Bottom up cracking vs Asphalt thickness
The Figure 49 shows the sensitivity of the bottom up alligator cracking to AC layer
thickness over the design period. From the figure it can be seen that the Bottom up cracking is
highly sensitive to the AC layer thickness. With changes in the AC layer thickness the AC
Bottom up Cracking reaches it peak value of 12.4% at an Asphalt layer thickness of 4 inches and
is at its minimum of 1.4% at an Asphalt layer thickness of 7 inches.

92
49. Sensitivity of AC rutting with AC (layer # 1) thickness over design period
Sensitivity of AC ruttting with AC layer thickness
0.00
0.10
0.20
0.30
0.40
0 50 100 150 200 250 300
Pavement Age (mon)
AC
rutti
ng (i
n) Lay#1 thk 2"Lay#1 thk 3"Lay#1 thk 4"Lay#1 thk 5"Lay#1 thk 6"Lay#1 thk 7"
Design Life = 20 yrsAADTT = 1500Base Layer Thickness = 6 inBase Layer Modulus = 40,000 psiSubbase Layer Thickness = 9 inSubbase Layer Modulus = 28,000 psi Subgrade Layer Modulus = 10,000 psi
Figure 50: Sensitivity of AC layer rutting with AC layer thickness
The Figure 50 shows the sensitivity of the AC rutting to AC layer thickness over the
design period. From the figure it can be seen that the AC rutting is highly sensitive to the AC
layer thickness. With the change in AC layer thickness from 2 to 7 inches the AC layer rutting
reaches its maximum value of 0.37 inch at AC layer thickness of 3 inches and its minimum value
of 0.23 inch at a thickness of 7 inches.

93
50. Sensitivity of Terminal IRI with base layer thickness over design period
Sensitivity of IRI with layer # 2 thickness
86
87
88
89
90
91
92
93
94
95
0 50 100 150 200 250 300
Pavement Age (mon)
Term
inal
IRI (
in/m
i)
Lay#2 thk 5"Lay#2 thk 6"Lay#2 thk 7"Lay#2 thk 8"Lay#2 thk 9"Lay#2 thk 10"
Design Life = 20 yrsAADTT = 1500AC Layer Thickness = 3 inBase Layer Modulus = 40,000 psiSubbase Layer Thickness = 9 inSubbase Layer Modulus = 28,000 psi Subgrade Layer Modulus = 10,000 psi
Figure 51: Sensitivity of Terminal IRI with base layer thickness
The Figure 51 shows the sensitivity of Terminal IRI with base layer thickness over the
design period. From the figure it can be seen that the base layer thickness has a minor effect on
the terminal IRI or the smoothness of the road. Also it can be found that greater the base layer
thickness lesser the Terminal IRI which means more smooth pavements.

94
51. Sensitivity of Bottom Up Cracking with base layer thickness over design period
Sensitivity of Bottom up Cracking with Lay#2 thickness
0
2
4
6
8
10
12
14
16
0 50 100 150 200 250 300
Pavement Age (mon)
Bot
tom
up
Cra
ckin
g (%
)
Lay#2 thk 5"Lay#2 thk 6"Lay#2 thk 7"Lay#2 thk 8"Lay#2 thk 9"Lay#2 thk 10"
Design Life = 20 yrsAADTT = 1500AC Layer Thickness = 3 inBase Layer Modulus = 40,000 psiSubbase Layer Thickness = 9 inSubbase Layer Modulus = 28,000 psi Subgrade Layer Modulus = 10,000 psi
Figure 52: Sensitivity of Bottom up cracking with base layer thickness
The Figure 52 shows the sensitivity of bottom up cracking with the base layer thickness
over the design period. It can be seen that Bottom up cracking in AC layer is moderately
sensitive to the base layer thickness. Also it can be seen that higher thickness does not ensure
reduced bottom up cracking. From the figure we can see that, at the end of the design life for a
base layer thickness of 7 inches the bottom up cracking is 12.0% whereas for 6 inches it is
11.5%. Similarly for a base layer thickness of 9 inches the bottom up cracking is 10.6% whereas
for 8 inches it is 10.1%.

95
52. Sensitivity of AC rut with base layer thickness over design period
Sensitivity of AC Rut with Lay # 2 thickness
0.00
0.05
0.10
0.15
0.20
0.25
0.30
0.35
0.40
0 50 100 150 200 250 300
Pavement Age (mon)
AC
rut (
in)
Lay#2 thk 5"Lay#2 thk 6"Lay#2 thk 7"Lay#2 thk 8"Lay#2 thk 9"Lay#2 thk 10"
Design Life = 20 yrsAADTT = 1500AC Layer Thickness = 3 inBase Layer Modulus = 40,000 psiSubbase Layer Thickness = 9 inSubbase Layer Modulus = 28,000 psi Subgrade Layer Modulus = 10,000 psi
Figure 53: Sensitivity of AC rut with base layer thickness
The Figure 53 shows the sensitivity of the AC layer rut with the base layer thickness. It
can be seen that the change in the base layer thickness has negligible influence on the AC layer
rut. For different base layer thickness the AC rut depth is almost constant over the design life of
the pavement.
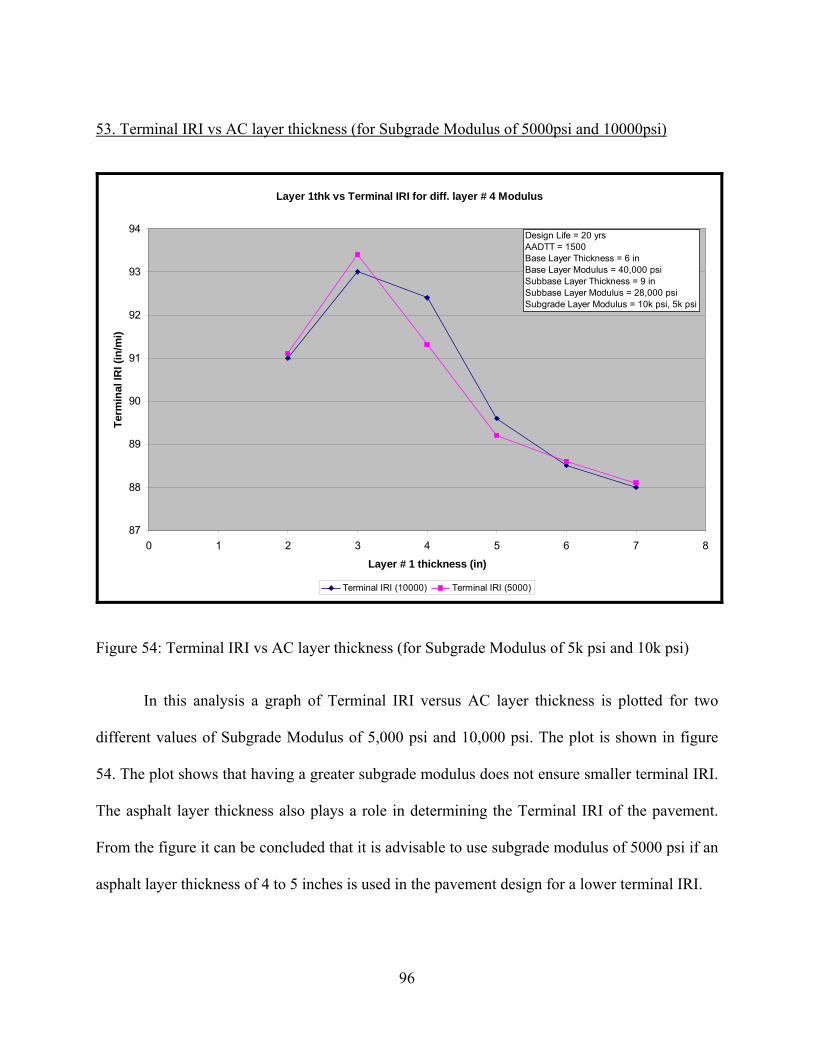
96
53. Terminal IRI vs AC layer thickness (for Subgrade Modulus of 5000psi and 10000psi)
Layer 1thk vs Terminal IRI for diff. layer # 4 Modulus
87
88
89
90
91
92
93
94
0 1 2 3 4 5 6 7 8
Layer # 1 thickness (in)
Term
inal
IRI (
in/m
i)
Terminal IRI (10000) Terminal IRI (5000)
Design Life = 20 yrsAADTT = 1500Base Layer Thickness = 6 inBase Layer Modulus = 40,000 psiSubbase Layer Thickness = 9 inSubbase Layer Modulus = 28,000 psi Subgrade Layer Modulus = 10k psi, 5k psi
Figure 54: Terminal IRI vs AC layer thickness (for Subgrade Modulus of 5k psi and 10k psi)
In this analysis a graph of Terminal IRI versus AC layer thickness is plotted for two
different values of Subgrade Modulus of 5,000 psi and 10,000 psi. The plot is shown in figure
54. The plot shows that having a greater subgrade modulus does not ensure smaller terminal IRI.
The asphalt layer thickness also plays a role in determining the Terminal IRI of the pavement.
From the figure it can be concluded that it is advisable to use subgrade modulus of 5000 psi if an
asphalt layer thickness of 4 to 5 inches is used in the pavement design for a lower terminal IRI.

97
54. AC surface down cracking vs AC layer thickness (for subgrade modulus of 5000 psi and 10000 psi)
Layer # 1 thickness vs AC surface down crack for diff Lay #4 Modulus
0
50
100
150
200
250
300
350
400
450
0 1 2 3 4 5 6 7 8
Layer # 1 thk (in)
AC
sur
face
dow
n cr
acki
ng (f
t/mi)
AC surface down crack (10000) AC surface down crack (5000)
Design Life = 20 yrsAADTT = 1500Base Layer Thickness = 6 inBase Layer Modulus = 40,000 psiSubbase Layer Thickness = 9 inSubbase Layer Modulus = 28,000 psi Subgrade Layer Modulus = 10k psi, 5k psi
Figure 55: AC surface down cracking vs AC layer thickness (for subgrade modulus of 5k and
10k psi)
The plot is shown in the Figure 55. The plot shows that higher value of subgrade modulus
results in increased AC surface down cracking. Therefore it is better to use a subgrade modulus
of 5000 psi for the design to control AC surface down cracking especially if the AC layer
thickness used for the pavement design is between 4 to 7 inches.

98
55. AC bottom up cracking vs AC Layer thickness (for subgrade modulus of 5000psi and
10000psi)
AC bot. up crack. vs Layer # 1 thickness for diff. Layer #4 Modulus
0
2
4
6
8
10
12
14
0 1 2 3 4 5 6 7 8
Layer # 1 thk (in)
AC
bot
tom
up
crac
king
(%)
AC bottom up crack. (10000) AC bottom up crack. (5000)
Design Life = 20 yrsAADTT = 1500Base Layer Thickness = 6 inBase Layer Modulus = 40,000 psiSubbase Layer Thickness = 9 inSubbase Layer Modulus = 28,000 psi Subgrade Layer Modulus = 10k psi, 5k psi
Figure 56: AC bottom up cracking vs AC layer thickness (for subgrade modulus of 5k and 10k
psi)
The plot is shown in Figure 56. The plot shows that greater subgrade modulus does not
necessarily result in smaller AC bottom up cracking. The asphalt layer thickness also has a role
to play. From the figure it can be seen that if an asphalt layer thickness of 4 to 5 inches is used in
the pavement design it is better to have a subgrade modulus of 5,000 psi as against 10,000 psi to
have lower AC bottom up cracking.

99
56. Perm. Deformation (AC only) vs AC layer thickness (for subgrade modulus of 5000psi and
10000psi)
Perm defm. AC vs Layer 1 thk for diff layer #4 Modulus
0.00
0.05
0.10
0.15
0.20
0.25
0.30
0.35
0.40
0 1 2 3 4 5 6 7 8
Layer #1 thickness (in)
Perm
Def
m A
C (i
n)
Perm. Defm AC (10000) Perm. Defm. (5000)
Design Life = 20 yrsAADTT = 1500Base Layer Thickness = 6 inBase Layer Modulus = 40,000 psiSubbase Layer Thickness = 9 inSubbase Layer Modulus = 28,000 psi Subgrade Layer Modulus = 10k psi, 5k psi
Figure 57: Permanent deformation (AC only) vs AC layer thickness (for subgrade modulus of 5k
and 10k psi)
The plot is shown in Figure 57. The plot shows that greater subgrade modulus does not
necessarily result in smaller Permanent Deformation in AC layer. The asphalt layer thickness
also plays a role in controlling the permanent deformation of the AC layer. From the figure it can
be seen that the subgrade modulus of 5,000 psi results in smaller permanent deformation in AC
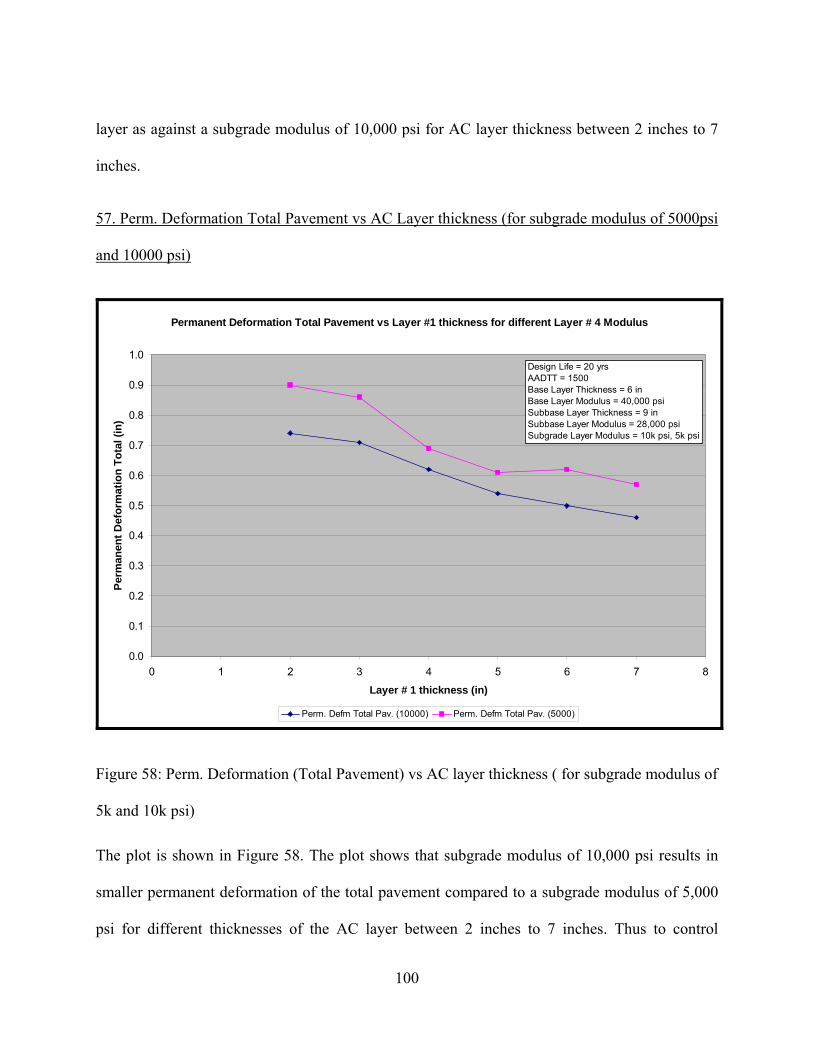
100
layer as against a subgrade modulus of 10,000 psi for AC layer thickness between 2 inches to 7
inches.
57. Perm. Deformation Total Pavement vs AC Layer thickness (for subgrade modulus of 5000psi
and 10000 psi)
Permanent Deformation Total Pavement vs Layer #1 thickness for different Layer # 4 Modulus
0.0
0.1
0.2
0.3
0.4
0.5
0.6
0.7
0.8
0.9
1.0
0 1 2 3 4 5 6 7 8
Layer # 1 thickness (in)
Perm
anen
t Def
orm
atio
n To
tal (
in)
Perm. Defm Total Pav. (10000) Perm. Defm Total Pav. (5000)
Design Life = 20 yrsAADTT = 1500Base Layer Thickness = 6 inBase Layer Modulus = 40,000 psiSubbase Layer Thickness = 9 inSubbase Layer Modulus = 28,000 psi Subgrade Layer Modulus = 10k psi, 5k psi
Figure 58: Perm. Deformation (Total Pavement) vs AC layer thickness ( for subgrade modulus of
5k and 10k psi)
The plot is shown in Figure 58. The plot shows that subgrade modulus of 10,000 psi results in
smaller permanent deformation of the total pavement compared to a subgrade modulus of 5,000
psi for different thicknesses of the AC layer between 2 inches to 7 inches. Thus to control

101
permanent deformation in the total pavement structure it is advisable to use a greater sub-grade
modulus
4.2 Rigid Pavement Sensitivity Analysis
The sensitivity analysis of the rigid pavements is discussed in the following sections.
4.2.1 Jointed Plain Concrete Pavement (JPCP)
To conduct sensitivity analyses on the JPCP pavement the following sample problem was
executed with the design inputs as listed below.
Analysis Parameters
The jointed plain concrete pavement will have a design life of 25 years and initial IRI of
63 in/mile. It is expected that at the end of the design life the pavement will have a terminal IRI
of no more than 200 in/mile at 95 % reliability, transverse cracking of no more than 15% at 90%
reliability and Mean Joint Faulting of no more than 0.15 in at 90% reliability.
Traffic Data
The two-way average annual truck traffic on this pavement is estimated to be 2500 trucks
during the first year of its service. The pavement will be open to traffic in November. There will
be two lanes in the design direction with 90% of the trucks in the design lane. Truck traffic is
equally distributed in both directions and the operational speed is 60 mph. The functional class of
the highway is Interstate. For each class of the vehicle the traffic pattern for monthly and daily
basis remains same throughout the year. The traffic variation over a 24 hour period is assumed to
be same as the national default based on LTPP data. After the initial year the traffic increases at
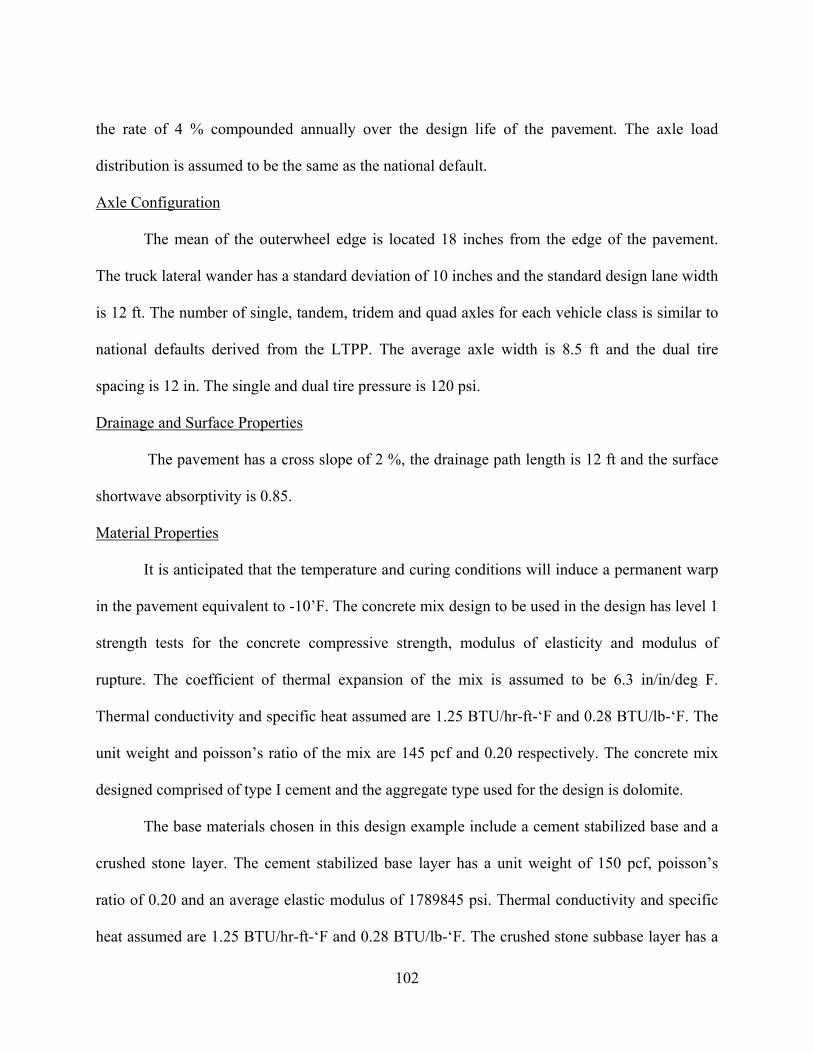
102
the rate of 4 % compounded annually over the design life of the pavement. The axle load
distribution is assumed to be the same as the national default.
Axle Configuration
The mean of the outerwheel edge is located 18 inches from the edge of the pavement.
The truck lateral wander has a standard deviation of 10 inches and the standard design lane width
is 12 ft. The number of single, tandem, tridem and quad axles for each vehicle class is similar to
national defaults derived from the LTPP. The average axle width is 8.5 ft and the dual tire
spacing is 12 in. The single and dual tire pressure is 120 psi.
Drainage and Surface Properties
The pavement has a cross slope of 2 %, the drainage path length is 12 ft and the surface
shortwave absorptivity is 0.85.
Material Properties
It is anticipated that the temperature and curing conditions will induce a permanent warp
in the pavement equivalent to -10’F. The concrete mix design to be used in the design has level 1
strength tests for the concrete compressive strength, modulus of elasticity and modulus of
rupture. The coefficient of thermal expansion of the mix is assumed to be 6.3 in/in/deg F.
Thermal conductivity and specific heat assumed are 1.25 BTU/hr-ft-‘F and 0.28 BTU/lb-‘F. The
unit weight and poisson’s ratio of the mix are 145 pcf and 0.20 respectively. The concrete mix
designed comprised of type I cement and the aggregate type used for the design is dolomite.
The base materials chosen in this design example include a cement stabilized base and a
crushed stone layer. The cement stabilized base layer has a unit weight of 150 pcf, poisson’s
ratio of 0.20 and an average elastic modulus of 1789845 psi. Thermal conductivity and specific
heat assumed are 1.25 BTU/hr-ft-‘F and 0.28 BTU/lb-‘F. The crushed stone subbase layer has a

103
modulus of 40,000 psi and a PI of 1. 10% of this material passes through #200 sieve and 80%
passes through #4 sieve. The D60 of the crushed stone material is 2mm.The subgrade has a
modulus of 18,000 psi and a plasticity index of the soil is 25.
The initial trial thickness used for the different layers is:
Slab Thickness: 8 in
Cement Stabilized Base Layer thickness: 4 in
Crushed Stone Subbase Layer thickness: 6 in
The following table gives a list of the important parameters used in the sensitivity
analysis.
Table 4: List of parameters used for sensitivity analyses of JPCP pavement
Input Parameters Value For Sensitivity Analyses
1 Design Life 25 yrs Constant
2 Two-way AADTT 2500 1500 – 3500
3 Initial IRI 63 in/mile Constant
4 Max. Acceptable Terminal IRI 200 in/mile Constant
5 Max. Acceptable Transverse Cracking 15% Constant
6 Max. Acceptable Mean Joint Faulting 0.15 in Constant
7 Slab Thickness 8 in 6 – 12 in
8 Joint Spacing 15 in 10 – 20 in
9 Dowel Bar Diameter 1.5 in 1.0 – 1.5 in
10 Dowel Bar Spacing 12 in 10 – 14 in
11 Base Layer 4 in 4 – 8 in

104
12 Subbase Layer thickness 6 in 4 – 10 in
13 Subgrade Modulus 18,000 psi 8,000 – 24,000 psi
14 Base Modulus 1789845 psi 1250000 – 3000000 psi
To conduct a sensitivity analyses, the effects on the pavement distresses were obtained
with changing the values of one parameter while keeping all other parameters constant. The key
pavement distresses for a JPCP pavement are the Terminal IRI, Transverse Cracking and the
Mean Joint Faulting.
The following is a brief summary of the sensitivity analyses done.

105
1. Terminal IRI vs AADTT
Sensitivity of Terminal IRI with AADTT
70
72
74
76
78
80
82
1500 2000 2500 3000 3500
AADTT
Term
inal
IRI (
in/m
ile)
Figure 59: Sensitivity of Terminal IRI with AADTT
The plot of Terminal IRI versus AADTT varying from 1,500 to 3,500, for JPCP is shown
in Figure 59. From the figure it can be seen that terminal IRI increases with the increase in
AADTT. Thus, heavy truck loads result in decreased smoothness of the pavement. An increase
in AADTT from 1,500 to 3,500 resulted in an increase in the Terminal IRI from 71.2 to 80.5
in/mile. The initial IRI for a newly constructed pavement is about 75 in/mile and the maximum
acceptable terminal IRI is 200 in/mile. The plot shows that even for a heavy load of AADTT of
3500, the maximum limit of Terminal IRI is not yet reached. Therefore, AADTT has minor
effect on the Terminal International Roughness Index.
Design Life = 25 years Slab thickness = 8 in Base Layer thickness = 4in Subbase layer thickness = 6 in Slab Modulus = 4,954,161 psi Base Layer Modulus = 1,789,845 psi Subbase Layer Modulus = 40,000 psi Subgrade Modulus = 18,000 psi

106
2. Transverse Cracking vs AADTT
Sensitivity of Transverse Cracking with AADTT
0
0.2
0.4
0.6
0.8
1
1.2
1.4
1500 2000 2500 3000 3500
AADTT
Tran
sver
se C
rack
ing
(%sl
abs
crac
ked)
Figure 60: Sensitivity of Transverse Cracking with AADTT
The plot of Transverse Cracking versus AADTT is shown in the Figure 60. From the
figure it can be seen that the Transverse Cracking in the slab increases with the increase in
AADTT. Thus, increase in the number of heavy truck load passes through the pavement results
in increase of transverse cracking of the pavement. An increase in the AADTT from 1500 to
3500 resulted in the increase of Transverse Cracking of the slab from 0.3 to 1.3%. The maximum
allowable limit for transverse cracking in this example is 15% and any value over 15% percent at
the end of the design life is not acceptable. It can be noted that, even with a heavy load of
AADTT of 3,500 the maximum acceptable value of Transverse cracking is not reached.
Design Life = 25 years Slab thickness = 8 in Base Layer thickness = 4in Subbase layer thickness = 6 in Slab Modulus = 4,954,161 psi Base Layer Modulus = 1,789,845 psi Subbase Layer Modulus = 40,000 psi Subgrade Modulus = 18,000 psi

107
3. Mean Joint Faulting vs AADTT
Sensitivity of Mean Joint Faulting with AADTT
0
0.005
0.01
0.015
0.02
0.025
0.03
0.035
1500 2000 2500 3000 3500
AADTT
Mea
n Jo
int F
aulti
ng (i
n)
Figure 61: Sensitivity of Mean Joint Faulting with AADTT
The plot of Mean Joint Faulting versus AADTT is shown in the Figure 61. From the
figure it can be seen that the Joint Faulting in the slab increases with the increase in AADTT as
expected. A change in the AADTT from 1500 to 3500 results in the linear increase in the Mean
Joint Faulting from 0.015 to 0.031. The maximum acceptable limit for Mean Joint Faulting
acceptable for this example is 0.15 in. It is interesting to note that, even with a heavy load of
3500 AADTT the maximum limit for Mean Joint Faulting set for the example is not reached.
Design Life = 25 years Slab thickness = 8 in Base Layer thickness = 4in Subbase layer thickness = 6 in Slab Modulus = 4,954,161 psi Base Layer Modulus = 1,789,845 psi Subbase Layer Modulus = 40,000 psi Subgrade Modulus = 18,000 psi

108
4. Terminal IRI vs Slab Thickness
Sensitivity of Terminal IRI with Slab Thickness
0
20
40
60
80
100
120
140
160
6 7 8 9 10 11 12
Slab Thickness (in)
Term
inal
IRI (
in/m
ile)
Figure 62: Sensitivity of Terminal IRI with Slab thickness
The plot of Terminal IRI versus Slab Thickness is shown in Figure 62. From the figure it
can be seen that the Terminal IRI decreases with the increase in the Slab Thickness. There is
steep drop in the Terminal IRI value as the slab thickness increases from 6 to 7 inches. However
there is gradual decrease in Terminal IRI as the slab thickness increases beyond 7 inches. Using
a slab thickness of 6-inch results in a terminal IRI of 147.8 in/mile whereas, a slab thickness of
7-inch results in a terminal IRI value of 84.4 in/mile. Thus, the slab thickness has a major effect
on the smoothness of the pavement and for the given example a slab thickness of seven or
greater should be used to control Terminal IRI.
Design Life = 25 years AADTT = 2500 Base Layer thickness = 4in Subbase layer thickness = 6 in Slab Modulus = 4,954,161 psi Base Layer Modulus = 1,789,845 psi Subbase Layer Modulus = 40,000 psi Subgrade Modulus = 18,000 psi
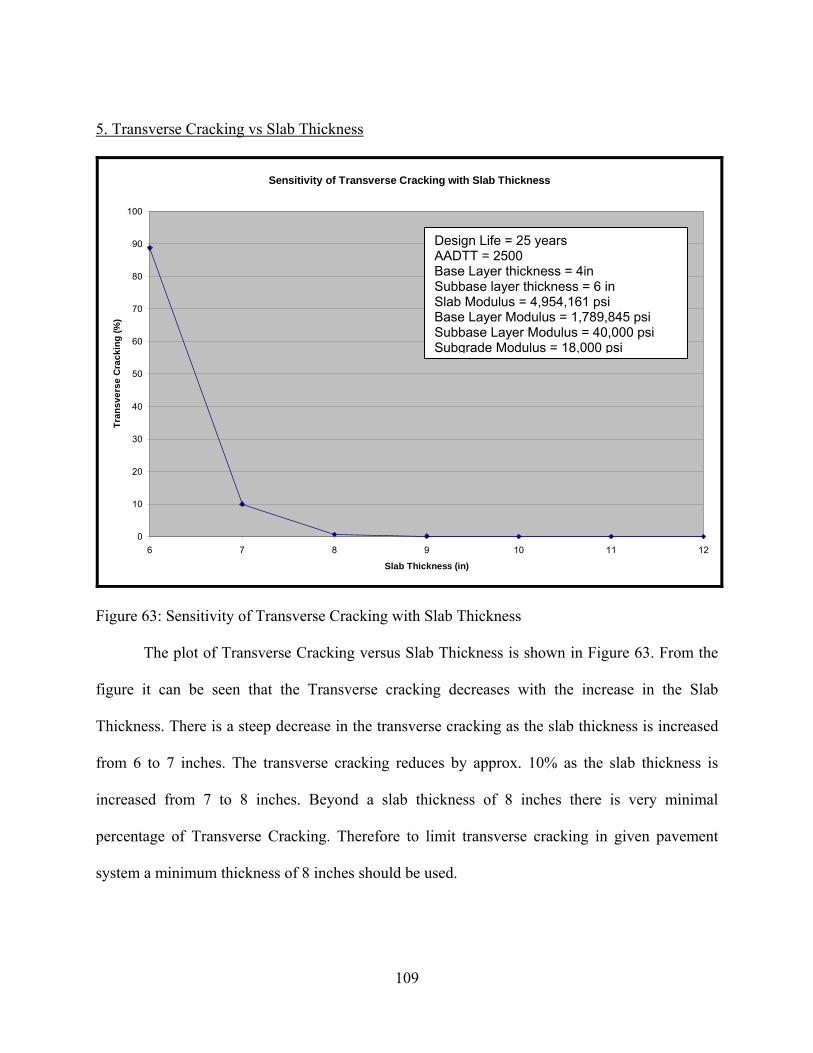
109
5. Transverse Cracking vs Slab Thickness
Sensitivity of Transverse Cracking with Slab Thickness
0
10
20
30
40
50
60
70
80
90
100
6 7 8 9 10 11 12
Slab Thickness (in)
Tran
sver
se C
rack
ing
(%)
Figure 63: Sensitivity of Transverse Cracking with Slab Thickness
The plot of Transverse Cracking versus Slab Thickness is shown in Figure 63. From the
figure it can be seen that the Transverse cracking decreases with the increase in the Slab
Thickness. There is a steep decrease in the transverse cracking as the slab thickness is increased
from 6 to 7 inches. The transverse cracking reduces by approx. 10% as the slab thickness is
increased from 7 to 8 inches. Beyond a slab thickness of 8 inches there is very minimal
percentage of Transverse Cracking. Therefore to limit transverse cracking in given pavement
system a minimum thickness of 8 inches should be used.
Design Life = 25 years AADTT = 2500 Base Layer thickness = 4in Subbase layer thickness = 6 in Slab Modulus = 4,954,161 psi Base Layer Modulus = 1,789,845 psi Subbase Layer Modulus = 40,000 psi Subgrade Modulus = 18,000 psi

110
6. Mean Joint Faulting vs Slab Thickness
Sensitivity of Mean Joint Faulting with Slab Thickness
0
0.005
0.01
0.015
0.02
0.025
0.03
6 7 8 9 10 11 12
Slab thickness (in)
Mea
n Jo
int F
aulti
ng (i
n)
Figure 64: Sensitivity of Mean Joint Faulting with Slab Thickness
The plot of Mean Joint Faulting versus Slab Thickness is shown in Figure 64. From the
figure it can be seen that the Mean Joint Faulting decreases as the Slab thickness is increased
from 7 to 12 inches. However, it is interesting to note that the Mean Joint Faulting increases as
the slab thickness is increased from 6 to 7 inches. Though the change is minimal about 0.005
inches, it is not realistic. Conceptually, as the slab thickness is increased one would expect the
Mean Joint Faulting to decrease.
Design Life = 25 years AADTT = 2500 Base Layer thickness = 4in Subbase layer thickness = 6 in Slab Modulus = 4,954,161 psi Base Layer Modulus = 1,789,845 psi Subbase Layer Modulus = 40,000 psi Subgrade Modulus = 18,000 psi

111
7. Terminal IRI vs Joint Spacing
Sensitivity of Terminal IRI with Joint Spacing
0
20
40
60
80
100
120
140
10 11 12 13 14 15 16 17 18 19 20
Joint Spacing (in)
Term
inal
IRI (
in/m
ile)
Figure 65: Sensitivity of Terminal IRI with Joint Spacing
The plot of Terminal IRI with Joint Spacing is shown in Figure 65. The plot shows that
the Terminal IRI decreases as the joint spacing is increased from 10 to 12 inches but it starts to
increase as the joint spacing is increased beyond 12 inches. Even for a high joint spacing of 20
inches the terminal IRI value at the end of the design life is 129.8 in/mile which is less than the
maximum acceptable value of 200 in/mile for failure of the pavement.
Design Life = 25 years AADTT = 2500 Slab Thickness = 8 in Base Layer thickness = 4in Subbase layer thickness = 6 in Slab Modulus = 4,954,161 psi Base Layer Modulus = 1,789,845 psi Subbase Layer Modulus = 40,000 psi Subgrade Modulus = 18,000 psi

112
8. Transverse Cracking vs Joint Spacing
Sensitivity Analysis of Transverse Cracking with Joint Spacing
0
10
20
30
40
50
60
70
10 11 12 13 14 15 16 17 18 19 20
Joint Spacing (in)
Tran
sver
se C
rack
ing
(% s
lab
crac
ked)
Figure 66: Sensitivity of Transverse Cracking with Joint Spacing
The plot of Transverse Cracking versus Joint Spacing is shown in Figure 66. The plot
shows that the Transverse Cracking increases with the increase in the Joint Spacing as expected.
There is no transverse cracking for the joint spacing of 10 in and 12 in. However the Transverse
cracking increases sharply as the joint spacing is increased beyond 12 inches. From the plot it
can be inferred that a joint spacing of 18 or greater cannot be used as it results in transverse
cracking which exceeds the maximum acceptable limit of 15% set for the given pavement
system.
Design Life = 25 years AADTT = 2500 Slab Thickness = 8 in Base Layer thickness = 4in Subbase layer thickness = 6 in Slab Modulus = 4,954,161 psi Base Layer Modulus = 1,789,845 psi Subbase Layer Modulus = 40,000 psi Subgrade Modulus = 18,000 psi

113
9. Mean Joint Faulting vs Joint Spacing
Sensitivity of Mean Joint Faulting with Joint Spacing
0
0.005
0.01
0.015
0.02
0.025
0.03
0.035
0.04
0.045
10 11 12 13 14 15 16 17 18 19 20
Joint Spacing (in)
Mea
n Jo
int F
aulti
ng (i
n)
Figure 67: Sensitivity of Mean Joint Faulting with Joint Spacing
The plot of Mean Joint Faulting versus Joint Spacing is shown in Figure 67. The plot
shows that the Mean Joint Faulting increases with the increase in the Joint Spacing. However it
remains constant as the joint spacing is increased from 10 in to 12 in. Even for a joint spacing as
high as 20 inches the Mean Joint Faulting at the end of design life is only 0.04 inch for the given
pavement system, which is less than the Mean Joint Faulting value of 0.15 inches set for failure.
Design Life = 25 years AADTT = 2500 Slab Thickness = 8 in Base Layer thickness = 4in Subbase layer thickness = 6 in Slab Modulus = 4,954,161 psi Base Layer Modulus = 1,789,845 psi Subbase Layer Modulus = 40,000 psi Subgrade Modulus = 18,000 psi

114
10. Terminal IRI vs Dowel Bar Spacing
Sensitivity of Terminal IRI with Dowel Bar Spacing
0
10
20
30
40
50
60
70
80
10 10.5 11 11.5 12 12.5 13 13.5 14
Dowel Bar Spacing (in)
Term
inal
IRI (
in/m
ile)
Figure 68: Sensitivity of Terminal IRI with Dowel Bar Spacing
The plot of Terminal IRI versus Dowel bar spacing is shown in Figure 68. From the
figure it can be seen that Terminal IRI remains constant with changes in the Dowel Bar Spacing.
The dowel bar spacing affects the concrete bearing stress and also the joint faulting. Terminal
IRI depends upon the development of distresses in the pavement which in turn depend on the
Dowel Bar Spacing. However, since the amount of distresses is low for the given pavement
system, we find no change in the terminal IRI with change in dowel bar spacing.
Design Life = 25 years AADTT = 2500 Slab Thickness = 8 in Base Layer thickness = 4in Subbase layer thickness = 6 in Slab Modulus = 4,954,161 psi Base Layer Modulus = 1,789,845 psi Subbase Layer Modulus = 40,000 psi Subgrade Modulus = 18,000 psi

115
11. Transverse Cracking vs Dowel Bar Spacing
Sensitivity of Transverse Cracking to Dowel Bar Spacing
0
0.1
0.2
0.3
0.4
0.5
0.6
0.7
0.8
10 10.5 11 11.5 12 12.5 13 13.5 14
Dowel Bar Spacing (in)
Tran
sver
se C
rack
ing
(% s
lab
crac
ked)
Figure 69: Sensitivity of Transverse Cracking with Dowel Bar Spacing
The plot of Transverse Cracking versus Dowel Bar Spacing is shown in Figure 69. From
the figure it can be seen that the Transverse cracking remains constant with changes in the Dowel
Bar Spacing. Conceptually, closer dowel bar spacing should decrease concrete bearing stress and
thereby reduce the subsequent transverse cracking in the pavement. The distresses are relatively
low for the given pavement system, therefore transverse cracking is not too sensitive to the
dowel bar spacing.
Design Life = 25 years AADTT = 2500 Slab Thickness = 8 in Base Layer thickness = 4in Subbase layer thickness = 6 in Slab Modulus = 4,954,161 psi Base Layer Modulus = 1,789,845 psi Subbase Layer Modulus = 40,000 psi Subgrade Modulus = 18,000 psi
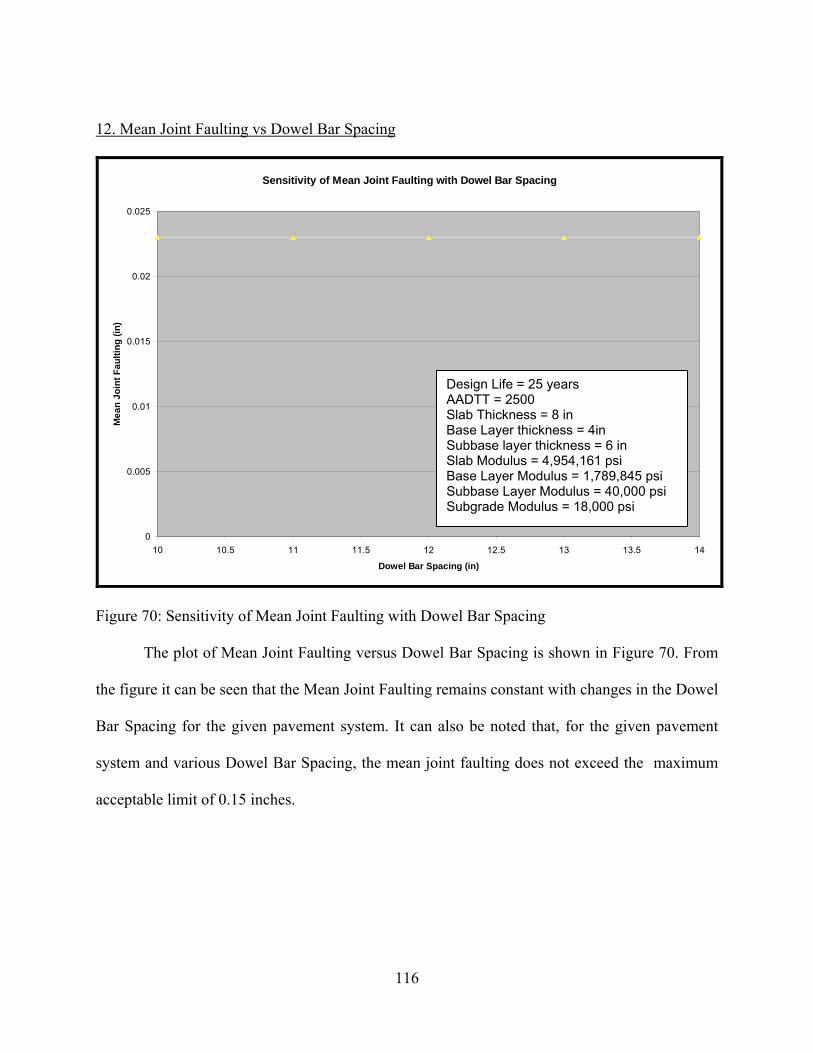
116
12. Mean Joint Faulting vs Dowel Bar Spacing
Sensitivity of Mean Joint Faulting with Dowel Bar Spacing
0
0.005
0.01
0.015
0.02
0.025
10 10.5 11 11.5 12 12.5 13 13.5 14
Dowel Bar Spacing (in)
Mea
n Jo
int F
aulti
ng (i
n)
Figure 70: Sensitivity of Mean Joint Faulting with Dowel Bar Spacing
The plot of Mean Joint Faulting versus Dowel Bar Spacing is shown in Figure 70. From
the figure it can be seen that the Mean Joint Faulting remains constant with changes in the Dowel
Bar Spacing for the given pavement system. It can also be noted that, for the given pavement
system and various Dowel Bar Spacing, the mean joint faulting does not exceed the maximum
acceptable limit of 0.15 inches.
Design Life = 25 years AADTT = 2500 Slab Thickness = 8 in Base Layer thickness = 4in Subbase layer thickness = 6 in Slab Modulus = 4,954,161 psi Base Layer Modulus = 1,789,845 psi Subbase Layer Modulus = 40,000 psi Subgrade Modulus = 18,000 psi

117
13. Terminal IRI vs Dowel Bar Diameter
Sensitivity of Terminal IRI with Dowel Bar Diameter
0
20
40
60
80
100
120
140
160
1 1.05 1.1 1.15 1.2 1.25 1.3 1.35 1.4 1.45 1.5
Dowel Bar Diameter (in)
Term
inal
IRI
Figure 71: Sensitivity of Terminal IRI with Dowel Bar Diameter
The plot of Terminal IRI versus Dowel Bar Diameter is shown in Figure 71. From the
figure it can be seen that the Terminal IRI is highly sensitive to the dowel bar diameter. The plot
shows that Terminal IRI decreases with the increase in the dowel bar diameter. Therefore, a
greater Dowel Bar Diameter results in greater smoothness of the pavement over the design life of
the pavement. The dowel bar diameter of 1 inch, results in a terminal IRI value of 141.20 in/mile
at the end of the design life of the pavement, whereas as dowel bar diameter of 1.5 inches results
Design Life = 25 years AADTT = 2500 Slab Thickness = 8 in Base Layer thickness = 4in Subbase layer thickness = 6 in Slab Modulus = 4,954,161 psi Base Layer Modulus = 1,789,845 psi Subbase Layer Modulus = 40,000 psi Subgrade Modulus = 18,000 psi

118
in a terminal IRI value of 76 in/mile. The larger the dowel bar diameter, the lower the concrete
bearing stress and joint faulting which in turn results in lower subsequent terminal IRI.
14. Transverse Cracking vs Dowel Bar Diameter
Sensitivity of Transverse Cracking with Dowel Bar Diameter
0
0.1
0.2
0.3
0.4
0.5
0.6
0.7
0.8
1 1.05 1.1 1.15 1.2 1.25 1.3 1.35 1.4 1.45 1.5
Dowel Bar Diameter (in)
Tran
sver
se C
rack
ing
(% S
lab
crac
ked)
Figure 72: Sensitivity of Transverse Cracking with Dowel Bar Diameter
The plot of Transverse Cracking versus Dowel Bar Spacing is shown in Figure 72. The
plot shows that, there is no change in the Transverse Cracking of the slab with change in the
dowel bar diameter. Thus, the transverse cracking in the slab is independent of the diameter of
the dowel bar and it mostly affects the joint faulting of the pavement.
Design Life = 25 years AADTT = 2500 Slab Thickness = 8 in Base Layer thickness = 4in Subbase layer thickness = 6 in Slab Modulus = 4,954,161 psi Base Layer Modulus = 1,789,845 psi Subbase Layer Modulus = 40,000 psi Subgrade Modulus = 18,000 psi
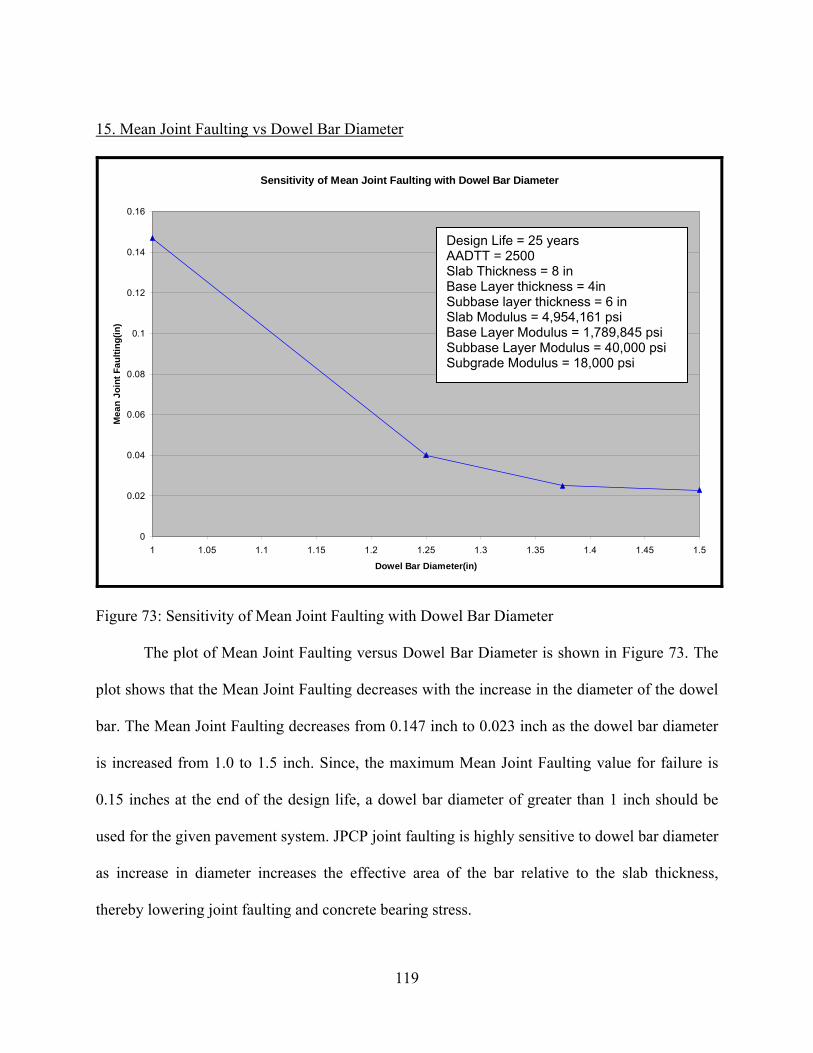
119
15. Mean Joint Faulting vs Dowel Bar Diameter
Sensitivity of Mean Joint Faulting with Dowel Bar Diameter
0
0.02
0.04
0.06
0.08
0.1
0.12
0.14
0.16
1 1.05 1.1 1.15 1.2 1.25 1.3 1.35 1.4 1.45 1.5
Dowel Bar Diameter(in)
Mea
n Jo
int F
aulti
ng(in
)
Figure 73: Sensitivity of Mean Joint Faulting with Dowel Bar Diameter
The plot of Mean Joint Faulting versus Dowel Bar Diameter is shown in Figure 73. The
plot shows that the Mean Joint Faulting decreases with the increase in the diameter of the dowel
bar. The Mean Joint Faulting decreases from 0.147 inch to 0.023 inch as the dowel bar diameter
is increased from 1.0 to 1.5 inch. Since, the maximum Mean Joint Faulting value for failure is
0.15 inches at the end of the design life, a dowel bar diameter of greater than 1 inch should be
used for the given pavement system. JPCP joint faulting is highly sensitive to dowel bar diameter
as increase in diameter increases the effective area of the bar relative to the slab thickness,
thereby lowering joint faulting and concrete bearing stress.
Design Life = 25 years AADTT = 2500 Slab Thickness = 8 in Base Layer thickness = 4in Subbase layer thickness = 6 in Slab Modulus = 4,954,161 psi Base Layer Modulus = 1,789,845 psi Subbase Layer Modulus = 40,000 psi Subgrade Modulus = 18,000 psi

120
16. Terminal IRI vs Layer 2 (base layer) thickness
Sensitivity of Terminal IRI with Layer 2 thickness
71.5
72
72.5
73
73.5
74
74.5
75
75.5
76
76.5
4 4.5 5 5.5 6 6.5 7 7.5 8
Layer 2 thickness (in)
Term
inal
IRI (
in/m
ile)
Figure 74: Sensitivity of Terminal IRI with layer 2 (Cement Stabilized base) thickness
The plot of Terminal IRI versus Layer 2 thickness is shown in Figure 74. The plot shows
that the Terminal IRI decreases with the increase in the Layer 2 (base layer) thickness. The
terminal IRI value decreases from 76 to 71.9 as the layer 2 (base thickness) is increased from 4
to 8 inches. Thus, it can be concluded that, terminal IRI is not too sensitive to the thickness of the
cement stabilized base layer of the pavement.
Design Life = 25 years AADTT = 2500 Slab Thickness = 8 in Subbase layer thickness = 6 in Slab Modulus = 4,954,161 psi Base Layer Modulus = 1,789,845 psi Subbase Layer Modulus = 40,000 psi Subgrade Modulus = 18,000 psi

121
17. Transverse Cracking vs Layer 2 (base layer) thickness
Sensitivity of Transverse Cracking with Layer -2 thickness
0
0.1
0.2
0.3
0.4
0.5
0.6
0.7
0.8
4 4.5 5 5.5 6 6.5 7 7.5 8
Layer 2 Thickness (in)
Tran
sver
se C
rack
ing
(% S
labs
cra
cked
)
Figure 75: Sensitivity of Transverse Cracking with Layer – 2 (Cement Stabilized) thickness
The plot of Transverse Cracking versus Layer 2 (base layer) thickness is shown in Figure
75. The plot shows that the transverse cracking decreases as the Layer 2 (base layer) thickness is
increased from 4 to 7 inches. However, transverse cracking increases as the layer 2 (base layer)
thickness is increased from 7 to 8 inches. This is contradictory as a thicker base layer is expected
to reduce cracking of the pavement. It can also be noted that the transverse cracking remains
constant for base layer thickness of 5 and 6 inches. For the given pavement system, it can be
inferred that the layer 2 (base layer) thickness of 7 inches will result in minimum transverse
cracking of the slab.
Design Life = 25 years AADTT = 2500 Slab Thickness = 8 in Subbase layer thickness = 6 in Slab Modulus = 4,954,161 psi Base Layer Modulus = 1,789,845 psi Subbase Layer Modulus = 40,000 psi Subgrade Modulus = 18,000 psi

122
18. Mean Joint Faulting vs Layer 2 thickness
Sensitivity of Mean Joint Faulting with Layer 2 thickness
0
0.005
0.01
0.015
0.02
0.025
4 4.5 5 5.5 6 6.5 7 7.5 8
Layer 2 thickness (in)
Mea
n Jo
int F
aulti
ng (i
n)
Figure 76: Sensitivity of Mean Joint Faulting with Layer 2 (Cement Stabilized) thickness
The plot of Mean Joint Faulting versus Layer 2 thickness is shown in Figure 76. From the
figure it can be seen that the Mean Joint Faulting decreases as the layer 2 (base layer) thickness
increases from 4 to 8 inches. The Mean Joint Faulting decreases from 0.023 to 0.016 inches as
the layer 2 (base) thickness is increased from 4 to 8 in. The Mean Joint Faulting is a critical
factor affecting ride quality. The acceptable level of Mean Joint faulting for the given pavement
system is 0.15 in at the end of the design life. From the figure it can be inferred that, using a
Cement Stabilized Base layer thickness from 4 to 8 inches will not result in Mean Joint Faulting
beyond the acceptable level of 0.15 inches and the pavement will have better ride quality at the
end of the design life.
Design Life = 25 years AADTT = 2500 Slab Thickness = 8 in Subbase layer thickness = 6 in Slab Modulus = 4,954,161 psi Base Layer Modulus = 1,789,845 psi Subbase Layer Modulus = 40,000 psi Subgrade Modulus = 18,000 psi
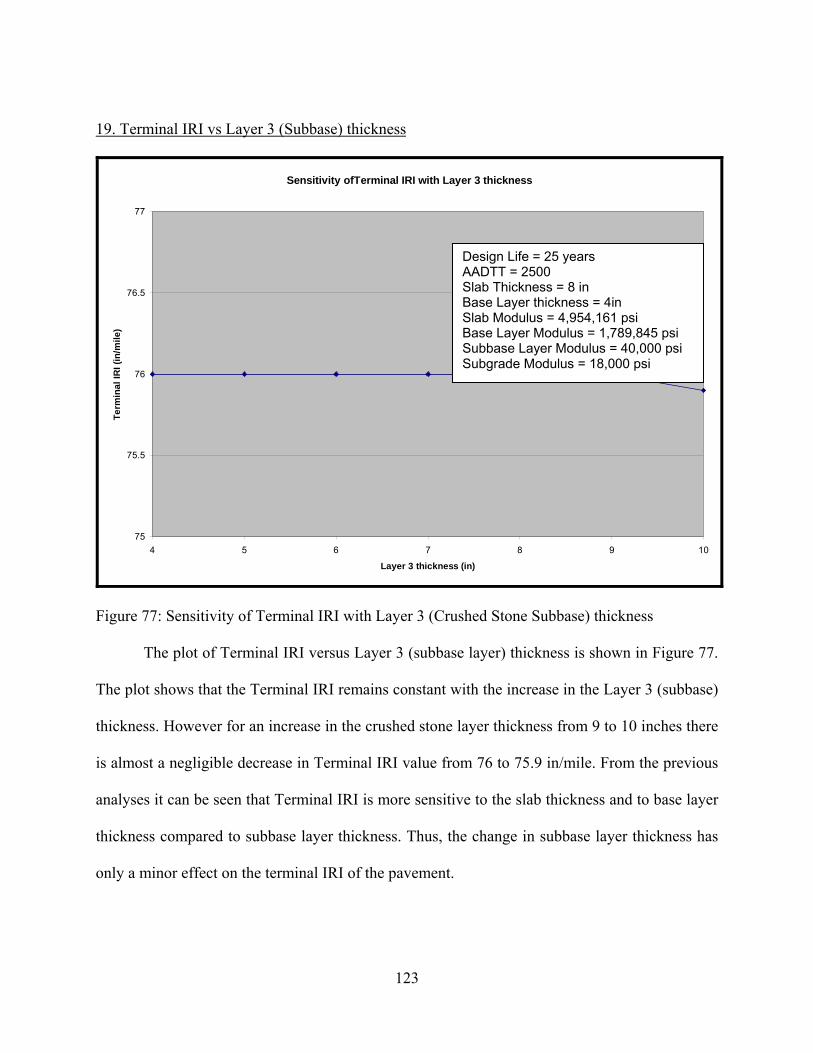
123
19. Terminal IRI vs Layer 3 (Subbase) thickness
Sensitivity ofTerminal IRI with Layer 3 thickness
75
75.5
76
76.5
77
4 5 6 7 8 9 10
Layer 3 thickness (in)
Term
inal
IRI (
in/m
ile)
Figure 77: Sensitivity of Terminal IRI with Layer 3 (Crushed Stone Subbase) thickness
The plot of Terminal IRI versus Layer 3 (subbase layer) thickness is shown in Figure 77.
The plot shows that the Terminal IRI remains constant with the increase in the Layer 3 (subbase)
thickness. However for an increase in the crushed stone layer thickness from 9 to 10 inches there
is almost a negligible decrease in Terminal IRI value from 76 to 75.9 in/mile. From the previous
analyses it can be seen that Terminal IRI is more sensitive to the slab thickness and to base layer
thickness compared to subbase layer thickness. Thus, the change in subbase layer thickness has
only a minor effect on the terminal IRI of the pavement.
Design Life = 25 years AADTT = 2500 Slab Thickness = 8 in Base Layer thickness = 4in Slab Modulus = 4,954,161 psi Base Layer Modulus = 1,789,845 psi Subbase Layer Modulus = 40,000 psi Subgrade Modulus = 18,000 psi
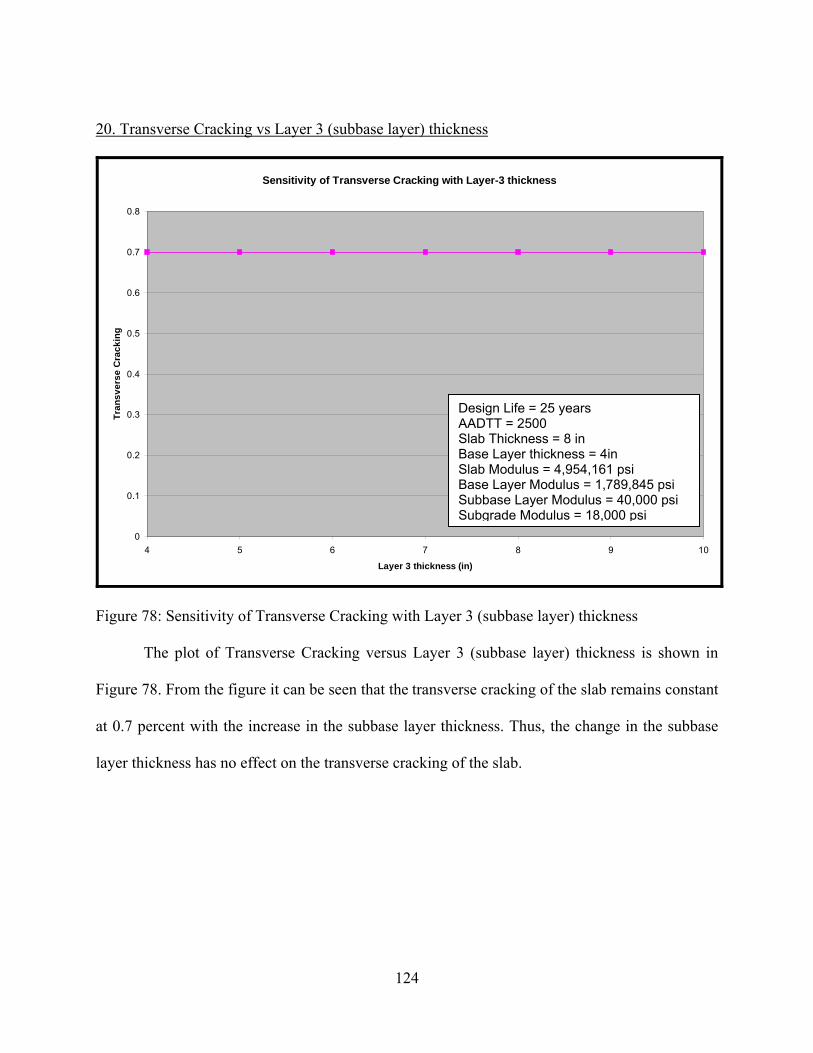
124
20. Transverse Cracking vs Layer 3 (subbase layer) thickness
Sensitivity of Transverse Cracking with Layer-3 thickness
0
0.1
0.2
0.3
0.4
0.5
0.6
0.7
0.8
4 5 6 7 8 9 10
Layer 3 thickness (in)
Tran
sver
se C
rack
ing
Figure 78: Sensitivity of Transverse Cracking with Layer 3 (subbase layer) thickness
The plot of Transverse Cracking versus Layer 3 (subbase layer) thickness is shown in
Figure 78. From the figure it can be seen that the transverse cracking of the slab remains constant
at 0.7 percent with the increase in the subbase layer thickness. Thus, the change in the subbase
layer thickness has no effect on the transverse cracking of the slab.
Design Life = 25 years AADTT = 2500 Slab Thickness = 8 in Base Layer thickness = 4in Slab Modulus = 4,954,161 psi Base Layer Modulus = 1,789,845 psi Subbase Layer Modulus = 40,000 psi Subgrade Modulus = 18,000 psi

125
21. Mean Joint Faulting vs Layer 3 (subbase layer) thickness
Sensitivity of Mean Joint Faulting with Layer 3 thickness
0
0.005
0.01
0.015
0.02
0.025
4 5 6 7 8 9 10
Layer 3 Thickness (in)
Mea
n Fa
ultin
g (in
)
Figure 79: Sensitivity of Mean Joint Faulting with Layer 3 (Crushed Stone) thickness
The plot of Mean Joint Faulting versus Layer 3 (subbase layer) thickness is shown in
Figure 79. The plot shows that the Mean Joint Faulting of the slab remains constant with the
change in the layer 3 thickness. Therefore, the Mean Joint Faulting is not sensitive to changes in
the layer 3 (crushed stone) thickness of the pavement.
Design Life = 25 years AADTT = 2500 Slab Thickness = 8 in Base Layer thickness = 4in Slab Modulus = 4,954,161 psi Base Layer Modulus = 1,789,845 psi Subbase Layer Modulus = 40,000 psi Subgrade Modulus = 18,000 psi
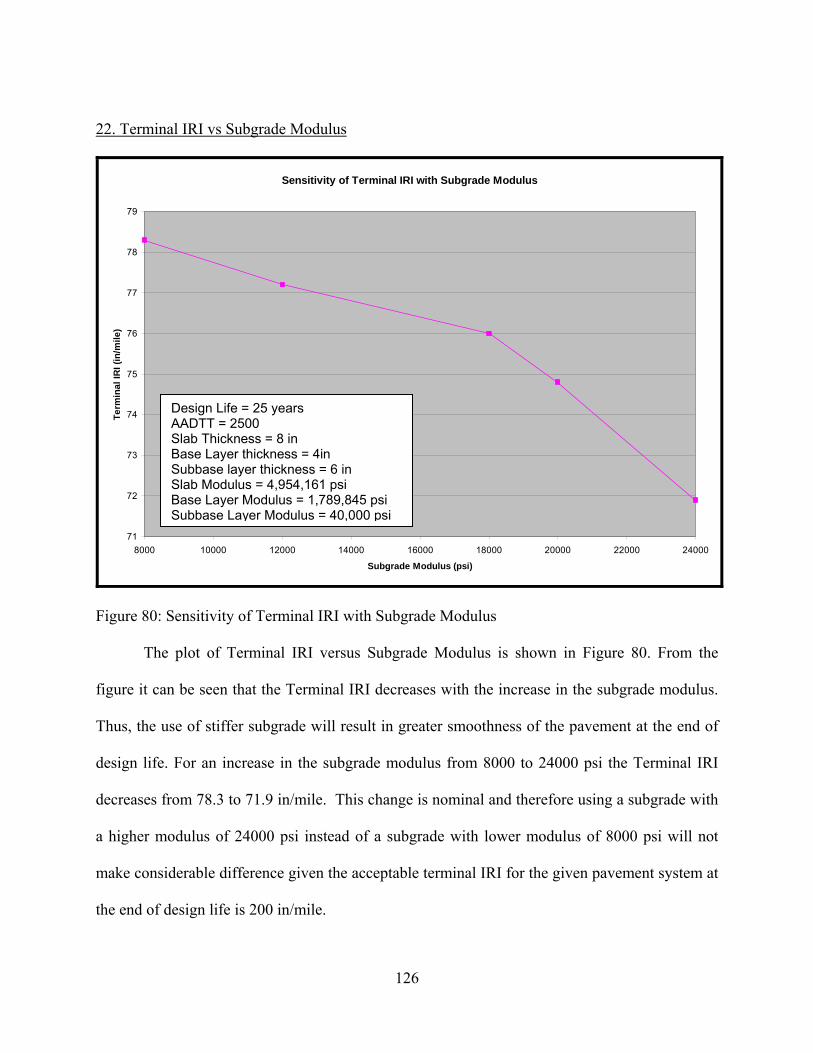
126
22. Terminal IRI vs Subgrade Modulus
Sensitivity of Terminal IRI with Subgrade Modulus
71
72
73
74
75
76
77
78
79
8000 10000 12000 14000 16000 18000 20000 22000 24000
Subgrade Modulus (psi)
Term
inal
IRI (
in/m
ile)
Figure 80: Sensitivity of Terminal IRI with Subgrade Modulus
The plot of Terminal IRI versus Subgrade Modulus is shown in Figure 80. From the
figure it can be seen that the Terminal IRI decreases with the increase in the subgrade modulus.
Thus, the use of stiffer subgrade will result in greater smoothness of the pavement at the end of
design life. For an increase in the subgrade modulus from 8000 to 24000 psi the Terminal IRI
decreases from 78.3 to 71.9 in/mile. This change is nominal and therefore using a subgrade with
a higher modulus of 24000 psi instead of a subgrade with lower modulus of 8000 psi will not
make considerable difference given the acceptable terminal IRI for the given pavement system at
the end of design life is 200 in/mile.
Design Life = 25 years AADTT = 2500 Slab Thickness = 8 in Base Layer thickness = 4in Subbase layer thickness = 6 in Slab Modulus = 4,954,161 psi Base Layer Modulus = 1,789,845 psi Subbase Layer Modulus = 40,000 psi

127
23. Transverse Cracking vs Subgrade Modulus
Sensitivity of Transverse Cracking with Subgrade Modulus
0
0.2
0.4
0.6
0.8
1
1.2
8000 10000 12000 14000 16000 18000 20000 22000 24000
Subgrade Modulus (psi)
Tran
sver
se C
rack
ing
(%sl
abs
crac
ked)
Figure 81: Sensitivity of Transverse Cracking with Subgrade Modulus
The plot of Transverse Cracking versus Subgrade Modulus is shown in Figure 81. The
plot shows that the Transverse Cracking decreases as the subgrade modulus increases from 8,000
psi to 18,000 psi. It remains constant for increase in the subgrade modulus from 18,000 psi to
20,000 psi. However, the transverse cracking increases for an increase in subgrade modulus from
20,000 to 24,000 psi. Thus, a subgrade modulus between 18,000 psi to 20,000 psi will result in
minimum transverse cracking in the pavement. However, the graph is conceptually not realistic
between the subgrade modulus ranges of 20,000 psi to 24,000 psi, as a greater subgrade modulus
is expected to reduce transverse cracking.
Design Life = 25 years AADTT = 2500 Slab Thickness = 8 in Base Layer thickness = 4in Subbase layer thickness = 6 in Slab Modulus = 4,954,161 psi Base Layer Modulus = 1,789,845 psi Subbase Layer Modulus = 40,000 psi
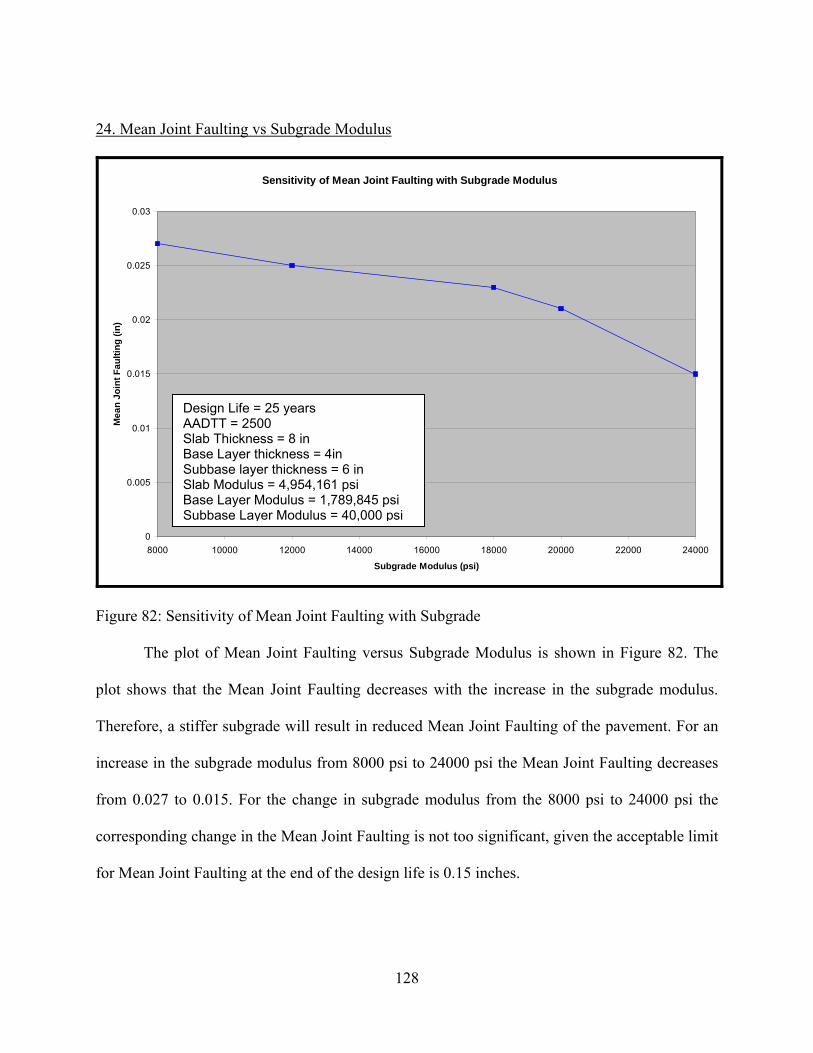
128
24. Mean Joint Faulting vs Subgrade Modulus
Sensitivity of Mean Joint Faulting with Subgrade Modulus
0
0.005
0.01
0.015
0.02
0.025
0.03
8000 10000 12000 14000 16000 18000 20000 22000 24000
Subgrade Modulus (psi)
Mea
n Jo
int F
aulti
ng (i
n)
Figure 82: Sensitivity of Mean Joint Faulting with Subgrade
The plot of Mean Joint Faulting versus Subgrade Modulus is shown in Figure 82. The
plot shows that the Mean Joint Faulting decreases with the increase in the subgrade modulus.
Therefore, a stiffer subgrade will result in reduced Mean Joint Faulting of the pavement. For an
increase in the subgrade modulus from 8000 psi to 24000 psi the Mean Joint Faulting decreases
from 0.027 to 0.015. For the change in subgrade modulus from the 8000 psi to 24000 psi the
corresponding change in the Mean Joint Faulting is not too significant, given the acceptable limit
for Mean Joint Faulting at the end of the design life is 0.15 inches.
Design Life = 25 years AADTT = 2500 Slab Thickness = 8 in Base Layer thickness = 4in Subbase layer thickness = 6 in Slab Modulus = 4,954,161 psi Base Layer Modulus = 1,789,845 psi Subbase Layer Modulus = 40,000 psi

129
25. Effect of Tied / Untied PCC shoulder on the Terminal IRI
Effect of Tied/Untied PCC shoulder on Terminal IRI
70
71
72
73
74
75
76
77
Tied PCC Shoulder Not tied to PCC
Term
inal
IRI (
in/m
ile)
Figure 83: Effect of Tied/Untied PCC shoulder on Terminal IRI
The plot comparing the effect of tied/untied PCC shoulder on Terminal IRI is shown in
Figure 83. From the figure it can be seen that an untied PCC shoulder will result in greater
terminal IRI than with tied PCC shoulder. Thus a tied PCC shoulder will ensure a greater
terminal smoothness of the pavement at the end of the design life as they reduce critical
deflections and stresses along the edge.

130
26. Effect of Tied / Untied PCC shoulder on Transverse Cracking
Effect of Tied/Untied PCC Shoulder on Transverse Cracking
0
0.1
0.2
0.3
0.4
0.5
0.6
0.7
0.8
Tied PCC Shoulder Not tied to PCC
Tran
sver
se C
rack
ing
(%Sl
abs
Cra
cked
)
Figure 84: Effect of Tied/Untied PCC shoulder on Transverse Cracking
The plot comparing the effect of tied/untied PCC shoulder on Transverse Cracking is
shown in Figure 84. From the figure it can be seen that an untied PCC shoulder will result in
greater Transverse Cracking compared with tied PCC shoulder at the end of the design life. This
is because tied PCC shoulders reduce the deflections and stresses at the edge of the pavement.
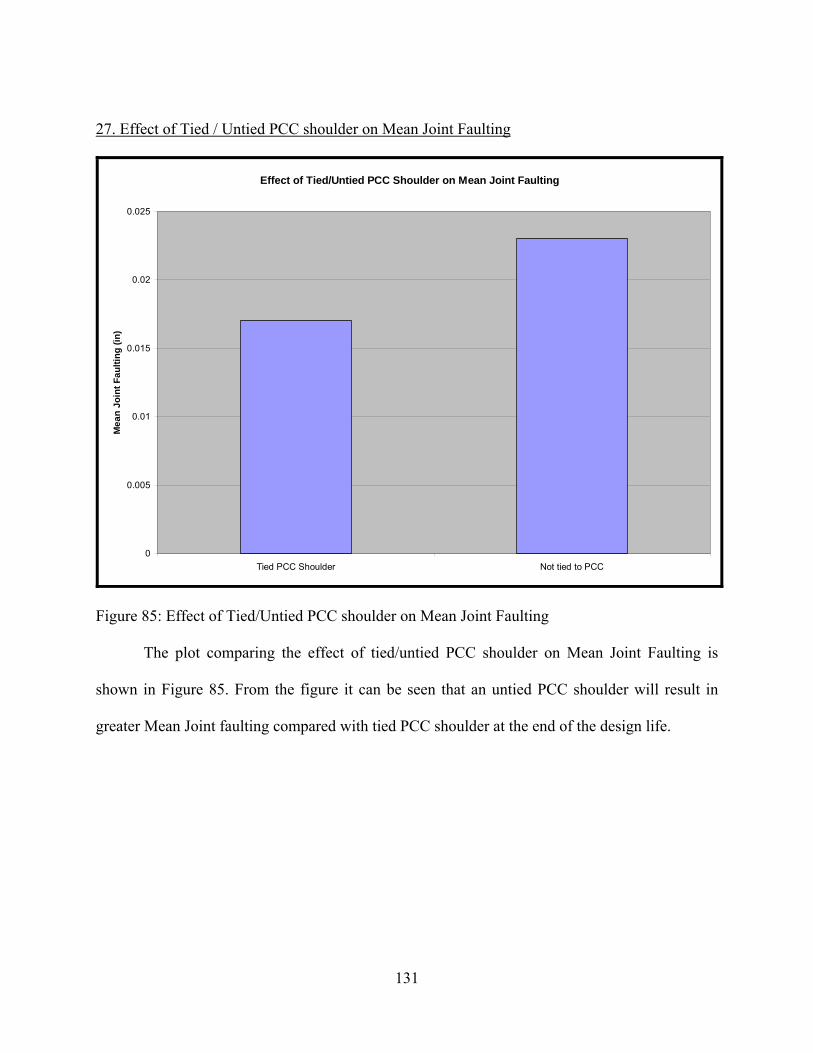
131
27. Effect of Tied / Untied PCC shoulder on Mean Joint Faulting
Effect of Tied/Untied PCC Shoulder on Mean Joint Faulting
0
0.005
0.01
0.015
0.02
0.025
Tied PCC Shoulder Not tied to PCC
Mea
n Jo
int F
aulti
ng (i
n)
Figure 85: Effect of Tied/Untied PCC shoulder on Mean Joint Faulting
The plot comparing the effect of tied/untied PCC shoulder on Mean Joint Faulting is
shown in Figure 85. From the figure it can be seen that an untied PCC shoulder will result in
greater Mean Joint faulting compared with tied PCC shoulder at the end of the design life.

132
28. Sensitivity of Terminal IRI with Base Modulus
Sensitivity of Terminal IRI (in/mile) with Base Modulus
74
74.5
75
75.5
76
76.5
77
1250000 1500000 1750000 2000000 2250000 2500000 2750000 3000000
Base Modulus (psi)
Term
inal
IRI (
in/m
ile)
Figure 86: Sensitivity of Terminal IRI with Base Modulus
The plot of Terminal IRI vs Base Modulus is shown in Figure 86. From the figure it can
be seen that the Terminal IRI decreases with the increase in the Base Layer Modulus. Thus, the
use of stiffer base will result in greater terminal smoothness of the pavement at the end of the
design life. For an increase in the base layer modulus from 1,250k to 3,000k psi, the Terminal
IRI decreases only from 76.4 to 75.8 in/mile. Thus, it can be concluded that the base layer
modulus has a minor effect on the terminal IRI of the pavement.
Design Life = 25 years AADTT = 2500 Slab Thickness = 8 in Base Layer thickness = 4in Subbase layer thickness = 6 in Slab Modulus = 4,954,161 psi Subbase Layer Modulus = 40,000 psi Subgrade Modulus = 18,000 psi

133
29. Sensitivity of Transverse Cracking with Base Modulus
Sensitivity of Transverse Cracking with Base Layer Modulus
0.60
0.65
0.70
0.75
0.80
0.85
0.90
1250000 1500000 1750000 2000000 2250000 2500000 2750000 3000000
Base Layer Modulus (psi)
Tran
sver
se C
rack
ing
(%sl
abs
crac
ked)
Figure 87: Sensitivity of Transverse Cracking with Base layer modulus
The plot of Transverse Cracking with Base Modulus is shown in Figure 87. From the
figure it can be seen that the Transverse Cracking decreases from 0.8% to 0.7% as the base layer
modulus is increased from 1,250k to 1,500k psi. However, it remains constant at 0.7% for base
layer modulus beyond 1,500k psi, which is not realistic as it is expected that the transverse
cracking should decrease with the use of stiffer base layers.
Design Life = 25 years AADTT = 2500 Slab Thickness = 8 in Base Layer thickness = 4in Subbase layer thickness = 6 in Slab Modulus = 4,954,161 psi Subbase Layer Modulus = 40,000 psi Subgrade Modulus = 18,000 psi

134
30. Sensitivity of Mean Joint Faulting with Base Modulus
Sensitivity of Mean Joint Faulting with Base Layer Modulus
0.021
0.0215
0.022
0.0225
0.023
0.0235
0.024
0.0245
0.025
1250000 1500000 1750000 2000000 2250000 2500000 2750000 3000000
Base Layer Modulus (psi)
Mea
n Jo
int F
aulti
ng (i
n)
Figure 88: Sensitivity of Mean Joint Faulting with Base layer modulus
The plot of Mean Joint Faulting with base modulus is shown in Figure 90. From the
figure it can be seen that the Mean Joint Faulting decreases with the increase in base layer
modulus. For an increase of base layer modulus from 1250k to 3000k psi the Mean Joint
Faulting decreases from 0.024 in to 0.023 in. However, the Mean Joint Faulting remains constant
for an increase in Base Layer Modulus from 1750k to 3000k.
Design Life = 25 years AADTT = 2500 Slab Thickness = 8 in Base Layer thickness = 4in Subbase layer thickness = 6 in Slab Modulus = 4,954,161 psi Subbase Layer Modulus = 40,000 psi Subgrade Modulus = 18,000 psi

135
4.2.2 Continuous Reinforced Concrete Pavement (CRCP)
To conduct sensitivity analyses on the CRCP pavement the following sample problem
was executed with the design inputs as listed below.
Analysis parameters
The continuous reinforced concrete pavement will have a design of 30 years and initial
IRI of 63 in/mile. It is expected that at the end of the design life the pavement will have a
terminal IRI of no more than 252 in/mile at 95 % reliability and no more than 10 punchouts per
mile at 95% reliability.
Traffic Data
The two-way average annual truck traffic on this pavement is estimated to be 2500 trucks
during the first year of its service. The pavement will be open to traffic in September. There will
be two lanes in the design direction with 90% of the trucks in the design lane. Truck traffic is
equally distributed in both directions and the operational speed is 60 mph. The functional class of
the highway is Interstate. For each class of the vehicle the traffic pattern for monthly and daily
basis remains same throughout the year. The traffic variation over a 24 hour period is assumed to
be same as the national default based on LTPP data. After the initial year the traffic increases at
the rate of 4 % compounded annually over the design life of the pavement. The axle load
distribution is assumed to be the same as the national default.
Axle Configuration
The mean of the outerwheel edge is located 18 inches from the edge of the pavement.
The truck lateral wander has a standard deviation of 10 inches and the standard design lane width
is 12 ft. The number of single, tandem, tridem and quad axles for each vehicle class is similar to

136
national defaults derived from the LTPP. The average axle width is 8.5 ft and the dual tire
spacing is 12 in. The single and dual tire pressures are 120 psi.
Drainage and Surface Properties
The pavement has a cross slope of 2 %, the drainage path length is 12 ft and the surface
shortwave absorptivity is 0.85.
Material Properties
It is anticipated that the temperature and curing conditions will induce a permanent warp
in the pavement equivalent to -10 deg F. The concrete mix design to be used in the design has
level 1 strength tests for the concrete compressive strength, modulus of elasticity and modulus of
rupture. The coefficient of thermal expansion of the mix is assumed to be 6.3 in/in/deg F.
Thermal conductivity and specific heat assumed are 1.25 BTU/hr-ft-‘F and 0.28 BTU/lb-‘F. The
unit weight and poisson’s ratio of the mix are 145 pcf and 0.20 respectively. The concrete mix
designed comprised of type I cement and the aggregate type used for the design is dolomite. The
subgrade in this location has a Mr value of 20,000 psi estimated at optimum moisture conditions
and has a plasticity index of 15.
The initial trial thickness used for the different layers is:
Slab Thickness: 8 in
Asphalt Concrete Base Layer thickness: 4 in
Compacted Subgrade Layer thickness (Subbase): 12 in
The following table gives a list of the important parameters used in the sensitivity analysis.

137
Table 5: List of parameters used in the sensitivity analyses of CRCP pavement
Input Parameters Value For Sensitivity Analyses
1 Design Life 30 yrs Constant
2 Two-way AADTT 2500 1500 – 3500
3 Initial IRI 63 in/mile Constant
4 Maximum Acceptable Terminal IRI 252 in/mile Constant
5 Maximum Allowable Punchouts (per mile) 10 Constant
7 Slab Thickness 9 in 8 – 12 in
8 Base Layer Thickness 4 in 4 – 8 in
9 Compacted Subgrade Thickness 12 in 10 – 14 in
10 Percent Steel 0.6 0.4 – 0.8
11 Steel Depth 4 in 3 – 4.5 in
12 Subgrade Modulus 20,00 psi 4 – 10 in

138
1. Terminal IRI vs AADTT
CRCP - Sensitivity of Terminal IRI with AADTT
0
20
40
60
80
100
120
140
160
1500 1700 1900 2100 2300 2500 2700 2900 3100 3300 3500
AADTT
Term
inal
IRI (
in/m
ile)
Figure 89: Sensitivity of Terminal IRI with AADTT
The plot of Terminal IRI versus AADTT varying from 1500 to 3500 is shown in Figure
89. The plot shows that the terminal IRI increases with the increase in the AADTT. For an
increase in the AADTT from 1500 to 3500 trucks the Terminal IRI increased from 70.6 to 147.2.
Thus, it concludes that the ADDTT has a major effect on the smoothness of the pavement at the
end of the design life. Since the maximum allowable Terminal IRI at the end of the design life is
252 in/mile for the given pavement system, the terminal IRI expected for an AADTT of 3500 is
still within acceptable limits.
Design Life = 30 years Slab Thickness = 9 in Base Layer thickness = 4in Subbase layer thickness = 12 in Slab Modulus = 4,954,161 psi Subbase Layer Modulus = 20,000 psi Subgrade Modulus = 13,000 psi

139
2. Punchouts vs AADTT
CRCP - Sensitivity of Punchouts with AADTT
0
5
10
15
20
25
30
35
40
45
50
1500 1700 1900 2100 2300 2500 2700 2900 3100 3300 3500
AADTT
Punc
hout
s (p
er m
ile)
Figure 90: Sensitivity of Punchouts with AADTT
The plot of punchouts versus AADTT varying from 1500 to 3500 is shown in Figure 90.
The plot shows that the number of punchouts per mile increase with the increase in the AADTT.
For an increase in the AADTT from 1500 to 3500 trucks the number of punchouts per mile
increased from 3.9 to 43. Thus, the AADTT has a major effect on the number of punchouts per
mile of the pavement. Since the maximum allowable number of punchouts set for the given
example is 10 per mile of the pavement at the end of the design life, the given pavement system
can only support an AADTT of approx 1750.
Design Life = 30 years Slab Thickness = 9 in Base Layer thickness = 4in Subbase layer thickness = 12 in Slab Modulus = 4,954,161 psi Subbase Layer Modulus = 20,000 psi Subgrade Modulus = 13,000 psi
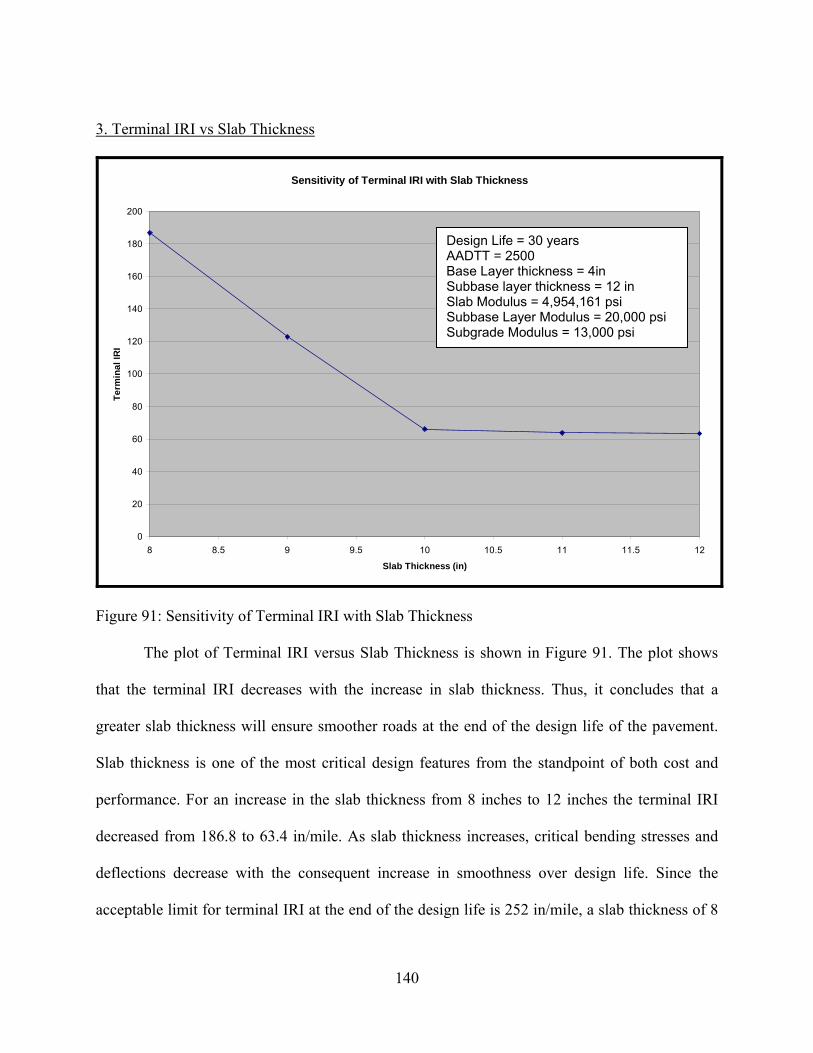
140
3. Terminal IRI vs Slab Thickness
Sensitivity of Terminal IRI with Slab Thickness
0
20
40
60
80
100
120
140
160
180
200
8 8.5 9 9.5 10 10.5 11 11.5 12
Slab Thickness (in)
Term
inal
IRI
Figure 91: Sensitivity of Terminal IRI with Slab Thickness
The plot of Terminal IRI versus Slab Thickness is shown in Figure 91. The plot shows
that the terminal IRI decreases with the increase in slab thickness. Thus, it concludes that a
greater slab thickness will ensure smoother roads at the end of the design life of the pavement.
Slab thickness is one of the most critical design features from the standpoint of both cost and
performance. For an increase in the slab thickness from 8 inches to 12 inches the terminal IRI
decreased from 186.8 to 63.4 in/mile. As slab thickness increases, critical bending stresses and
deflections decrease with the consequent increase in smoothness over design life. Since the
acceptable limit for terminal IRI at the end of the design life is 252 in/mile, a slab thickness of 8
Design Life = 30 years AADTT = 2500 Base Layer thickness = 4in Subbase layer thickness = 12 in Slab Modulus = 4,954,161 psi Subbase Layer Modulus = 20,000 psi Subgrade Modulus = 13,000 psi

141
inches can be used for the given pavement provided the criteria for maximum acceptable number
of punchouts is met.
4. Punchouts vs Slab thickness
Sensitivity of Punchouts with Slab Thickness
0
10
20
30
40
50
60
70
8 8.5 9 9.5 10 10.5 11 11.5 12
Slab Thickness (in)
Punc
hout
s (p
er m
ile)
Figure 92: Sensitivity of Punchouts with Slab Thickness
The plot of Punchouts versus Slab thickness is shown in Figure 92. The plot shows that
the number of punchout per mile decreases with the increase in the slab thickness. For an
increase in the slab thickness from 8 to 11 inches the Punchouts per mile decrease from 63.2 to
0.3. For an increase in the slab thickness from 11 to 12 inches the number of punchouts per mile
predicted increase from 0.3 to 2. Thus a slab thickness of 11 inches will result in the minimum
number of punchouts per mile for the given pavement system. It is interesting to note that the
Design Life = 30 years AADTT = 2500 Base Layer thickness = 4in Subbase layer thickness = 12 in Slab Modulus = 4,954,161 psi Subbase Layer Modulus = 20,000 psi Subgrade Modulus = 13,000 psi

142
number of punchouts increases as the slab thickness is increased from 11 to 12 inches. This is not
realistic as with a greater thickness of slab the number of punchouts are expected to decrease.
5. Terminal IRI vs Base Thickness
Sensitivity of Terminal IRI with Base Layer Thickness
118
118.5
119
119.5
120
120.5
121
121.5
122
122.5
123
123.5
4 4.5 5 5.5 6 6.5 7 7.5 8
Base Layer Thickness (in)
Term
inal
IRI (
in/m
ile)
Figure 93: Sensitivity of Terminal IRI with Base Layer Thickness
The plot of Terminal IRI versus Base Thickness varying from 4 to 8 inches is shown in
Figure 93. The plot shows that the terminal IRI decreases with the increase in the base thickness.
For an increase in the base thickness from 4 to 8 inches the Terminal IRI decreases from 122.9 to
118.7. Thus the base thickness plays a minor role in the determining the terminal IRI of the
pavement at the end of the design life.
Design Life = 30 years AADTT = 2500 Slab Thickness = 9 in Subbase layer thickness = 12 in Slab Modulus = 4,954,161 psi Subbase Layer Modulus = 20,000 psi Subgrade Modulus = 13,000 psi
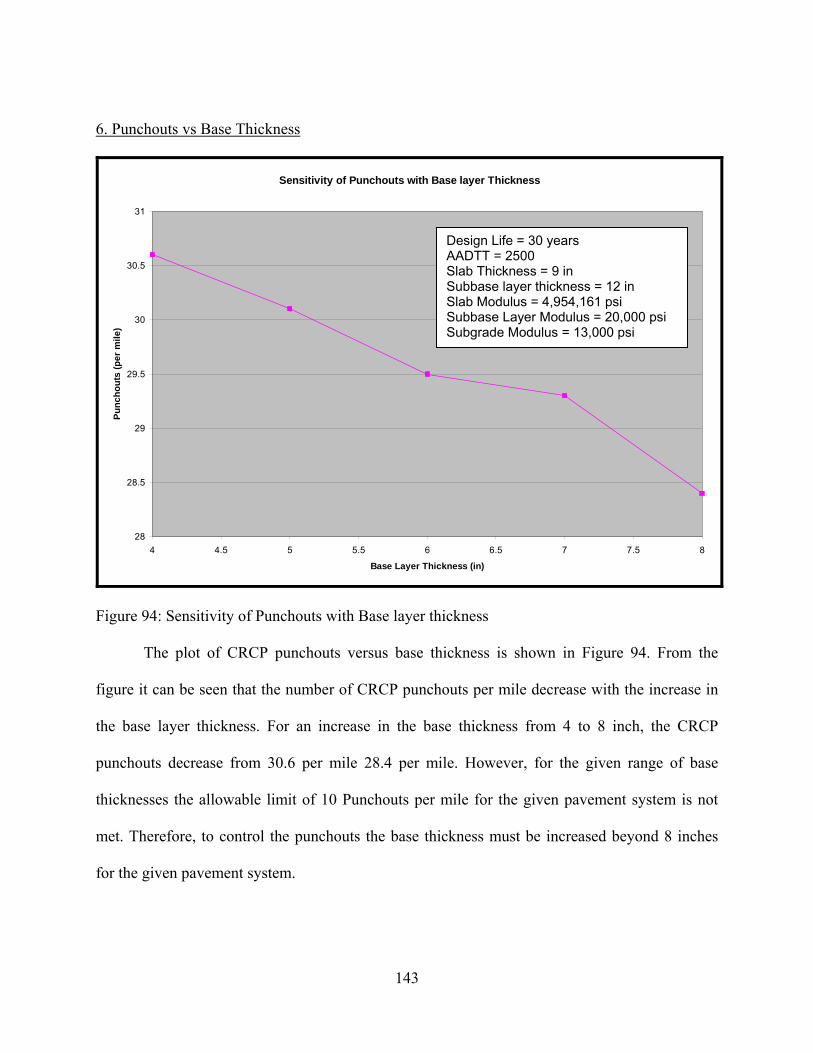
143
6. Punchouts vs Base Thickness
Sensitivity of Punchouts with Base layer Thickness
28
28.5
29
29.5
30
30.5
31
4 4.5 5 5.5 6 6.5 7 7.5 8
Base Layer Thickness (in)
Punc
hout
s (p
er m
ile)
Figure 94: Sensitivity of Punchouts with Base layer thickness
The plot of CRCP punchouts versus base thickness is shown in Figure 94. From the
figure it can be seen that the number of CRCP punchouts per mile decrease with the increase in
the base layer thickness. For an increase in the base thickness from 4 to 8 inch, the CRCP
punchouts decrease from 30.6 per mile 28.4 per mile. However, for the given range of base
thicknesses the allowable limit of 10 Punchouts per mile for the given pavement system is not
met. Therefore, to control the punchouts the base thickness must be increased beyond 8 inches
for the given pavement system.
Design Life = 30 years AADTT = 2500 Slab Thickness = 9 in Subbase layer thickness = 12 in Slab Modulus = 4,954,161 psi Subbase Layer Modulus = 20,000 psi Subgrade Modulus = 13,000 psi
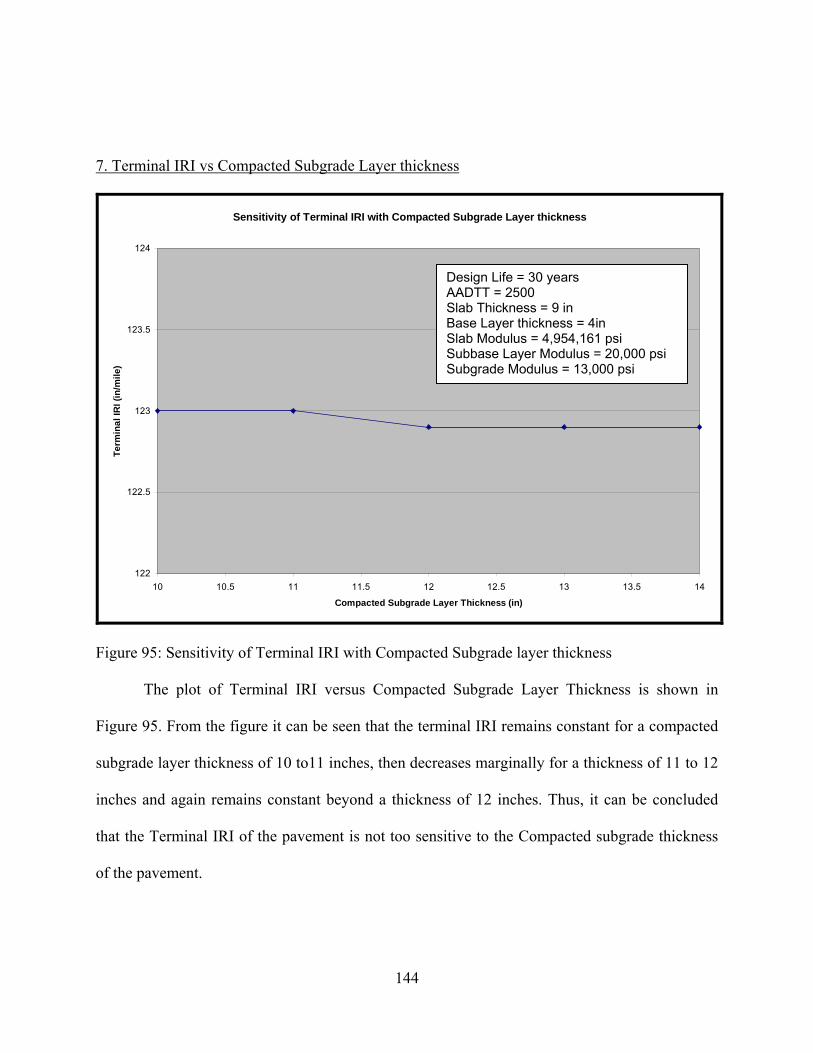
144
7. Terminal IRI vs Compacted Subgrade Layer thickness
Sensitivity of Terminal IRI with Compacted Subgrade Layer thickness
122
122.5
123
123.5
124
10 10.5 11 11.5 12 12.5 13 13.5 14
Compacted Subgrade Layer Thickness (in)
Term
inal
IRI (
in/m
ile)
Figure 95: Sensitivity of Terminal IRI with Compacted Subgrade layer thickness
The plot of Terminal IRI versus Compacted Subgrade Layer Thickness is shown in
Figure 95. From the figure it can be seen that the terminal IRI remains constant for a compacted
subgrade layer thickness of 10 to11 inches, then decreases marginally for a thickness of 11 to 12
inches and again remains constant beyond a thickness of 12 inches. Thus, it can be concluded
that the Terminal IRI of the pavement is not too sensitive to the Compacted subgrade thickness
of the pavement.
Design Life = 30 years AADTT = 2500 Slab Thickness = 9 in Base Layer thickness = 4in Slab Modulus = 4,954,161 psi Subbase Layer Modulus = 20,000 psi Subgrade Modulus = 13,000 psi

145
8. CRCP punchouts vs Compacted Subgrade Layer thickness
Sensitivity of Punchouts with Compacted Subgrade Thickness
0
5
10
15
20
25
30
35
10 10.5 11 11.5 12 12.5 13 13.5 14
Compacted Subgrade Thickness (in)
Punc
hout
s pe
r mile
Figure 96: Sensitivity of Punchouts with Compacted Subgrade Thickness
The plot of CRCP punchouts versus compacted subgrade layer thickness is shown in
Figure 96. From the figure it can be seen that the number of punchouts remain constant with the
increase in the compacted Subgrade Layer thickness. However, the number of punchouts per
mile is more than the maximum acceptable limit of 10 for the given pavement system.
Design Life = 30 years AADTT = 2500 Slab Thickness = 9 in Base Layer thickness = 4in Slab Modulus = 4,954,161 psi Subbase Layer Modulus = 20,000 psi Subgrade Modulus = 13,000 psi

146
9. Terminal IRI vs Percent Steel
Sensitivity of Terminal IRI with Percent Steel
0
20
40
60
80
100
120
140
160
180
0.4 0.45 0.5 0.55 0.6 0.65 0.7 0.75 0.8
Percent Steel (%)
Term
inal
IRI (
in/m
ile)
Figure 97: Sensitivity of Terminal IRI with Percent Steel
The plot of Terminal IRI versus Percent Steel is shown in Figure 97. From the figure it
can be seen that the terminal IRI decreases with the increase in the percentage of steel used. Steel
is used to control the opening of transverse cracking and it also affects the crack spacing. For an
increase in the percentage of steel used from 0.4 to 0.8 % the terminal IRI decreases from 159.4
to 65.5 in/mile. Thus, the percent of steel used has a major effect on the terminal IRI of the
pavement. For the given pavement system, 0.4% of steel can control the terminal IRI value to
160 in/mile which is less than the maximum acceptable value of 252 in/mile set for the given
pavement system.
Design Life = 30 years AADTT = 2500 Slab Thickness = 9 in Base Layer thickness = 4in Subbase layer thickness = 12 in Slab Modulus = 4,954,161 psi Subbase Layer Modulus = 20,000 psi Subgrade Modulus = 13,000 psi
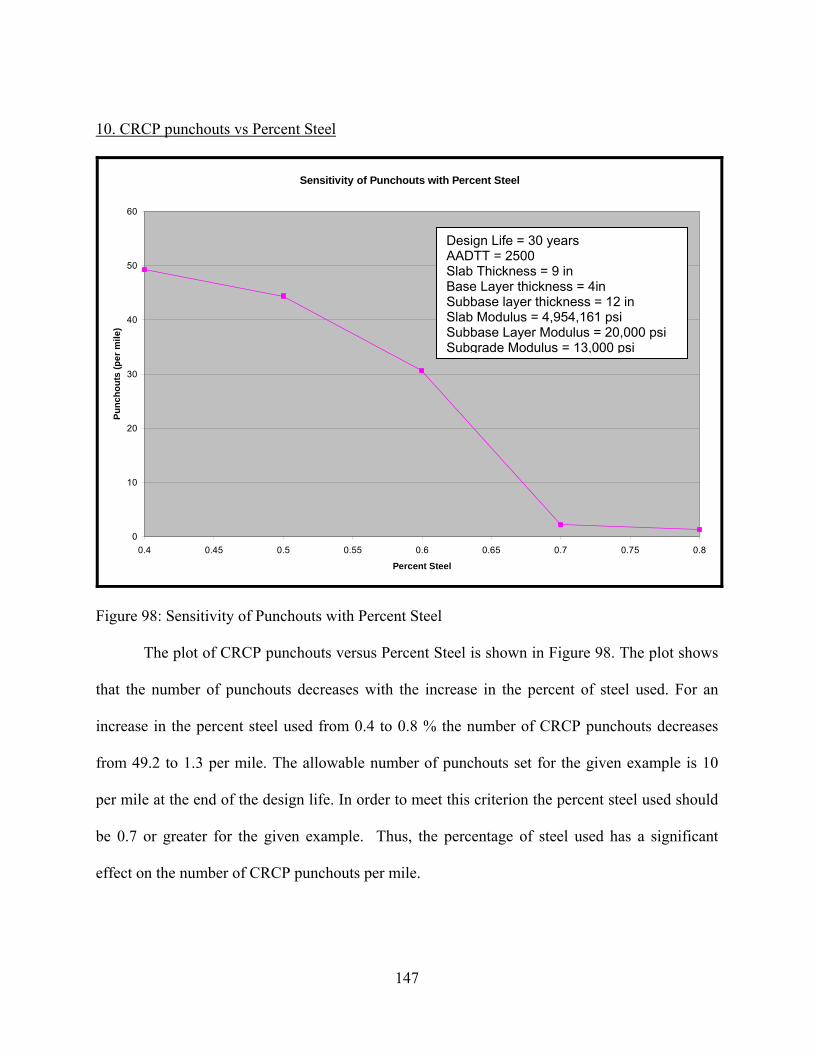
147
10. CRCP punchouts vs Percent Steel
Sensitivity of Punchouts with Percent Steel
0
10
20
30
40
50
60
0.4 0.45 0.5 0.55 0.6 0.65 0.7 0.75 0.8
Percent Steel
Punc
hout
s (p
er m
ile)
Figure 98: Sensitivity of Punchouts with Percent Steel
The plot of CRCP punchouts versus Percent Steel is shown in Figure 98. The plot shows
that the number of punchouts decreases with the increase in the percent of steel used. For an
increase in the percent steel used from 0.4 to 0.8 % the number of CRCP punchouts decreases
from 49.2 to 1.3 per mile. The allowable number of punchouts set for the given example is 10
per mile at the end of the design life. In order to meet this criterion the percent steel used should
be 0.7 or greater for the given example. Thus, the percentage of steel used has a significant
effect on the number of CRCP punchouts per mile.
Design Life = 30 years AADTT = 2500 Slab Thickness = 9 in Base Layer thickness = 4in Subbase layer thickness = 12 in Slab Modulus = 4,954,161 psi Subbase Layer Modulus = 20,000 psi Subgrade Modulus = 13,000 psi
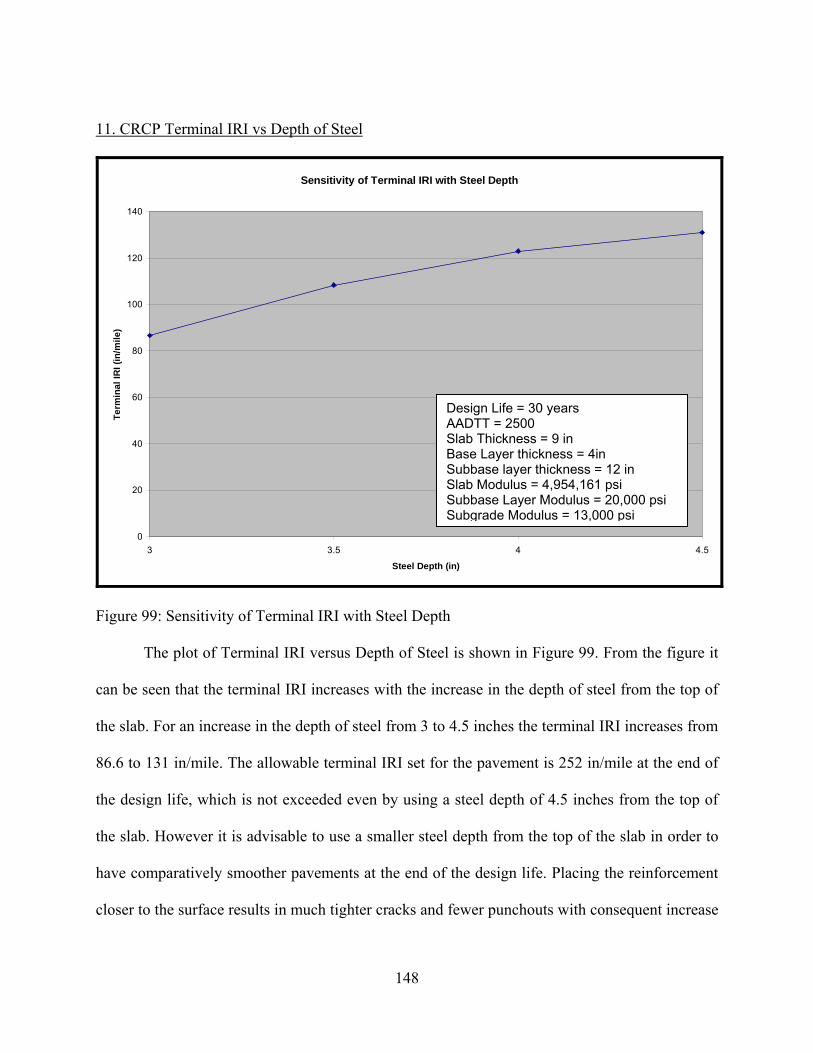
148
11. CRCP Terminal IRI vs Depth of Steel
Sensitivity of Terminal IRI with Steel Depth
0
20
40
60
80
100
120
140
3 3.5 4 4.5
Steel Depth (in)
Term
inal
IRI (
in/m
ile)
Figure 99: Sensitivity of Terminal IRI with Steel Depth
The plot of Terminal IRI versus Depth of Steel is shown in Figure 99. From the figure it
can be seen that the terminal IRI increases with the increase in the depth of steel from the top of
the slab. For an increase in the depth of steel from 3 to 4.5 inches the terminal IRI increases from
86.6 to 131 in/mile. The allowable terminal IRI set for the pavement is 252 in/mile at the end of
the design life, which is not exceeded even by using a steel depth of 4.5 inches from the top of
the slab. However it is advisable to use a smaller steel depth from the top of the slab in order to
have comparatively smoother pavements at the end of the design life. Placing the reinforcement
closer to the surface results in much tighter cracks and fewer punchouts with consequent increase
Design Life = 30 years AADTT = 2500 Slab Thickness = 9 in Base Layer thickness = 4in Subbase layer thickness = 12 in Slab Modulus = 4,954,161 psi Subbase Layer Modulus = 20,000 psi Subgrade Modulus = 13,000 psi

149
in smoothness of the pavement. Thus, the depth of steel has a significant effect on the terminal
IRI of the pavement.
12. CRCP punchouts vs Depth of Steel
Sensitivity of Punchouts with Steel Depth
0
5
10
15
20
25
30
35
40
3 3.5 4 4.5
Steel Depth (in)
Punc
hout
s (p
er m
ile)
Figure 100: Sensitivity of Punchouts with Steel Depth
The plot of CRCP punchouts versus depth of steel is shown in Figure 100. From the
figure it can be seen that the number of CRCP punchouts increases with the increase in the depth
of steel from the top of the slab. For an increase in the depth of steel from 3 to 4.5 inches the
CRCP punchout increases from 12 to 34.7 per mile. Thus the depth of steel has a significant
effect on the CRCP punchout cracks. Also the since the number of punchouts per mile at the end
of the design life for the given range of steel depths are more than the allowable number of 10
Design Life = 30 years AADTT = 2500 Slab Thickness = 9 in Base Layer thickness = 4in Subbase layer thickness = 12 in Slab Modulus = 4,954,161 psi Subbase Layer Modulus = 20,000 psi Subgrade Modulus = 13,000 psi

150
punchouts per mile of the pavement, a steel depth smaller than 3 inches from the top of the slab
will be required for the given pavement system.
13. CRCP Terminal IRI vs Uncompacted Subgrade Modulus
Sensitivity of Terminal IRI with Uncompacted Subgrade Modulus
122
122.5
123
123.5
124
10000 11000 12000 13000 14000 15000
Uncompacted Subgrade Layer Modulus (psi)
Term
inal
IRI (
in/m
ile)
Figure 101: Sensitivity of Terminal IRI with Uncompacted Subgrade Modulus
The plot of Terminal IRI with Subgrade Modulus is shown in Figure 101. From the figure
it can be seen that the Terminal IRI decreases from 123.5 to 122.8 in/mile as the Subgrade
Modulus is increased from 10,000 psi to 14,000 psi, However, it increases from 122.8 in/mile to
123.8 in/mile as the Subgrade Modulus is increased from 14,000 psi to 15,000 psi which is
unrealistic and not expected. Overall the uncompacted subgrade has only a minor effect on the
Terminal IRI of the pavement.
Design Life = 30 years AADTT = 2500 Slab Thickness = 9 in Base Layer thickness = 4in Subbase layer thickness = 12 in Slab Modulus = 4,954,161 psi Subgrade Modulus = 13,000 psi

151
14. CRCP Punchouts vs Uncompacted Subgrade Modulus
Sensitivity of CRCP Punchouts with Subgrade Modulus
30
30.2
30.4
30.6
30.8
31
31.2
31.4
31.6
31.8
32
10000 10500 11000 11500 12000 12500 13000 13500 14000 14500 15000
Subgrade Modulus (psi0
Punc
hout
s (p
er m
ile)
Figure 102: Sensitivity of CRCP Punchouts with Subgrade Modulus
The plot of CRCP Punchouts versus Uncompacted Subgrade Modulus is shown in Figure
102. From the figure it can be seen that the number of Punchouts decreases from 30.9 to 30.5 as
the Subgrade Modulus is increased from 10,000 psi to 14,000 psi, however, it increases from
30.5 to 31 as the Subgrade Modulus is increased from 14,000 psi to 15,000 psi. The number of
punchouts for the given range of subgrade modulus at the end of the design life exceeds the
allowable number of punchouts of 10 per mile. Overall, the Subgrade Modulus has only a minor
effect on the number of Punchouts per mile of the pavement.
Design Life = 30 years AADTT = 2500 Slab Thickness = 9 in Base Layer thickness = 4in Subbase layer thickness = 12 in Slab Modulus = 4,954,161 psi Subgrade Modulus = 13,000 psi
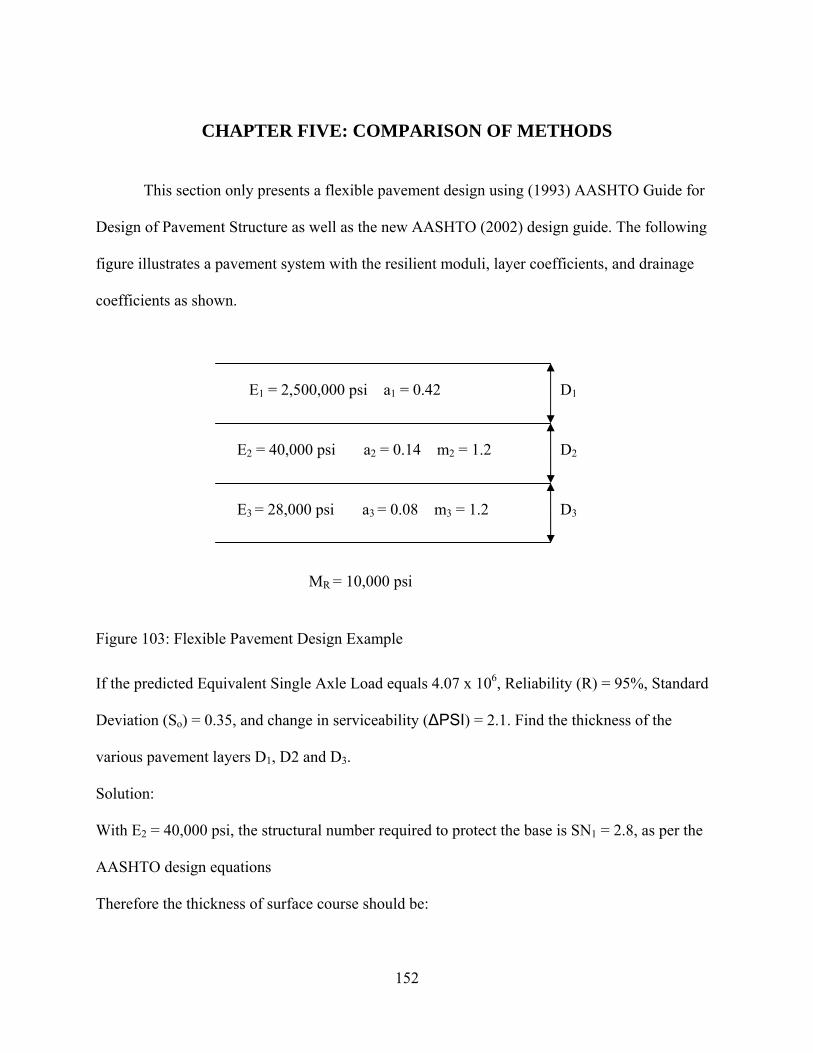
152
CHAPTER FIVE: COMPARISON OF METHODS
This section only presents a flexible pavement design using (1993) AASHTO Guide for
Design of Pavement Structure as well as the new AASHTO (2002) design guide. The following
figure illustrates a pavement system with the resilient moduli, layer coefficients, and drainage
coefficients as shown.
Figure 103: Flexible Pavement Design Example
If the predicted Equivalent Single Axle Load equals 4.07 x 10⁶, Reliability (R) = 95%, Standard
Deviation (So) = 0.35, and change in serviceability (ΔPSI) = 2.1. Find the thickness of the
various pavement layers D1, D2 and D3.
Solution:
With E2 = 40,000 psi, the structural number required to protect the base is SN1 = 2.8, as per the
AASHTO design equations
Therefore the thickness of surface course should be:
D1
D2
D3
MR = 10,000 psi
E2 = 40,000 psi a2 = 0.14 m2 = 1.2
E3 = 28,000 psi a3 = 0.08 m3 = 1.2
E1 = 2,500,000 psi a1 = 0.42

153
D1SN1a1
≥
D1
2.80.42
≥
D1 6.7≥
Use D1 = 7 in.
With E3 = 28,000 psi, the structural number required to protect subbase, SN2 = 3.3 as per the
AASHTO design equations for flexible pavements.
The thickness of the layer 2 i.e. base course is given by
D2SN2 a1 D1⋅−
a2 m2⋅≥
D23.2 0.42 7⋅−
0.14 1.2⋅≥
D2 1.55≥
It is generally impractical and uneconomical to use layers of material that are less than
some minimum thickness. Furthermore, the traffic conditions may dictate the use of a certain
minimum level of thickness for stability. The minimum thickness required for base layer is 6
inches for traffic of 2 x 10⁶ to 7 x 10⁶ (ESAL) applications.
Therefore use D2 = 6 in.
For Modulus of subgrade, MR = 10,000 psi, the total structural number, SN3 = 4.8.
The thickness of layer 3 i.e. subbase course is given as:
D3SN3 a1 D1⋅− a2 D2⋅ m3⋅−
a3 m3⋅≥

154
D34.8 0.42 7⋅− 0.14 6⋅ 1.2⋅−
0.08 1.2⋅≥
D3 8.87≥
Use D3 = 9 in.
Therefore, for a 20 year performance period for the given pavement configuration, the thickness
of surface, base and subbase layers used should be 7 in, 6 in and 9 in respectively as per (1993)
AASHTO guide for pavement structures.
If the material properties used in the above example and the design thicknesses obtained
are used for analysis using AASHTO 2002 design guide software, the following distresses are
predicted at the end of the 20 years design life.
1. Terminal IRI (in/mile) = 88 at (99.99% reliability)
2. AC surface down cracking (ft/mile) = 110 at (71.12% reliability)
3. AC bottom up cracking (%) = 1.4 at (99.99% reliability)
4. AC Thermal Fracture (ft/mile) = 1 at (99.99% reliability)
5. AC Permanent Deformation (in) = 0.23 at (59.29% reliability)
6. Permanent Deformation (Total Pavement) (in) = 0.46 in at (99.6 % reliability)
These distresses do not exceed the general maximum allowable limits at the end of 20 years of
design life. It is difficult to draw a comparison between the 1993 AASHTO design procedure and
the new AASHTO 2002 design methodology because of the different inputs involved and
difference in the design approach. The new method is much more comprehensive and
mechanistic as compared to the 1993 AASHTO design equation method.
The equivalent single axle load approach used for traffic characterization in previous
versions of the AASHTO guide for pavement design is not needed for analysis presented in this

155
AASHTO 2002 guide. The 2002 design guide software outputs on a monthly basis the cumulated
number of heavy trucks in the design lane as an overall indicator of the magnitude of truck traffic
loadings. The cumulated number of heavy trucks in the design lane can be considered as the
general indicator of the level of truck traffic.
In addition, in the 1993 AASHTO Guide, the modulus of asphalt concrete is directly used
as input for the design. However, in the 2002 AASHTO Design Guide, the dynamic modulus
(E*) of asphalt concrete is determined by using the various inputs such as the asphalt mix
properties (aggregate gradation), asphalt binder (superpave binder grading, conventional
viscosity grade or conventional penetration grade), volumetric effective binder content, air voids
and reference temperature for master curve development. A master curve of E* versus reduced
time derived from this data defines the behavior of this layer under loading and at various
climatic conditions.
The new 2002 AASHTO Design Guide also addresses the effect of various climatic
conditions on pavement performance. The 1993 AASHTO Design Guide relates the thickness of
the pavement surface layers to serviceability. However pavements may fail prematurely for
reasons not directly related to pavement thickness like rutting, thermal cracking, faulting etc.
These issues are addressed in the new 2002 AASHTO Design Guide.
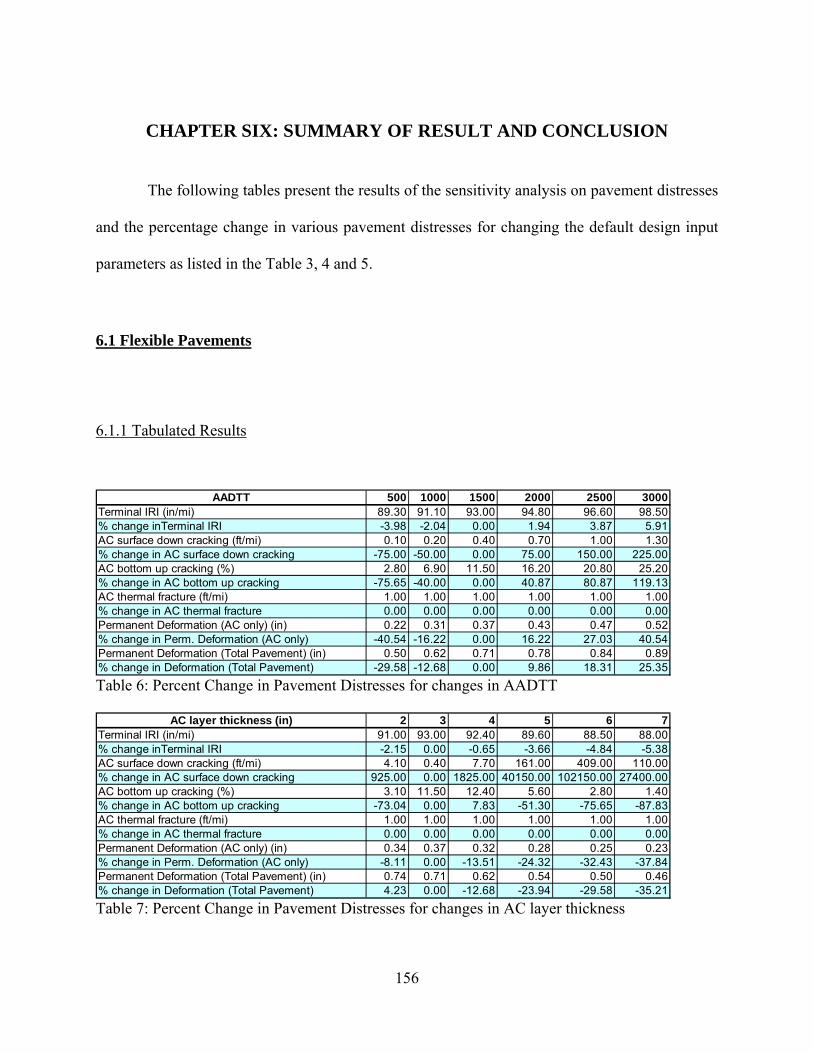
156
CHAPTER SIX: SUMMARY OF RESULT AND CONCLUSION
The following tables present the results of the sensitivity analysis on pavement distresses
and the percentage change in various pavement distresses for changing the default design input
parameters as listed in the Table 3, 4 and 5.
6.1 Flexible Pavements
6.1.1 Tabulated Results
AADTT 500 1000 1500 2000 2500 3000
Terminal IRI (in/mi) 89.30 91.10 93.00 94.80 96.60 98.50% change inTerminal IRI -3.98 -2.04 0.00 1.94 3.87 5.91AC surface down cracking (ft/mi) 0.10 0.20 0.40 0.70 1.00 1.30% change in AC surface down cracking -75.00 -50.00 0.00 75.00 150.00 225.00AC bottom up cracking (%) 2.80 6.90 11.50 16.20 20.80 25.20% change in AC bottom up cracking -75.65 -40.00 0.00 40.87 80.87 119.13AC thermal fracture (ft/mi) 1.00 1.00 1.00 1.00 1.00 1.00% change in AC thermal fracture 0.00 0.00 0.00 0.00 0.00 0.00Permanent Deformation (AC only) (in) 0.22 0.31 0.37 0.43 0.47 0.52% change in Perm. Deformation (AC only) -40.54 -16.22 0.00 16.22 27.03 40.54Permanent Deformation (Total Pavement) (in) 0.50 0.62 0.71 0.78 0.84 0.89% change in Deformation (Total Pavement) -29.58 -12.68 0.00 9.86 18.31 25.35 Table 6: Percent Change in Pavement Distresses for changes in AADTT
AC layer thickness (in) 2 3 4 5 6 7Terminal IRI (in/mi) 91.00 93.00 92.40 89.60 88.50 88.00% change inTerminal IRI -2.15 0.00 -0.65 -3.66 -4.84 -5.38AC surface down cracking (ft/mi) 4.10 0.40 7.70 161.00 409.00 110.00% change in AC surface down cracking 925.00 0.00 1825.00 40150.00 102150.00 27400.00AC bottom up cracking (%) 3.10 11.50 12.40 5.60 2.80 1.40% change in AC bottom up cracking -73.04 0.00 7.83 -51.30 -75.65 -87.83AC thermal fracture (ft/mi) 1.00 1.00 1.00 1.00 1.00 1.00% change in AC thermal fracture 0.00 0.00 0.00 0.00 0.00 0.00Permanent Deformation (AC only) (in) 0.34 0.37 0.32 0.28 0.25 0.23% change in Perm. Deformation (AC only) -8.11 0.00 -13.51 -24.32 -32.43 -37.84Permanent Deformation (Total Pavement) (in) 0.74 0.71 0.62 0.54 0.50 0.46% change in Deformation (Total Pavement) 4.23 0.00 -12.68 -23.94 -29.58 -35.21 Table 7: Percent Change in Pavement Distresses for changes in AC layer thickness
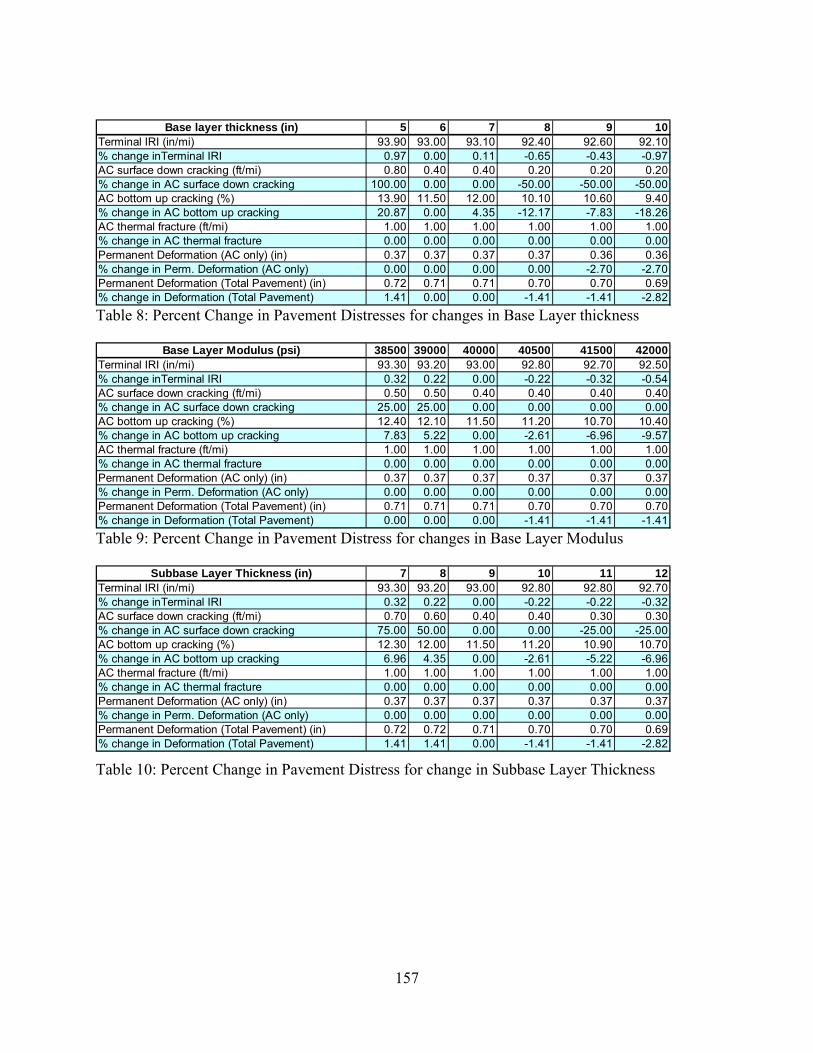
157
Base layer thickness (in) 5 6 7 8 9 10Terminal IRI (in/mi) 93.90 93.00 93.10 92.40 92.60 92.10% change inTerminal IRI 0.97 0.00 0.11 -0.65 -0.43 -0.97AC surface down cracking (ft/mi) 0.80 0.40 0.40 0.20 0.20 0.20% change in AC surface down cracking 100.00 0.00 0.00 -50.00 -50.00 -50.00AC bottom up cracking (%) 13.90 11.50 12.00 10.10 10.60 9.40% change in AC bottom up cracking 20.87 0.00 4.35 -12.17 -7.83 -18.26AC thermal fracture (ft/mi) 1.00 1.00 1.00 1.00 1.00 1.00% change in AC thermal fracture 0.00 0.00 0.00 0.00 0.00 0.00Permanent Deformation (AC only) (in) 0.37 0.37 0.37 0.37 0.36 0.36% change in Perm. Deformation (AC only) 0.00 0.00 0.00 0.00 -2.70 -2.70Permanent Deformation (Total Pavement) (in) 0.72 0.71 0.71 0.70 0.70 0.69% change in Deformation (Total Pavement) 1.41 0.00 0.00 -1.41 -1.41 -2.82 Table 8: Percent Change in Pavement Distresses for changes in Base Layer thickness
Base Layer Modulus (psi) 38500 39000 40000 40500 41500 42000Terminal IRI (in/mi) 93.30 93.20 93.00 92.80 92.70 92.50% change inTerminal IRI 0.32 0.22 0.00 -0.22 -0.32 -0.54AC surface down cracking (ft/mi) 0.50 0.50 0.40 0.40 0.40 0.40% change in AC surface down cracking 25.00 25.00 0.00 0.00 0.00 0.00AC bottom up cracking (%) 12.40 12.10 11.50 11.20 10.70 10.40% change in AC bottom up cracking 7.83 5.22 0.00 -2.61 -6.96 -9.57AC thermal fracture (ft/mi) 1.00 1.00 1.00 1.00 1.00 1.00% change in AC thermal fracture 0.00 0.00 0.00 0.00 0.00 0.00Permanent Deformation (AC only) (in) 0.37 0.37 0.37 0.37 0.37 0.37% change in Perm. Deformation (AC only) 0.00 0.00 0.00 0.00 0.00 0.00Permanent Deformation (Total Pavement) (in) 0.71 0.71 0.71 0.70 0.70 0.70% change in Deformation (Total Pavement) 0.00 0.00 0.00 -1.41 -1.41 -1.41 Table 9: Percent Change in Pavement Distress for changes in Base Layer Modulus
Subbase Layer Thickness (in) 7 8 9 10 11 12Terminal IRI (in/mi) 93.30 93.20 93.00 92.80 92.80 92.70% change inTerminal IRI 0.32 0.22 0.00 -0.22 -0.22 -0.32AC surface down cracking (ft/mi) 0.70 0.60 0.40 0.40 0.30 0.30% change in AC surface down cracking 75.00 50.00 0.00 0.00 -25.00 -25.00AC bottom up cracking (%) 12.30 12.00 11.50 11.20 10.90 10.70% change in AC bottom up cracking 6.96 4.35 0.00 -2.61 -5.22 -6.96AC thermal fracture (ft/mi) 1.00 1.00 1.00 1.00 1.00 1.00% change in AC thermal fracture 0.00 0.00 0.00 0.00 0.00 0.00Permanent Deformation (AC only) (in) 0.37 0.37 0.37 0.37 0.37 0.37% change in Perm. Deformation (AC only) 0.00 0.00 0.00 0.00 0.00 0.00Permanent Deformation (Total Pavement) (in) 0.72 0.72 0.71 0.70 0.70 0.69% change in Deformation (Total Pavement) 1.41 1.41 0.00 -1.41 -1.41 -2.82 Table 10: Percent Change in Pavement Distress for change in Subbase Layer Thickness
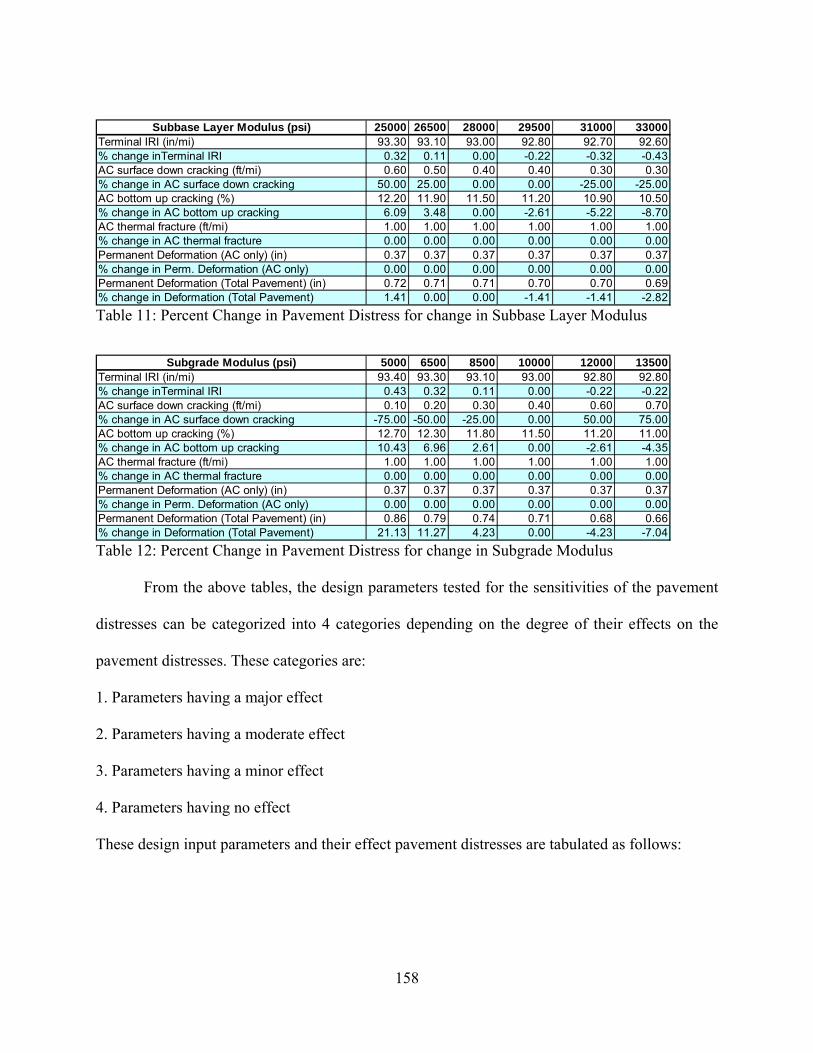
158
Subbase Layer Modulus (psi) 25000 26500 28000 29500 31000 33000Terminal IRI (in/mi) 93.30 93.10 93.00 92.80 92.70 92.60% change inTerminal IRI 0.32 0.11 0.00 -0.22 -0.32 -0.43AC surface down cracking (ft/mi) 0.60 0.50 0.40 0.40 0.30 0.30% change in AC surface down cracking 50.00 25.00 0.00 0.00 -25.00 -25.00AC bottom up cracking (%) 12.20 11.90 11.50 11.20 10.90 10.50% change in AC bottom up cracking 6.09 3.48 0.00 -2.61 -5.22 -8.70AC thermal fracture (ft/mi) 1.00 1.00 1.00 1.00 1.00 1.00% change in AC thermal fracture 0.00 0.00 0.00 0.00 0.00 0.00Permanent Deformation (AC only) (in) 0.37 0.37 0.37 0.37 0.37 0.37% change in Perm. Deformation (AC only) 0.00 0.00 0.00 0.00 0.00 0.00Permanent Deformation (Total Pavement) (in) 0.72 0.71 0.71 0.70 0.70 0.69% change in Deformation (Total Pavement) 1.41 0.00 0.00 -1.41 -1.41 -2.82 Table 11: Percent Change in Pavement Distress for change in Subbase Layer Modulus
Subgrade Modulus (psi) 5000 6500 8500 10000 12000 13500
Terminal IRI (in/mi) 93.40 93.30 93.10 93.00 92.80 92.80% change inTerminal IRI 0.43 0.32 0.11 0.00 -0.22 -0.22AC surface down cracking (ft/mi) 0.10 0.20 0.30 0.40 0.60 0.70% change in AC surface down cracking -75.00 -50.00 -25.00 0.00 50.00 75.00AC bottom up cracking (%) 12.70 12.30 11.80 11.50 11.20 11.00% change in AC bottom up cracking 10.43 6.96 2.61 0.00 -2.61 -4.35AC thermal fracture (ft/mi) 1.00 1.00 1.00 1.00 1.00 1.00% change in AC thermal fracture 0.00 0.00 0.00 0.00 0.00 0.00Permanent Deformation (AC only) (in) 0.37 0.37 0.37 0.37 0.37 0.37% change in Perm. Deformation (AC only) 0.00 0.00 0.00 0.00 0.00 0.00Permanent Deformation (Total Pavement) (in) 0.86 0.79 0.74 0.71 0.68 0.66% change in Deformation (Total Pavement) 21.13 11.27 4.23 0.00 -4.23 -7.04 Table 12: Percent Change in Pavement Distress for change in Subgrade Modulus
From the above tables, the design parameters tested for the sensitivities of the pavement
distresses can be categorized into 4 categories depending on the degree of their effects on the
pavement distresses. These categories are:
1. Parameters having a major effect
2. Parameters having a moderate effect
3. Parameters having a minor effect
4. Parameters having no effect
These design input parameters and their effect pavement distresses are tabulated as follows:

159
Table 13: Sensitivity Analysis of Pavement Distresses Versus Pavement Design Parameters
Pavement Distress Design Parameters
Terminal IRI
AC Surface Down
Cracking
AC Bottom
up Cracking
AC Thermal Cracking
Permanent Deformation
(AC only)
Permanent Deformation
(Total Pavement)
AADTT Minor Minor Major No Major Major AC layer thickness
Minor Major Major No Major Major
Base Layer thickness
Minor Minor Moderate No Minor Minor
Base Layer Modulus
Minor Minor Minor No No Minor
Subbase Layer Thickness
Minor Minor Minor No No Minor
Subbase Layer Modulus
Minor Minor Minor No No Minor
Subgrade Modulus
Minor Minor Minor No No Moderate
6.1.2 Conclusions on Flexible Pavement
The findings and conclusions presented in this section are applicable to all the material
properties, pavement profiles and environmental conditions used in the example problem
discussed in Section 4.1 of this paper.
The sensitivity analysis of the AASHTO 2002 Guide shows that the terminal
international roughness index of the pavement is not too sensitive to the various design
parameters used in the analysis. This is because the terminal IRI depends on the other distresses
that occur in the pavement which in turn depends directly on the pavement design parameters.
Thus, Terminal IRI can be controlled by controlling the other distresses in the pavement like AC
surface down cracking, AC bottom up cracking, rutting and thermal fracture.

160
From the results of sensitivity analysis, it appears that the AC surface down cracking
model is sensitive to all the design parameters considered in the sensitivity analysis in a minor
way. However it is very sensitive to the change in AC layer thickness. It also reveals two
contradicted theories (facts). First, an increase in the subgrade modulus results in an increase in
the AC surface down cracking, which is very unrealistic and not conceptual. With the increase in
stiffness of the subgrade, it is expected that the AC surface cracking should reduce as a stronger
subgrade will provide a greater support to the overlying layers. Second, an increase in the AC
layer thickness from 3 to 6 inches resulted in an increase of the AC surface down cracking,
which is again not realistic pavement function. The AC surface down cracking remains almost
constant when various base layer thicknesses and moduli are used for analysis. Because of these
misleading results, the implementation of AASHTO 2002 guide for flexible pavement design the
AC surface down cracking model must be carefully examined, or the revision of 2002 AASHTO
Design Guide is needed.
From the analysis, it is observed that the AC bottom up cracking is most sensitive to the
parameters of AADTT and AC layer thickness, and there is little effect by the other design
parameters such as the base and subbase layer thickness, and the modulus of the subgrade
material.
It is also observed that the AC bottom up cracking increases with the increase in the AC
layer thickness from 2 to 4 inches but then decreases as the AC layer thickness increases beyond
4 inches. The conclusion that can be drawn from this observation is that for a good pavement
performance, the proper thickness of the AC layer must be as thick as possible. It can be seen
that the greatest potential for AC bottom up cracking is associated with AC thickness in the
ranges of 3 to 5 inches.

161
The permanent deformation of the AC layer is mostly influenced by the AADTT and the
AC layer thickness. Surprisingly, all the results show that the change in base, subbase and
subgrade properties have almost no effect on the pavement deformation which is not quite
realistic. The pavement deformation model should be further reviewed to address this
discrepancy. The permanent deformation of the total pavement is mostly influenced by the
AADTT and the AC layer thickness. The other parameters including the base subbase and
subgrade properties have a minor influence on the total pavement deformation. Permanent
deformation of the total pavement is a product of cumulative ruts occurring in all layers of the
pavement system. From analysis of permanent deformation in total pavement, using the design
inputs shown in Figure 7, a total permanent deformation of 0.89 inches was cumulated by 0.52
inches (58%) of AC layer, 0.07 inches (8%) of base layer and 0.30 inches (36%) of subgrade
layer.
The comparative analysis of the Terminal international roughness index with AC layer
thickness using two types of subgrade modulus shows that using a larger subgrade modulus does
not result in smaller Terminal IRI. Similarly, it was also found that the use of larger subgrade
modulus resulted in greater pavement fatigue cracking. This draws to the conclusion that the
performance of the pavement depends on the combination of the asphalt layer thickness and the
subgrade modulus used for the design.
The results of the sensitivity analysis performed for this study do not completely agree
with the findings of study conducted by Masad (7). This study indicates that the base properties
have only a minor influence on the international roughness index, longitudinal cracking and
practically no influence on permanent deformation of the pavement. This discrepancy might be

162
due to the fact that the pavement design life of 10 years was used by Masad (7) in his study,
whereas in this study the pavement was analyzed based on a design life of 20 years.
The plot of asphalt sub-layers modulus versus time is presented as output by the
AASHTO 2002 Design guide software as shown in the Appendix. This plot appears confusing,
however it is explained clearly in the Design Guide Chapter Two of Part Two (Design Inputs).
The runtime for the analysis of flexible pavements using AASHTO 2002 Design Guide
software was about 24 minutes. The improvement of software execution may be needed.
6.2 Rigid Pavements
6.2.1 Tabulated Results (Jointed Plain Concrete Pavement)
AADTT 1500 2000 2500 3000 3500Terminal IRI (in/mile) 71.200 73.700 76.000 78.300 80.500% change in Terminal IRI -6.316 -3.026 0.000 3.026 5.921Transverse Cracking (%slabs cracked) 0.300 0.500 0.700 1.000 1.300% change in Transverse Cracking -57.143 -28.571 0.000 42.857 85.714Mean Joint Faulting (in) 0.015 0.019 0.023 0.027 0.031% Change in Mean Joint Faulting -34.783 -17.391 0.000 17.391 34.783 Table 14: Percentage change in JPCP pavement distresses for change in AADTT
Slab Thickness (in) 6 7 8 9 10 11 12Terminal IRI (in/mile) 147.800 84.400 76.000 73.800 72.200 70.500 68.900% change in Terminal IRI 94.474 11.053 0.000 -2.895 -5.000 -7.237 -9.342Transverse Cracking (%slabs cracked) 88.800 10.000 0.700 0.100 0.000 0.000 0.000% change in Transverse Cracking 12585.714 1328.571 0.000 -85.714 -100.000 -100.000 -100.000Mean Joint Faulting (in) 0.022 0.025 0.023 0.020 0.017 0.014 0.011% Change in Mean Joint Faulting -4.348 8.696 0.000 -13.043 -26.087 -39.130 -52.174 Table 15: Percent change in JPCP pavement distresses for change in Slab thickness
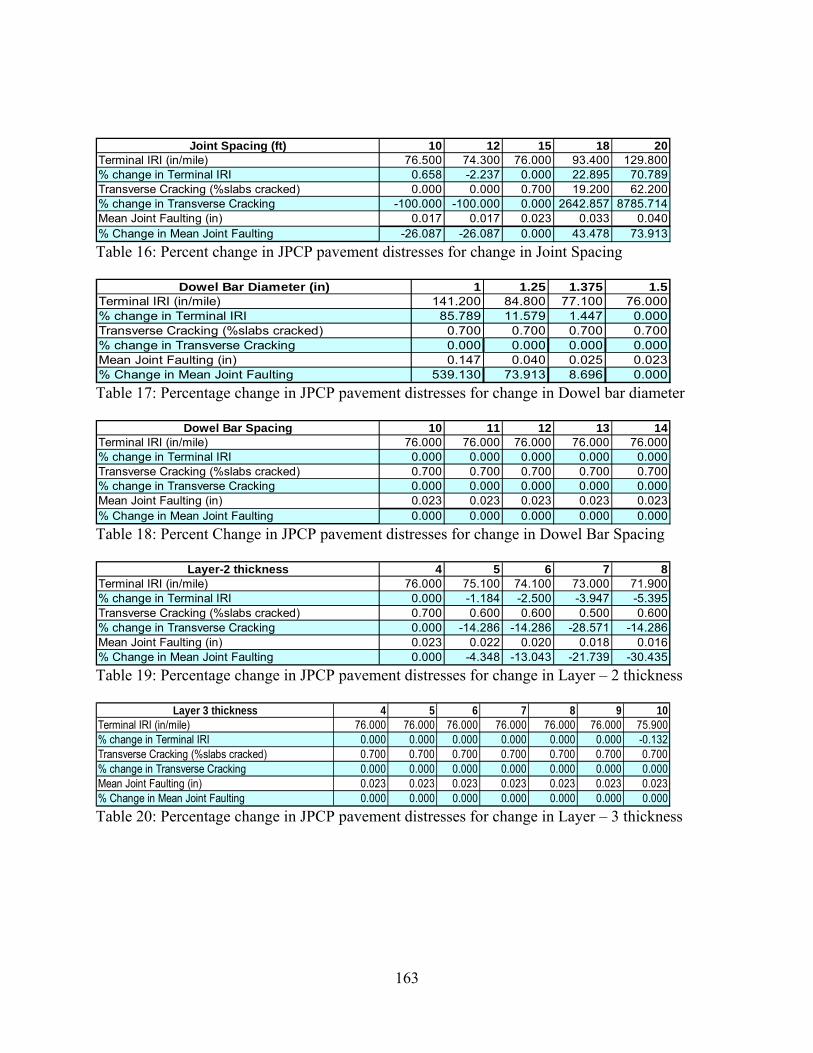
163
Joint Spacing (ft) 10 12 15 18 20
Terminal IRI (in/mile) 76.500 74.300 76.000 93.400 129.800% change in Terminal IRI 0.658 -2.237 0.000 22.895 70.789Transverse Cracking (%slabs cracked) 0.000 0.000 0.700 19.200 62.200% change in Transverse Cracking -100.000 -100.000 0.000 2642.857 8785.714Mean Joint Faulting (in) 0.017 0.017 0.023 0.033 0.040% Change in Mean Joint Faulting -26.087 -26.087 0.000 43.478 73.913 Table 16: Percent change in JPCP pavement distresses for change in Joint Spacing
Dowel Bar Diameter (in) 1 1.25 1.375 1.5Terminal IRI (in/mile) 141.200 84.800 77.100 76.000% change in Terminal IRI 85.789 11.579 1.447 0.000Transverse Cracking (%slabs cracked) 0.700 0.700 0.700 0.700% change in Transverse Cracking 0.000 0.000 0.000 0.000Mean Joint Faulting (in) 0.147 0.040 0.025 0.023% Change in Mean Joint Faulting 539.130 73.913 8.696 0.000 Table 17: Percentage change in JPCP pavement distresses for change in Dowel bar diameter
Dowel Bar Spacing 10 11 12 13 14Terminal IRI (in/mile) 76.000 76.000 76.000 76.000 76.000% change in Terminal IRI 0.000 0.000 0.000 0.000 0.000Transverse Cracking (%slabs cracked) 0.700 0.700 0.700 0.700 0.700% change in Transverse Cracking 0.000 0.000 0.000 0.000 0.000Mean Joint Faulting (in) 0.023 0.023 0.023 0.023 0.023% Change in Mean Joint Faulting 0.000 0.000 0.000 0.000 0.000 Table 18: Percent Change in JPCP pavement distresses for change in Dowel Bar Spacing
Layer-2 thickness 4 5 6 7 8Terminal IRI (in/mile) 76.000 75.100 74.100 73.000 71.900% change in Terminal IRI 0.000 -1.184 -2.500 -3.947 -5.395Transverse Cracking (%slabs cracked) 0.700 0.600 0.600 0.500 0.600% change in Transverse Cracking 0.000 -14.286 -14.286 -28.571 -14.286Mean Joint Faulting (in) 0.023 0.022 0.020 0.018 0.016% Change in Mean Joint Faulting 0.000 -4.348 -13.043 -21.739 -30.435 Table 19: Percentage change in JPCP pavement distresses for change in Layer – 2 thickness
Layer 3 thickness 4 5 6 7 8 9 10Terminal IRI (in/mile) 76.000 76.000 76.000 76.000 76.000 76.000 75.900% change in Terminal IRI 0.000 0.000 0.000 0.000 0.000 0.000 -0.132Transverse Cracking (%slabs cracked) 0.700 0.700 0.700 0.700 0.700 0.700 0.700% change in Transverse Cracking 0.000 0.000 0.000 0.000 0.000 0.000 0.000Mean Joint Faulting (in) 0.023 0.023 0.023 0.023 0.023 0.023 0.023% Change in Mean Joint Faulting 0.000 0.000 0.000 0.000 0.000 0.000 0.000 Table 20: Percentage change in JPCP pavement distresses for change in Layer – 3 thickness

164
Layer - 4 Modulus 8000 12000 18,000 20,000 24000Terminal IRI (in/mile) 78.300 77.200 76.000 74.800 71.900% change in Terminal IRI 3.026 1.579 0.000 -1.579 -5.395Transverse Cracking (%slabs cracked) 1.000 0.800 0.700 0.700 0.800% change in Transverse Cracking 42.857 14.286 0.000 0.000 14.286Mean Joint Faulting (in) 0.027 0.025 0.023 0.021 0.015% Change in Mean Joint Faulting 17.391 8.696 0.000 -8.696 -34.783 Table 21: Percent Change in JPCP pavement distresses for change in layer 4 Modulus
Tied / Untied PCC Shoulder Tied PCC SNot tied to PCCTerminal IRI (in/mile) 72.400 76.000% change in Terminal IRI -4.737 0.000Transverse Cracking (%slabs cracked) 0.100 0.700% change in Transverse Cracking -85.714 0.000Mean Joint Faulting (in) 0.017 0.023% Change in Mean Joint Faulting -26.087 0.000 Table 22: Percentage change in JPCP pavement distresses for Tied/Untied PCC Shoulder
Base Modulus (psi) 1250000 1500000 1789845 2000000 2500000 3000000Terminal IRI (in/mile) 76.400 76.200 76.000 75.900 75.900 75.800% change in Terminal IRI 0.526 0.263 0.000 -0.132 -0.132 -0.263Transverse Cracking (%slabs cracked) 0.800 0.700 0.700 0.700 0.700 0.700% change in Transverse Cracking 14.286 0.000 0.000 0.000 0.000 0.000Mean Joint Faulting (in) 0.024 0.024 0.230 0.023 0.023 0.023% Change in Mean Joint Faulting -89.565 -89.565 0.000 -96.714 -90.000 -90.000 Table 23: Percentage change in JPCP pavement distresses for change in Base Modulus
Table 24: Sensitivity of pavement distresses with change in JPCP pavement design parameters Pavement Distress Design Parameter Terminal IRI Transverse Cracking Mean Joint Faulting
AADTT Minor Minor Minor Slab Thickness Major Major Moderate Joint Spacing Major Major Moderate
Dowel Bar Spacing No No No Dowel Bar Diameter Major No Major Base Layer Thickness Minor Minor Minor
Subbase Layer thickness Minor No No Subgrade Modulus Minor Minor Minor
Tied/ Untied PCC Shoulder Minor Minor Minor Base Modulus Minor Minor Minor

165
6.2.2 Conclusions on Jointed Plain Concrete Pavement (JPCP)
From the results of the sensitivity analysis of the AASHTO 2002 design guide it can be
concluded that the JPCP pavement distresses: Terminal international roughness index,
Transverse Cracking and Mean Joint Faulting are mostly influenced by the PCC slab thickness,
joint spacing and the dowel bar diameter. The change in subbase thickness has no effect on the
pavement distresses. Similarly change in dowel bar spacing has no effect on the pavement
distresses. These findings are applicable only to the pavement design example discussed in
chapter 4 of this paper.
From the analyses, it can also be concluded that the use of tied PCC shoulder will help in
reducing the transverse cracking of the slab. The joint spacing of greater than 15 ft results in a
sharp increase in the pavement distresses, therefore a joint spacing of 15 ft or less is
recommended to keep the pavement distresses under control. The use of a slab thickness equal to
or greater than 8 inches is recommended as it will reduce the transverse cracking in slab to less
than 1%.
From the Figure 64 it can be seen that Mean Joint Faulting increases from 0.022 inch to
0.025 inch as the slab thickness is increased from 6 to 7 inches. This is not conventional as with
the increase in slab thickness the amount of distresses should decrease. Therefore the distress
model for Mean Joint Faulting must be reviewed to address this discrepancy. With the increase
in base layer thickness from 5 to 6 inches, the predicted transverse cracking remained constant at
0.6% as seen in Figure 75. From the same figure it can be seen that the transverse cracking
increases from 0.5% to 0.6% with the increase in base layer thickness from 7 to 8 inches. This
discrepancy in the model for predicting transverse cracking for JPCP should be reviewed.

166
It can also be noted from Figure 87 and 88 that the Transverse Cracking and Mean Joint
Faulting remain constant with the increase in the base layer modulus from 1.7 Mpsi to 3 Mpsi.
This is not realistic, as it is expected that with a stronger base, the pavement distresses should
decrease. Therefore, the Mean Joint Faulting model also needs to be reviewed further before
implementing the AASHTO 2002 Design Guide for design of JPCP pavements.
6.2.3 Tabulated Results (Continuous Reinforced Concrete Pavement)
AADTT 1500 2000 2500 3000 3500Terminal IRI (in/mile) 70.600 93.000 122.900 138.000 147.200% change in Terminal IRI -42.555 -24.329 0.000 12.286 19.772Number of Punchouts per mile 3.900 15.300 30.600 38.300 43.000% change in number of Punchouts per mile -87.255 -50.000 0.000 25.163 40.523 Table 25: Percentage change in CRCP pavement distresses for change in AADTT
Slab thickness (in) 8 9 10 11 12Terminal IRI (in/mile) 186.800 122.900 66.200 63.700 63.400% change in Terminal IRI 51.993 0.000 -46.135 -48.169 -48.413Number of Punchouts per mile 63.200 30.600 1.600 0.300 2.000% change in number of Punchouts per mile 106.536 0.000 -94.771 -99.020 -93.464 Table 26: Percentage change in CRCP pavement distresses for change in Slab Thickness
Base Layer Thickness (in) 4 5 6 7 8Terminal IRI (in/mile) 122.900 122.000 120.800 120.500 118.700% change in Terminal IRI 0.000 -0.732 -1.709 -1.953 -3.417Number of Punchouts per mile 30.600 30.100 29.500 29.300 28.400% change in number of Punchouts per mile 0.000 -1.634 -3.595 -4.248 -7.190 Table 27: Percentage change in CRCP pavement distresses for change in Base Layer Thickness
Compacted Subgrade Thickness (in) 10 11 12 13 14Terminal IRI (in/mile) 123.000 123.000 122.900 122.900 122.900% change in Terminal IRI 0.081 0.081 0.000 0.000 0.000Number of Punchouts per mile 30.600 30.600 30.600 30.600 30.600% change in number of Punchouts per mile 0.000 0.000 0.000 0.000 0.000 Table 28: Percentage change in CRCP pavement distresses for change in Compacted Subgrade Layer Thickness

167
Percent Steel 0.4 0.5 0.6 0.7 0.8Terminal IRI (in/mile) 159.400 149.900 122.900 67.400 65.500% change in Terminal IRI 29.699 21.969 0.000 -45.159 -46.705Number of Punchouts per mile 49.200 44.400 30.600 2.200 1.300% change in number of Punchouts per mile 60.784 45.098 0.000 -92.810 -95.752 Table 29: Percentage change in CRCP pavement distresses for change in Percent Steel
Steel Depth (in) 3 3.5 4 4.5Terminal IRI (in/mile) 86.600 108.300 122.900 131.000% change in Terminal IRI -29.536 -11.880 0.000 6.591Number of Punchouts per mile 12.000 23.100 30.600 34.700% change in number of Punchouts per mile -60.784 -24.510 0.000 13.399 Table 30: Percentage change in CRCP pavement distresses for change in Steel Depth
Uncompacted Subgrade Modulus (psi) 10000 12000 13000 14000 15000Terminal IRI (in/mile) 123.5 123.1 122.9 122.8 123.8% change in Terminal IRI 0.49 0.16 0.00 -0.08 0.73Number of Punchouts per mile 30.9 30.7 30.6 30.5 31% change in number of Punchouts per mile 0.98 0.33 0.00 -0.33 1.31 Table 31: Percentage change in CRCP pavement distresses for change in Uncompacted Subgrade Modulus
Table 32: Sensitivity of pavement distresses with changes in CRCP pavement design parameters
Pavement Distress Design Parameters Terminal IRI CRCP Punchouts
AADTT Major Major Slab Thickness Moderate Major Base Thickness Minor Minor Compacted Subgrade Layer Thickness
No No
Percent Steel Used Moderate Major Steel Depth Moderate Major Uncompacted Subgrade Modulus
Minor Minor
6.2.4 Conclusions on Continuous Reinforced Concrete Pavement (CRCP)
From the results of the sensitivity analyses, it can be concluded that the CRCP pavement
distresses: terminal IRI and Punchouts are highly sensitive to the design parameters like
AADTT, slab thickness and the percent and the depth of steel used.

168
It is also seen that the change in compacted subgrade layer thickness has almost no effect
on the terminal IRI or the number of punchouts of the pavement.
It is observed from Figure 91 and 92 that, as the slab thickness is increased from 8 to 10
inches there is a sharp decrease in the Terminal IRI and Number of Punchouts, and beyond a slab
thickness of 10 inches the pavement distresses remain almost constant. It can also be seen that
the number of pavement punchouts increases from 0.3 to 2 (per mile) as the slab thickness is
increased from 11 to 12 inches, which is not expected pavement behavior. Therefore the use of
slab thickness of 10 inches or greater is recommended to control the CRCP punchouts to less
than 2 per mile for the given pavement system.
It is also observed that the pavement terminal IRI and CRCP punchouts increase with the
increase in uncompacted subgrade modulus from 13,000 to 14,000 psi which is not realistic.
The CRCP punchout model needs careful review to address the above mentioned
discrepancies before AASHTO 2002 Design Guide can be implemented in practice.

169
APPENDIX: AASHTO 2002 SOFTWARE OUTPUT FOR FLEXIBLE PAVEMENT EXAMPLE

Input Summary: Project T-1
Limit Reliability75
200 901000 90
25 901000 900.25 900.75 90
15002
505060
Class 4 Class 5 Class 6 Class 7 Class 8 Class 9 Class 10 Class 11 Class 12 Class 131.00 1.00 1.00 1.00 1.00 1.00 1.00 1.00 1.00 1.00 1.00 1.00 1.00 1.00 1.00 1.00 1.00 1.00 1.00 1.00 1.00 1.00 1.00 1.00 1.00 1.00 1.00 1.00 1.00 1.00 1.00 1.00 1.00 1.00 1.00 1.00 1.00 1.00 1.00 1.00 1.00 1.00 1.00 1.00 1.00 1.00 1.00 1.00 1.00 1.00 1.00 1.00 1.00 1.00 1.00 1.00 1.00 1.00 1.00 1.00 1.00 1.00 1.00 1.00 1.00 1.00 1.00 1.00 1.00 1.00
Project: T-1
General Information Description:Design Life 20 yearsBase/Subgrade construction: September, 2005Pavement construction: September, 2005Traffic open: October, 2005Type of design Flexible
Analysis ParametersAnalysis type Probabilistic
Performance CriteriaInitial IRI (in/mi)Terminal IRI (in/mi)AC Surface Down Cracking (Long. Cracking) (ft/500):AC Bottom Up Cracking (Alligator Cracking) (%):AC Thermal Fracture (Transverse Cracking) (ft/mi):Permanent Deformation (AC Only) (in):Permanent Deformation (Total Pavement) (in):
Location: Orlando FLProject ID: Sensitivity Analysis - 1Section ID: 1.1
Principal Arterials - Interstate and Defense RoutesDate: 8/11/2005
Station/milepost format: Feet: 00 + 00Station/milepost begin: 05+00Station/milepost end: 10+00Traffic direction: North bound
Default Input LevelDefault input level Level 3, Default and historical agency values.
Traffic Initial two-way aadtt:Number of lanes in design direction:Percent of trucks in design direction (%):Percent of trucks in design lane (%):Operational speed (mph):
Traffic -- Volume Adjustment FactorsMonthly Adjustment Factors (Level 3, Default MAF)
Vehicle ClassMonth
JanuaryFebruaryMarchAprilMayJuneJuly
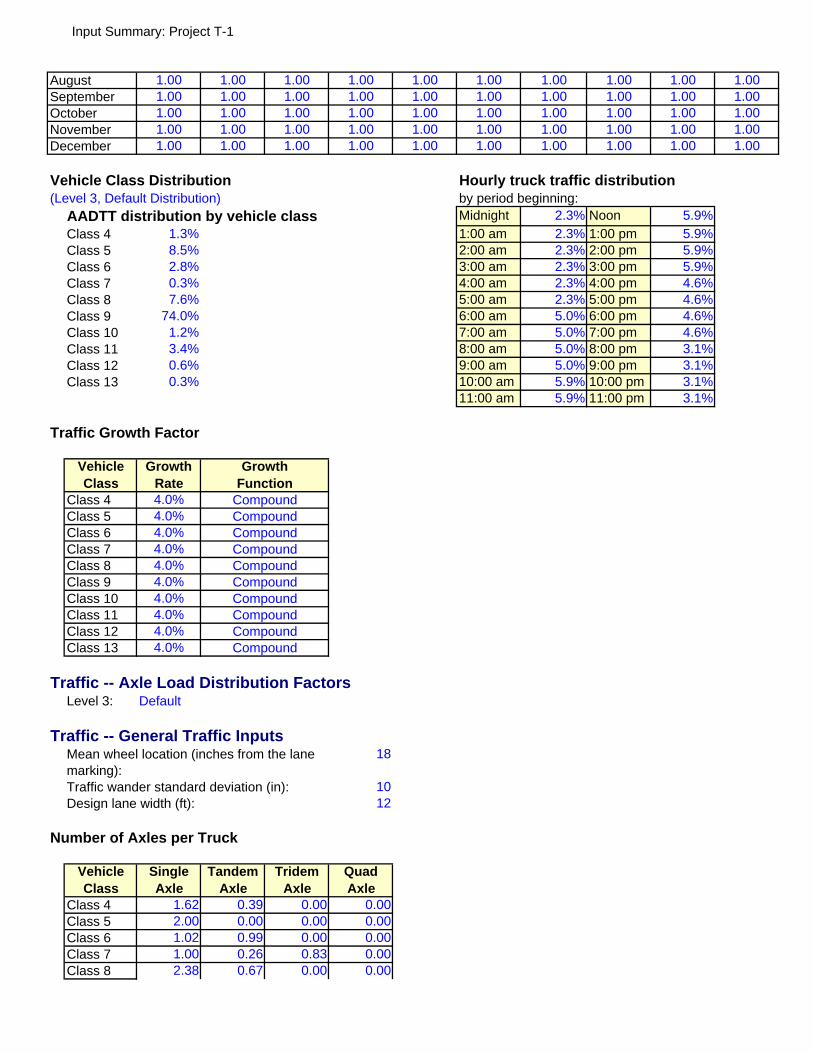
Input Summary: Project T-1
1.00 1.00 1.00 1.00 1.00 1.00 1.00 1.00 1.00 1.00 1.00 1.00 1.00 1.00 1.00 1.00 1.00 1.00 1.00 1.00 1.00 1.00 1.00 1.00 1.00 1.00 1.00 1.00 1.00 1.00 1.00 1.00 1.00 1.00 1.00 1.00 1.00 1.00 1.00 1.00 1.00 1.00 1.00 1.00 1.00 1.00 1.00 1.00 1.00 1.00
Midnight 2.3% Noon 5.9%1.3% 1:00 am 2.3% 1:00 pm 5.9%8.5% 2:00 am 2.3% 2:00 pm 5.9%2.8% 3:00 am 2.3% 3:00 pm 5.9%0.3% 4:00 am 2.3% 4:00 pm 4.6%7.6% 5:00 am 2.3% 5:00 pm 4.6%
74.0% 6:00 am 5.0% 6:00 pm 4.6%1.2% 7:00 am 5.0% 7:00 pm 4.6%3.4% 8:00 am 5.0% 8:00 pm 3.1%0.6% 9:00 am 5.0% 9:00 pm 3.1%0.3% 10:00 am 5.9% 10:00 pm 3.1%
11:00 am 5.9% 11:00 pm 3.1%
4.0%4.0%4.0%4.0%4.0%4.0%4.0%4.0%4.0%4.0%
18
1012
1.62 0.39 0.00 0.00 2.00 0.00 0.00 0.00 1.02 0.99 0.00 0.00 1.00 0.26 0.83 0.00 2.38 0.67 0.00 0.00
AugustSeptemberOctoberNovemberDecember
Vehicle Class Distribution Hourly truck traffic distribution(Level 3, Default Distribution) by period beginning:
AADTT distribution by vehicle classClass 4Class 5Class 6Class 7Class 8Class 9Class 10Class 11Class 12Class 13
Traffic Growth Factor
Vehicle Class
Growth Rate
GrowthFunction
Class 4 CompoundClass 5 CompoundClass 6 CompoundClass 7 CompoundClass 8 CompoundClass 9 CompoundClass 10 CompoundClass 11 CompoundClass 12 CompoundClass 13 Compound
Traffic -- Axle Load Distribution FactorsLevel 3: Default
Traffic -- General Traffic InputsMean wheel location (inches from the lane marking):Traffic wander standard deviation (in):Design lane width (ft):
Number of Axles per Truck
Quad Axle
Class 4Class 5Class 6
Vehicle Class
Single Axle
Tandem Axle
Tridem Axle
Class 7Class 8

Input Summary: Project T-1
1.13 1.93 0.00 0.00 1.19 1.09 0.89 0.00 4.29 0.26 0.06 0.00 3.52 1.14 0.06 0.00 2.15 2.13 0.35 0.00
8.5
12
120120
51.649.249.2
26.4-80.0911710
Class 9Class 10Class 11Class 12Class 13
Axle ConfigurationAverage axle width (edge-to-edge) outside dimensions,ft):Dual tire spacing (in):
Axle ConfigurationSingle Tire (psi):Dual Tire (psi):
Average Axle SpacingTandem axle(psi):Tridem axle(psi):Quad axle(psi):
Climate icm file:
C:\DG2002\Projects\florida.icmLatitude (degrees.minutes)Longitude (degrees.minutes)Elevation (ft)Depth of water table (ft)
Structure--Design Features
Structure--Layers Layer 1 -- Asphalt concrete
Material type: Asphalt concreteLayer thickness (in): 3
General PropertiesGeneralReference temperature (F°): 70
Volumetric Properties as BuiltEffective binder content (%): 12Air voids (%): 6Total unit weight (pcf): 143
Poisson's ratio: 0.35 (user entered)
Thermal PropertiesThermal conductivity asphalt (BTU/hr-ft-F°): 0.67Heat capacity asphalt (BTU/lb-F°): 0.23
Asphalt MixCumulative % Retained 3/4 inch sieve: 12Cumulative % Retained 3/8 inch sieve: 38Cumulative % Retained #4 sieve: 50

Input Summary: Project T-1
-10 -16 -22 -28 -34 -40 -46
Value11.11.830.51361
% Passing #200 sieve: 4
Asphalt BinderOption: Superpave binder gradingA 10.9800 (correlated)VTS: -3.6800 (correlated)
High temp.°C
Low temperature, °C
46525864707682
Layer 2 -- A-1-aUnbound Material: A-1-aThickness(in): 6
Strength PropertiesInput Level: Level 3Analysis Type: ICM inputs (ICM Calculated Modulus)Poisson's ratio: 0.35Coefficient of lateral pressure,Ko: 0.5Modulus (input) (psi): 40000
ICM InputsGradation and Plasticity IndexPlasticity Index, PI: 1Passing #200 sieve (%): 3Passing #4 sieve (%): 20D60 (mm): 8
Calculated/Derived ParametersMaximum dry unit weight (pcf): 122.2 (derived)Specific gravity of solids, Gs: 2.66 (derived)Saturated hydraulic conductivity (ft/hr): 263 (derived)Optimum gravimetric water content (%): 11.1 (derived)Calculated degree of saturation (%): 82 (calculated)
Soil water characteristic curve parameters: Default values
Parametersabc
Hr.
Layer 3 -- A-2-5Unbound Material: A-2-5

Input Summary: Project T-1
Value12.61.580.534412
Thickness(in): 9
Strength PropertiesInput Level: Level 3Analysis Type: ICM inputs (ICM Calculated Modulus)Poisson's ratio: 0.35Coefficient of lateral pressure,Ko: 0.5Modulus (input) (psi): 28000
ICM InputsGradation and Plasticity IndexPlasticity Index, PI: 2Passing #200 sieve (%): 20Passing #4 sieve (%): 80D60 (mm): 0.1
Calculated/Derived ParametersMaximum dry unit weight (pcf): 121.9 (derived)Specific gravity of solids, Gs: 2.68 (derived)Saturated hydraulic conductivity (ft/hr): 0.000866 (derived)Optimum gravimetric water content (%): 11.7 (derived)Calculated degree of saturation (%): 83.9 (calculated)
Soil water characteristic curve parameters: Default values
Parametersabc
Hr.
Layer 4 -- A-7-6Unbound Material: A-7-6Thickness(in): Semi-infinite
Strength PropertiesInput Level: Level 3Analysis Type: ICM inputs (ICM Calculated Modulus)Poisson's ratio: 0.35Coefficient of lateral pressure,Ko: 0.5Modulus (input) (psi): 10000
ICM InputsGradation and Plasticity IndexPlasticity Index, PI: 40Passing #200 sieve (%): 90Passing #4 sieve (%): 99D60 (mm): 0.01
Calculated/Derived ParametersMaximum dry unit weight (pcf): 91.3 (derived)Specific gravity of solids, Gs: 2.77 (derived)Saturated hydraulic conductivity (ft/hr): 3.25e-005 (derived)Optimum gravimetric water content (%): 28.8 (derived)

Input Summary: Project T-1
Value750
0.9110.77247500
0.004323.94921.281
-3.44881.56060.4791
5
11
1.673
1.35
73.501000
1
Calculated degree of saturation (%): 89.4 (calculated)
Soil water characteristic curve parameters: Default values
Parametersabc
Hr.
Distress Model Calibration Settings - Flexible AC Fatigue Level 3 (Nationally calibrated values)
k1k2k3
AC Rutting Level 3 (Nationally calibrated values)k1k2k3
Standard Deviation Total Rutting (RUT):
0.1587*POWER(RUT,0.4579)+0.001
Thermal Fracture Level 3 (Nationally calibrated values)k1
Std. Dev. (THERMAL): 0.2474 * THERMAL + 10.619
CSM Fatigue Level 3 (Nationally calibrated values)k1k2
Subgrade Rutting Level 3 (Nationally calibrated values)Granular:
k1Fine-grain:
k1
AC CrackingAC Top Down Cracking
C1 (top)C2 (top)C3 (top)C4 (top)
Standard Deviation (TOP) 200 + 2300/(1+exp(1.072-2.1654*log(TOP+0.0001)))
AC Bottom Up CrackingC1 (bottom)

Input Summary: Project T-1
106000
1101000
0.04630.001190.18340.003840.007360.001150.387
0.0099950.0005180.0023518.360.96940.292
0.007320.076470.0001450.008420.0002120.229
C2 (bottom)C3 (bottom)C4 (bottom)
Standard Deviation (TOP) 32.7 + 995.1 /(1+exp(2-2*log(BOTTOM+0.0001)))
CSM CrackingC1 (CSM)C2 (CSM)C3 (CSM)C4 (CSM)
Standard Deviation (CSM) CTB*1
IRIIRI Flexible Pavements with GB
C1 (GB)C2 (GB)C3 (GB)C4 (GB)C5 (GB)C6 (GB)Std. Dev (GB)
IRI Flexible Pavements with ATBC1 (ATB)C2 (ATB)C3 (ATB)C4 (ATB)C5 (ATB)Std. Dev (ATB)
C4 (CSM)C5 (CSM)Std. Dev (CSM)
IRI Flexible Pavements with CSMC1 (CSM)C2 (CSM)C3 (CSM)

Reliablity Summary: Project T-1
Distress Target
Reliablity Target
Distress Predicted
ReliabilityPredicted Acceptable
200 90 93 99.999 Pass
1000 90 0.4 99.93 Pass
25 90 11.5 87.63 Fail
1000 90 1 99.999 Pass0.25 90 0.37 11.83 Fail0.75 90 0.71 62.54 Fail
Project: T-1Reliability Summary
Performance Criteria
Terminal IRI (in/mi)
Permanent Deformation (Total Pavement) (in):
AC Surface Down Cracking (Long. Cracking) (ft/500):AC Bottom Up Cracking (Alligator Cracking) (%):AC Thermal Fracture (Transverse Cracking) (ft/mi):Permanent Deformation (AC Only) (in):
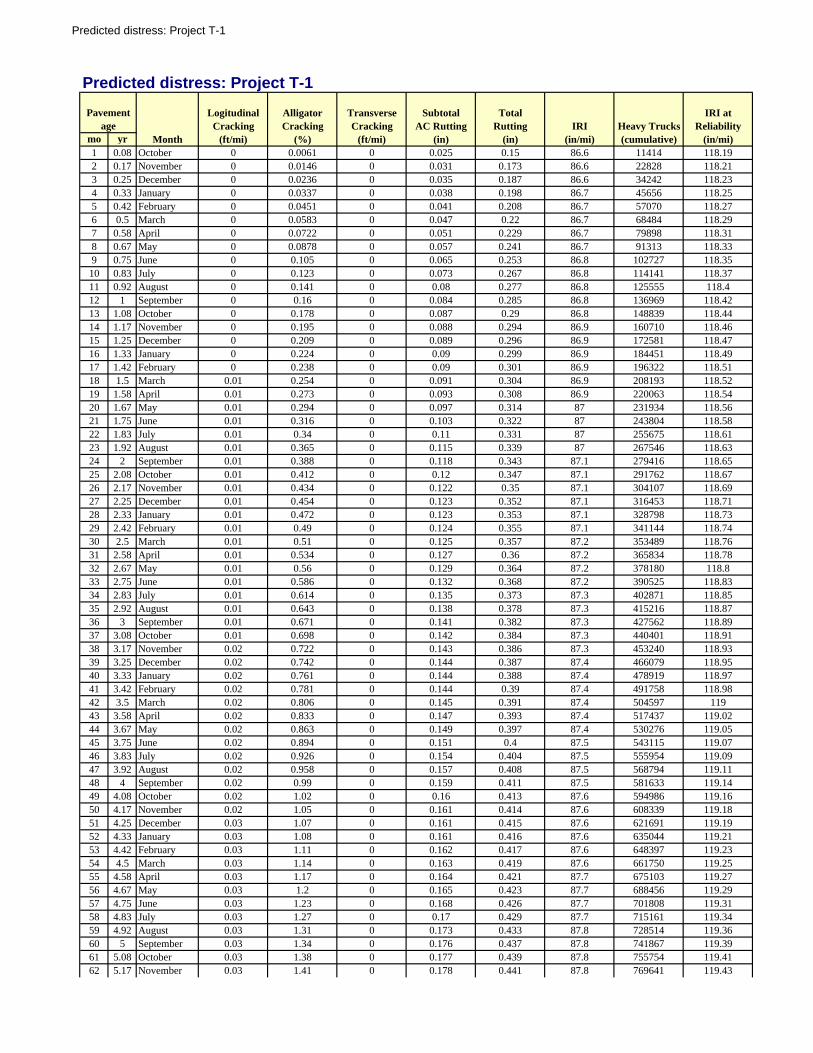
Predicted distress: Project T-1
mo yr1 0.08 October 0 0.0061 0 0.025 0.15 86.6 11414 118.192 0.17 November 0 0.0146 0 0.031 0.173 86.6 22828 118.213 0.25 December 0 0.0236 0 0.035 0.187 86.6 34242 118.234 0.33 January 0 0.0337 0 0.038 0.198 86.7 45656 118.255 0.42 February 0 0.0451 0 0.041 0.208 86.7 57070 118.276 0.5 March 0 0.0583 0 0.047 0.22 86.7 68484 118.297 0.58 April 0 0.0722 0 0.051 0.229 86.7 79898 118.318 0.67 May 0 0.0878 0 0.057 0.241 86.7 91313 118.339 0.75 June 0 0.105 0 0.065 0.253 86.8 102727 118.3510 0.83 July 0 0.123 0 0.073 0.267 86.8 114141 118.3711 0.92 August 0 0.141 0 0.08 0.277 86.8 125555 118.412 1 September 0 0.16 0 0.084 0.285 86.8 136969 118.4213 1.08 October 0 0.178 0 0.087 0.29 86.8 148839 118.4414 1.17 November 0 0.195 0 0.088 0.294 86.9 160710 118.4615 1.25 December 0 0.209 0 0.089 0.296 86.9 172581 118.4716 1.33 January 0 0.224 0 0.09 0.299 86.9 184451 118.4917 1.42 February 0 0.238 0 0.09 0.301 86.9 196322 118.5118 1.5 March 0.01 0.254 0 0.091 0.304 86.9 208193 118.5219 1.58 April 0.01 0.273 0 0.093 0.308 86.9 220063 118.5420 1.67 May 0.01 0.294 0 0.097 0.314 87 231934 118.5621 1.75 June 0.01 0.316 0 0.103 0.322 87 243804 118.5822 1.83 July 0.01 0.34 0 0.11 0.331 87 255675 118.6123 1.92 August 0.01 0.365 0 0.115 0.339 87 267546 118.6324 2 September 0.01 0.388 0 0.118 0.343 87.1 279416 118.6525 2.08 October 0.01 0.412 0 0.12 0.347 87.1 291762 118.6726 2.17 November 0.01 0.434 0 0.122 0.35 87.1 304107 118.6927 2.25 December 0.01 0.454 0 0.123 0.352 87.1 316453 118.7128 2.33 January 0.01 0.472 0 0.123 0.353 87.1 328798 118.7329 2.42 February 0.01 0.49 0 0.124 0.355 87.1 341144 118.7430 2.5 March 0.01 0.51 0 0.125 0.357 87.2 353489 118.7631 2.58 April 0.01 0.534 0 0.127 0.36 87.2 365834 118.7832 2.67 May 0.01 0.56 0 0.129 0.364 87.2 378180 118.833 2.75 June 0.01 0.586 0 0.132 0.368 87.2 390525 118.8334 2.83 July 0.01 0.614 0 0.135 0.373 87.3 402871 118.8535 2.92 August 0.01 0.643 0 0.138 0.378 87.3 415216 118.8736 3 September 0.01 0.671 0 0.141 0.382 87.3 427562 118.8937 3.08 October 0.01 0.698 0 0.142 0.384 87.3 440401 118.9138 3.17 November 0.02 0.722 0 0.143 0.386 87.3 453240 118.9339 3.25 December 0.02 0.742 0 0.144 0.387 87.4 466079 118.9540 3.33 January 0.02 0.761 0 0.144 0.388 87.4 478919 118.9741 3.42 February 0.02 0.781 0 0.144 0.39 87.4 491758 118.9842 3.5 March 0.02 0.806 0 0.145 0.391 87.4 504597 11943 3.58 April 0.02 0.833 0 0.147 0.393 87.4 517437 119.0244 3.67 May 0.02 0.863 0 0.149 0.397 87.4 530276 119.0545 3.75 June 0.02 0.894 0 0.151 0.4 87.5 543115 119.0746 3.83 July 0.02 0.926 0 0.154 0.404 87.5 555954 119.0947 3.92 August 0.02 0.958 0 0.157 0.408 87.5 568794 119.1148 4 September 0.02 0.99 0 0.159 0.411 87.5 581633 119.1449 4.08 October 0.02 1.02 0 0.16 0.413 87.6 594986 119.1650 4.17 November 0.02 1.05 0 0.161 0.414 87.6 608339 119.1851 4.25 December 0.03 1.07 0 0.161 0.415 87.6 621691 119.1952 4.33 January 0.03 1.08 0 0.161 0.416 87.6 635044 119.2153 4.42 February 0.03 1.11 0 0.162 0.417 87.6 648397 119.2354 4.5 March 0.03 1.14 0 0.163 0.419 87.6 661750 119.2555 4.58 April 0.03 1.17 0 0.164 0.421 87.7 675103 119.2756 4.67 May 0.03 1.2 0 0.165 0.423 87.7 688456 119.2957 4.75 June 0.03 1.23 0 0.168 0.426 87.7 701808 119.3158 4.83 July 0.03 1.27 0 0.17 0.429 87.7 715161 119.3459 4.92 August 0.03 1.31 0 0.173 0.433 87.8 728514 119.3660 5 September 0.03 1.34 0 0.176 0.437 87.8 741867 119.3961 5.08 October 0.03 1.38 0 0.177 0.439 87.8 755754 119.4162 5.17 November 0.03 1.41 0 0.178 0.441 87.8 769641 119.43
Heavy Trucks(cumulative)
IRI atReliability
(in/mi)
Predicted distress: Project T-1
Pavementage
Month
LogitudinalCracking
(ft/mi)
AlligatorCracking
(%)
TransverseCracking
(ft/mi)
SubtotalAC Rutting
(in)
TotalRutting
(in)IRI
(in/mi)

Predicted distress: Project T-1
63 5.25 December 0.04 1.43 0 0.178 0.442 87.8 783528 119.4564 5.33 January 0.04 1.46 0 0.179 0.443 87.9 797415 119.4765 5.42 February 0.04 1.49 0 0.179 0.444 87.9 811302 119.4966 5.5 March 0.04 1.52 0 0.181 0.446 87.9 825189 119.5167 5.58 April 0.04 1.56 0 0.181 0.447 87.9 839076 119.5368 5.67 May 0.04 1.59 0 0.183 0.45 88 852963 119.5669 5.75 June 0.04 1.63 0 0.185 0.453 88 866850 119.5870 5.83 July 0.04 1.67 0 0.188 0.456 88 880736 119.6171 5.92 August 0.04 1.71 0 0.191 0.46 88 894623 119.6372 6 September 0.04 1.75 0 0.192 0.462 88 908510 119.6673 6.08 October 0.05 1.79 0 0.193 0.464 88.1 922953 119.6874 6.17 November 0.05 1.82 0 0.194 0.465 88.1 937395 119.775 6.25 December 0.05 1.85 0 0.194 0.466 88.1 951838 119.7276 6.33 January 0.05 1.87 0 0.195 0.466 88.1 966280 119.7477 6.42 February 0.05 1.9 0 0.195 0.467 88.1 980723 119.7578 6.5 March 0.05 1.93 0 0.195 0.468 88.2 995165 119.7779 6.58 April 0.05 1.96 0 0.196 0.469 88.2 1009610 119.880 6.67 May 0.05 2 0 0.198 0.472 88.2 1024050 119.8281 6.75 June 0.05 2.05 0 0.201 0.476 88.2 1038490 119.8582 6.83 July 0.06 2.1 0 0.204 0.48 88.3 1052930 119.8883 6.92 August 0.06 2.14 0 0.207 0.483 88.3 1067380 119.984 7 September 0.06 2.19 0 0.209 0.486 88.3 1081820 119.9385 7.08 October 0.06 2.23 0 0.21 0.488 88.3 1096840 119.9686 7.17 November 0.06 2.27 0 0.211 0.489 88.4 1111860 119.9887 7.25 December 0.06 2.3 0 0.211 0.49 88.4 1126880 12088 7.33 January 0.06 2.33 0 0.212 0.491 88.4 1141900 120.0289 7.42 February 0.06 2.36 0 0.212 0.491 88.4 1156920 120.0490 7.5 March 0.07 2.39 0 0.213 0.492 88.4 1171940 120.0691 7.58 April 0.07 2.44 0 0.214 0.494 88.5 1186960 120.0892 7.67 May 0.07 2.48 0 0.215 0.496 88.5 1201980 120.1193 7.75 June 0.07 2.53 0 0.217 0.498 88.5 1217000 120.1494 7.83 July 0.07 2.58 0 0.219 0.501 88.5 1232020 120.1795 7.92 August 0.07 2.63 0 0.221 0.504 88.6 1247040 120.1996 8 September 0.07 2.67 0 0.223 0.506 88.6 1262060 120.2297 8.08 October 0.07 2.72 0 0.224 0.508 88.6 1277680 120.2598 8.17 November 0.08 2.75 0 0.225 0.509 88.6 1293300 120.2799 8.25 December 0.08 2.78 0 0.225 0.509 88.7 1308920 120.29100 8.33 January 0.08 2.82 0 0.225 0.51 88.7 1324540 120.31101 8.42 February 0.08 2.85 0 0.225 0.511 88.7 1340170 120.33102 8.5 March 0.08 2.89 0 0.226 0.512 88.7 1355790 120.35103 8.58 April 0.08 2.93 0 0.227 0.513 88.8 1371410 120.38104 8.67 May 0.09 2.98 0 0.228 0.515 88.8 1387030 120.4105 8.75 June 0.09 3.03 0 0.23 0.517 88.8 1402650 120.43106 8.83 July 0.09 3.08 0 0.232 0.52 88.8 1418270 120.46107 8.92 August 0.09 3.13 0 0.234 0.522 88.9 1433890 120.49108 9 September 0.09 3.18 0 0.235 0.525 88.9 1449510 120.52109 9.08 October 0.09 3.23 0 0.236 0.526 88.9 1465760 120.54110 9.17 November 0.09 3.27 0 0.237 0.527 88.9 1482000 120.57111 9.25 December 0.1 3.3 0 0.237 0.527 89 1498250 120.59112 9.33 January 0.1 3.33 0 0.237 0.528 89 1514500 120.6113 9.42 February 0.1 3.37 0 0.238 0.529 89 1530740 120.63114 9.5 March 0.1 3.41 0 0.238 0.53 89 1546990 120.65115 9.58 April 0.1 3.46 0 0.239 0.531 89 1563230 120.68116 9.67 May 0.1 3.5 0 0.24 0.532 89.1 1579480 120.7117 9.75 June 0.11 3.56 0 0.242 0.535 89.1 1595720 120.73118 9.83 July 0.11 3.62 0 0.244 0.537 89.1 1611970 120.77119 9.92 August 0.11 3.67 0 0.246 0.54 89.2 1628220 120.8120 10 September 0.11 3.73 0 0.248 0.543 89.2 1644460 120.82121 10.1 October 0.11 3.78 0 0.25 0.544 89.2 1661360 120.85122 10.2 November 0.11 3.82 0 0.25 0.545 89.2 1678250 120.88123 10.3 December 0.12 3.86 0 0.25 0.546 89.3 1695150 120.9124 10.3 January 0.12 3.9 0 0.251 0.547 89.3 1712040 120.92125 10.4 February 0.12 3.94 0 0.251 0.548 89.3 1728940 120.95126 10.5 March 0.12 3.99 0 0.252 0.549 89.3 1745840 120.97127 10.6 April 0.12 4.04 0 0.253 0.55 89.4 1762730 121128 10.7 May 0.12 4.1 0 0.254 0.552 89.4 1779630 121.03129 10.8 June 0.13 4.16 0 0.256 0.554 89.4 1796520 121.06

Predicted distress: Project T-1
130 10.8 July 0.13 4.22 0 0.258 0.557 89.4 1813420 121.09131 10.9 August 0.13 4.28 0 0.26 0.56 89.5 1830310 121.12132 11 September 0.13 4.34 0 0.262 0.562 89.5 1847210 121.15133 11.1 October 0.13 4.39 0 0.263 0.563 89.5 1864780 121.2134 11.2 November 0.14 4.44 0 0.263 0.564 89.6 1882350 121.21135 11.3 December 0.14 4.47 0 0.263 0.564 89.6 1899920 121.23136 11.3 January 0.14 4.51 0 0.264 0.565 89.6 1917490 121.26137 11.4 February 0.14 4.55 0 0.264 0.565 89.6 1935070 121.27138 11.5 March 0.14 4.59 0 0.264 0.566 89.6 1952640 121.3139 11.6 April 0.15 4.64 0 0.265 0.567 89.7 1970210 121.33140 11.7 May 0.15 4.7 0 0.266 0.569 89.7 1987780 121.36141 11.8 June 0.15 4.77 0 0.269 0.572 89.7 2005350 121.39142 11.8 July 0.15 4.84 0 0.272 0.576 89.8 2022920 121.44143 11.9 August 0.15 4.9 0 0.274 0.578 89.8 2040490 121.47144 12 September 0.16 4.96 0 0.276 0.58 89.8 2058070 121.5145 12.1 October 0.16 5.02 0 0.277 0.582 89.9 2076340 121.53146 12.2 November 0.16 5.08 0 0.278 0.583 89.9 2094610 121.56147 12.3 December 0.16 5.13 0 0.278 0.584 89.9 2112890 121.59148 12.3 January 0.16 5.17 0 0.278 0.584 89.9 2131160 121.62149 12.4 February 0.17 5.21 0 0.279 0.585 90 2149440 121.62150 12.5 March 0.17 5.26 0 0.279 0.586 90 2167710 121.65151 12.6 April 0.17 5.31 0 0.28 0.587 90 2185990 121.68152 12.7 May 0.17 5.38 0 0.281 0.589 90 2204260 121.71153 12.8 June 0.17 5.44 0 0.282 0.59 90.1 2222530 121.77154 12.8 July 0.18 5.51 0 0.285 0.593 90.1 2240810 121.79155 12.9 August 0.18 5.58 0 0.286 0.595 90.1 2259080 121.82156 13 September 0.18 5.65 0 0.288 0.597 90.2 2277360 121.85157 13.1 October 0.18 5.71 0 0.289 0.598 90.2 2296360 121.88158 13.2 November 0.19 5.76 0 0.289 0.599 90.2 2315370 121.91159 13.3 December 0.19 5.81 0 0.29 0.6 90.3 2334370 121.94160 13.3 January 0.19 5.85 0 0.29 0.6 90.3 2353380 121.97161 13.4 February 0.19 5.89 0 0.29 0.601 90.3 2372380 121.98162 13.5 March 0.2 5.95 0 0.291 0.602 90.3 2391390 122.01163 13.6 April 0.2 6.01 0 0.291 0.603 90.3 2410390 122.04164 13.7 May 0.2 6.07 0 0.293 0.604 90.4 2429400 122.09165 13.8 June 0.2 6.14 0 0.294 0.606 90.4 2448400 122.13166 13.8 July 0.2 6.21 0 0.296 0.609 90.5 2467410 122.16167 13.9 August 0.21 6.29 0 0.298 0.611 90.5 2486410 122.19168 14 September 0.21 6.36 0 0.299 0.613 90.5 2505420 122.22169 14.1 October 0.21 6.42 0 0.3 0.614 90.6 2525190 122.27170 14.2 November 0.21 6.47 0 0.3 0.614 90.6 2544950 122.3171 14.3 December 0.22 6.52 0 0.301 0.615 90.6 2564720 122.31172 14.3 January 0.22 6.55 0 0.301 0.615 90.6 2584480 122.34173 14.4 February 0.22 6.61 0 0.301 0.616 90.7 2604250 122.37174 14.5 March 0.23 6.67 0 0.302 0.617 90.7 2624010 122.4175 14.6 April 0.23 6.72 0 0.302 0.618 90.7 2643780 122.43176 14.7 May 0.23 6.79 0 0.303 0.619 90.7 2663540 122.46177 14.8 June 0.23 6.87 0 0.305 0.621 90.8 2683310 122.49178 14.8 July 0.24 6.94 0 0.307 0.623 90.8 2703070 122.55179 14.9 August 0.24 7.02 0 0.309 0.626 90.9 2722840 122.58180 15 September 0.24 7.1 0 0.311 0.628 90.9 2742610 122.61181 15.1 October 0.24 7.16 0 0.312 0.63 90.9 2763160 122.64182 15.2 November 0.25 7.22 0 0.312 0.631 90.9 2783720 122.67183 15.3 December 0.25 7.28 0 0.313 0.631 91 2804270 122.7184 15.3 January 0.25 7.33 0 0.313 0.632 91 2824830 122.73185 15.4 February 0.26 7.38 0 0.314 0.632 91 2845390 122.76186 15.5 March 0.26 7.46 0 0.314 0.634 91.1 2865940 122.79187 15.6 April 0.26 7.52 0 0.315 0.635 91.1 2886500 122.82188 15.7 May 0.26 7.59 0 0.316 0.636 91.1 2907050 122.88189 15.8 June 0.27 7.67 0 0.318 0.638 91.2 2927610 122.91190 15.8 July 0.27 7.75 0 0.32 0.641 91.2 2948170 122.94191 15.9 August 0.27 7.84 0 0.322 0.643 91.3 2968720 123192 16 September 0.27 7.91 0 0.323 0.645 91.3 2989280 123.03193 16.1 October 0.28 7.99 0 0.324 0.646 91.3 3010660 123.06194 16.2 November 0.28 8.04 0 0.325 0.647 91.3 3032040 123.09195 16.3 December 0.28 8.1 0 0.325 0.647 91.4 3053410 123.12196 16.3 January 0.29 8.14 0 0.325 0.648 91.4 3074790 123.15

Predicted distress: Project T-1
197 16.4 February 0.29 8.19 0 0.325 0.648 91.4 3096170 123.19198 16.5 March 0.29 8.25 0 0.326 0.649 91.4 3117550 123.19199 16.6 April 0.3 8.32 0 0.326 0.65 91.5 3138930 123.25200 16.7 May 0.3 8.4 0 0.328 0.651 91.5 3160310 123.28201 16.8 June 0.3 8.48 0 0.33 0.654 91.5 3181680 123.31202 16.8 July 0.3 8.57 0 0.333 0.658 91.6 3203060 123.37203 16.9 August 0.31 8.66 0 0.335 0.66 91.6 3224440 123.4204 17 September 0.31 8.74 0 0.336 0.662 91.7 3245820 123.46205 17.1 October 0.31 8.83 0 0.338 0.663 91.7 3268050 123.49206 17.2 November 0.32 8.9 0 0.338 0.664 91.7 3290290 123.52207 17.3 December 0.32 8.96 0 0.339 0.665 91.8 3312520 123.55208 17.3 January 0.32 9.01 0 0.339 0.665 91.8 3334750 123.58209 17.4 February 0.33 9.07 0 0.339 0.666 91.8 3356990 123.62210 17.5 March 0.33 9.13 0 0.339 0.667 91.9 3379220 123.65211 17.6 April 0.34 9.21 0 0.341 0.668 91.9 3401450 123.68212 17.7 May 0.34 9.29 0 0.342 0.669 91.9 3423690 123.74213 17.8 June 0.34 9.37 0 0.343 0.671 92 3445920 123.77214 17.8 July 0.34 9.46 0 0.345 0.673 92 3468150 123.83215 17.9 August 0.35 9.55 0 0.347 0.676 92.1 3490390 123.86216 18 September 0.35 9.64 0 0.348 0.677 92.1 3512620 123.92217 18.1 October 0.35 9.72 0 0.349 0.679 92.1 3535740 123.95218 18.2 November 0.36 9.79 0 0.349 0.679 92.2 3558870 123.98219 18.3 December 0.36 9.85 0 0.35 0.68 92.2 3581990 124.02220 18.3 January 0.37 9.9 0 0.35 0.68 92.2 3605110 124.05221 18.4 February 0.37 9.96 0 0.35 0.681 92.3 3628230 124.08222 18.5 March 0.37 10 0 0.351 0.681 92.3 3651360 124.11223 18.6 April 0.38 10.1 0 0.351 0.682 92.3 3674480 124.15224 18.7 May 0.38 10.2 0 0.353 0.684 92.3 3697600 124.18225 18.8 June 0.38 10.3 0 0.354 0.686 92.4 3720730 124.24226 18.8 July 0.39 10.4 0 0.356 0.688 92.4 3743850 124.27227 18.9 August 0.39 10.5 0 0.357 0.69 92.5 3766970 124.33228 19 September 0.39 10.6 0 0.359 0.692 92.5 3790090 124.36229 19.1 October 0.4 10.6 0 0.36 0.693 92.6 3814140 124.42230 19.2 November 0.4 10.7 0 0.36 0.694 92.6 3838190 124.45231 19.3 December 0.41 10.8 0 0.36 0.694 92.6 3862240 124.49232 19.3 January 0.41 10.8 0 0.36 0.694 92.7 3886280 124.52233 19.4 February 0.41 10.9 0 0.361 0.695 92.7 3910330 124.55234 19.5 March 0.42 10.9 0 0.361 0.696 92.7 3934380 124.59235 19.6 April 0.42 11 0 0.362 0.697 92.7 3958430 124.62236 19.7 May 0.43 11.1 0 0.363 0.698 92.8 3982480 124.65237 19.8 June 0.43 11.2 0 0.365 0.7 92.8 4006520 124.71238 19.8 July 0.43 11.3 0 0.366 0.702 92.9 4030570 124.77239 19.9 August 0.44 11.4 0 0.368 0.704 92.9 4054620 124.8240 20 September 0.44 11.5 0 0.37 0.707 93 4078670 124.86

Layers Modulus: Project T-1
mo yr 1 2 3 4 5 1 2 3 4 5 1 2 3 4 5 1 2 3 4 51 0.08 October 1193000 1029990 907538 690730 461000 1026980 886443 780950 621795 433343 894357 773957 686137 569015 418123 788400 683668 611949 524975 407045 41640 41320 29568 8100 8090 8070 80302 0.17 November 1650020 1351770 1179150 973119 635024 1400610 1162060 1016930 857296 584978 1199570 1009380 892737 763072 555887 1047520 897208 798827 694642 530741 42160 41840 29456 8100 8090 8070 80303 0.25 December 2184150 1573110 1353090 1058090 715760 1862440 1332740 1148740 920676 660753 1590700 1143900 993300 828764 626664 1382900 1002710 877306 759241 603013 42640 42320 29400 8100 8090 8070 80304 0.33 January 2470810 1669580 1437010 1143420 687046 2106940 1418280 1231130 984798 626923 1780720 1218670 1057440 865121 590891 1532170 1078270 932294 777359 563964 43000 42720 29372 8090 8090 8070 80305 0.42 February 1859640 1487700 1307410 1010340 701833 1566430 1249910 1096320 880767 636447 1324340 1067950 943886 781115 596964 1138090 929848 831818 709443 574199 43320 43040 29316 8090 8080 8070 80306 0.5 March 1630170 1377320 1153720 830020 529096 1356820 1142080 958342 723904 477809 1127330 956416 812086 645635 450345 961782 823431 710488 590439 433115 43600 43320 29316 8090 8080 8070 80307 0.58 April 1770250 1431620 1214880 909138 630963 1461720 1188610 1013630 790480 563021 1210440 999309 858771 700154 522566 1028140 860345 751586 636295 496831 43840 43600 29288 8090 8080 8070 80308 0.67 May 1392410 1185720 984478 743447 534684 1143150 974633 819769 641918 473018 950348 813515 697291 567576 435765 806254 699082 610902 515529 411890 44120 43840 29316 8090 8080 8070 80309 0.75 June 1306010 1081040 881036 658210 475944 1072410 881769 730443 566898 419223 885408 736651 616842 502340 383618 752472 629118 540937 456159 361984 44320 44040 29344 8090 8080 8070 803010 0.83 July 1118950 971190 803067 578577 454693 910856 789225 658361 498471 396950 747323 652547 552096 440842 362629 629356 554043 481005 401507 340832 44440 44160 29344 8080 8080 8070 803011 0.92 August 1169790 1025230 858215 639130 483927 950932 834916 704948 544634 423079 781305 688618 589848 479429 384552 658849 585528 509098 429931 362294 44560 44320 29372 8080 8080 8070 803012 1 September 1307470 1159870 1009460 776007 578360 1067710 948355 826457 660382 503591 886066 786668 690514 573465 453863 747884 669786 597262 514396 422167 44720 44480 29400 8080 8080 8070 803013 1.08 October 1715880 1375930 1219230 937944 673445 1413630 1132740 1004290 794488 587799 1164860 946424 834974 687768 532524 983912 803504 717984 612192 494117 44840 44600 29428 8080 8080 8060 803014 1.17 November 2256760 1765620 1521770 1266580 942003 1885410 1468020 1266490 1076720 820844 1559900 1230440 1071650 931168 745968 1311950 1046840 927448 825859 687049 45000 44720 29456 8080 8080 8060 803015 1.25 December 3315450 2331090 1772720 1480780 1041180 2901260 1987200 1498620 1245150 912707 2489890 1694800 1277990 1069980 817560 2118900 1461890 1110950 940833 750122 45080 44840 29484 8080 8080 8060 803016 1.33 January 2923420 2169500 1864880 1549790 1148010 2522900 1844800 1567340 1321500 1001350 2151610 1565400 1337920 1141180 901849 1838870 1352530 1157410 1011920 827883 45200 44920 29512 8080 8080 8060 803017 1.42 February 3317990 2272940 1832560 1476580 956848 2902840 1940360 1557700 1260350 833922 2478100 1642870 1322360 1085900 760929 2117350 1427820 1153470 957135 704089 45320 45080 29540 8080 8070 8060 803018 1.5 March 3147790 2119340 1757110 1343280 945007 2708190 1781570 1469670 1154630 831523 2281190 1493320 1238620 1004200 754751 1915430 1268430 1068620 894975 706039 45440 45200 29568 8080 8070 8060 803019 1.58 April 2138920 1677200 1407480 1011860 731272 1767360 1374680 1153680 862161 635520 1446050 1130340 957548 755668 577317 1197860 956499 824003 675910 538008 45520 45280 29596 8080 8070 8060 803020 1.67 May 1638520 1324440 1056880 734668 538743 1329390 1069450 864252 624545 467195 1072770 868023 711329 546159 424476 879712 727958 608606 494748 397231 45600 45360 29624 8080 8070 8060 803021 1.75 June 1329230 1111870 902067 631051 472801 1068530 892640 725925 530763 405479 856052 723001 598075 462865 364304 708606 603737 508860 417218 337525 45680 45400 29680 8080 8070 8060 803022 1.83 July 1255390 1060380 854130 635716 467165 1010750 846513 693238 532404 396064 815402 687463 572278 458963 351458 677275 575822 489902 410240 322605 45680 45440 29708 8080 8070 8060 803023 1.92 August 1282740 1122700 936582 688099 501803 1037090 897002 755985 575511 428886 839583 728209 619667 495004 382536 696656 609403 526379 439590 351673 45680 45440 29708 8080 8070 8060 803024 2 September 1452630 1271460 1109270 885864 642434 1189470 1031250 902569 736959 546027 976181 841030 746581 630724 481468 819178 708811 636652 551702 437669 45680 45440 29736 8080 8070 8060 803025 2.08 October 1668990 1422430 1227470 947870 662746 1376310 1158430 1001740 789966 567293 1127890 949754 819417 676729 505680 946239 796509 698593 594355 463201 45680 45440 29736 8080 8070 8060 803026 2.17 November 2117350 1739590 1521780 1193860 840538 1768790 1437900 1253340 1003890 727342 1456960 1179450 1033130 857973 651974 1219990 993810 877420 752411 598824 45680 45440 29736 8080 8070 8060 803027 2.25 December 2763430 1925320 1749160 1421640 995575 2374980 1616800 1458570 1200650 865261 1998990 1356690 1218330 1018140 774516 1694910 1150270 1035880 890912 711503 45680 45440 29764 8080 8070 8060 803028 2.33 January 3401950 2228980 1920020 1574310 1073890 3010860 1878820 1611750 1326060 933062 2628820 1597830 1358220 1133090 840777 2277630 1367640 1162330 993112 770523 45680 45440 29764 8080 8070 8060 803029 2.42 February 3294890 2323310 1937460 1435800 925378 2863990 1957340 1620140 1227790 812089 2424330 1629070 1352660 1059290 741137 2029100 1381190 1157190 930779 693000 45680 45440 29764 8080 8070 8060 803030 2.5 March 2918570 2215150 1803970 1263450 863228 2492010 1848950 1487160 1085240 754063 2075720 1518230 1242240 943478 687902 1735380 1277420 1055410 841237 641193 45680 45440 29764 8080 8070 8060 803031 2.58 April 2094430 1667090 1347510 927400 634069 1723590 1349600 1088420 783799 547448 1402930 1098290 888986 684021 492842 1154970 910610 755789 607921 460340 45680 45440 29764 8080 8070 8060 803032 2.67 May 1964130 1541840 1241550 865001 629437 1607660 1253090 1003240 728305 541019 1304080 1013070 824555 631184 484691 1077310 843176 694564 564037 445620 45680 45440 29764 8080 8070 8060 803033 2.75 June 1578570 1343250 1145890 913188 688186 1284360 1093070 937223 759455 582461 1052300 892172 775058 649069 512615 875518 748321 665659 566908 465264 45680 45440 29764 8080 8070 8060 803034 2.83 July 1477700 1260560 1044730 768359 561618 1202850 1014690 844837 640476 474351 979338 823495 694301 549885 417258 814362 687491 588406 483750 379591 45680 45440 29764 8080 8070 8060 803035 2.92 August 1400310 1214850 1026780 771337 594154 1131990 976286 832629 642751 501467 912545 788432 681190 549638 442011 752131 657923 576958 485073 402753 45680 45440 29764 8080 8070 8060 803036 3 September 1596250 1363240 1166920 926554 621515 1298960 1104930 947030 767375 527204 1054540 897496 779424 650252 467102 876579 752002 660590 565031 426245 45680 45440 29764 8080 8070 8060 803037 3.08 October 2026260 1601710 1394000 1129420 794451 1684230 1314550 1149420 943638 676112 1387300 1081440 949936 798053 597667 1156800 910914 806101 689971 542011 45680 45440 29764 8080 8070 8060 803038 3.17 November 2519170 2008580 1780810 1372280 1019400 2120420 1683090 1471640 1163110 882859 1756270 1399250 1221090 1003090 786856 1453290 1184010 1034890 885699 719738 45680 45440 29764 8080 8070 8060 803039 3.25 December 3588640 2369210 2064480 1683290 1213090 3175780 2026230 1741790 1440310 1053560 2751380 1713700 1471710 1243590 947184 2367790 1468750 1265840 1084230 864336 45680 45440 29764 8080 8070 8060 803040 3.33 January 3793800 2703220 2209470 1784820 1190430 3486650 2336590 1884520 1514040 1044690 3077720 2000980 1600630 1304780 938456 2711620 1721250 1374270 1144840 863407 45680 45440 29764 8080 8070 8060 803041 3.42 February 3367790 2512260 2128090 1590240 1080190 2949130 2142800 1792200 1366330 945231 2528960 1802480 1502280 1186730 858262 2169320 1540650 1299510 1052460 793375 45680 45440 29764 8080 8070 8060 803042 3.5 March 2429580 2066210 1704870 1232610 849625 2045710 1712120 1410130 1045710 737155 1689040 1417470 1161940 900792 662570 1409210 1181510 992265 799292 613501 45680 45440 29764 8080 8070 8060 803043 3.58 April 2436320 1966000 1605280 1153710 796769 2024070 1622100 1316770 982459 685829 1661620 1326350 1091760 847412 616036 1363990 1109130 926744 750496 568513 45680 45440 29764 8080 8070 8060 803044 3.67 May 1870890 1572250 1248230 891242 644346 1537490 1271770 1014370 748059 548847 1248140 1021420 830962 645548 484991 1032490 847247 702928 572087 442960 45680 45440 29764 8080 8070 8060 803045 3.75 June 1600970 1404680 1159600 870544 649995 1301730 1129460 939182 727023 550207 1055110 916052 773962 621891 482779 871226 762480 651418 548329 439137 45680 45440 29764 8080 8070 8060 803046 3.83 July 1537700 1340850 1113820 813378 629552 1242050 1080010 897072 676716 531632 1005290 867737 735437 581177 468504 826110 718945 618592 513187 425392 45680 45440 29764 8080 8070 8060 803047 3.92 August 1535360 1343980 1124360 825797 640451 1239950 1078210 909184 689743 541179 1003390 869699 742514 588382 475578 824385 720403 621974 521544 430405 45680 45440 29764 8080 8070 8060 803048 4 September 1568940 1377670 1188940 894227 659127 1279200 1115320 959855 744634 557730 1040390 903825 784697 632314 490731 858474 751745 657438 553066 444529 45680 45440 29764 8080 8070 8060 803049 4.08 October 2162860 1840960 1566300 1174540 843002 1799160 1517230 1282180 984763 721746 1478840 1241700 1051880 845024 639269 1226960 1036000 887457 741106 578494 45680 45440 29764 8080 8070 8060 803050 4.17 November 2965110 2220900 1904960 1492840 1009310 2558670 1868960 1595090 1259700 870765 2156230 1562490 1333070 1073950 778913 1813910 1325290 1129990 935132 712782 45680 45440 29764 8080 8070 8060 803051 4.25 December 3793800 2701730 2189750 1848740 1291700 3630090 2356010 1873750 1571600 1124240 3209410 2028560 1613200 1336980 990586 2797500 1754970 1405800 1166980 895508 45680 45440 29764 8080 8070 8060 803052 4.33 January 3793800 3568470 2664150 2048290 1358280 3673740 3194630 2329800 1780980 1196160 3563400 2823250 2044430 1557300 1090400 3467290 2501910 1828220 1404340 1003140 45680 45440 29764 8080 8070 8060 803053 4.42 February 2616300 2180750 1901190 1391870 971922 2241590 1831710 1570520 1188120 842042 1882660 1528980 1299030 1022960 757105 1586310 1288820 1105460 909337 697223 45680 45440 29764 8080 8070 8060 803054 4.5 March 3059060 2158500 1808380 1358360 920534 2627520 1803010 1501040 1157490 794432 2187380 1488910 1250110 999504 714422 1821930 1260170 1067590 879722 658778 45680 45440 29764 8080 8070 8060 803055 4.58 April 2326200 1954810 1603470 1155060 770265 1948820 1604110 1314010 970423 658987 1602100 1309610 1087790 834661 588021 1325390 1093190 917379 734001 539530 45680 45440 29764 8080 8070 8060 803056 4.67 May 2122920 1723740 1388980 1035140 728791 1762460 1407250 1137880 873841 619020 1453230 1142250 941032 750993 546310 1204270 950938 802173 661091 499499 45680 45440 29764 8080 8070 8060 803057 4.75 June 1572010 1365550 1115020 835404 640734 1275730 1095370 900166 694178 539540 1027500 882599 736509 594946 473754 842944 726759 622959 522157 428650 45680 45440 29764 8080 8070 8060 803058 4.83 July 1682580 1404190 1186110 883286 675909 1377150 1132380 956423 733530 569177 1116720 916811 780562 630111 496217 920691 761344 660653 551757 448263 45680 45440 29764 8080 8070 8060 803059 4.92 August 1547000 1305550 1130560 822778 609940 1259340 1053180 909654 682853 511680 1022540 851103 735688 580403 446104 849792 709257 617207 506935 402260 45680 45440 29764 8080 8070 8060 803060 5 September 1585800 1367080 1104970 761078 538118 1282010 1087720 878317 632943 455559 1023530 861815 707086 539758 401653 832050 706454 588297 477080 367373 45680 45440 29764 8080 8070 8060 803061 5.08 October 1990330 1670780 1454120 1087650 739882 1642690 1366660 1174580 906570 632372 1342250 1112610 955654 770684 559916 1109610 916944 803911 670219 511819 45680 45440 29764 8080 8070 8060 803062 5.17 November 2753690 2196340 1869410 1512870 967634 2341800 1854100 1562180 1271330 833631 1954890 1540800 1309170 1073560 741967 1632780 1305100 1113320 929259 676069 45680 45440 29764 8080 8070 8060 803063 5.25 December 3552330 2493970 2095260 1592900 1057660 3150660 2105130 1752780 1349140 927092 2738500 1766690 1465230 1163170 840216 2366720 1490550 1244770 1023380 776007 45680 45440 29764 8080 8070 8060 803064 5.33 January 3793800 2548470 2167290 1684670 993349 3442060 2186310 1843700 1414560 863356 3002640 1868640 1553940 1200770 772703 2622500 1607070 1316410 1037840 707918 45680 45440 29764 8080 8070 8060 803065 5.42 February 2776390 2179110 1892470 1435060 988158 2385210 1829710 1569020 1216370 858387 2004650 1533890 1315100 1047290 770862 1685920 1292100 1118330 917868 714833 45680 45440 29764 8080 8070 8060 803066 5.5 March 2337740 1948930 1611960 1146270 745832 1950230 1598380 1315180 968784 639169 1602760 1310040 1078310 831863 571542 1325120 1081980 904135 733333 526198 45680 45440 29764 8080 8070 8060 803067 5.58 April 2487440 1983110 1658690 1232390 862222 2079770 1643270 1367390 1042230 736383 1709180 1355100 1132820 897906 657311 1416970 1130980 959340 789934 602335 45680 45440 29764 8080 8070 8060 803068 5.67 May 1884810 1591260 1312640 992188 728442 1541580 1291690 1071180 831102 616971 1255240 1048990 879455 708654 542675 1030790 871230 747727 621605 492782 45680 45440 29764 8080 8070 8060 803069 5.75 June 1729410 1415600 1154770 870024 646954 1411530 1141380 936263 725637 545128 1139760 923391 765669 619451 475714 938983 765860 649426 543096 429146 45680 45440 29764 8080 8070 8060 803070 5.83 July 1449700 1255010 1039010 761338 613135 1165570 1002040 832282 634069 513104 931646 801638 675954 537774 447416 759673 661452 569914 474277 403666 45680 45440 29764 8080 8070 8060 803071 5.92 August 1496140 1307820 1094890 824757 639900 1204930 1050210 882149 683267 538549 967926 844284 717401 579445 469391 792665 696749 600619 504927 425907 45680 45440 29764 8080 8070 8060 803072 6 September 1655820 1464130 1271710 980783 743302 1347360 1187360 1027770 817695 625919 1100480 965523 839139 691174 546826 905952 800866 706738 603181 492798 45680 45440 29764 8080 8070 8060 803073 6.08 October 2165460 1723920 1522630 1168460 847520 1800580 1418720 1247870 976860 722297 1478560 1166370 1020650 828513 636280 1230910 969770 858342 720737 575013 45680 45440 29764 8080 8070 8060 803074 6.17 November 2829080 2203260 1890590 1565800 1161570 2414190 1851770 1580880 1329450 1000850 2021070 1553320 1331310 1139310 895730 1691140 1308630 1137490 996143 811204 45680 45440 29764 8080 8070 8060 803075 6.25 December 3793800 2888770 2187850 1818750 1271330 3660550 2517390 1871100 1535960 1107030 3239990 2181780 1601640 1315500 980312 2826780 1896970 1386500 1145570 887418 45680 45440 29764 8080 8070 8060 803076 6.33 January 3565540 2659450 2280730 1887090 1390000 3164120 2303560 1941190 1620010 1208900 2765050 1978210 1666560 1398830 1081220 2404840 1716620 1438240 1233640 983180 45680 45440 29764 8080 8070 8060 803077 6.42 February 3793800 2759880 2219230 1779750 1149090 3582590 2401670 1909310 1526670 992872 3145090 2060660 1628790 1312940 895176 2747670 1803380 1418660 1148670 817460 45680 45440 29764 8080 8070 8060 803078 6.5 March 3754370 2549370 2107650 1602970 1126490 3319710 2176930 1779630 1380780 983025 2865520 1840940 1502920 1196340 881923 2448600 1564400 1290280 1057620 815255 45680 45440 29764 8080 8070 8060 803079 6.58 April 2551870 1994000 1668110 1196850 872125 2139760 1645410 1369370 1013280 746699 1762220 1350050 1128810 877934 665759 1454800 1131550 959573 774163 609338 45680 45440 29764 8080 8070 8060 803080 6.67 May 1932900 1557350 1241490 870316 651052 1576790 1256790 1009530 729866 552659 1266980 1010310 820018 626709 489435 1025180 834329 689893 557103 447284 45680 45440 29764 8080 8070 8060 803081 6.75 June 1552850 1297720 1055120 749097 574429 1247730 1037230 842093 620294 481727 989963 829731 683428 529941 421147 806751 681285 571204 467881 380319 45680 45440 29764 8080 8070 8060 803082 6.83 July 1457000 1230550 994598 749897 564712 1171290 977413 800241 618953 468902 935687 783964 650868 523363 405383 765503 646031 547612 458568 362905 45680 45440 29764 8080 8070 8060 8030
Subseason Layer Modulus: Project T-1Pavement
ageMonth
Modulus (psi)AC1 (1) h=0.5 AC1 (2) h=0.5 AC1 (3) h=1.0 AC1 (4) h=1.0 GB2 (5)
h=2.0GB2 (6)
h=4.0NSG4 (11)
h=264.0NSG3 (7)
h=9.0NSG4 (8)
h=24.0NSG4 (9)
h=24.0NSG4 (10)
h=24.0

Layers Modulus: Project T-1
83 6.92 August 1480520 1295400 1082510 803658 599094 1196080 1031190 867926 663831 502256 959985 828037 702173 561240 437426 785397 682554 586993 489476 393094 45680 45440 29764 8080 8070 8060 803084 7 September 1669310 1459610 1273280 1019820 749261 1370280 1183020 1032560 842151 628145 1119310 957191 845835 711869 544048 929412 796640 711672 613686 485756 45680 45440 29764 8080 8070 8060 803085 7.08 October 1910870 1625920 1401910 1084460 767803 1584930 1326600 1142790 898578 648829 1297500 1082220 927478 761620 568776 1080680 898101 781518 660294 512439 45680 45440 29764 8080 8070 8060 803086 7.17 November 2416900 1982670 1732120 1357100 959901 2041740 1649690 1431710 1140050 824044 1691470 1353450 1176920 968718 730489 1415450 1134130 991845 841901 663124 45680 45440 29764 8080 8070 8060 803087 7.25 December 3133400 2185940 1984330 1609860 1128100 2736840 1852200 1665920 1363420 976372 2334890 1560840 1393690 1153720 867838 1997150 1321430 1180440 1003880 790780 45680 45440 29764 8080 8070 8060 803088 7.33 January 3793800 2520800 2170100 1776440 1210870 3434410 2149550 1837420 1503420 1049540 3051700 1843050 1555020 1285320 941093 2684190 1582820 1329890 1123090 857009 45680 45440 29764 8080 8070 8060 803089 7.42 February 3681910 2616060 2180640 1612470 1041470 3257650 2230430 1838890 1383250 909211 2803560 1871290 1541240 1192690 823684 2376290 1591580 1317620 1043740 764360 45680 45440 29764 8080 8070 8060 803090 7.5 March 3263200 2484280 2021320 1412920 969462 2829610 2095540 1677180 1214570 841515 2387780 1731070 1403730 1053080 761079 2012940 1457940 1189200 934139 703197 45680 45440 29764 8080 8070 8060 803091 7.58 April 2339690 1859920 1501680 1036220 718256 1942720 1512430 1213940 871688 613204 1587560 1229490 986939 754555 544201 1304240 1012880 832273 664071 501265 45680 45440 29764 8080 8070 8060 803092 7.67 May 2185680 1713300 1378790 964760 710789 1802340 1396800 1113730 807851 604375 1465360 1126420 910462 693855 533953 1206600 930875 760076 613675 484243 45680 45440 29764 8080 8070 8060 803093 7.75 June 1748520 1486940 1268800 1014020 771161 1427580 1211150 1036400 839606 647094 1167910 984467 852057 711746 562701 965615 819172 725512 615471 504415 45680 45440 29764 8080 8070 8060 803094 7.83 July 1631140 1391080 1154160 854607 634159 1330910 1119670 931059 707780 529788 1080770 904117 759894 601618 459279 892457 748342 637870 523374 411730 45680 45440 29764 8080 8070 8060 803095 7.92 August 1540860 1336830 1131280 855281 666559 1247440 1073770 915072 708316 557063 1001960 862510 743552 599925 484469 819421 713558 623909 523747 435492 45680 45440 29764 8080 8070 8060 803096 8 September 1752270 1495780 1280740 1019660 693497 1430800 1213730 1038500 841390 582895 1160040 982356 850320 707848 510050 958939 817310 714935 609531 459645 45680 45440 29764 8080 8070 8060 803097 8.08 October 2220260 1753470 1525470 1236540 875251 1858670 1444210 1259920 1032060 740581 1536260 1187350 1038720 868908 649067 1279730 995717 876407 746011 583227 45680 45440 29764 8080 8070 8060 803098 8.17 November 2751770 2194950 1945270 1497820 1114380 2339450 1852040 1615670 1271820 962927 1951890 1545310 1342500 1095750 854459 1620050 1307460 1135260 964385 777431 45680 45440 29764 8080 8070 8060 803099 8.25 December 3793800 2582220 2250380 1833720 1321090 3476660 2228430 1912320 1576440 1147720 3051330 1897620 1623140 1364260 1030460 2655260 1632590 1398140 1188770 937870 45680 45440 29764 8080 8070 8060 8030100 8.33 January 3793800 2936020 2402590 1940060 1293510 3673740 2563950 2065550 1654330 1135330 3393140 2215040 1764410 1429860 1018410 3024880 1917240 1518990 1255180 934772 45680 45440 29764 8080 8070 8060 8030101 8.42 February 3631330 2724140 2308690 1723940 1171920 3218580 2344910 1958230 1486860 1024260 2791860 1986620 1648880 1293510 927540 2417250 1705360 1429130 1146670 854542 45680 45440 29764 8080 8070 8060 8030102 8.5 March 2629120 2236510 1844530 1333320 923394 2232570 1865140 1531820 1131550 797674 1854340 1549480 1262960 972606 712493 1550830 1291030 1076150 859637 655409 45680 45440 29764 8080 8070 8060 8030103 8.58 April 2630710 2123340 1732860 1245840 865567 2203590 1761750 1425850 1060490 741388 1819050 1443850 1182050 912108 661263 1495500 1205950 1000280 804148 605820 45680 45440 29764 8080 8070 8060 8030104 8.67 May 2016290 1693730 1344760 963702 703744 1665000 1373660 1093070 806286 595273 1353480 1101840 892551 691791 521076 1117010 909873 750752 608822 471325 45680 45440 29764 8080 8070 8060 8030105 8.75 June 1721410 1510140 1247360 939980 708202 1403650 1215900 1009790 782439 595593 1136880 983947 829061 665373 517910 934850 814782 693561 582518 466657 45680 45440 29764 8080 8070 8060 8030106 8.83 July 1650220 1438940 1196290 878010 685486 1336000 1160060 962743 727747 575074 1080000 929518 786107 621016 502117 883431 765919 657118 544306 451601 45680 45440 29764 8080 8070 8060 8030107 8.92 August 1644790 1439780 1205430 889493 695518 1331300 1156090 974097 740297 584048 1076030 930117 792498 627726 508767 880122 766373 659852 552461 456277 45680 45440 29764 8080 8070 8060 8030108 9 September 1677960 1473340 1272070 959926 713676 1371520 1194190 1026820 797178 600364 1114670 965685 836700 673447 523896 916186 799353 697130 585255 470516 45680 45440 29764 8080 8070 8060 8030109 9.08 October 2310210 1966160 1672380 1254730 904536 1933010 1627170 1372430 1051860 771723 1594260 1333410 1125380 900455 679854 1322990 1110630 946578 786565 611543 45680 45440 29764 8080 8070 8060 8030110 9.17 November 3155100 2368310 2031350 1591380 1078000 2746120 2005110 1708700 1345900 928531 2331780 1683130 1431280 1147580 827965 1972040 1429830 1212820 997420 754786 45680 45440 29764 8080 8070 8060 8030111 9.25 December 3793800 2873790 2331510 1968300 1375130 3673740 2525180 2006840 1680480 1198080 3448000 2188750 1735560 1433090 1055150 3033770 1902880 1516400 1251640 952415 45680 45440 29764 8080 8070 8060 8030112 9.33 January 3793800 3769620 2829970 2177700 1443750 3673740 3405090 2492990 1903590 1273480 3563400 3035930 2201910 1671430 1161860 3467290 2711380 1979540 1511920 1068900 45680 45440 29764 8080 8070 8060 8030113 9.42 February 2775570 2315130 2018310 1477340 1034050 2394840 1955240 1674150 1263070 894206 2022880 1637920 1387230 1087210 801405 1710300 1382110 1180010 964938 735296 45680 45440 29764 8080 8070 8060 8030114 9.5 March 3234960 2288350 1917040 1439870 978828 2801160 1921480 1597030 1228560 842790 2348610 1591740 1331970 1060410 755054 1965790 1348370 1136710 931482 693370 45680 45440 29764 8080 8070 8060 8030115 9.58 April 2462520 2069660 1697370 1223570 820934 2074890 1705360 1394330 1027800 699680 1712240 1394660 1154350 882172 620868 1418020 1163210 971315 773123 566360 45680 45440 29764 8080 8070 8060 8030116 9.67 May 2244760 1822470 1468520 1096170 776835 1872600 1492240 1204500 924370 657164 1548320 1211660 994968 792108 576545 1283150 1006590 845562 694434 523826 45680 45440 29764 8080 8070 8060 8030117 9.75 June 1659910 1442040 1178540 886430 684827 1349890 1157840 951063 734709 573920 1086580 931323 775931 626789 500455 888584 763824 653339 547088 449542 45680 45440 29764 8080 8070 8060 8030118 9.83 July 1774620 1481040 1251710 935130 720200 1456340 1195760 1009340 774971 603895 1181130 966782 821749 662984 523221 971466 800001 692652 577628 469493 45680 45440 29764 8080 8070 8060 8030119 9.92 August 1629700 1375650 1192090 871205 651345 1329230 1110470 958906 721241 543785 1078710 895744 773436 610311 470814 893999 743637 646042 530196 421434 45680 45440 29764 8080 8070 8060 8030120 10 September 1668730 1438740 1164020 806334 576761 1351800 1145790 924929 668582 485382 1078600 906204 742523 567377 424521 874074 739977 615022 498629 385097 45680 45440 29764 8080 8070 8060 8030121 10.08 October 2092380 1756310 1528580 1144700 783528 1733500 1440150 1236440 953615 667272 1418970 1172650 1005020 808777 587776 1172240 964275 843063 700820 534352 45680 45440 29764 8080 8070 8060 8030122 10.17 November 2888820 2306400 1963180 1588660 1018550 2471730 1955900 1646060 1337520 876195 2073680 1630290 1381810 1129620 777716 1737280 1382450 1174850 976426 706333 45680 45440 29764 8080 8070 8060 8030123 10.25 December 3708160 2615350 2198120 1671010 1111140 3312420 2219330 1846380 1418500 973219 2899350 1870140 1547430 1224080 880565 2520880 1581360 1315560 1076550 811620 45680 45440 29764 8080 8070 8060 8030124 10.33 January 3793800 2669600 2271370 1765580 1043210 3609140 2302520 1940610 1486280 905570 3171690 1976670 1640560 1262980 808617 2788010 1705030 1391400 1091050 738781 45680 45440 29764 8080 8070 8060 8030125 10.42 February 2903970 2281560 1981550 1502650 1036840 2509180 1923830 1648150 1275510 899546 2119120 1617370 1383710 1098300 805977 1787880 1363680 1176510 961409 745475 45680 45440 29764 8080 8070 8060 8030126 10.5 March 2445070 2038790 1686230 1200110 785551 2049080 1677570 1378510 1014180 671048 1689140 1376960 1130270 869470 597266 1397820 1136380 945986 764489 547244 45680 45440 29764 8080 8070 8060 8030127 10.58 April 2598770 2072690 1733570 1288660 904717 2183450 1723330 1432280 1090230 771075 1800660 1423580 1187100 938310 685928 1495060 1187810 1004030 823746 626217 45680 45440 29764 8080 8070 8060 8030128 10.67 May 1968250 1661670 1371100 1038230 766202 1614530 1351300 1119650 868810 646977 1316050 1097210 918139 738959 566465 1079510 909400 778557 645965 511852 45680 45440 29764 8080 8070 8060 8030129 10.75 June 1804430 1477160 1205850 911170 681970 1476190 1192300 977661 758664 572543 1192380 963673 798004 645552 497021 980698 797135 674666 563701 445852 45680 45440 29764 8080 8070 8060 8030130 10.83 July 1511480 1308950 1084930 798592 646749 1216680 1045540 868648 663507 539218 971610 835062 703812 560571 467587 790049 686821 591237 492084 419382 45680 45440 29764 8080 8070 8060 8030131 10.92 August 1558620 1362780 1141910 863074 673507 1256940 1095020 919795 713698 564829 1009040 879112 746456 603202 489785 824259 723344 622819 523441 441948 45680 45440 29764 8080 8070 8060 8030132 11 September 1723570 1524150 1324260 1023100 778757 1405210 1237560 1070760 852183 654073 1147950 1005740 873074 718615 569097 943374 832309 733319 625061 510567 45680 45440 29764 8080 8070 8060 8030133 11.08 October 2252230 1793120 1583810 1216300 885093 1879370 1478910 1299930 1016910 752877 1546550 1216560 1062970 861314 661146 1287980 1010270 892339 747477 595366 45680 45440 29764 8080 8070 8060 8030134 11.17 November 2937240 2289820 1965060 1627520 1208290 2518870 1931480 1647670 1384300 1041130 2117470 1624220 1389670 1187060 931007 1776590 1369610 1187480 1037380 841940 45680 45440 29764 8080 8070 8060 8030135 11.25 December 3793800 2996640 2272230 1889070 1321020 3673740 2624110 1950190 1599390 1150990 3382110 2284220 1673840 1371900 1019010 2967410 1992880 1451210 1195110 921664 45680 45440 29764 8080 8070 8060 8030136 11.33 January 3685850 2758450 2366900 1958690 1443000 3289000 2399900 2021980 1686150 1256410 2889680 2068820 1740920 1458680 1124220 2525030 1800290 1504970 1287630 1022120 45680 45440 29764 8080 8070 8060 8030137 11.42 February 3793800 2860100 2301650 1846060 1192940 3673740 2500090 1987210 1587380 1030730 3279420 2153610 1699800 1367150 928576 2880070 1890490 1482960 1196600 846900 45680 45440 29764 8080 8070 8060 8030138 11.5 March 3793800 2641360 2184640 1661660 1168860 3444030 2264710 1850470 1433980 1019850 2989360 1921510 1566110 1243580 914161 2566690 1636250 1345780 1099420 844068 45680 45440 29764 8080 8070 8060 8030139 11.58 April 2642280 2065600 1728070 1240690 906555 2224470 1709160 1421170 1050600 774954 1837490 1404300 1171950 909475 689142 1519070 1176900 995354 800608 628915 45680 45440 29764 8080 8070 8060 8030140 11.67 May 2001100 1612400 1285980 904119 680041 1636490 1303020 1046090 757164 575499 1316150 1047170 848696 648465 507420 1063910 863217 712314 574596 461606 45680 45440 29764 8080 8070 8060 8030141 11.75 June 1606800 1343230 1093260 779561 601596 1292800 1074170 872315 644290 502793 1025290 858318 706664 548632 437390 833880 703008 588909 482513 392939 45680 45440 29764 8080 8070 8060 8030142 11.83 July 1506850 1273190 1030440 779878 591285 1212610 1011610 828676 642529 489404 968088 810339 672679 541595 421077 790346 666056 564283 472740 375003 45680 45440 29764 8080 8070 8060 8030143 11.92 August 1530280 1339300 1120140 834290 625804 1237640 1066690 897955 688096 523034 992854 855616 725268 580136 453479 810686 703621 604645 504213 405579 45680 45440 29764 8080 8070 8060 8030144 12 September 1724310 1507870 1315780 1055140 778267 1417800 1223390 1067510 870895 651179 1158470 989395 873621 734888 562203 960826 821986 733503 631915 500155 45680 45440 29764 8080 8070 8060 8030145 12.08 October 1972690 1678610 1447580 1120910 796715 1639980 1371660 1181030 928568 671969 1343980 1119120 957958 785922 587261 1118990 927539 805807 679839 527305 45680 45440 29764 8080 8070 8060 8030146 12.17 November 2493070 2045710 1787270 1400670 992598 2113120 1706310 1479980 1177550 851336 1754910 1401670 1217280 1000300 753352 1470270 1174480 1025170 868311 682422 45680 45440 29764 8080 8070 8060 8030147 12.25 December 3225730 2254110 2046370 1660330 1164530 2829390 1915460 1722200 1408340 1007800 2423320 1617440 1442870 1192400 895049 2079140 1370520 1222410 1037180 814586 45680 45440 29764 8080 8070 8060 8030148 12.33 January 3793800 2597310 2236670 1831140 1248930 3540700 2222340 1899090 1552740 1082810 3160200 1910790 1610430 1328970 970575 2791100 1644050 1378580 1161520 883161 45680 45440 29764 8080 8070 8060 8030149 12.42 February 3778790 2693780 2246430 1661380 1074570 3358680 2304720 1899600 1427440 937629 2903710 1939100 1595160 1231720 848499 2470820 1652270 1364920 1077800 786384 45680 45440 29764 8080 8070 8060 8030150 12.5 March 3353310 2557350 2081450 1455310 1000360 2920020 2164160 1731160 1252210 867598 2473720 1792080 1450980 1085900 783481 2091650 1511280 1229590 962761 722671 45680 45440 29764 8080 8070 8060 8030151 12.58 April 2407750 1914440 1545880 1068170 743707 2005080 1559760 1250980 898192 633559 1641710 1268840 1016800 776434 560497 1349470 1044590 856325 681981 514555 45680 45440 29764 8080 8070 8060 8030152 12.67 May 2248480 1762770 1418920 994606 735733 1858940 1439390 1146970 832279 624257 1513670 1161090 937121 713641 549790 1246570 958568 781043 629766 496955 45680 45440 29764 8080 8070 8060 8030153 12.75 June 1798210 1529370 1305430 1044490 796752 1470540 1246950 1066770 864472 667514 1203630 1013320 876347 731739 578927 994324 842001 744940 631387 517405 45680 45440 29764 8080 8070 8060 8030154 12.83 July 1676820 1430300 1187400 881335 657218 1370020 1152080 957971 729162 547805 1112660 929762 780979 618492 473258 917766 768280 654227 536632 422659 45680 45440 29764 8080 8070 8060 8030155 12.92 August 1583420 1374060 1163480 881625 689746 1283290 1104310 941150 729395 575262 1030560 886418 763856 616515 498687 841592 732038 639622 536822 446693 45680 45440 29764 8080 8070 8060 8030156 13 September 1799790 1536510 1316020 1048900 716743 1471910 1248000 1067570 865203 601265 1193860 1009850 873483 726865 524530 986099 839064 733176 624599 471146 45680 45440 29764 8080 8070 8060 8030157 13.08 October 2279200 1800300 1566350 1270230 901192 1912770 1485120 1295070 1060510 761729 1583590 1221640 1067710 892288 666312 1319830 1023910 899977 764973 597361 45680 45440 29764 8080 8070 8060 8030158 13.17 November 2822050 2252370 1996350 1537390 1144800 2406910 1905110 1661350 1306790 989088 2013500 1592240 1381930 1126250 877031 1673880 1348100 1168680 990881 797107 45680 45440 29764 8080 8070 8060 8030159 13.25 December 3793800 2647840 2308290 1881190 1355760 3566300 2291780 1966410 1620190 1178550 3142340 1956390 1672180 1403850 1058270 2744160 1686040 1441920 1223830 962932 45680 45440 29764 8080 8070 8060 8030160 13.33 January 3793800 3007730 2463200 1989490 1327030 3673740 2635120 2123330 1699810 1165360 3488290 2283240 1817700 1471220 1045420 3121040 1980880 1567060 1292410 959348 45680 45440 29764 8080 8070 8060 8030161 13.42 February 3711190 2790760 2366250 1767310 1202260 3301640 2409500 2012070 1526640 1050860 2874440 2046610 1697380 1329450 951308 2496610 1760080 1472870 1179010 875926 45680 45440 29764 8080 8070 8060 8030162 13.5 March 2692830 2291550 1890200 1366790 948374 2293250 1915510 1572360 1160620 818536 1909120 1593840 1297370 997435 730031 1598810 1328690 1105370 880934 670403 45680 45440 29764 8080 8070 8060 8030163 13.58 April 2693520 2174960 1775190 1276890 889203 2262630 1808410 1462750 1087270 760813 1871880 1483950 1213250 934776 677367 1540650 1239740 1026270 823330 619343 45680 45440 29764 8080 8070 8060 8030164 13.67 May 2064690 1734520 1377520 988703 724641 1708210 1408550 1120320 826755 611881 1389950 1130020 914367 708376 534216 1146960 932332 768070 622256 481832 45680 45440 29764 8080 8070 8060 8030165 13.75 June 1762270 1546140 1277580 964216 728874 1438880 1245980 1034590 802141 611982 1165770 1008110 848835 681143 530823 957844 833818 709017 595157 476945 45680 45440 29764 8080 8070 8060 8030166 13.83 July 1688880 1472850 1225030 900882 705589 1368880 1188270 986083 746134 590942 1106720 951777 804507 635647 514603 904398 783221 671407 555947 461499 45680 45440 29764 8080 8070 8060 8030167 13.92 August 1682780 1473230 1233950 912236 715477 1363600 1183810 997376 758665 599834 1102260 952085 810806 642296 521194 900694 783453 674020 564117 466124 45680 45440 29764 8080 8070 8060 8030168 14 September 1716150 1507050 1301550 983518 733596 1404430 1222480 1051000 816375 616177 1141690 988344 855872 688762 536399 937631 817160 712065 597460 480470 45680 45440 29764 8080 8070 8060 8030169 14.08 October 2361520 2010140 1709930 1283450 926908 1980330 1666400 1404910 1076290 790176 1635790 1366760 1152350 921003 695088 1358220 1138310 968698 803722 624152 45680 45440 29764 8080 8070 8060 8030

Layers Modulus: Project T-1
170 14.17 November 3220330 2420090 2076120 1626670 1103000 2811340 2053600 1749530 1377240 949871 2393820 1726800 1467180 1174810 846373 2028860 1468320 1243650 1020860 770798 45680 45440 29764 8080 8070 8060 8030171 14.25 December 3793800 2933990 2381840 2011120 1405470 3673740 2585060 2054700 1720020 1225300 3529620 2246210 1780160 1468540 1079330 3115870 1956670 1557320 1283350 974056 45680 45440 29764 8080 8070 8060 8030172 14.33 January 3793800 3793800 2888650 2224260 1475060 3673740 3478490 2551360 1948220 1302170 3563400 3110890 2258900 1713510 1188730 3467290 2786020 2034900 1552080 1093960 45680 45440 29764 8080 8070 8060 8030173 14.42 February 2832560 2363780 2061010 1508900 1057320 2450350 2000560 1712470 1291130 914014 2074410 1678490 1420390 1111650 818473 1756590 1417440 1208510 986416 750177 45680 45440 29764 8080 8070 8060 8030174 14.5 March 3297660 2335830 1957100 1470280 1000900 2863870 1965370 1632920 1255440 861351 2407740 1630440 1363070 1083800 770871 2019400 1382110 1163410 951667 707025 45680 45440 29764 8080 8070 8060 8030175 14.58 April 2512610 2112250 1732470 1249500 840440 2121820 1743440 1424800 1049830 715554 1753870 1427170 1180020 900699 633858 1453630 1190430 992473 788619 577116 45680 45440 29764 8080 8070 8060 8030176 14.67 May 2290150 1859610 1498680 1119560 795533 1914170 1524660 1230140 944008 672204 1584770 1238580 1016070 808334 588632 1313890 1028560 862816 707795 533680 45680 45440 29764 8080 8070 8060 8030177 14.75 June 1693370 1471300 1203020 906320 702242 1378530 1182110 970979 750733 587671 1109780 950580 791620 639568 511277 906832 778733 665630 557242 458120 45680 45440 29764 8080 8070 8060 8030178 14.83 July 1809860 1510650 1277140 955453 737779 1487080 1220540 1030160 791443 617849 1206530 986653 838228 676243 534222 991839 815635 705663 588216 478253 45680 45440 29764 8080 8070 8060 8030179 14.92 August 1661730 1402960 1216170 890395 667996 1356670 1133110 978472 736660 556853 1101120 913679 788684 622501 481000 911927 757679 657879 539814 429437 45680 45440 29764 8080 8070 8060 8030180 15 September 1701080 1466830 1187340 824466 592531 1379400 1168880 943610 683048 497682 1100730 924161 756963 578747 434061 891254 753767 626087 507620 392575 45680 45440 29764 8080 8070 8060 8030181 15.08 October 2132150 1789870 1557940 1167410 801169 1769330 1469360 1261160 972589 681541 1449680 1196880 1025060 824360 599308 1197700 983683 859202 713518 543791 45680 45440 29764 8080 8070 8060 8030182 15.17 November 2941010 2349450 2000100 1618730 1039050 2522460 1996150 1679480 1364100 893537 2120640 1666130 1411130 1152440 792463 1779160 1413850 1200040 995890 718971 45680 45440 29764 8080 8070 8060 8030183 15.25 December 3767510 2662900 2238760 1702190 1132770 3374670 2264560 1883770 1446490 992078 2961940 1911590 1580680 1248970 897252 2581550 1618220 1344580 1098550 826518 45680 45440 29764 8080 8070 8060 8030184 15.33 January 3793800 2717380 2312750 1798050 1063570 3673330 2348790 1979530 1515390 922993 3237440 2020150 1675760 1288540 823614 2853110 1744900 1422270 1113210 751819 45680 45440 29764 8080 8070 8060 8030185 15.42 February 2954410 2322600 2017430 1530120 1056860 2558680 1961920 1680380 1299820 916656 2165340 1651550 1411990 1119520 820740 1829560 1393370 1200810 979752 758499 45680 45440 29764 8080 8070 8060 8030186 15.5 March 2488240 2075220 1716520 1222300 802176 2089260 1710020 1404660 1033100 684530 1724690 1404740 1152020 885346 608263 1428140 1159300 963743 777806 556338 45680 45440 29764 8080 8070 8060 8030187 15.58 April 2643750 2109240 1764310 1311960 922523 2225770 1756340 1459210 1110330 785767 1838460 1452160 1209920 955435 698180 1527750 1211860 1023080 838253 636553 45680 45440 29764 8080 8070 8060 8030188 15.67 May 2002600 1690820 1395430 1057560 782236 1644900 1376260 1140070 884819 659849 1341690 1117670 934653 751984 576782 1100340 925825 791891 656563 520211 45680 45440 29764 8080 8070 8060 8030189 15.75 June 1835610 1502900 1227340 928636 697012 1503370 1213840 995285 772839 584436 1214790 980951 811956 656890 506364 998711 810735 685699 572757 453253 45680 45440 29764 8080 8070 8060 8030190 15.83 July 1537470 1331740 1104440 814587 661317 1238430 1064140 884285 676281 550646 988854 849552 715952 570581 476505 803341 697970 600651 499990 426400 45680 45440 29764 8080 8070 8060 8030191 15.92 August 1585060 1386120 1161970 879580 688132 1279200 1114270 936055 726948 576375 1026870 894279 759171 613668 498838 838147 735082 632661 531692 449138 45680 45440 29764 8080 8070 8060 8030192 16 September 1752350 1549730 1346740 1041340 794186 1430040 1259190 1089360 867205 666445 1168570 1023280 887944 730708 578985 959849 846208 745114 634815 518537 45680 45440 29764 8080 8070 8060 8030193 16.08 October 2288990 1822660 1610030 1236940 901466 1913070 1504870 1322470 1034370 766330 1575960 1238460 1081510 875777 672197 1312970 1028160 907421 759403 604503 45680 45440 29764 8080 8070 8060 8030194 16.17 November 2982820 2326720 1996970 1654110 1228590 2563360 1965760 1676560 1408150 1058790 2158850 1655010 1415170 1208030 946618 1813670 1396390 1209560 1055690 855677 45680 45440 29764 8080 8070 8060 8030195 16.25 December 3793800 3042340 2308430 1919420 1342680 3673740 2669660 1984410 1627020 1170320 3441660 2328300 1705360 1396700 1036190 3026930 2034500 1479730 1217110 937012 45680 45440 29764 8080 8070 8060 8030196 16.33 January 3736380 2800850 2404050 1989760 1466200 3341880 2441470 2057100 1715070 1277380 2942910 2108240 1773520 1485090 1143360 2576810 1837010 1534500 1311680 1039620 45680 45440 29764 8080 8070 8060 8030197 16.42 February 3793800 2903220 2337440 1875060 1212340 3673740 2542740 2021290 1614140 1047620 3336810 2194230 1731140 1391260 943612 2937100 1928850 1511590 1218130 860274 45680 45440 29764 8080 8070 8060 8030198 16.5 March 3793800 2681320 2218330 1687560 1187720 3497290 2303150 1881720 1457640 1036370 3042880 1957110 1594240 1264790 928761 2618210 1668290 1370740 1118350 857230 45680 45440 29764 8080 8070 8060 8030199 16.58 April 2681800 2097190 1754660 1260280 922078 2261820 1737530 1444340 1067430 787802 1871000 1428690 1191460 923838 699869 1547980 1197520 1011710 812770 637976 45680 45440 29764 8080 8070 8060 8030200 16.67 May 2031390 1637000 1305960 919446 693318 1663240 1323860 1062660 769653 586041 1338430 1063980 861849 658517 515790 1081670 876545 722712 582754 468327 45680 45440 29764 8080 8070 8060 8030201 16.75 June 1631030 1363760 1110560 793516 614170 1313240 1091010 886161 655382 512618 1041500 871496 717429 557354 445027 846473 713138 597202 489404 398920 45680 45440 29764 8080 8070 8060 8030202 16.83 July 1529400 1292570 1046810 793685 603657 1231490 1027310 841791 653483 499024 983055 822578 682849 550148 428502 801953 675454 572139 479450 380774 45680 45440 29764 8080 8070 8060 8030203 16.92 August 1552910 1359320 1137380 848439 638272 1256720 1083050 911848 699405 532807 1008110 868462 736069 589027 461091 822552 713542 612989 511212 411547 45680 45440 29764 8080 8070 8060 8030204 17 September 1749390 1529940 1335280 1071430 791765 1439650 1242030 1083690 884272 661985 1176660 1004420 886621 745705 570795 975571 833934 743823 640564 507027 45680 45440 29764 8080 8070 8060 8030205 17.08 October 2000940 1702780 1468600 1137790 810228 1665330 1392510 1198790 942574 682869 1365590 1136360 972257 797379 596041 1136980 941439 817317 689141 534424 45680 45440 29764 8080 8070 8060 8030206 17.17 November 2527810 2074640 1812670 1420840 1007860 2145910 1732480 1502380 1195060 864173 1784300 1424170 1236190 1015170 764194 1495900 1193490 1040930 880862 691649 45680 45440 29764 8080 8070 8060 8030207 17.25 December 3267580 2285470 2074990 1683730 1181550 2871610 1944760 1748350 1429330 1022600 2463970 1643870 1465920 1210630 907961 2117120 1393640 1242250 1053010 825973 45680 45440 29764 8080 8070 8060 8030208 17.33 January 3793800 2632520 2267470 1856580 1266770 3588780 2256060 1927810 1575840 1098520 3209620 1942390 1636430 1349570 984604 2840150 1672840 1401620 1179810 895702 45680 45440 29764 8080 8070 8060 8030209 17.42 February 3793800 2729690 2277010 1684300 1090220 3405080 2339270 1928020 1448270 951162 2950000 1970880 1620610 1250280 860401 2514830 1680940 1387420 1094120 797024 45680 45440 29764 8080 8070 8060 8030210 17.5 March 3394720 2591350 2109610 1475320 1015060 2961870 2196310 1756620 1270100 880100 2513820 1820890 1473440 1101620 794296 2128670 1536690 1248960 976583 732140 45680 45440 29764 8080 8070 8060 8030211 17.58 April 2439640 1940140 1566820 1083420 755980 2034520 1582250 1268680 910945 643440 1667490 1287710 1031190 787047 568465 1371200 1059940 868028 690740 521097 45680 45440 29764 8080 8070 8060 8030212 17.67 May 2278120 1786260 1438060 1008950 747822 1885840 1459770 1162950 844108 633956 1536820 1177820 950057 723300 557571 1265910 972065 791312 637684 503245 45680 45440 29764 8080 8070 8060 8030213 17.75 June 1821900 1549670 1323020 1059190 809181 1491180 1264220 1081460 876557 677502 1220940 1027350 888204 741537 586923 1008370 853212 754507 639254 523853 45680 45440 29764 8080 8070 8060 8030214 17.83 July 1698740 1449180 1203470 894338 668537 1388930 1167800 971080 739643 556708 1128220 942320 791343 626829 480213 930224 778134 662339 543235 428135 45680 45440 29764 8080 8070 8060 8030215 17.92 August 1603960 1392080 1179120 894498 701158 1300730 1119210 953915 739772 584280 1044600 898189 773884 624748 505781 852574 741220 647452 543362 452321 45680 45440 29764 8080 8070 8060 8030216 18 September 1822760 1556270 1333180 1063190 728221 1491930 1264750 1081820 876932 610394 1210470 1023400 884939 736308 531775 999559 849887 742277 632143 476940 45680 45440 29764 8080 8070 8060 8030217 18.08 October 2307680 1823050 1586260 1286710 913975 1939080 1505130 1312320 1074520 772219 1606770 1238550 1082050 903896 674927 1339630 1037930 911732 774464 604472 45680 45440 29764 8080 8070 8060 8030218 18.17 November 2855930 2280240 2021220 1556760 1159770 2439630 1931030 1683730 1324020 1002050 2043580 1615330 1401400 1141380 888288 1700370 1368240 1185310 1004120 806986 45680 45440 29764 8080 8070 8060 8030219 18.25 December 3793800 2679690 2336510 1904440 1372850 3609180 2322690 1992930 1641740 1193830 3186160 1985250 1696370 1423470 1072150 2787260 1712460 1463670 1241320 975515 45680 45440 29764 8080 8070 8060 8030220 18.33 January 3793800 3042540 2492820 2013770 1343640 3673740 2669840 2151720 1722290 1180310 3534010 2316700 1844040 1491780 1058960 3167530 2012290 1590970 1311040 971739 45680 45440 29764 8080 8070 8060 8030221 18.42 February 3749710 2823330 2394530 1788760 1217370 3341930 2441250 2038670 1546430 1064200 2914760 2076280 1721510 1347440 963290 2535590 1787320 1494770 1195300 886772 45680 45440 29764 8080 8070 8060 8030222 18.5 March 2724150 2318740 1912860 1383490 960932 2323260 1940530 1592610 1175220 829085 1936390 1616040 1314670 1009990 738954 1622860 1347670 1120160 891777 678079 45680 45440 29764 8080 8070 8060 8030223 18.58 April 2724540 2200600 1796300 1292470 901150 2291960 1831720 1481270 1100800 770689 1898300 1504130 1229030 946299 685605 1563410 1256880 1039500 833149 626304 45680 45440 29764 8080 8070 8060 8030224 18.67 May 2088850 1754970 1394010 1001360 735300 1729920 1426150 1134130 837185 620401 1408410 1144350 925505 716885 540999 1162240 943842 776980 629196 487288 45680 45440 29764 8080 8070 8060 8030225 18.75 June 1782830 1564290 1292860 976543 739458 1456710 1261260 1047220 812226 620422 1180510 1020470 858984 689272 537514 969668 843635 717012 601717 482308 45680 45440 29764 8080 8070 8060 8030226 18.83 July 1708420 1490030 1239640 912577 715931 1385610 1202660 998028 755596 599152 1120410 963221 813997 643227 521102 915233 792188 678833 562019 466681 45680 45440 29764 8080 8070 8060 8030227 18.92 August 1702070 1490240 1248510 923908 725780 1380100 1198000 1009330 768150 608029 1115760 963423 820283 649871 527684 911366 792336 681410 570217 471296 45680 45440 29764 8080 8070 8060 8030228 19 September 1735610 1524260 1316630 995653 743911 1421290 1237020 1063460 826310 624411 1155640 1000070 865823 696742 542948 948786 826448 719876 603862 485714 45680 45440 29764 8080 8070 8060 8030229 19.08 October 2387590 2032560 1729130 1298210 938473 2004500 1686520 1421620 1088920 799768 1657140 1383980 1166320 931693 703054 1376460 1152700 980240 812706 630786 45680 45440 29764 8080 8070 8060 8030230 19.17 November 3253280 2446480 2099020 1644810 1115930 2844460 2078440 1770530 1393430 960967 2425500 1749300 1485750 1188960 855999 2058040 1488280 1259700 1033120 779219 45680 45440 29764 8080 8070 8060 8030231 19.25 December 3793800 2964630 2407610 2033120 1421150 3673740 2615660 2079310 1740430 1239450 3563400 2275710 1803220 1486950 1091970 3157550 1984440 1578580 1299920 985427 45680 45440 29764 8080 8070 8060 8030232 19.33 January 3793800 3793800 2918640 2248230 1491290 3673740 3515810 2581330 1971290 1317110 3563400 3149150 2288270 1735360 1202790 3467290 2824260 2063550 1573020 1107150 45680 45440 29764 8080 8070 8060 8030233 19.42 February 2861830 2388880 2083100 1525320 1069490 2478990 2024060 1732410 1305810 924432 2101130 1699660 1437750 1124510 827499 1780730 1435980 1223530 997778 758089 45680 45440 29764 8080 8070 8060 8030234 19.5 March 3329810 2360430 1977940 1486160 1012510 2896180 1988230 1651670 1269550 871159 2438390 1650710 1379420 1096150 779274 2047350 1399880 1177530 962389 714318 45680 45440 29764 8080 8070 8060 8030235 19.58 April 2538610 2134440 1750830 1263130 850766 2146290 1763380 1440830 1061470 723999 1775710 1444310 1193600 910549 640807 1472430 1204880 1003740 796907 582899 45680 45440 29764 8080 8070 8060 8030236 19.67 May 2313860 1879070 1514550 1131920 805477 1935990 1541740 1243700 954441 680244 1604010 1252860 1027300 817006 595127 1330220 1040280 872060 714978 539004 45680 45440 29764 8080 8070 8060 8030237 19.75 June 1711000 1486760 1215980 916907 711563 1393710 1195000 981591 759308 595067 1122160 960878 800035 646447 517128 916633 786762 672267 562741 462782 45680 45440 29764 8080 8070 8060 8030238 19.83 July 1828470 1526340 1290650 966296 747208 1503400 1233750 1041280 800280 625370 1220110 997308 847088 683397 540183 1002800 824075 712704 593963 483025 45680 45440 29764 8080 8070 8060 8030239 19.92 August 1678730 1417480 1229020 900681 676979 1371310 1145220 988966 744969 563936 1113160 923341 796917 629109 486550 921619 765293 664312 545058 433819 45680 45440 29764 8080 8070 8060 8030

T-1
Asphalt Sub-Layers Modulus Vs Time
0
500,000
1,000,000
1,500,000
2,000,000
2,500,000
3,000,000
3,500,000
4,000,000
0 24 48 72 96 120 144 168 192 216 240
Pavement Age (month)
Mod
ulus
(psi
) AC1(1) h=0.5AC1(2) h=0.5AC1(3) h=1.0AC1(4) h=1.0

Fatigue Cracking: Project T-1
mo yr1 0.08 October 0.000442 0 13.4 0.0000472 0 2.5 0.0859 0.01 0 257.17 1.042 0.17 November 0.000841 0 2.5 0.000101 0 2.5 0.163 0.01 0 257.75 1.293 0.25 December 0.00128 0 2.5 0.000161 0 2.5 0.23 0.02 0 258.37 1.54 0.33 January 0.00171 0 2.5 0.000218 0 2.5 0.299 0.03 0 258.97 1.695 0.42 February 0.00212 0 2.5 0.000271 0 2.5 0.37 0.05 0 259.53 1.896 0.5 March 0.00251 0 2.5 0.000316 0 2.5 0.446 0.06 0 260.06 2.097 0.58 April 0.0029 0 2.5 0.000363 0 2.5 0.52 0.07 0 260.58 2.288 0.67 May 0.00326 0 2.5 0.000402 0 2.5 0.6 0.09 0 261.06 2.489 0.75 June 0.00362 0 2.5 0.000439 0 2.5 0.681 0.11 0 261.54 2.6810 0.83 July 0.00398 0 2.5 0.000471 0 2.5 0.765 0.12 0 262.01 2.8811 0.92 August 0.00433 0 2.5 0.000504 0 2.5 0.848 0.14 0 262.47 3.0712 1 September 0.00468 0 2.5 0.000541 0 2.5 0.928 0.16 0 262.93 3.2513 1.08 October 0.00505 0 2.5 0.000584 0 2.5 1 0.18 0 263.41 3.4114 1.17 November 0.00545 0 2.5 0.000636 0 2.5 1.07 0.2 0 263.93 3.5615 1.25 December 0.00589 0 2.5 0.000695 0 2.5 1.13 0.21 0 264.49 3.6916 1.33 January 0.00633 0 2.5 0.000757 0 2.5 1.19 0.22 0 265.05 3.8117 1.42 February 0.00677 0 2.5 0.000817 0 2.5 1.24 0.24 0 265.61 3.9218 1.5 March 0.00719 0.01 2.5 0.000873 0 2.5 1.3 0.25 0 266.14 4.0419 1.58 April 0.00756 0.01 2.5 0.000918 0 2.5 1.37 0.27 0 266.61 4.1820 1.67 May 0.00791 0.01 2.5 0.000955 0 2.5 1.44 0.29 0 267.05 4.3221 1.75 June 0.00825 0.01 2.5 0.000986 0 2.5 1.53 0.32 0 267.48 4.4922 1.83 July 0.00859 0.01 2.5 0.00102 0 2.5 1.61 0.34 0 267.9 4.6523 1.92 August 0.00893 0.01 2.5 0.00105 0 2.5 1.69 0.36 0 268.33 4.824 2 September 0.00926 0.01 2.5 0.00108 0 2.5 1.77 0.39 0 268.74 4.9525 2.08 October 0.00962 0.01 2.5 0.00112 0 2.5 1.85 0.41 0 269.19 5.126 2.17 November 0.01 0.01 2.5 0.00117 0 2.5 1.92 0.43 0 269.66 5.2327 2.25 December 0.0104 0.01 2.5 0.00122 0 2.5 1.99 0.45 0 270.15 5.3528 2.33 January 0.0109 0.01 2.5 0.00128 0 2.5 2.04 0.47 0 270.77 5.4429 2.42 February 0.0113 0.01 2.5 0.00134 0 2.5 2.1 0.49 0 271.26 5.5430 2.5 March 0.0117 0.01 2.5 0.00139 0 2.5 2.16 0.51 0 271.75 5.6531 2.58 April 0.0121 0.01 2.5 0.00144 0 2.5 2.24 0.53 0 272.24 5.7932 2.67 May 0.0124 0.01 2.5 0.00148 0 2.5 2.31 0.56 0 272.61 5.9133 2.75 June 0.0128 0.01 2.5 0.00151 0 2.5 2.4 0.59 0 273.1 6.0634 2.83 July 0.0131 0.01 2.5 0.00155 0 2.5 2.48 0.61 0 273.46 6.1935 2.92 August 0.0135 0.01 2.5 0.00158 0 2.5 2.56 0.64 0 273.94 6.3236 3 September 0.0138 0.01 2.5 0.00162 0 2.5 2.64 0.67 0 274.31 6.4537 3.08 October 0.0142 0.01 2.5 0.00166 0 2.5 2.72 0.7 0 274.79 6.5838 3.17 November 0.0146 0.02 2.5 0.00172 0 2.5 2.79 0.72 0 275.28 6.6939 3.25 December 0.0151 0.02 2.5 0.00178 0 2.5 2.84 0.74 0 275.88 6.7840 3.33 January 0.0156 0.02 2.5 0.00185 0 0 2.9 0.76 0 276.48 6.8741 3.42 February 0.016 0.02 2.5 0.00191 0 0 2.96 0.78 0 276.96 6.9642 3.5 March 0.0165 0.02 2.5 0.00197 0 0 3.02 0.81 0 277.56 7.0643 3.58 April 0.0169 0.02 2.5 0.00202 0 0 3.1 0.83 0 278.04 7.1844 3.67 May 0.0172 0.02 2.5 0.00206 0 0 3.18 0.86 0 278.39 7.345 3.75 June 0.0176 0.02 2.5 0.00209 0 0 3.26 0.89 0 278.87 7.4246 3.83 July 0.018 0.02 2.5 0.00213 0 0 3.35 0.93 0 279.35 7.5547 3.92 August 0.0183 0.02 2.5 0.00217 0 0 3.43 0.96 0 279.7 7.6748 4 September 0.0187 0.02 2.5 0.0022 0 0 3.52 0.99 0 280.18 7.849 4.08 October 0.0191 0.02 2.5 0.00225 0 0 3.59 1.02 0 280.65 7.9150 4.17 November 0.0196 0.02 2.5 0.00231 0 0 3.66 1.05 0 281.24 8.0151 4.25 December 0.0201 0.03 2.5 0.00239 0 0 3.71 1.07 0 281.83 8.0852 4.33 January 0.0206 0.03 2.5 0.00247 0 0 3.75 1.08 0 282.42 8.1353 4.42 February 0.0211 0.03 2.5 0.00253 0 0 3.82 1.11 0 283.01 8.2454 4.5 March 0.0215 0.03 2.5 0.00259 0 0 3.89 1.14 0 283.48 8.3455 4.58 April 0.0219 0.03 2.5 0.00264 0 0 3.97 1.17 0 283.94 8.4556 4.67 May 0.0223 0.03 2.5 0.00269 0 0 4.05 1.2 0 284.41 8.5657 4.75 June 0.0227 0.03 2.5 0.00273 0 0 4.13 1.23 0 284.88 8.6658 4.83 July 0.0231 0.03 2.5 0.00277 0 0 4.22 1.27 0 285.35 8.7959 4.92 August 0.0235 0.03 2.5 0.0028 0 0 4.31 1.31 0 285.81 8.9260 5 September 0.0238 0.03 2.5 0.00284 0 0 4.4 1.34 0 286.16 9.0361 5.08 October 0.0242 0.03 2.5 0.00289 0 0 4.48 1.38 0 286.63 9.1462 5.17 November 0.0247 0.03 2.5 0.00295 0 0 4.55 1.41 0 287.21 9.24
Fatigue Cracking: Project T-1Top Down at Surface Top Down at 0.5" Bottom Up at hac Reliability
Pavementage
Month
MaximumDamage
(%)
MaximumCracking
(ft/mi)Location
(in)
MaximumDamage
(%)
MaximumCracking
(ft/mi)Location
(in)
Bottom UpCracking
(%)
MaximumDamage
(%)
MaximumCracking
(%)Location
(in)
Top DownCracking
(ft/mi)

Fatigue Cracking: Project T-1
63 5.25 December 0.0252 0.04 2.5 0.00302 0 0 4.61 1.43 0 287.79 9.3164 5.33 January 0.0257 0.04 2.5 0.00309 0 0 4.68 1.46 0 288.37 9.465 5.42 February 0.0262 0.04 2.5 0.00315 0 0 4.75 1.49 0 288.94 9.4966 5.5 March 0.0266 0.04 2.5 0.0032 0 0 4.83 1.52 0 289.41 9.5967 5.58 April 0.0271 0.04 2.5 0.00326 0 0 4.9 1.56 0 289.98 9.6968 5.67 May 0.0275 0.04 2.5 0.0033 0 0 4.99 1.59 0 290.44 9.869 5.75 June 0.0279 0.04 2.5 0.00334 0 0 5.08 1.63 0 290.9 9.9270 5.83 July 0.0282 0.04 2.5 0.00338 0 0 5.17 1.67 0 291.25 10.0371 5.92 August 0.0286 0.04 2.5 0.00342 0 0 5.26 1.71 0 291.71 10.1572 6 September 0.029 0.04 2.5 0.00346 0 0 5.35 1.75 0 292.17 10.2673 6.08 October 0.0295 0.05 2.5 0.00351 0 0 5.44 1.79 0 292.74 10.3774 6.17 November 0.03 0.05 2.5 0.00358 0 0 5.51 1.82 0 293.31 10.4575 6.25 December 0.0305 0.05 2.5 0.00366 0 0 5.56 1.85 0 293.88 10.5276 6.33 January 0.0311 0.05 2.5 0.00374 0 0 5.62 1.87 0 294.56 10.5977 6.42 February 0.0316 0.05 2.5 0.00382 0 0 5.68 1.9 0 295.13 10.6778 6.5 March 0.0321 0.05 2.5 0.00389 0 0 5.75 1.93 0 295.7 10.7579 6.58 April 0.0326 0.05 2.5 0.00395 0 0 5.83 1.96 0 296.27 10.8480 6.67 May 0.033 0.05 2.5 0.00399 0 0 5.92 2 0 296.72 10.9581 6.75 June 0.0334 0.05 2.5 0.00403 0 0 6.01 2.05 0 297.18 11.0682 6.83 July 0.0338 0.06 2.5 0.00407 0 0 6.12 2.1 0 297.63 11.1983 6.92 August 0.0342 0.06 2.5 0.0041 0 0 6.21 2.14 0 298.08 11.384 7 September 0.0346 0.06 2.5 0.00415 0 0 6.31 2.19 0 298.53 11.4285 7.08 October 0.0351 0.06 2.5 0.0042 0 0 6.4 2.23 0 299.1 11.5286 7.17 November 0.0356 0.06 2.5 0.00426 0 0 6.48 2.27 0 299.66 11.6287 7.25 December 0.0361 0.06 2.5 0.00433 0 0 6.55 2.3 0 300.22 11.6988 7.33 January 0.0366 0.06 2.5 0.00441 0 0 6.62 2.33 0 300.78 11.7789 7.42 February 0.0372 0.06 2.5 0.00449 0 0 6.68 2.36 0 301.46 11.8490 7.5 March 0.0377 0.07 2.5 0.00456 0 0 6.75 2.39 0 302.02 11.9291 7.58 April 0.0382 0.07 2.5 0.00461 0 0 6.84 2.44 0 302.58 12.0392 7.67 May 0.0386 0.07 2.5 0.00466 0 0 6.93 2.48 0 303.03 12.1393 7.75 June 0.0391 0.07 2.5 0.00471 0 0 7.03 2.53 0 303.58 12.2494 7.83 July 0.0395 0.07 2.5 0.00475 0 0 7.13 2.58 0 304.03 12.3695 7.92 August 0.0399 0.07 2.5 0.00479 0 0 7.23 2.63 0 304.48 12.4796 8 September 0.0403 0.07 2.5 0.00484 0 0 7.32 2.67 0 304.92 12.5697 8.08 October 0.0408 0.07 2.5 0.0049 0 0 7.41 2.72 0 305.48 12.6798 8.17 November 0.0413 0.08 2.5 0.00497 0 0 7.49 2.75 0 306.04 12.7599 8.25 December 0.0419 0.08 2.5 0.00505 0 0 7.56 2.78 0 306.7 12.82100 8.33 January 0.0425 0.08 2.5 0.00514 0 0 7.62 2.82 0 307.37 12.9101 8.42 February 0.0431 0.08 2.5 0.00522 0 0 7.68 2.85 0 308.03 12.96102 8.5 March 0.0436 0.08 2.5 0.00529 0 0 7.76 2.89 0 308.59 13.05103 8.58 April 0.0441 0.08 2.5 0.00535 0 0 7.85 2.93 0 309.14 13.14104 8.67 May 0.0446 0.09 2.5 0.00541 0 0 7.94 2.98 0 309.69 13.24105 8.75 June 0.0451 0.09 2.5 0.00545 0 0 8.04 3.03 0 310.24 13.35106 8.83 July 0.0455 0.09 2.5 0.0055 0 0 8.14 3.08 0 310.68 13.46107 8.92 August 0.0459 0.09 2.5 0.00554 0 0 8.25 3.13 0 311.13 13.57108 9 September 0.0464 0.09 2.5 0.00559 0 0 8.35 3.18 0 311.68 13.68109 9.08 October 0.0469 0.09 2.5 0.00565 0 0 8.44 3.23 0 312.23 13.77110 9.17 November 0.0474 0.09 2.5 0.00573 0 0 8.52 3.27 0 312.77 13.86111 9.25 December 0.0481 0.1 2.5 0.00582 0 0 8.58 3.3 0 313.54 13.92112 9.33 January 0.0487 0.1 2.5 0.00593 0 0 8.63 3.33 0 314.2 13.98113 9.42 February 0.0493 0.1 2.5 0.006 0 0 8.71 3.37 0 314.86 14.06114 9.5 March 0.0499 0.1 2.5 0.00608 0 0 8.79 3.41 0 315.51 14.14115 9.58 April 0.0504 0.1 2.5 0.00614 0 0 8.88 3.46 0 316.06 14.24116 9.67 May 0.0509 0.1 2.5 0.0062 0 0 8.97 3.5 0 316.6 14.32117 9.75 June 0.0513 0.11 2.5 0.00625 0 0 9.08 3.56 0 317.04 14.44118 9.83 July 0.0518 0.11 2.5 0.0063 0 0 9.19 3.62 0 317.58 14.56119 9.92 August 0.0523 0.11 2.5 0.00634 0 0 9.3 3.67 0 318.13 14.66120 10 September 0.0527 0.11 2.5 0.00639 0 0 9.4 3.73 0 318.56 14.77121 10.1 October 0.0532 0.11 2.5 0.00645 0 0 9.5 3.78 0 319.11 14.87122 10.2 November 0.0538 0.11 2.5 0.00652 0 0 9.59 3.82 0 319.76 14.95123 10.3 December 0.0544 0.12 2.5 0.00661 0 0 9.66 3.86 0 320.41 15.03124 10.3 January 0.0551 0.12 2.5 0.0067 0 0 9.73 3.9 0 321.16 15.1125 10.4 February 0.0556 0.12 2.5 0.00678 0 0 9.81 3.94 0 321.7 15.18126 10.5 March 0.0562 0.12 2.5 0.00684 0 0 9.91 3.99 0 322.35 15.27127 10.6 April 0.0567 0.12 2.5 0.00691 0.01 0 10 4.04 0 322.89 15.37128 10.7 May 0.0572 0.12 2.5 0.00697 0.01 0 10.1 4.1 0 323.43 15.47129 10.8 June 0.0577 0.13 2.5 0.00702 0.01 0 10.2 4.16 0 323.97 15.58130 10.8 July 0.0582 0.13 2.5 0.00706 0.01 0 10.3 4.22 0 324.51 15.68

Fatigue Cracking: Project T-1
131 10.9 August 0.0586 0.13 2.5 0.00711 0.01 0 10.4 4.28 0 324.94 15.79132 11 September 0.0591 0.13 2.5 0.00716 0.01 0 10.5 4.34 0 325.48 15.89133 11.1 October 0.0597 0.13 2.5 0.00723 0.01 0 10.7 4.39 0 326.12 16.03134 11.2 November 0.0603 0.14 2.5 0.00731 0.01 0 10.7 4.44 0 326.76 16.08135 11.3 December 0.061 0.14 2.5 0.00741 0.01 0 10.8 4.47 0 327.51 16.15136 11.3 January 0.0616 0.14 2.5 0.00751 0.01 0 10.9 4.51 0 328.16 16.23137 11.4 February 0.0623 0.14 2.5 0.00761 0.01 0 10.9 4.55 0 328.91 16.27138 11.5 March 0.0629 0.14 2.5 0.0077 0.01 0 11 4.59 0 329.55 16.36139 11.6 April 0.0635 0.15 2.5 0.00777 0.01 0 11.1 4.64 0 330.19 16.45140 11.7 May 0.064 0.15 2.5 0.00783 0.01 0 11.2 4.7 0 330.72 16.55141 11.8 June 0.0645 0.15 2.5 0.00787 0.01 0 11.3 4.77 0 331.25 16.66142 11.8 July 0.065 0.15 2.5 0.00792 0.01 0 11.5 4.84 0 331.78 16.81143 11.9 August 0.0655 0.15 2.5 0.00796 0.01 0 11.6 4.9 0 332.32 16.91144 12 September 0.066 0.16 2.5 0.00802 0.01 0 11.7 4.96 0 332.85 17.01145 12.1 October 0.0665 0.16 2.5 0.00808 0.01 0 11.8 5.02 0 333.38 17.11146 12.2 November 0.0671 0.16 2.5 0.00816 0.01 0 11.9 5.08 0 334.01 17.21147 12.3 December 0.0678 0.16 2.5 0.00825 0.01 0 12 5.13 0 334.76 17.3148 12.3 January 0.0685 0.16 2.5 0.00834 0.01 0 12.1 5.17 0 335.5 17.37149 12.4 February 0.0691 0.17 2.5 0.00844 0.01 0 12.1 5.21 0 336.13 17.41150 12.5 March 0.0698 0.17 2.5 0.00853 0.01 0 12.2 5.26 0 336.87 17.5151 12.6 April 0.0704 0.17 2.5 0.00859 0.01 0 12.3 5.31 0 337.5 17.59152 12.7 May 0.0709 0.17 2.5 0.00866 0.01 0 12.4 5.38 0 338.03 17.7153 12.8 June 0.0714 0.17 2.5 0.00871 0.01 0 12.6 5.44 0 338.56 17.83154 12.8 July 0.072 0.18 2.5 0.00877 0.01 0 12.7 5.51 0 339.19 17.93155 12.9 August 0.0725 0.18 2.5 0.00882 0.01 0 12.8 5.58 0 339.71 18.04156 13 September 0.073 0.18 2.5 0.00887 0.01 0 12.9 5.65 0 340.24 18.15157 13.1 October 0.0736 0.18 2.5 0.00894 0.01 0 13 5.71 0 340.87 18.24158 13.2 November 0.0742 0.19 2.5 0.00903 0.01 0 13.1 5.76 0 341.5 18.33159 13.3 December 0.0749 0.19 2.5 0.00913 0.01 0 13.2 5.81 0 342.24 18.41160 13.3 January 0.0757 0.19 2.5 0.00924 0.01 0 13.3 5.85 0 343.07 18.49161 13.4 February 0.0764 0.19 2.5 0.00935 0.01 0 13.3 5.89 0 343.8 18.53162 13.5 March 0.0771 0.2 2.5 0.00943 0.01 0 13.4 5.95 0 344.54 18.62163 13.6 April 0.0777 0.2 2.5 0.00951 0.01 0 13.5 6.01 0 345.16 18.71164 13.7 May 0.0783 0.2 2.5 0.00958 0.01 0 13.7 6.07 0 345.79 18.84165 13.8 June 0.0788 0.2 2.5 0.00963 0.01 0 13.8 6.14 0 346.31 18.94166 13.8 July 0.0793 0.2 2.5 0.00969 0.01 0 13.9 6.21 0 346.83 19.05167 13.9 August 0.0798 0.21 2.5 0.00974 0.01 0 14 6.29 0 347.35 19.16168 14 September 0.0804 0.21 2.5 0.0098 0.01 0 14.1 6.36 0 347.97 19.26169 14.1 October 0.081 0.21 2.5 0.00988 0.01 0 14.3 6.42 0 348.6 19.38170 14.2 November 0.0817 0.21 2.5 0.00997 0.01 0 14.4 6.47 0 349.32 19.46171 14.3 December 0.0825 0.22 2.5 0.0101 0.01 0 14.4 6.52 0 350.15 19.51172 14.3 January 0.0833 0.22 2.5 0.0102 0.01 0 14.5 6.55 0 350.98 19.58173 14.4 February 0.084 0.22 2.5 0.0103 0.01 0 14.6 6.61 0 351.7 19.67174 14.5 March 0.0847 0.23 2.5 0.0104 0.01 0 14.7 6.67 0 352.43 19.76175 14.6 April 0.0853 0.23 2.5 0.0105 0.01 0 14.8 6.72 0 353.05 19.84176 14.7 May 0.0859 0.23 2.5 0.0106 0.01 0 14.9 6.79 0 353.67 19.94177 14.8 June 0.0865 0.23 2.5 0.0106 0.01 0 15 6.87 0 354.28 20.05178 14.8 July 0.0871 0.24 2.5 0.0107 0.01 0 15.2 6.94 0 354.9 20.18179 14.9 August 0.0876 0.24 2.5 0.0107 0.01 0 15.3 7.02 0 355.42 20.29180 15 September 0.0882 0.24 2.5 0.0108 0.01 0 15.4 7.1 0 356.03 20.4181 15.1 October 0.0888 0.24 2.5 0.0109 0.01 0 15.5 7.16 0 356.65 20.48182 15.2 November 0.0895 0.25 2.5 0.011 0.01 0 15.6 7.22 0 357.37 20.57183 15.3 December 0.0903 0.25 2.5 0.0111 0.01 0 15.7 7.28 0 358.19 20.66184 15.3 January 0.091 0.25 2.5 0.0112 0.01 0 15.8 7.33 0 358.91 20.74185 15.4 February 0.0918 0.26 2.5 0.0113 0.01 0 15.9 7.38 0 359.73 20.82186 15.5 March 0.0924 0.26 2.5 0.0113 0.01 0 16 7.46 0 360.34 20.93187 15.6 April 0.0931 0.26 2.5 0.0114 0.01 0 16.1 7.52 0 361.05 21.01188 15.7 May 0.0937 0.26 2.5 0.0115 0.01 0 16.3 7.59 0 361.67 21.14189 15.8 June 0.0943 0.27 2.5 0.0116 0.01 0 16.4 7.67 0 362.28 21.24190 15.8 July 0.0949 0.27 2.5 0.0116 0.01 0 16.5 7.75 0 362.89 21.35191 15.9 August 0.0954 0.27 2.5 0.0117 0.01 0 16.7 7.84 0 363.4 21.49192 16 September 0.096 0.27 2.5 0.0117 0.01 0 16.8 7.91 0 364.01 21.59193 16.1 October 0.0967 0.28 2.5 0.0118 0.01 0 16.9 7.99 0 364.72 21.7194 16.2 November 0.0974 0.28 2.5 0.0119 0.01 0 17 8.04 0 365.43 21.77195 16.3 December 0.0983 0.28 2.5 0.0121 0.01 0 17.1 8.1 0 366.35 21.86196 16.3 January 0.0991 0.29 2.5 0.0122 0.01 0 17.2 8.14 0 367.16 21.92197 16.4 February 0.0999 0.29 2.5 0.0123 0.01 0 17.3 8.19 0 367.97 22198 16.5 March 0.101 0.29 2.5 0.0124 0.01 0 17.3 8.25 0 369.08 22.06
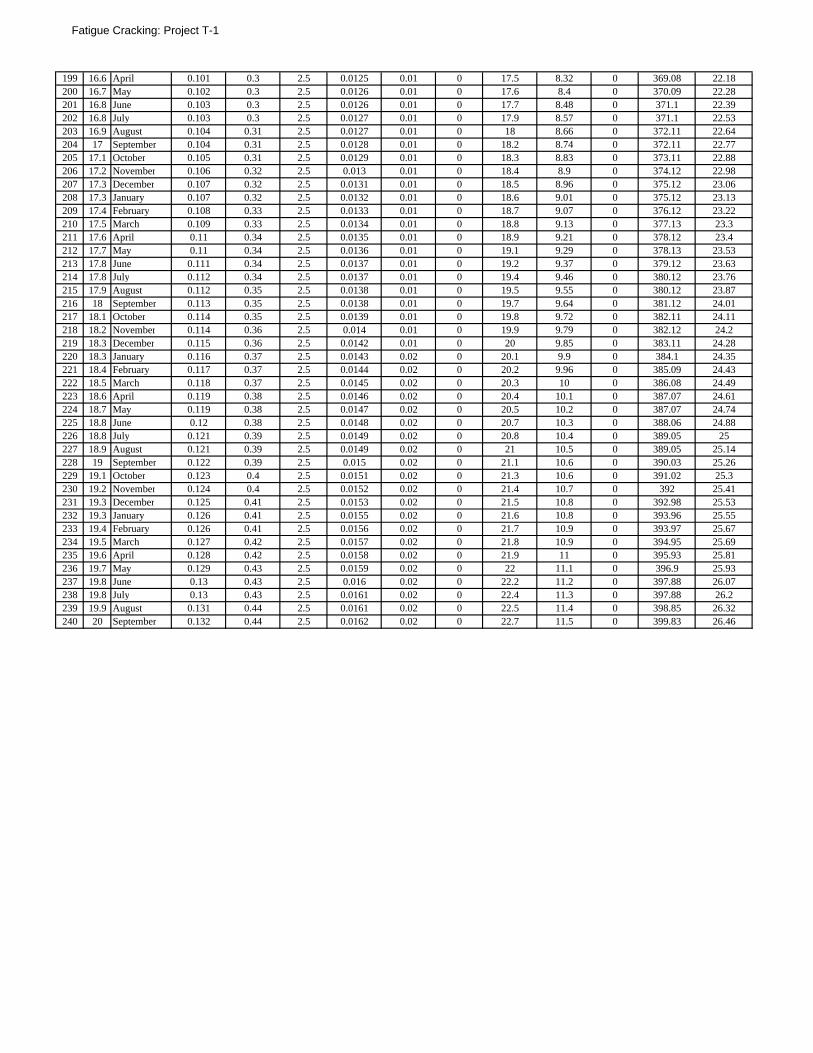
Fatigue Cracking: Project T-1
199 16.6 April 0.101 0.3 2.5 0.0125 0.01 0 17.5 8.32 0 369.08 22.18200 16.7 May 0.102 0.3 2.5 0.0126 0.01 0 17.6 8.4 0 370.09 22.28201 16.8 June 0.103 0.3 2.5 0.0126 0.01 0 17.7 8.48 0 371.1 22.39202 16.8 July 0.103 0.3 2.5 0.0127 0.01 0 17.9 8.57 0 371.1 22.53203 16.9 August 0.104 0.31 2.5 0.0127 0.01 0 18 8.66 0 372.11 22.64204 17 September 0.104 0.31 2.5 0.0128 0.01 0 18.2 8.74 0 372.11 22.77205 17.1 October 0.105 0.31 2.5 0.0129 0.01 0 18.3 8.83 0 373.11 22.88206 17.2 November 0.106 0.32 2.5 0.013 0.01 0 18.4 8.9 0 374.12 22.98207 17.3 December 0.107 0.32 2.5 0.0131 0.01 0 18.5 8.96 0 375.12 23.06208 17.3 January 0.107 0.32 2.5 0.0132 0.01 0 18.6 9.01 0 375.12 23.13209 17.4 February 0.108 0.33 2.5 0.0133 0.01 0 18.7 9.07 0 376.12 23.22210 17.5 March 0.109 0.33 2.5 0.0134 0.01 0 18.8 9.13 0 377.13 23.3211 17.6 April 0.11 0.34 2.5 0.0135 0.01 0 18.9 9.21 0 378.12 23.4212 17.7 May 0.11 0.34 2.5 0.0136 0.01 0 19.1 9.29 0 378.13 23.53213 17.8 June 0.111 0.34 2.5 0.0137 0.01 0 19.2 9.37 0 379.12 23.63214 17.8 July 0.112 0.34 2.5 0.0137 0.01 0 19.4 9.46 0 380.12 23.76215 17.9 August 0.112 0.35 2.5 0.0138 0.01 0 19.5 9.55 0 380.12 23.87216 18 September 0.113 0.35 2.5 0.0138 0.01 0 19.7 9.64 0 381.12 24.01217 18.1 October 0.114 0.35 2.5 0.0139 0.01 0 19.8 9.72 0 382.11 24.11218 18.2 November 0.114 0.36 2.5 0.014 0.01 0 19.9 9.79 0 382.12 24.2219 18.3 December 0.115 0.36 2.5 0.0142 0.01 0 20 9.85 0 383.11 24.28220 18.3 January 0.116 0.37 2.5 0.0143 0.02 0 20.1 9.9 0 384.1 24.35221 18.4 February 0.117 0.37 2.5 0.0144 0.02 0 20.2 9.96 0 385.09 24.43222 18.5 March 0.118 0.37 2.5 0.0145 0.02 0 20.3 10 0 386.08 24.49223 18.6 April 0.119 0.38 2.5 0.0146 0.02 0 20.4 10.1 0 387.07 24.61224 18.7 May 0.119 0.38 2.5 0.0147 0.02 0 20.5 10.2 0 387.07 24.74225 18.8 June 0.12 0.38 2.5 0.0148 0.02 0 20.7 10.3 0 388.06 24.88226 18.8 July 0.121 0.39 2.5 0.0149 0.02 0 20.8 10.4 0 389.05 25227 18.9 August 0.121 0.39 2.5 0.0149 0.02 0 21 10.5 0 389.05 25.14228 19 September 0.122 0.39 2.5 0.015 0.02 0 21.1 10.6 0 390.03 25.26229 19.1 October 0.123 0.4 2.5 0.0151 0.02 0 21.3 10.6 0 391.02 25.3230 19.2 November 0.124 0.4 2.5 0.0152 0.02 0 21.4 10.7 0 392 25.41231 19.3 December 0.125 0.41 2.5 0.0153 0.02 0 21.5 10.8 0 392.98 25.53232 19.3 January 0.126 0.41 2.5 0.0155 0.02 0 21.6 10.8 0 393.96 25.55233 19.4 February 0.126 0.41 2.5 0.0156 0.02 0 21.7 10.9 0 393.97 25.67234 19.5 March 0.127 0.42 2.5 0.0157 0.02 0 21.8 10.9 0 394.95 25.69235 19.6 April 0.128 0.42 2.5 0.0158 0.02 0 21.9 11 0 395.93 25.81236 19.7 May 0.129 0.43 2.5 0.0159 0.02 0 22 11.1 0 396.9 25.93237 19.8 June 0.13 0.43 2.5 0.016 0.02 0 22.2 11.2 0 397.88 26.07238 19.8 July 0.13 0.43 2.5 0.0161 0.02 0 22.4 11.3 0 397.88 26.2239 19.9 August 0.131 0.44 2.5 0.0161 0.02 0 22.5 11.4 0 398.85 26.32240 20 September 0.132 0.44 2.5 0.0162 0.02 0 22.7 11.5 0 399.83 26.46

T-1
Surface Down Cracking - Longitudinal
0
10
20
30
40
50
60
70
80
90
100
0 24 48 72 96 120 144 168 192 216 240 264
Pavement Age (month)
Max
imum
Dam
age(
%)
SurfaceDepth = 0.5"

T-1
Surface Down Cracking - Longitudinal
0
200
400
600
800
1000
1200
1400
1600
1800
2000
0 24 48 72 96 120 144 168 192 216 240 264
Pavement Age (month)
Long
itudi
nal C
rack
ing
(ft/m
i)
SurfaceDepth = 0.5"Surface at ReliabilityDesign Limit

T-1
Bottom Up Damage for Alligator Cracking
0
10
20
30
40
50
60
70
80
90
100
0 24 48 72 96 120 144 168 192 216 240 264
Pavement Age (month)
Max
imum
Dam
age
(%)
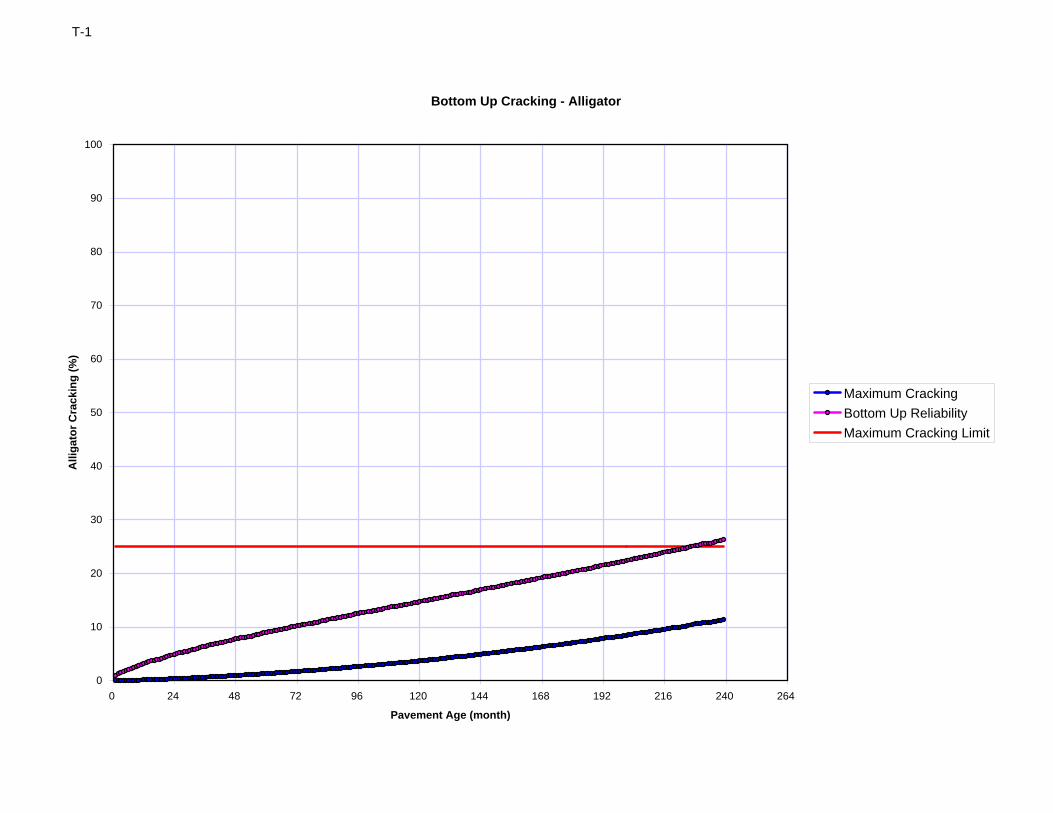
T-1
Bottom Up Cracking - Alligator
0
10
20
30
40
50
60
70
80
90
100
0 24 48 72 96 120 144 168 192 216 240 264
Pavement Age (month)
Alli
gato
r Cra
ckin
g (%
)
Maximum CrackingBottom Up ReliabilityMaximum Cracking Limit

Thermal Cracking: Project T-1
mo yr1 0.08 October 0 0 0 14.62 0.17 November 0 0 0 14.63 0.25 December 0 0 0 14.64 0.33 January 0 0 0 14.65 0.42 February 0 0 0 14.66 0.5 March 0 0 0 14.67 0.58 April 0 0 0 14.68 0.67 May 0 0 0 14.69 0.75 June 0 0 0 14.610 0.83 July 0 0 0 14.611 0.92 August 0 0 0 14.612 1 September 0 0 0 14.613 1.08 October 0 0 0 14.614 1.17 November 0 0 0 14.615 1.25 December 0 0 0 14.616 1.33 January 0 0 0 14.617 1.42 February 0 0 0 14.618 1.5 March 0 0 0 14.619 1.58 April 0 0 0 14.620 1.67 May 0 0 0 14.621 1.75 June 0 0 0 14.622 1.83 July 0 0 0 14.623 1.92 August 0 0 0 14.624 2 September 0 0 0 14.625 2.08 October 0 0 0 14.626 2.17 November 0 0 0 14.627 2.25 December 0 0 0 14.628 2.33 January 0 0 0 14.629 2.42 February 0 0 0 14.630 2.5 March 0 0 0 14.631 2.58 April 0 0 0 14.632 2.67 May 0 0 0 14.633 2.75 June 0 0 0 14.634 2.83 July 0 0 0 14.635 2.92 August 0 0 0 14.636 3 September 0 0 0 14.637 3.08 October 0 0 0 14.638 3.17 November 0 0 0 14.639 3.25 December 0 0 0 14.640 3.33 January 0 0 0 14.641 3.42 February 0 0 0 14.642 3.5 March 0 0 0 14.643 3.58 April 0 0 0 14.644 3.67 May 0 0 0 14.645 3.75 June 0 0 0 14.646 3.83 July 0 0 0 14.647 3.92 August 0 0 0 14.648 4 September 0 0 0 14.649 4.08 October 0 0 0 14.650 4.17 November 0 0 0 14.651 4.25 December 0 0 0 14.652 4.33 January 0 0 0 14.653 4.42 February 0 0 0 14.654 4.5 March 0 0 0 14.6
Thermal Cracking: Project T-1Pavement
ageMonth
Crack DepthCave
(in)
DepthRatioC/hac
Crack Length(ft/mi)
AverageCrack Spacing
(ft)
Crack Lengthat Reliability
(ft/mi)

Thermal Cracking: Project T-1
55 4.58 April 0 0 0 14.656 4.67 May 0 0 0 14.657 4.75 June 0 0 0 14.658 4.83 July 0 0 0 14.659 4.92 August 0 0 0 14.660 5 September 0 0 0 14.661 5.08 October 0 0 0 14.662 5.17 November 0 0 0 14.663 5.25 December 0 0 0 14.664 5.33 January 0 0 0 14.665 5.42 February 0 0 0 14.666 5.5 March 0 0 0 14.667 5.58 April 0 0 0 14.668 5.67 May 0 0 0 14.669 5.75 June 0 0 0 14.670 5.83 July 0 0 0 14.671 5.92 August 0 0 0 14.672 6 September 0 0 0 14.673 6.08 October 0 0 0 14.674 6.17 November 0 0 0 14.675 6.25 December 0 0 0 14.676 6.33 January 0 0 0 14.677 6.42 February 0 0 0 14.678 6.5 March 0 0 0 14.679 6.58 April 0 0 0 14.680 6.67 May 0 0 0 14.681 6.75 June 0 0 0 14.682 6.83 July 0 0 0 14.683 6.92 August 0 0 0 14.684 7 September 0 0 0 14.685 7.08 October 0 0 0 14.686 7.17 November 0 0 0 14.687 7.25 December 0 0 0 14.688 7.33 January 0 0 0 14.689 7.42 February 0 0 0 14.690 7.5 March 0 0 0 14.691 7.58 April 0 0 0 14.692 7.67 May 0 0 0 14.693 7.75 June 0 0 0 14.694 7.83 July 0 0 0 14.695 7.92 August 0 0 0 14.696 8 September 0 0 0 14.697 8.08 October 0 0 0 14.698 8.17 November 0 0 0 14.699 8.25 December 0 0 0 14.6100 8.33 January 0 0 0 14.6101 8.42 February 0 0 0 14.6102 8.5 March 0 0 0 14.6103 8.58 April 0 0 0 14.6104 8.67 May 0 0 0 14.6105 8.75 June 0 0 0 14.6106 8.83 July 0 0 0 14.6107 8.92 August 0 0 0 14.6108 9 September 0 0 0 14.6109 9.08 October 0 0 0 14.6110 9.17 November 0 0 0 14.6111 9.25 December 0 0 0 14.6112 9.33 January 0 0 0 14.6

Thermal Cracking: Project T-1
113 9.42 February 0 0 0 14.6114 9.5 March 0 0 0 14.6115 9.58 April 0 0 0 14.6116 9.67 May 0 0 0 14.6117 9.75 June 0 0 0 14.6118 9.83 July 0 0 0 14.6119 9.92 August 0 0 0 14.6120 10 September 0 0 0 14.6121 10.1 October 0 0 0 14.6122 10.2 November 0 0 0 14.6123 10.3 December 0 0 0 14.6124 10.3 January 0 0 0 14.6125 10.4 February 0 0 0 14.6126 10.5 March 0 0 0 14.6127 10.6 April 0 0 0 14.6128 10.7 May 0 0 0 14.6129 10.8 June 0 0 0 14.6130 10.8 July 0 0 0 14.6131 10.9 August 0 0 0 14.6132 11 September 0 0 0 14.6133 11.1 October 0 0 0 14.6134 11.2 November 0 0 0 14.6135 11.3 December 0 0 0 14.6136 11.3 January 0 0 0 14.6137 11.4 February 0 0 0 14.6138 11.5 March 0 0 0 14.6139 11.6 April 0 0 0 14.6140 11.7 May 0 0 0 14.6141 11.8 June 0 0 0 14.6142 11.8 July 0 0 0 14.6143 11.9 August 0 0 0 14.6144 12 September 0 0 0 14.6145 12.1 October 0 0 0 14.6146 12.2 November 0 0 0 14.6147 12.3 December 0 0 0 14.6148 12.3 January 0 0 0 14.6149 12.4 February 0 0 0 14.6150 12.5 March 0 0 0 14.6151 12.6 April 0 0 0 14.6152 12.7 May 0 0 0 14.6153 12.8 June 0 0 0 14.6154 12.8 July 0 0 0 14.6155 12.9 August 0 0 0 14.6156 13 September 0 0 0 14.6157 13.1 October 0 0 0 14.6158 13.2 November 0 0 0 14.6159 13.3 December 0 0 0 14.6160 13.3 January 0 0 0 14.6161 13.4 February 0 0 0 14.6162 13.5 March 0 0 0 14.6163 13.6 April 0 0 0 14.6164 13.7 May 0 0 0 14.6165 13.8 June 0 0 0 14.6166 13.8 July 0 0 0 14.6167 13.9 August 0 0 0 14.6168 14 September 0 0 0 14.6169 14.1 October 0 0 0 14.6170 14.2 November 0 0 0 14.6

Thermal Cracking: Project T-1
171 14.3 December 0 0 0 14.6172 14.3 January 0 0 0 14.6173 14.4 February 0 0 0 14.6174 14.5 March 0 0 0 14.6175 14.6 April 0 0 0 14.6176 14.7 May 0 0 0 14.6177 14.8 June 0 0 0 14.6178 14.8 July 0 0 0 14.6179 14.9 August 0 0 0 14.6180 15 September 0 0 0 14.6181 15.1 October 0 0 0 14.6182 15.2 November 0 0 0 14.6183 15.3 December 0 0 0 14.6184 15.3 January 0 0 0 14.6185 15.4 February 0 0 0 14.6186 15.5 March 0 0 0 14.6187 15.6 April 0 0 0 14.6188 15.7 May 0 0 0 14.6189 15.8 June 0 0 0 14.6190 15.8 July 0 0 0 14.6191 15.9 August 0 0 0 14.6192 16 September 0 0 0 14.6193 16.1 October 0 0 0 14.6194 16.2 November 0 0 0 14.6195 16.3 December 0 0 0 14.6196 16.3 January 0 0 0 14.6197 16.4 February 0 0 0 14.6198 16.5 March 0 0 0 14.6199 16.6 April 0 0 0 14.6200 16.7 May 0 0 0 14.6201 16.8 June 0 0 0 14.6202 16.8 July 0 0 0 14.6203 16.9 August 0 0 0 14.6204 17 September 0 0 0 14.6205 17.1 October 0 0 0 14.6206 17.2 November 0 0 0 14.6207 17.3 December 0 0 0 14.6208 17.3 January 0 0 0 14.6209 17.4 February 0 0 0 14.6210 17.5 March 0 0 0 14.6211 17.6 April 0 0 0 14.6212 17.7 May 0 0 0 14.6213 17.8 June 0 0 0 14.6214 17.8 July 0 0 0 14.6215 17.9 August 0 0 0 14.6216 18 September 0 0 0 14.6217 18.1 October 0 0 0 14.6218 18.2 November 0 0 0 14.6219 18.3 December 0 0 0 14.6220 18.3 January 0 0 0 14.6221 18.4 February 0 0 0 14.6222 18.5 March 0 0 0 14.6223 18.6 April 0 0 0 14.6224 18.7 May 0 0 0 14.6225 18.8 June 0 0 0 14.6226 18.8 July 0 0 0 14.6227 18.9 August 0 0 0 14.6228 19 September 0 0 0 14.6

Thermal Cracking: Project T-1
229 19.1 October 0 0 0 14.6230 19.2 November 0 0 0 14.6231 19.3 December 0 0 0 14.6232 19.3 January 0 0 0 14.6233 19.4 February 0 0 0 14.6234 19.5 March 0 0 0 14.6235 19.6 April 0 0 0 14.6236 19.7 May 0 0 0 14.6237 19.8 June 0 0 0 14.6238 19.8 July 0 0 0 14.6239 19.9 August 0 0 0 14.6240 20 September 0 0 0 14.6

T-1
Thermal Cracking: Crack Depth Vs Time
0
0.5
1
1.5
2
2.5
3
3.5
4
0 24 48 72 96 120 144 168 192 216 240 264
Pavement Age (month)
Cra
ck D
epth
(in)

T-1
Thermal Cracking: Depth Ratio Vs Time
0
0.1
0.2
0.3
0.4
0.5
0.6
0.7
0.8
0.9
1
0 24 48 72 96 120 144 168 192 216 240 264
Pavement Age (month)
Cav
e/ha
c

T-1
Thermal Cracking: Total Length Vs Time
0
200
400
600
800
1000
1200
1400
1600
1800
2000
0 24 48 72 96 120 144 168 192 216 240 264
Pavement Age (month)
Tota
l Len
gth
(ft/m
i)
Thermal Crack LengthCrack Length at ReliabilityDesign Limit

T-1
Transverse Crack Spacing
0.0
0.2
0.4
0.6
0.8
1.0
1.2
0 24 48 72 96 120 144 168 192 216 240 264
Pavement Age (month)
Cra
ck S
paci
ng (f
t)

T-14/14/2006 12:37 PM
1 of 1
Permanant Deformation: Rutting
0.00
0.10
0.20
0.30
0.40
0.50
0.60
0.70
0.80
0.90
1.00
0 24 48 72 96 120 144 168 192 216 240 264
Pavement Age (month)
Rut
ting
Dep
th (i
n)
SubTotalACSubTotalBaseSubTotalSGTotal RuttingTotalRutReliabilityTotal Rutting Design Limit
AC Rutting Design Value = 0.25Total Rutting Design Limit = 0.75

T-14/14/2006 12:37 PM
1 of 1
IRI
0
30
60
90
120
150
180
210
240
270
300
0 24 48 72 96 120 144 168 192 216 240 264
Pavement Age (month)
IRI (
in/m
i) IRIIRI at ReliabilityDesign Limit

Predicted Rutting: Project T-1
mo yr1 0.08 October 0.0254 0 0.0345 0 0.0225 0 0.0678 0 0.0254 0.0345 0.0903 0.1502 0 0.22652 0.17 November 0.0311 0 0.0377 0 0.0252 0 0.0789 0 0.0311 0.0377 0.1041 0.1729 0 0.25523 0.25 December 0.0346 0 0.0393 0 0.0268 0 0.0859 0 0.0346 0.0393 0.1127 0.1866 0 0.27254 0.33 January 0.0379 0 0.0406 0 0.028 0 0.0912 0 0.0379 0.0406 0.1191 0.1977 0 0.28635 0.42 February 0.0414 0 0.0419 0 0.029 0 0.0956 0 0.0414 0.0419 0.1246 0.208 0 0.29916 0.5 March 0.0468 0 0.0434 0 0.0301 0 0.0995 0 0.0468 0.0434 0.1296 0.2198 0 0.31377 0.58 April 0.0509 0 0.0445 0 0.0309 0 0.1028 0 0.0509 0.0445 0.1337 0.2292 0 0.32538 0.67 May 0.0571 0 0.0458 0 0.0318 0 0.1059 0 0.0571 0.0458 0.1377 0.2406 0 0.33939 0.75 June 0.0645 0 0.0472 0 0.0326 0 0.1088 0 0.0645 0.0472 0.1414 0.2531 0 0.354610 0.83 July 0.0731 0 0.0486 0 0.0334 0 0.1114 0 0.0731 0.0486 0.1448 0.2665 0 0.370911 0.92 August 0.0798 0 0.0496 0 0.0341 0 0.1138 0 0.0798 0.0496 0.1479 0.2773 0 0.38412 1 September 0.0839 0 0.0503 0 0.0346 0 0.1159 0 0.0839 0.0503 0.1505 0.2847 0 0.392913 1.08 October 0.0866 0 0.0508 0 0.035 0 0.1178 0 0.0866 0.0508 0.1528 0.2901 0 0.399414 1.17 November 0.0879 0 0.051 0 0.0353 0 0.1194 0 0.0879 0.051 0.1547 0.2936 0 0.403615 1.25 December 0.0888 0 0.0511 0 0.0355 0 0.1209 0 0.0888 0.0511 0.1564 0.2963 0 0.406916 1.33 January 0.0896 0 0.0512 0 0.0356 0 0.1223 0 0.0896 0.0512 0.1579 0.2987 0 0.409817 1.42 February 0.0904 0 0.0514 0 0.0358 0 0.1236 0 0.0904 0.0514 0.1594 0.3012 0 0.412718 1.5 March 0.0914 0 0.0515 0 0.036 0 0.1249 0 0.0914 0.0515 0.1609 0.3038 0 0.415919 1.58 April 0.0933 0 0.0518 0 0.0363 0 0.1262 0 0.0933 0.0518 0.1625 0.3076 0 0.420420 1.67 May 0.0971 0 0.0523 0 0.0366 0 0.1276 0 0.0971 0.0523 0.1642 0.3136 0 0.427621 1.75 June 0.1033 0 0.053 0 0.037 0 0.129 0 0.1033 0.053 0.166 0.3223 0 0.43822 1.83 July 0.1099 0 0.0537 0 0.0374 0 0.1304 0 0.1099 0.0537 0.1678 0.3313 0 0.448723 1.92 August 0.1149 0 0.0542 0 0.0377 0 0.1316 0 0.1149 0.0542 0.1693 0.3385 0 0.457224 2 September 0.1178 0 0.0546 0 0.038 0 0.1328 0 0.1178 0.0546 0.1708 0.3431 0 0.462725 2.08 October 0.1203 0 0.0549 0 0.0382 0 0.1339 0 0.1203 0.0549 0.1721 0.3472 0 0.467626 2.17 November 0.1216 0 0.055 0 0.0384 0 0.1349 0 0.1216 0.055 0.1733 0.3499 0 0.470727 2.25 December 0.1225 0 0.0551 0 0.0385 0 0.1358 0 0.1225 0.0551 0.1743 0.3519 0 0.473128 2.33 January 0.1231 0 0.0552 0 0.0386 0 0.1367 0 0.1231 0.0552 0.1753 0.3535 0 0.47529 2.42 February 0.1238 0 0.0553 0 0.0387 0 0.1375 0 0.1238 0.0553 0.1762 0.3553 0 0.477130 2.5 March 0.1247 0 0.0554 0 0.0389 0 0.1384 0 0.1247 0.0554 0.1772 0.3573 0 0.479531 2.58 April 0.1266 0 0.0556 0 0.039 0 0.1393 0 0.1266 0.0556 0.1783 0.3605 0 0.483332 2.67 May 0.129 0 0.0558 0 0.0392 0 0.1402 0 0.129 0.0558 0.1794 0.3643 0 0.487733 2.75 June 0.1315 0 0.0561 0 0.0394 0 0.1411 0 0.1315 0.0561 0.1805 0.3681 0 0.492234 2.83 July 0.135 0 0.0565 0 0.0396 0 0.142 0 0.135 0.0565 0.1816 0.3731 0 0.498135 2.92 August 0.1383 0 0.0568 0 0.0399 0 0.1428 0 0.1383 0.0568 0.1827 0.3778 0 0.503636 3 September 0.1408 0 0.057 0 0.0401 0 0.1437 0 0.1408 0.057 0.1838 0.3816 0 0.508137 3.08 October 0.1423 0 0.0572 0 0.0402 0 0.1444 0 0.1423 0.0572 0.1846 0.3841 0 0.51138 3.17 November 0.1431 0 0.0573 0 0.0403 0 0.1452 0 0.1431 0.0573 0.1855 0.3858 0 0.51339 3.25 December 0.1436 0 0.0573 0 0.0404 0 0.1458 0 0.1436 0.0573 0.1862 0.3871 0 0.514640 3.33 January 0.144 0 0.0573 0 0.0404 0 0.1464 0 0.144 0.0573 0.1868 0.3882 0 0.515841 3.42 February 0.1445 0 0.0574 0 0.0405 0 0.1471 0 0.1445 0.0574 0.1876 0.3895 0 0.517442 3.5 March 0.1455 0 0.0575 0 0.0406 0 0.1477 0 0.1455 0.0575 0.1883 0.3913 0 0.519543 3.58 April 0.1467 0 0.0576 0 0.0407 0 0.1484 0 0.1467 0.0576 0.1891 0.3934 0 0.521944 3.67 May 0.1488 0 0.0578 0 0.0409 0 0.1491 0 0.1488 0.0578 0.19 0.3967 0 0.525845 3.75 June 0.1513 0 0.058 0 0.041 0 0.1498 0 0.1513 0.058 0.1908 0.4002 0 0.529946 3.83 July 0.1539 0 0.0583 0 0.0412 0 0.1505 0 0.1539 0.0583 0.1917 0.4039 0 0.534247 3.92 August 0.1565 0 0.0585 0 0.0414 0 0.1512 0 0.1565 0.0585 0.1926 0.4076 0 0.538548 4 September 0.1588 0 0.0587 0 0.0415 0 0.1519 0 0.1588 0.0587 0.1934 0.4109 0 0.542449 4.08 October 0.1599 0 0.0588 0 0.0416 0 0.1525 0 0.1599 0.0588 0.1941 0.4128 0 0.544650 4.17 November 0.1606 0 0.0589 0 0.0417 0 0.153 0 0.1606 0.0589 0.1947 0.4142 0 0.546251 4.25 December 0.1609 0 0.0589 0 0.0418 0 0.1536 0 0.1609 0.0589 0.1954 0.4152 0 0.547452 4.33 January 0.1612 0 0.0589 0 0.0418 0 0.154 0 0.1612 0.0589 0.1958 0.4159 0 0.5482
Predicted Rutting: Project T-1Pavement
ageMonth
Maximum Rutting (inch)
AC1 Location (in) GB2 Location (in) SG3 Location (in) SG4 Location (in) SubTotalAC SubTotalBase SubTotalSG Total Location (in)TotalRutRelia
bility

Predicted Rutting: Project T-1
53 4.42 February 0.1619 0 0.059 0 0.0419 0 0.1546 0 0.1619 0.059 0.1965 0.4173 0 0.549954 4.5 March 0.1626 0 0.059 0 0.042 0 0.1551 0 0.1626 0.059 0.1971 0.4187 0 0.551555 4.58 April 0.1638 0 0.0592 0 0.042 0 0.1557 0 0.1638 0.0592 0.1978 0.4207 0 0.553856 4.67 May 0.1653 0 0.0593 0 0.0422 0 0.1562 0 0.1653 0.0593 0.1984 0.423 0 0.556557 4.75 June 0.1678 0 0.0595 0 0.0423 0 0.1568 0 0.1678 0.0595 0.1991 0.4264 0 0.560558 4.83 July 0.17 0 0.0597 0 0.0424 0 0.1574 0 0.17 0.0597 0.1998 0.4295 0 0.564159 4.92 August 0.1726 0 0.0599 0 0.0426 0 0.158 0 0.1726 0.0599 0.2006 0.4331 0 0.568260 5 September 0.1758 0 0.0601 0 0.0427 0 0.1586 0 0.1758 0.0601 0.2013 0.4372 0 0.57361 5.08 October 0.1772 0 0.0603 0 0.0428 0 0.1591 0 0.1772 0.0603 0.2019 0.4394 0 0.575662 5.17 November 0.1779 0 0.0603 0 0.0429 0 0.1596 0 0.1779 0.0603 0.2025 0.4407 0 0.577163 5.25 December 0.1783 0 0.0604 0 0.0429 0 0.1601 0 0.1783 0.0604 0.203 0.4417 0 0.578264 5.33 January 0.1788 0 0.0604 0 0.043 0 0.1605 0 0.1788 0.0604 0.2035 0.4427 0 0.579465 5.42 February 0.1795 0 0.0604 0 0.0431 0 0.161 0 0.1795 0.0604 0.2041 0.4439 0 0.580866 5.5 March 0.1806 0 0.0605 0 0.0432 0 0.1615 0 0.1806 0.0605 0.2047 0.4458 0 0.58367 5.58 April 0.1815 0 0.0606 0 0.0432 0 0.1619 0 0.1815 0.0606 0.2051 0.4473 0 0.584768 5.67 May 0.1831 0 0.0607 0 0.0433 0 0.1624 0 0.1831 0.0607 0.2057 0.4496 0 0.587469 5.75 June 0.1853 0 0.0609 0 0.0435 0 0.163 0 0.1853 0.0609 0.2065 0.4526 0 0.590970 5.83 July 0.1882 0 0.0611 0 0.0436 0 0.1635 0 0.1882 0.0611 0.2071 0.4564 0 0.595371 5.92 August 0.1906 0 0.0613 0 0.0437 0 0.164 0 0.1906 0.0613 0.2077 0.4596 0 0.59972 6 September 0.1923 0 0.0614 0 0.0438 0 0.1645 0 0.1923 0.0614 0.2083 0.462 0 0.601773 6.08 October 0.1934 0 0.0615 0 0.0439 0 0.1649 0 0.1934 0.0615 0.2088 0.4637 0 0.603774 6.17 November 0.1939 0 0.0616 0 0.0439 0 0.1653 0 0.1939 0.0616 0.2092 0.4647 0 0.604975 6.25 December 0.1942 0 0.0616 0 0.044 0 0.1657 0 0.1942 0.0616 0.2097 0.4655 0 0.605876 6.33 January 0.1945 0 0.0616 0 0.044 0 0.1661 0 0.1945 0.0616 0.2101 0.4662 0 0.606677 6.42 February 0.1948 0 0.0616 0 0.0441 0 0.1665 0 0.1948 0.0616 0.2106 0.467 0 0.607578 6.5 March 0.1952 0 0.0617 0 0.0441 0 0.1669 0 0.1952 0.0617 0.211 0.4679 0 0.608679 6.58 April 0.1961 0 0.0617 0 0.0442 0 0.1673 0 0.1961 0.0617 0.2115 0.4693 0 0.610280 6.67 May 0.198 0 0.0619 0 0.0443 0 0.1678 0 0.198 0.0619 0.2121 0.4719 0 0.613281 6.75 June 0.201 0 0.0621 0 0.0444 0 0.1682 0 0.201 0.0621 0.2126 0.4757 0 0.617682 6.83 July 0.2044 0 0.0623 0 0.0445 0 0.1687 0 0.2044 0.0623 0.2132 0.4799 0 0.622483 6.92 August 0.2072 0 0.0625 0 0.0446 0 0.1692 0 0.2072 0.0625 0.2138 0.4835 0 0.626584 7 September 0.2088 0 0.0626 0 0.0447 0 0.1696 0 0.2088 0.0626 0.2143 0.4858 0 0.629285 7.08 October 0.2101 0 0.0627 0 0.0448 0 0.17 0 0.2101 0.0627 0.2148 0.4877 0 0.631486 7.17 November 0.2109 0 0.0628 0 0.0449 0 0.1704 0 0.2109 0.0628 0.2153 0.4889 0 0.632887 7.25 December 0.2114 0 0.0628 0 0.0449 0 0.1708 0 0.2114 0.0628 0.2157 0.4898 0 0.633888 7.33 January 0.2117 0 0.0628 0 0.045 0 0.1711 0 0.2117 0.0628 0.2161 0.4906 0 0.634789 7.42 February 0.2121 0 0.0628 0 0.045 0 0.1715 0 0.2121 0.0628 0.2165 0.4914 0 0.635690 7.5 March 0.2126 0 0.0629 0 0.045 0 0.1718 0 0.2126 0.0629 0.2168 0.4923 0 0.636791 7.58 April 0.2138 0 0.063 0 0.0451 0 0.1722 0 0.2138 0.063 0.2173 0.4942 0 0.638892 7.67 May 0.2153 0 0.0631 0 0.0452 0 0.1726 0 0.2153 0.0631 0.2178 0.4962 0 0.641293 7.75 June 0.2168 0 0.0632 0 0.0453 0 0.173 0 0.2168 0.0632 0.2183 0.4983 0 0.643694 7.83 July 0.2191 0 0.0633 0 0.0454 0 0.1735 0 0.2191 0.0633 0.2189 0.5013 0 0.64795 7.92 August 0.2214 0 0.0635 0 0.0455 0 0.1739 0 0.2214 0.0635 0.2194 0.5042 0 0.650496 8 September 0.223 0 0.0636 0 0.0456 0 0.1743 0 0.223 0.0636 0.2199 0.5064 0 0.652997 8.08 October 0.224 0 0.0637 0 0.0456 0 0.1746 0 0.224 0.0637 0.2202 0.5079 0 0.654698 8.17 November 0.2245 0 0.0637 0 0.0457 0 0.175 0 0.2245 0.0637 0.2207 0.5088 0 0.655699 8.25 December 0.2248 0 0.0637 0 0.0457 0 0.1753 0 0.2248 0.0637 0.221 0.5095 0 0.6564100 8.33 January 0.225 0 0.0637 0 0.0457 0 0.1756 0 0.225 0.0637 0.2213 0.5101 0 0.6571101 8.42 February 0.2253 0 0.0637 0 0.0458 0 0.1759 0 0.2253 0.0637 0.2217 0.5108 0 0.6579102 8.5 March 0.226 0 0.0638 0 0.0458 0 0.1763 0 0.226 0.0638 0.2221 0.5119 0 0.6592103 8.58 April 0.2268 0 0.0638 0 0.0459 0 0.1766 0 0.2268 0.0638 0.2225 0.5131 0 0.6606104 8.67 May 0.2283 0 0.0639 0 0.0459 0 0.177 0 0.2283 0.0639 0.2229 0.5151 0 0.6629105 8.75 June 0.2299 0 0.064 0 0.046 0 0.1774 0 0.2299 0.064 0.2234 0.5174 0 0.6655106 8.83 July 0.2319 0 0.0642 0 0.0461 0 0.1777 0 0.2319 0.0642 0.2238 0.5199 0 0.6684107 8.92 August 0.2338 0 0.0643 0 0.0462 0 0.1781 0 0.2338 0.0643 0.2243 0.5224 0 0.6712108 9 September 0.2355 0 0.0644 0 0.0463 0 0.1785 0 0.2355 0.0644 0.2248 0.5247 0 0.6738109 9.08 October 0.2364 0 0.0645 0 0.0463 0 0.1788 0 0.2364 0.0645 0.2251 0.526 0 0.6753

Predicted Rutting: Project T-1
110 9.17 November 0.2368 0 0.0645 0 0.0464 0 0.1791 0 0.2368 0.0645 0.2255 0.5268 0 0.6763111 9.25 December 0.2371 0 0.0645 0 0.0464 0 0.1794 0 0.2371 0.0645 0.2258 0.5274 0 0.6769112 9.33 January 0.2372 0 0.0645 0 0.0464 0 0.1797 0 0.2372 0.0645 0.2261 0.5278 0 0.6774113 9.42 February 0.2377 0 0.0645 0 0.0465 0 0.18 0 0.2377 0.0645 0.2265 0.5287 0 0.6784114 9.5 March 0.2383 0 0.0646 0 0.0465 0 0.1803 0 0.2383 0.0646 0.2268 0.5297 0 0.6796115 9.58 April 0.2391 0 0.0646 0 0.0466 0 0.1806 0 0.2391 0.0646 0.2272 0.531 0 0.6811116 9.67 May 0.2402 0 0.0647 0 0.0466 0 0.181 0 0.2402 0.0647 0.2276 0.5325 0 0.6828117 9.75 June 0.2422 0 0.0648 0 0.0467 0 0.1813 0 0.2422 0.0648 0.228 0.535 0 0.6856118 9.83 July 0.2439 0 0.0649 0 0.0468 0 0.1817 0 0.2439 0.0649 0.2285 0.5373 0 0.6883119 9.92 August 0.246 0 0.0651 0 0.0469 0 0.182 0 0.246 0.0651 0.2289 0.54 0 0.6913120 10 September 0.2484 0 0.0652 0 0.047 0 0.1824 0 0.2484 0.0652 0.2294 0.543 0 0.6948121 10.08 October 0.2495 0 0.0653 0 0.047 0 0.1827 0 0.2495 0.0653 0.2297 0.5445 0 0.6965122 10.17 November 0.25 0 0.0653 0 0.0471 0 0.183 0 0.25 0.0653 0.2301 0.5454 0 0.6975123 10.25 December 0.2504 0 0.0653 0 0.0471 0 0.1833 0 0.2504 0.0653 0.2304 0.5461 0 0.6983124 10.33 January 0.2508 0 0.0654 0 0.0471 0 0.1836 0 0.2508 0.0654 0.2307 0.5468 0 0.6991125 10.42 February 0.2513 0 0.0654 0 0.0472 0 0.1838 0 0.2513 0.0654 0.231 0.5476 0 0.7126 10.5 March 0.2522 0 0.0654 0 0.0472 0 0.1842 0 0.2522 0.0654 0.2314 0.549 0 0.7016127 10.58 April 0.2529 0 0.0655 0 0.0473 0 0.1845 0 0.2529 0.0655 0.2318 0.5501 0 0.7029128 10.67 May 0.2541 0 0.0656 0 0.0473 0 0.1848 0 0.2541 0.0656 0.2321 0.5518 0 0.7048129 10.75 June 0.256 0 0.0657 0 0.0474 0 0.1851 0 0.256 0.0657 0.2325 0.5541 0 0.7075130 10.83 July 0.2584 0 0.0658 0 0.0475 0 0.1854 0 0.2584 0.0658 0.2329 0.5571 0 0.7109131 10.92 August 0.2604 0 0.0659 0 0.0476 0 0.1858 0 0.2604 0.0659 0.2334 0.5596 0 0.7137132 11 September 0.2618 0 0.066 0 0.0476 0 0.1861 0 0.2618 0.066 0.2337 0.5615 0 0.7159133 11.08 October 0.2627 0 0.0661 0 0.0477 0 0.1864 0 0.2627 0.0661 0.2341 0.5628 0 0.7174134 11.17 November 0.2631 0 0.0661 0 0.0477 0 0.1867 0 0.2631 0.0661 0.2344 0.5635 0 0.7182135 11.25 December 0.2633 0 0.0661 0 0.0477 0 0.1869 0 0.2633 0.0661 0.2346 0.5641 0 0.7188136 11.33 January 0.2636 0 0.0661 0 0.0478 0 0.1872 0 0.2636 0.0661 0.235 0.5646 0 0.7194137 11.42 February 0.2638 0 0.0661 0 0.0478 0 0.1874 0 0.2638 0.0661 0.2352 0.5652 0 0.7201138 11.5 March 0.2641 0 0.0662 0 0.0478 0 0.1877 0 0.2641 0.0662 0.2355 0.5658 0 0.7208139 11.58 April 0.2649 0 0.0662 0 0.0479 0 0.188 0 0.2649 0.0662 0.2359 0.5669 0 0.722140 11.67 May 0.2664 0 0.0663 0 0.0479 0 0.1883 0 0.2664 0.0663 0.2362 0.5689 0 0.7243141 11.75 June 0.269 0 0.0664 0 0.048 0 0.1886 0 0.269 0.0664 0.2366 0.5721 0 0.7279142 11.83 July 0.2719 0 0.0666 0 0.0481 0 0.1889 0 0.2719 0.0666 0.237 0.5755 0 0.7318143 11.92 August 0.2742 0 0.0667 0 0.0482 0 0.1893 0 0.2742 0.0667 0.2375 0.5784 0 0.7351144 12 September 0.2757 0 0.0668 0 0.0482 0 0.1896 0 0.2757 0.0668 0.2378 0.5803 0 0.7373145 12.08 October 0.2769 0 0.0669 0 0.0483 0 0.1899 0 0.2769 0.0669 0.2382 0.5819 0 0.7391146 12.17 November 0.2775 0 0.0669 0 0.0483 0 0.1901 0 0.2775 0.0669 0.2384 0.5829 0 0.7402147 12.25 December 0.2779 0 0.0669 0 0.0484 0 0.1904 0 0.2779 0.0669 0.2388 0.5836 0 0.741148 12.33 January 0.2782 0 0.0669 0 0.0484 0 0.1906 0 0.2782 0.0669 0.239 0.5841 0 0.7416149 12.42 February 0.2785 0 0.067 0 0.0484 0 0.1909 0 0.2785 0.067 0.2393 0.5847 0 0.7423150 12.5 March 0.2789 0 0.067 0 0.0485 0 0.1911 0 0.2789 0.067 0.2395 0.5855 0 0.7432151 12.58 April 0.28 0 0.067 0 0.0485 0 0.1914 0 0.28 0.067 0.2399 0.5869 0 0.7448152 12.67 May 0.2812 0 0.0671 0 0.0486 0 0.1917 0 0.2812 0.0671 0.2403 0.5886 0 0.7467153 12.75 June 0.2825 0 0.0672 0 0.0486 0 0.192 0 0.2825 0.0672 0.2406 0.5904 0 0.7487154 12.83 July 0.2846 0 0.0673 0 0.0487 0 0.1923 0 0.2846 0.0673 0.241 0.5929 0 0.7516155 12.92 August 0.2865 0 0.0674 0 0.0488 0 0.1926 0 0.2865 0.0674 0.2414 0.5953 0 0.7543156 13 September 0.288 0 0.0675 0 0.0488 0 0.1929 0 0.288 0.0675 0.2417 0.5972 0 0.7564157 13.08 October 0.2889 0 0.0675 0 0.0489 0 0.1932 0 0.2889 0.0675 0.2421 0.5984 0 0.7578158 13.17 November 0.2893 0 0.0676 0 0.0489 0 0.1934 0 0.2893 0.0676 0.2423 0.5992 0 0.7587159 13.25 December 0.2896 0 0.0676 0 0.0489 0 0.1936 0 0.2896 0.0676 0.2425 0.5997 0 0.7593160 13.33 January 0.2898 0 0.0676 0 0.0489 0 0.1939 0 0.2898 0.0676 0.2428 0.6002 0 0.7598161 13.42 February 0.2901 0 0.0676 0 0.049 0 0.1941 0 0.2901 0.0676 0.2431 0.6007 0 0.7604162 13.5 March 0.2906 0 0.0676 0 0.049 0 0.1944 0 0.2906 0.0676 0.2434 0.6016 0 0.7614163 13.58 April 0.2913 0 0.0677 0 0.049 0 0.1946 0 0.2913 0.0677 0.2436 0.6026 0 0.7626164 13.67 May 0.2926 0 0.0677 0 0.0491 0 0.1949 0 0.2926 0.0677 0.244 0.6043 0 0.7645165 13.75 June 0.2942 0 0.0678 0 0.0491 0 0.1952 0 0.2942 0.0678 0.2444 0.6063 0 0.7668166 13.83 July 0.2959 0 0.0679 0 0.0492 0 0.1954 0 0.2959 0.0679 0.2446 0.6085 0 0.7692

Predicted Rutting: Project T-1
167 13.92 August 0.2977 0 0.068 0 0.0493 0 0.1957 0 0.2977 0.068 0.245 0.6107 0 0.7717168 14 September 0.2992 0 0.0681 0 0.0493 0 0.196 0 0.2992 0.0681 0.2453 0.6126 0 0.7739169 14.08 October 0.3 0 0.0681 0 0.0494 0 0.1963 0 0.3 0.0681 0.2457 0.6137 0 0.7752170 14.17 November 0.3004 0 0.0682 0 0.0494 0 0.1965 0 0.3004 0.0682 0.2459 0.6144 0 0.7759171 14.25 December 0.3006 0 0.0682 0 0.0494 0 0.1967 0 0.3006 0.0682 0.2461 0.6149 0 0.7765172 14.33 January 0.3007 0 0.0682 0 0.0494 0 0.1969 0 0.3007 0.0682 0.2463 0.6152 0 0.7768173 14.42 February 0.3012 0 0.0682 0 0.0495 0 0.1972 0 0.3012 0.0682 0.2467 0.616 0 0.7778174 14.5 March 0.3016 0 0.0682 0 0.0495 0 0.1974 0 0.3016 0.0682 0.2469 0.6167 0 0.7785175 14.58 April 0.3024 0 0.0683 0 0.0495 0 0.1976 0 0.3024 0.0683 0.2471 0.6179 0 0.7799176 14.67 May 0.3034 0 0.0683 0 0.0496 0 0.1979 0 0.3034 0.0683 0.2475 0.6192 0 0.7814177 14.75 June 0.3052 0 0.0684 0 0.0497 0 0.1982 0 0.3052 0.0684 0.2479 0.6214 0 0.7839178 14.83 July 0.3068 0 0.0685 0 0.0497 0 0.1984 0 0.3068 0.0685 0.2481 0.6234 0 0.7861179 14.92 August 0.3087 0 0.0686 0 0.0498 0 0.1987 0 0.3087 0.0686 0.2485 0.6258 0 0.7888180 15 September 0.3109 0 0.0687 0 0.0498 0 0.199 0 0.3109 0.0687 0.2489 0.6285 0 0.7919181 15.08 October 0.3119 0 0.0688 0 0.0499 0 0.1993 0 0.3119 0.0688 0.2492 0.6298 0 0.7934182 15.17 November 0.3124 0 0.0688 0 0.0499 0 0.1995 0 0.3124 0.0688 0.2494 0.6306 0 0.7942183 15.25 December 0.3127 0 0.0688 0 0.05 0 0.1997 0 0.3127 0.0688 0.2496 0.6311 0 0.7948184 15.33 January 0.313 0 0.0688 0 0.05 0 0.1999 0 0.313 0.0688 0.2499 0.6317 0 0.7955185 15.42 February 0.3135 0 0.0688 0 0.05 0 0.2002 0 0.3135 0.0688 0.2502 0.6325 0 0.7964186 15.5 March 0.3143 0 0.0689 0 0.05 0 0.2004 0 0.3143 0.0689 0.2504 0.6336 0 0.7976187 15.58 April 0.315 0 0.0689 0 0.0501 0 0.2006 0 0.315 0.0689 0.2507 0.6346 0 0.7988188 15.67 May 0.3161 0 0.069 0 0.0501 0 0.2009 0 0.3161 0.069 0.251 0.6361 0 0.8005189 15.75 June 0.3178 0 0.0691 0 0.0502 0 0.2011 0 0.3178 0.0691 0.2513 0.6382 0 0.8028190 15.83 July 0.3201 0 0.0692 0 0.0503 0 0.2014 0 0.3201 0.0692 0.2516 0.6409 0 0.8059191 15.92 August 0.3219 0 0.0693 0 0.0503 0 0.2017 0 0.3219 0.0693 0.252 0.6432 0 0.8085192 16 September 0.3233 0 0.0693 0 0.0504 0 0.2019 0 0.3233 0.0693 0.2523 0.6449 0 0.8104193 16.08 October 0.3241 0 0.0694 0 0.0504 0 0.2022 0 0.3241 0.0694 0.2526 0.6461 0 0.8117194 16.17 November 0.3245 0 0.0694 0 0.0504 0 0.2024 0 0.3245 0.0694 0.2528 0.6467 0 0.8124195 16.25 December 0.3247 0 0.0694 0 0.0505 0 0.2026 0 0.3247 0.0694 0.2531 0.6472 0 0.813196 16.33 January 0.3249 0 0.0694 0 0.0505 0 0.2028 0 0.3249 0.0694 0.2533 0.6476 0 0.8134197 16.42 February 0.3252 0 0.0694 0 0.0505 0 0.203 0 0.3252 0.0694 0.2535 0.6481 0 0.814198 16.5 March 0.3255 0 0.0694 0 0.0505 0 0.2032 0 0.3255 0.0694 0.2537 0.6486 0 0.8146199 16.58 April 0.3262 0 0.0695 0 0.0505 0 0.2034 0 0.3262 0.0695 0.2539 0.6496 0 0.8157200 16.67 May 0.3276 0 0.0695 0 0.0506 0 0.2037 0 0.3276 0.0695 0.2543 0.6515 0 0.8178201 16.75 June 0.3301 0 0.0697 0 0.0507 0 0.204 0 0.3301 0.0697 0.2547 0.6544 0 0.8211202 16.83 July 0.3328 0 0.0698 0 0.0507 0 0.2042 0 0.3328 0.0698 0.2549 0.6576 0 0.8247203 16.92 August 0.335 0 0.0699 0 0.0508 0 0.2045 0 0.335 0.0699 0.2553 0.6602 0 0.8276204 17 September 0.3364 0 0.0699 0 0.0508 0 0.2047 0 0.3364 0.0699 0.2556 0.6619 0 0.8296205 17.08 October 0.3375 0 0.07 0 0.0509 0 0.205 0 0.3375 0.07 0.2559 0.6634 0 0.8312206 17.17 November 0.3381 0 0.07 0 0.0509 0 0.2052 0 0.3381 0.07 0.2561 0.6643 0 0.8322207 17.25 December 0.3385 0 0.0701 0 0.051 0 0.2054 0 0.3385 0.0701 0.2564 0.6649 0 0.8329208 17.33 January 0.3388 0 0.0701 0 0.051 0 0.2056 0 0.3388 0.0701 0.2566 0.6654 0 0.8335209 17.42 February 0.3391 0 0.0701 0 0.051 0 0.2058 0 0.3391 0.0701 0.2568 0.6659 0 0.8341210 17.5 March 0.3394 0 0.0701 0 0.051 0 0.206 0 0.3394 0.0701 0.257 0.6666 0 0.8348211 17.58 April 0.3405 0 0.0701 0 0.0511 0 0.2063 0 0.3405 0.0701 0.2574 0.6679 0 0.8363212 17.67 May 0.3416 0 0.0702 0 0.0511 0 0.2065 0 0.3416 0.0702 0.2576 0.6694 0 0.838213 17.75 June 0.3429 0 0.0703 0 0.0512 0 0.2067 0 0.3429 0.0703 0.2579 0.6711 0 0.8399214 17.83 July 0.3449 0 0.0704 0 0.0512 0 0.207 0 0.3449 0.0704 0.2582 0.6734 0 0.8425215 17.92 August 0.3467 0 0.0704 0 0.0513 0 0.2072 0 0.3467 0.0704 0.2585 0.6757 0 0.8451216 18 September 0.3482 0 0.0705 0 0.0513 0 0.2075 0 0.3482 0.0705 0.2588 0.6775 0 0.8471217 18.08 October 0.349 0 0.0706 0 0.0514 0 0.2077 0 0.349 0.0706 0.2591 0.6787 0 0.8485218 18.17 November 0.3494 0 0.0706 0 0.0514 0 0.2079 0 0.3494 0.0706 0.2593 0.6793 0 0.8491219 18.25 December 0.3497 0 0.0706 0 0.0514 0 0.2081 0 0.3497 0.0706 0.2595 0.6798 0 0.8497220 18.33 January 0.3499 0 0.0706 0 0.0514 0 0.2083 0 0.3499 0.0706 0.2597 0.6802 0 0.8501221 18.42 February 0.3501 0 0.0706 0 0.0514 0 0.2085 0 0.3501 0.0706 0.2599 0.6807 0 0.8507222 18.5 March 0.3507 0 0.0706 0 0.0515 0 0.2087 0 0.3507 0.0706 0.2602 0.6815 0 0.8516223 18.58 April 0.3513 0 0.0707 0 0.0515 0 0.2089 0 0.3513 0.0707 0.2604 0.6824 0 0.8526
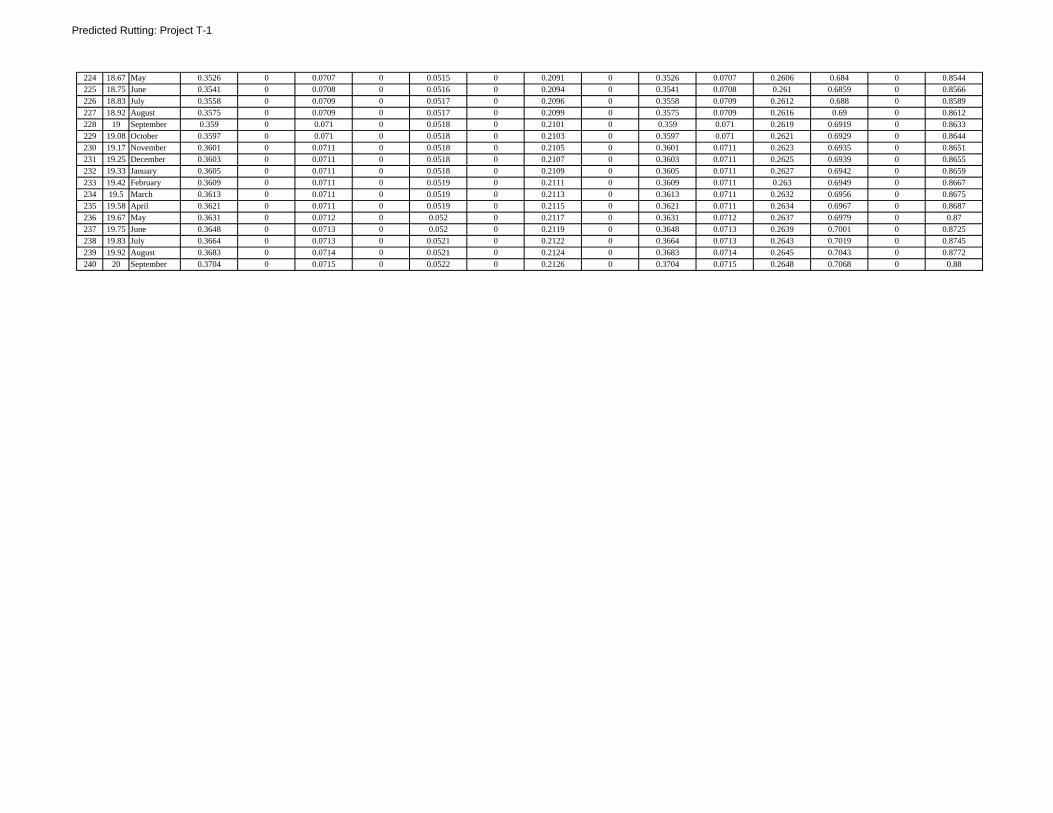
Predicted Rutting: Project T-1
224 18.67 May 0.3526 0 0.0707 0 0.0515 0 0.2091 0 0.3526 0.0707 0.2606 0.684 0 0.8544225 18.75 June 0.3541 0 0.0708 0 0.0516 0 0.2094 0 0.3541 0.0708 0.261 0.6859 0 0.8566226 18.83 July 0.3558 0 0.0709 0 0.0517 0 0.2096 0 0.3558 0.0709 0.2612 0.688 0 0.8589227 18.92 August 0.3575 0 0.0709 0 0.0517 0 0.2099 0 0.3575 0.0709 0.2616 0.69 0 0.8612228 19 September 0.359 0 0.071 0 0.0518 0 0.2101 0 0.359 0.071 0.2619 0.6919 0 0.8633229 19.08 October 0.3597 0 0.071 0 0.0518 0 0.2103 0 0.3597 0.071 0.2621 0.6929 0 0.8644230 19.17 November 0.3601 0 0.0711 0 0.0518 0 0.2105 0 0.3601 0.0711 0.2623 0.6935 0 0.8651231 19.25 December 0.3603 0 0.0711 0 0.0518 0 0.2107 0 0.3603 0.0711 0.2625 0.6939 0 0.8655232 19.33 January 0.3605 0 0.0711 0 0.0518 0 0.2109 0 0.3605 0.0711 0.2627 0.6942 0 0.8659233 19.42 February 0.3609 0 0.0711 0 0.0519 0 0.2111 0 0.3609 0.0711 0.263 0.6949 0 0.8667234 19.5 March 0.3613 0 0.0711 0 0.0519 0 0.2113 0 0.3613 0.0711 0.2632 0.6956 0 0.8675235 19.58 April 0.3621 0 0.0711 0 0.0519 0 0.2115 0 0.3621 0.0711 0.2634 0.6967 0 0.8687236 19.67 May 0.3631 0 0.0712 0 0.052 0 0.2117 0 0.3631 0.0712 0.2637 0.6979 0 0.87237 19.75 June 0.3648 0 0.0713 0 0.052 0 0.2119 0 0.3648 0.0713 0.2639 0.7001 0 0.8725238 19.83 July 0.3664 0 0.0713 0 0.0521 0 0.2122 0 0.3664 0.0713 0.2643 0.7019 0 0.8745239 19.92 August 0.3683 0 0.0714 0 0.0521 0 0.2124 0 0.3683 0.0714 0.2645 0.7043 0 0.8772240 20 September 0.3704 0 0.0715 0 0.0522 0 0.2126 0 0.3704 0.0715 0.2648 0.7068 0 0.88

210
LIST OF REFERENCES
1. Yuang H . Huang, Pavement Analysis and Design, 1993 Prentice-Hall Inc. New Jersey 2. ERES. 2002 Design Guide, Design of New and Rehabilitated Pavement Structures, Draft
Final Report. National Cooperative Highway Research Program. Washington D.C., 2002
3. Ayres, M and Witczak, M.(1998) “AYMA - A Mechanistic Probabilistic System to Evaluate Flexible Pavement Performance”, Transportation Research Board, 77th Annual Meeting Paper No. 980738, Washington D.C.
4. Leahy, R. B., Permanent Deformation Characteristics of Asphalt Pavement, Ph.D.
Dissertation University of Maryland, College Park, 1989.
5. Kaloush K.E. and Witczak M. W. (2000) “Development of a Permanent to Elastic Strain Ratio Model for Asphalt Mixtures”. Development of the 2002 Guide for the Design of New and Rehabilitated Pavement Structures. NCHRP 1-37A. Inter Team Technical Report. Sept. 2000.
6. Tseng, K and Lytton, R (1989) Prediction of Permanent Deformation in Flexible
Pavement Materials. Implication of the Aggregates in the Design, Construction and Performance of Flexible Pavements, ASTM STP 1016, ASTM, pp. 154-172.
7. Masad, S, Sensitivity Analysis of Flexible Pavement Response and AASHTO 2002 Design
Guide for Properties of Unbound Layers, M.S., Thesis Texas A & M University, 2004.