Embed Size (px)
Citation preview

Susana Ochoa-Rodríguez BHS Meeting – 28.02.2013
Sensor networks and urban pluvial flood modelling in an urban catchment
Susana Ochoa-Rodríguez
28th February 2013
Environmental virtual observatories: managing catchments with wellies, sensors and smartphones

Susana Ochoa-Rodríguez BHS Meeting – 28.02.2013
Contents
1. Context
2. Pilot locations & sensor network + SOS
3. Rainfall processing techniques + WPS
4. Putting the jigsaw together
5. Conclusions

Susana Ochoa-Rodríguez BHS Meeting – 28.02.2013
1. CONTEXT
• Urban pluvial flooding: challenges and needs
• Tackling the challenges

Susana Ochoa-Rodríguez BHS Meeting – 28.02.2013
Extreme rainfall events exceed the capacity of the drainage system
URBAN PLUVIAL FLOODING

Susana Ochoa-Rodríguez BHS Meeting – 28.02.2013
URBAN PLUVIAL FLOODING
• Insufficient capacity of sewer system
• Surface flow (overland system)
• Dynamic interactions between the two systems
• It’s localised and happens quickly – “flash floods”

Susana Ochoa-Rodríguez BHS Meeting – 28.02.2013
Model Assembly for Pluvial Flood Modelling, Forecasting and Management
Rainfall Estimation / Forecasting
Flood Modelling / Forecasting
Management (urban planning, emergency)
Same “framework” as other types of flooding, but for urban pluvial flooding each step is a bit more complex
S u p p o r t e d b y d a t a (m o n i t o r i n g)

Susana Ochoa-Rodríguez BHS Meeting – 28.02.2013
Rainfall Estimation / Forecasting
Flood Modelling / Forecasting
Management (urban planning,
emergency)
• The rainfall events which generate pluvial flooding are often associated with thunderstorms of small spatial scale (~ 10 km), whose magnitude and spatial distribution are difficult to monitor and predict (also: lead time vs. accuracy)
• Rainfall estimates/forecasts with fine spatial and temporal resolution required

Susana Ochoa-Rodríguez BHS Meeting – 28.02.2013
Rainfall Estimation / Forecasting
Flood Modelling / Forecasting
Management (urban planning,
emergency)
• Urban “jungle” is complex
• Interaction of sewer and overland systems
• Since flooding is localised, models must have fine spatio-temporal resolution
• Model detail vs. Runtime
Effective rainfall
Sewer flow
Surface component
Bi-directional interaction
Sub-surface component

Susana Ochoa-Rodríguez BHS Meeting – 28.02.2013
• Urban catchments change constantly
• Complete flood records for calibration and verification are seldom available
• High uncertainty in boundary conditions
• High operational uncertainty (blockages, pipe burst, pump failure, change in geometry of roads and other channels, etc.)
• Individual sources of uncertainty are magnified by small scale
Rainfall Estimation / Forecasting
Flood Modelling / Forecasting
Management (urban planning,
emergency)

Susana Ochoa-Rodríguez BHS Meeting – 28.02.2013
Rainfall Estimation / Forecasting
Flood Modelling / Forecasting
Management (urban planning,
emergency)
• Uncertainty in modelling and forecasting hinders decision making
• Low awareness
• Given rapid onset and short forecasting lead-times, the public become the principal responders, but they are not so willing to respond
• Lack of coordination between stakeholders involved
• Budgetary cuts
• …

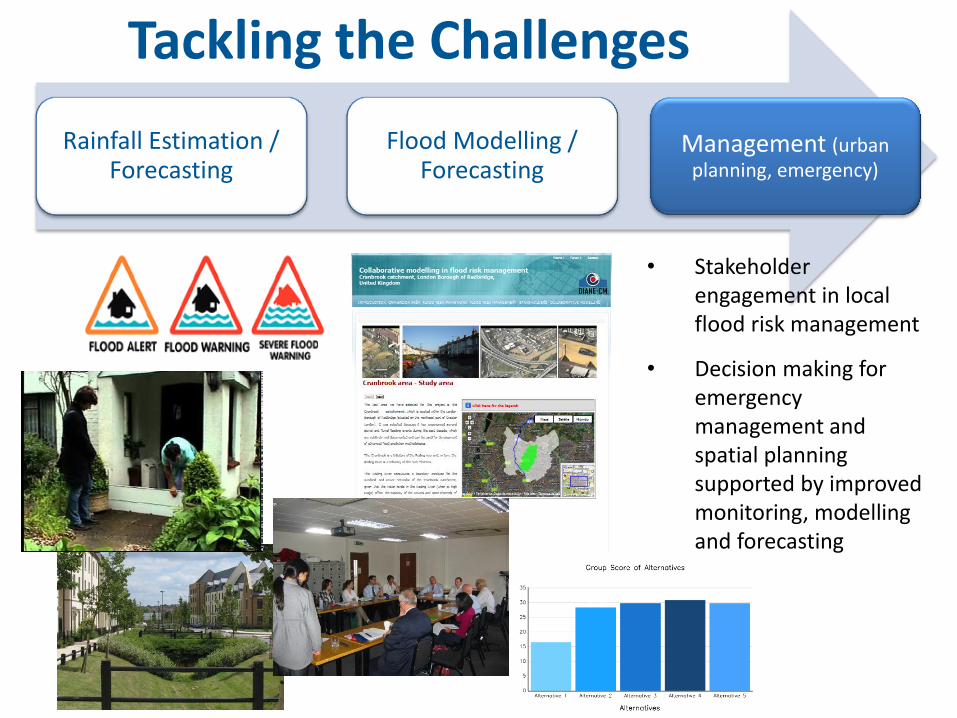
Tackling the Challenges
Rainfall Estimation / Forecasting
Flood Modelling / Forecasting
Management (urban planning, emergency)

Tackling the Challenges
• Improved rainfall monitoring (X-band radar, high quality radar protocols, rain gauges)
• Rainfall processing techniques to improve accuracy and resolution
• Improved nowcasting based on improved rainfall estimates
T = Future
T = Current
10 - 30 km
1 - 2 km
C-Band
X-Band1 km
100-500 m
Ground Raingauge Network
1 km
i
CALIBRATIONi
t
Numerical Weather Prediction: UM/MM5
Temporal
Spatial
Meteorological Radar
t
STATISTICALLYDOWNSCALING
Rainfall Estimation / Forecasting
Flood Modelling / Forecasting
Management (urban planning, emergency)

Tackling the Challenges
Rainfall Estimation / Forecasting
Flood Modelling / Forecasting
Management (urban planning, emergency)
• Monitoring (Q, h)
• Development and testing of models of different levels of complexity
• Uncertainty analysis and uncertainty-based model calibration
• Definition of local pluvial flood triggers
• Pilot forecasting system
Tackling the Challenges
Rainfall Estimation / Forecasting
Flood Modelling / Forecasting
Management (urban planning, emergency)
• Stakeholder engagement in local flood risk management
• Decision making for emergency management and spatial planning supported by improved monitoring, modelling and forecasting

Tackling the Challenges
Rainfall Estimation / Forecasting
Flood Modelling / Forecasting
Management (urban planning, emergency)
• Improved rainfall monitoring (X-band radar, high quality radar protocols, rain gauges)
• Rainfall processing techniques to improve accuracy and resolution
• Improved nowcasting based on improved rainfall estimates
• Monitoring (Q, h)
• Development and testing of models of different levels of complexity
• Uncertainty analysis and uncertainty-based model calibration
• Definition of local pluvial flood triggers
• Pilot forecasting system
WEB SERVICES are being used to enable easy access to data in a standardise way and implementation of processing modules which can be used interoperably.
• Stakeholder engagement in local flood risk management
• Decision making for emergency management and spatial planning supported by improved monitoring, modelling and forecasting

Susana Ochoa-Rodríguez BHS Meeting – 28.02.2013
2. PILOT LOCATIONS AND SENSOR NETWORKS
• 3 urban catchments
• Rainfall and flow/depth monitoring

Susana Ochoa-Rodríguez BHS Meeting – 28.02.2013
PILOT LOCATIONS
• Cranbrook (London Borough of Redbridge)
• Purley (London Borough of Croydon)
• Torquay City Centre (Torbay, Devon)

Susana Ochoa-Rodríguez BHS Meeting – 28.02.2013
Cranbrook Catchment (LB Redbridge)
• Area: aprox. 900 ha
• Cran Brook: 5.75 km (5.69 km culverted)
• Predominantly urban catchment
• Sub-catchment of Roding River catchment
• Subject to fluvial & surface flooding (Several flood events reported since 1926, most recent events in October 2000 and February 2009)
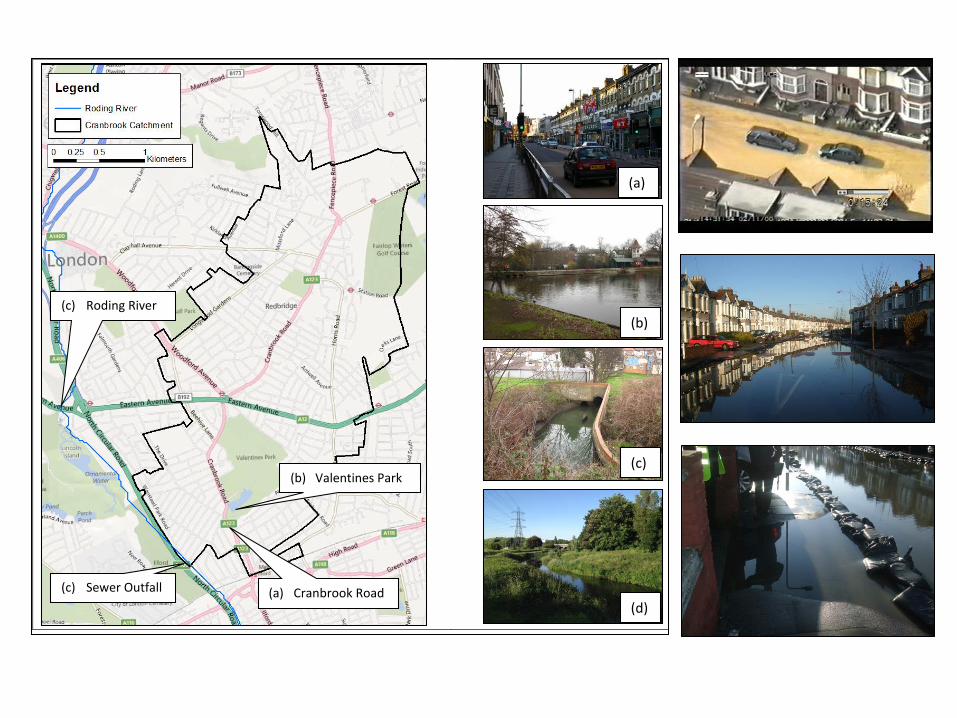
(b) Valentines Park
(a) Cranbrook Road (c) Sewer Outfall
(c) Roding River
(a)
(b)
(c)
(d)

Susana Ochoa-Rodríguez BHS Meeting – 28.02.2013
Flooding Mechanisms
• Overland flow routes associated with surface water flooding generally follow natural drainage pathways

Susana Ochoa-Rodríguez BHS Meeting – 28.02.2013
Sewer outfall
Roding River
• Overland flow routes associated with surface water flooding generally follow natural drainage pathways
• Interaction of pluvial and fluvial flooding
• Tidal influence
• Highly urbanised area = rapid response to rainfall
Flooding Mechanisms

Susana Ochoa-Rodríguez BHS Meeting – 28.02.2013
Local Monitoring System
22
All sensors are equipped with data acquisition and real-time wireless communication units (which use sim-cards)
• 3 tipping bucket rain gauges
With 1 min data “sampling”
• 2 pressure sensor for monitoring water levels in the Roding River
Real time frequency: 5/10 min
• 1 sensor for water depth measurement in sewers
Real time frequency: 5/10 min.
• 1 sensor for water flow (v + d) measurement in sewers
Real time frequency: 5/10 min.
• 1 sensors for water depth measurement in open channels
Sampling frequency: 5/10 min

Susana Ochoa-Rodríguez BHS Meeting – 28.02.2013
Local monitoring system

Susana Ochoa-Rodríguez BHS Meeting – 28.02.2013
Chenies Thurnham
Radar type C-band C-band
Polarisation Single-polarisation* Dual-polarisation
Doppler (yes/no) No* Yes
Antenna Parabolic 3.6 m diameter, 43 dB gain
Beamwidth 1°
Frequency range 5.4 – 5.8 GHz
Wave length 4 – 8 cm
Range resolution 1 km up to 50 km range / 2 km up to 75 km range
Temporal resolution 5 min scan repeat cycle**
Elevations (°) 0.5, 1.5, 2.5, 4.0, 5.0 0.5, 1.0, 1.5, 2.5, 4.0
*Currently being upgraded to dual-pol and doppler **Within the RainGain project the potential benefits of reducing the repetition cycle to 2-3 min will be tested.
UK Met Office C-Band Radars

Susana Ochoa-Rodríguez BHS Meeting – 28.02.2013
Selex RainScanner
Radar type X-band
Polarisation Single-polarisation
Doppler (yes/no) No
Antenna Parabolic, pencil beam antenna
Beamwidth 2°
Frequency range 8 to 12 GHz
Wave length 2.5 – 4 cm
Range resolution 30 m
Temporal resolution 1 min
Elevations (°) 0.5, 1.5, 2.5, 4.0, 5.0
ICL’s X-Band Radar (will be installed on 9th March 2013 on the rooftop of the Royal Free
Hospital in Hampstead)
• Smaller wavelength makes X band radar more sensitive and able of detecting smaller particles (e.g. drizzle, light snow, cloud formation).
• X band radars attenuate very easily, so they are used for short range weather observation.


We are using a Sensor Observation Service (SOS) server to store rainfall data from multiple sources in a standardised way
DVD RW
SOS server
SOS Client
Rain gauge networks
Level sensors
A user can query data from the SOS server using simple
scripts written in any computing language making use of existing SOS libraries
(which contain standard SOS functions)
• SOS qualified servers must have a standard interface
• This standard interface comprises a number of standard (and flexible enough) functions which allow querying data from the database
Exchange takes place using standard protocols

Susana Ochoa-Rodríguez BHS Meeting – 28.02.2013
Standard SOS functions (Server) • Querying observations and sensor metadata
• Getting representations of observed features
• Adding new sensors and removing existing ones
• Inserting/deleting sensor observations
SOS User
• A number of libraries freely available, which allow:
• Querying and downloading data from the SOS server
• Performing standard functions
• Outputting data in standard GML format and other formats (which depend on the library you use – e.g. sos4R can output CSV, arrays which can be used internally for analysis and visualisation, formats compatible with Web Processing Services)
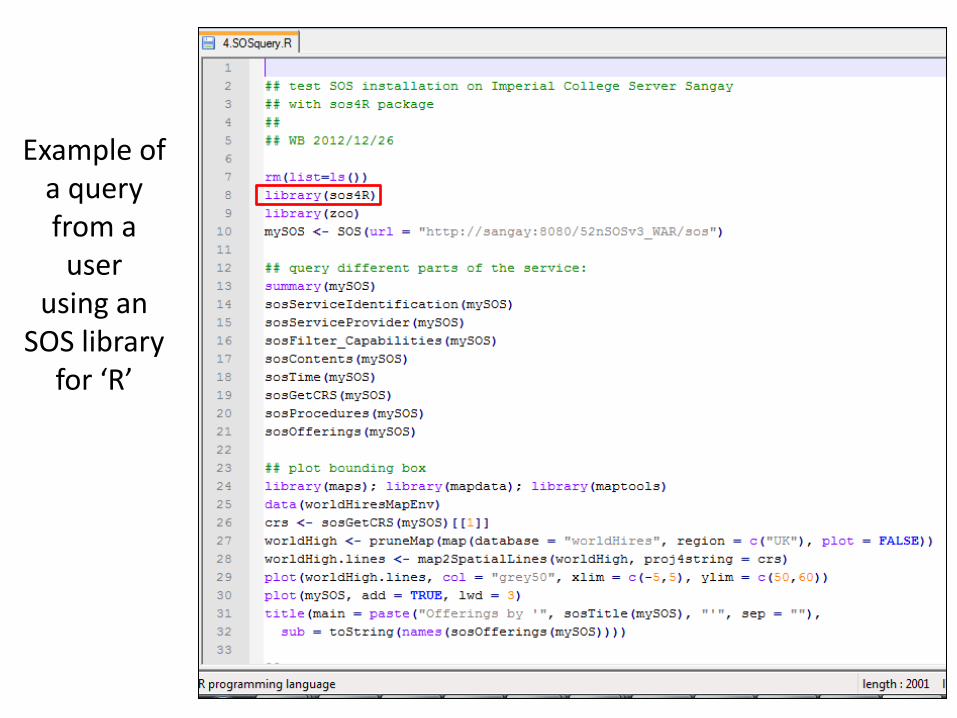
Example of a query from a user
using an SOS library
for ‘R’

Example of output in GML (Geography Markup Language) standard format

Plotting of data downloaded from SOS server (plotting done using functions of programming language)

Susana Ochoa-Rodríguez BHS Meeting – 28.02.2013
3. RAINFALL PROCESSING TECHNIQUES
• Aimed at improving accuracy and resolution of rainfall estimates
• Two techniques have been developed, tested and implemented as Web Processing Services (WPS):
Merging of radar and raingauge rainfall estimates
Rainfall downscaling

Susana Ochoa-Rodríguez BHS Meeting – 28.02.2013
“… Rainfall is the main input for urban pluvial flood models and the
uncertainty associated to it dominates the overall uncertainty in the
modelling and forecasting of these type of flooding… ’’
(Golding, 2009)
We really need to get the rainfall right!

Susana Ochoa-Rodríguez BHS Meeting – 28.02.2013
Two essential characteristics of rainfall estimates
• Accuracy: critical! Especially for urban hydrological applications, where errors in rainfall estimates are magnified by the small scale
• Resolution: for urban hydrological applications spatial and temporal resolution must be high

Sensors commonly used for estimation of rainfall at catchment scales
RAINGAUGE RADAR
Accuracy
Coverage, spatial characterisation of rainfall field
Resolution
Raingauge Weather Radar
Further processing of radar rainfall estimates can improve its applicability (in terms of accuracy and resolution) to urban hydrological applications

Susana Ochoa-Rodríguez BHS Meeting – 28.02.2013
Two techniques have been studied
• Gauge-based radar rainfall adjustment: aims at combining the advantages of radar and raingauge sensors to have a better spatial description and local accuracy of urban rainfall
• Cascade-based spatial downscaling: aims at producing rainfall estimates with finer spatial resolution (< 1 km)

Susana Ochoa-Rodríguez BHS Meeting – 28.02.2013
RADAR-RAINGAUGE MERGING OR ADJUSMENT Aim: To combine the advantages of radar and raingauge sensors to have a better spatial description and local accuracy of urban rainfall
Interpolated rainfall field
Radar image
Output rainfall field

0
5
10
15
20
25
00:05 01:05 02:05 03:05 04:05 05:05 06:05 07:05
Rai
n D
ep
th (
mm
)
Time (5 min)
Cumulative Rain Depth (23/08/2010 event)@Beal RG
Beal_RG Radar 1km
Beal HS raingauge rainfall depth accumulations: 23/08/2010 event
Why we need to adjust radar rainfall data?
Raingauge
Collocated radar pixel
Urban drainage models are normally calibrated using raingauge data

Susana Ochoa-Rodríguez BHS Meeting – 28.02.2013
Based on their assumption, gauge-based radar rainfall adjustment techniques can be
classified into two types
Mean Bias Correction
Error Variance Minimisation

a) b)
c) d)
e) f)
g)
Block-Kriging interpolation
comparison
error field fitted by an exponential variogram
combination
output
RG data Radar data
Principle of Bayesian Data Combination
[Image : Ehret et al., 2008] [Source: Todini, 2001]
In this process the variance of the error is
minimised

Four recorded events in the period of 2010 – 2012 over the Cranbrook catchment were studied
Event Duration RG total(1)
(mm) Radar@RG
total(2) (mm) Radar total
(mm) Sample bias Bi = (1)/(2)
23/08/2010 8 hr 23.53 7.29 6.80 3.23
26/05/2011 9 hr 15.53 5.10 4.88 3.04
05/06/2011 24 hr 20.87 9.43 9.48 2.21
03/01/2011 13 hr 8.93 7.72 7.55 1.16
Bias is event-varying, separate adjustment for each event is required
Stratiform
Convective

0
5
10
15
20
25
0:05 1:05 2:05 3:05 4:05 5:05 6:05 7:05
Rai
n d
ep
th (
mm
)
Time (5 min)
Mean Rainfall Accummulation: 23/08/2010 event
Mean RGs
Radar 1km
Corrected Radar 1km
Bayesian Radar 1km
Both rainfall profiles and accumulations can be significantly improved through adjustment
0
2
4
6
8
10
12
14
16
0:05 1:05 2:05 3:05 4:05 5:05 6:05 7:05
Rai
nra
te (
mm
/hr)
Time (5min)
Mean Rainrate: 23/08/2010 event
Mean RGs
Radar 1km
Corrected Radar 1km
Bayesian Radar 1kmMean bias adjusted
Bayesian adjusted
Mean bias adjusted
Bayesian adjusted
Raingauge
Radar
Radar
Raingauge

Simulation of flow depths is substantially improved by using merged rainfall data as input (23/08/2010 event)
0
0.2
0.4
0.6
0.8
1
1.2
1.4
1.60
5
10
15
20
25
30
0000 0100 0200 0300 0400 0500 0600 0700 0800 0900 1000
23 August 2010 (Time, GMT)
Flo
w D
ep
th (
m)
Rai
n (
mm
/hr)
Pipe 463.1 (Mid-stream)
RGs
Radar 1km
Corrected Radar 1km
Bayesian Radar 1km
Obs. 463.1(Mid-Stream)Observations

Simulation of flow depths is substantially improved by using merged rainfall data as input (26/05/2011 event)
0
0.2
0.4
0.6
0.8
1
1.2
1.4
1.60
10
20
30
40
50
60
1000 1100 1200 1300 1400 1500 1600 1700 1800 1900 2000 2100
26 May 2011 (Time, GMT)
Flo
w D
ep
th (
m)
Rai
n (
mm
/hr)
Pipe 463.1 (Mid-stream)
RGs
Radar 1km
Corrected Radar 1km
Bayesian Radar 1km
Obs. 463.1 (Mid-stream)

Susana Ochoa-Rodríguez BHS Meeting – 28.02.2013
Rainfall Cascade Generator
q
τ
τ(q)
q
τ
τ*(q)
τ(q)
Log (spatial scale)
Log (q-th moment)
q = q5q = q4
q = q3q = q2
q = q1
V14km
V8kmLevel n = 8 km
Level n = 4 km
Level n = 2 km
Level n = 1 km
V24km
V34km V4
4km
V112km V12
2km
V132km
V142km
V1211km
V1221km
V1231km
V1241km
wi1 wi2
wi4wi3
wi1
wi2 wi4
wi3
wi1 wi2
wi4wi3
Principle of cascade based spatial downscaling
Scaling analysis
fitting
Feature curve
downscaling

Adjustment of 1 km data -> Downscaling to 500 m 20100823 event 20110526 event
Combined Application – Merging & Downscaling

Measurement of the impact of bias and resolution
Us: range of water depth estimates resulting from downscaling
Uadjusted: difference in water depth estimates resulting from bias correction
Us
Uadjusted
t
Flow
level
Water Depth Us
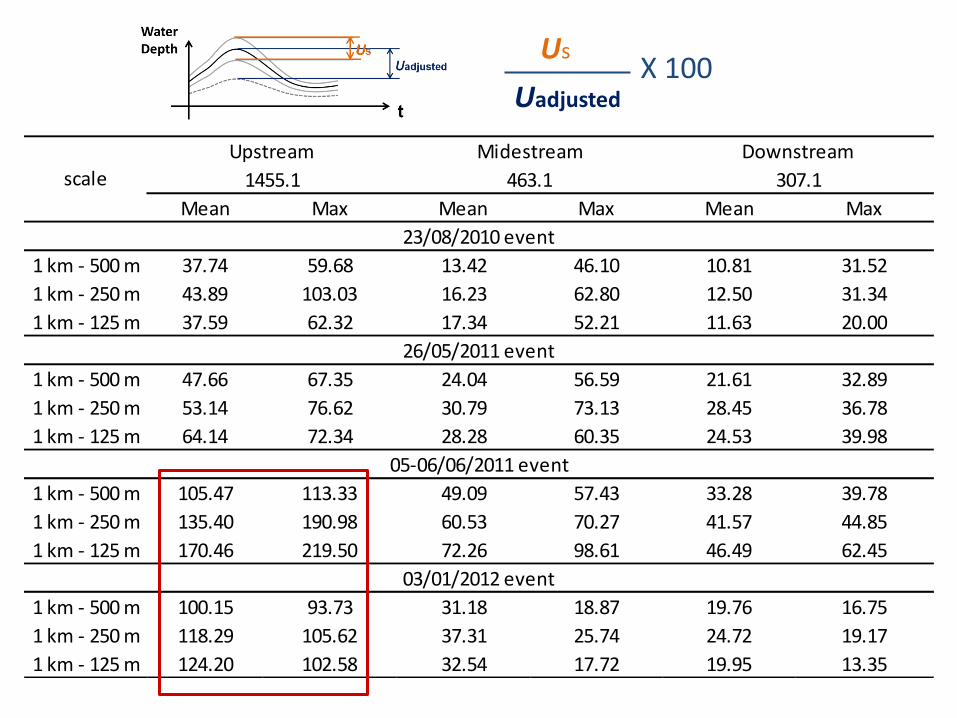
Mean Max Mean Max Mean Max
1 km - 500 m 37.74 59.68 13.42 46.10 10.81 31.52
1 km - 250 m 43.89 103.03 16.23 62.80 12.50 31.34
1 km - 125 m 37.59 62.32 17.34 52.21 11.63 20.00
1 km - 500 m 47.66 67.35 24.04 56.59 21.61 32.89
1 km - 250 m 53.14 76.62 30.79 73.13 28.45 36.78
1 km - 125 m 64.14 72.34 28.28 60.35 24.53 39.98
1 km - 500 m 105.47 113.33 49.09 57.43 33.28 39.78
1 km - 250 m 135.40 190.98 60.53 70.27 41.57 44.85
1 km - 125 m 170.46 219.50 72.26 98.61 46.49 62.45
1 km - 500 m 100.15 93.73 31.18 18.87 19.76 16.75
1 km - 250 m 118.29 105.62 37.31 25.74 24.72 19.17
1 km - 125 m 124.20 102.58 32.54 17.72 19.95 13.35
scale
23/08/2010 event
26/05/2011 event
05-06/06/2011 event
03/01/2012 event
Upstream
1455.1
Midestream
463.1
Downstream
307.1
Uadjusted
Us X 100

Susana Ochoa-Rodríguez BHS Meeting – 28.02.2013
• In most cases, gauge-based radar rainfall adjustment shows larger impact on the subsequent hydraulic outputs:
In general Accuracy is more important than Resolution!
• However, it may be possible that in small areas the impact of fine-scale spatial variability of rainfall is relatively more important than the bias observed in radar estimates.
• We will continue to study the impact of bias and resolution based on more rainfall events

These two rainfall processing techniques have been implemented as Web
Processing Services (WPS)
Client
WPS server
Hydrological Modelling
Downscaling
Data Merging
• WPS Interface Standard provides rules for standardising inputs and outputs for invoking geospatial processing services as web services
• Allow taking advantage of distributed computing – more efficient than doing this in your own computer
• Since it follows a standard interface, it can be easily used by clients
• Facilitates knowledge sharing – testing of algorithms without you having to implement them

Susana Ochoa-Rodríguez BHS Meeting – 28.02.2013
4. PUTTING THE JIGSAW TOGETHER
We now have a series of building blocks which use standard interfaces and can be easily linked


DVD RW
SOS server
Client
Rain gauge networks
WPS server
Level sensors
Hydrological Modelling
Downscaling
Data Merging

Susana Ochoa-Rodríguez BHS Meeting – 28.02.2013
5. CONCLUSIONS

Susana Ochoa-Rodríguez BHS Meeting – 28.02.2013
Sensor Observation Services (SOS)
• Enable storing and accessing data from multiple sensors in a standardised way
• Data are centralised but can be easily accessed by a number of ‘clients’ (who can use existing libraries and simple scripts for querying the SOS database)
• Allow interoperational use of data
• Facilitate access to data, data exchange and display
• Useful for participatory modelling / management of hydrological systems

Susana Ochoa-Rodríguez BHS Meeting – 28.02.2013
Web Processing Services (WPS)
• Allow taking advantage of distributed computing
• Facilitate knowledge transfer and sharing
• Facilitate quick testing and comparison of different models / algorithms

Susana Ochoa-Rodríguez BHS Meeting – 28.02.2013
Web Services as a whole
• Make hydrological monitoring and modelling resource-effective
• Highly flexible – you jigsaw can be as simple or complex as you wish
• Facilitate knowledge transfer and sharing
• Standard formats can facilitate and speed up implementation of models / tools
• Plenty of tools freely available online

Susana Ochoa-Rodríguez BHS Meeting – 28.02.2013
Thank you for your attention
Susana Ochoa-Rodríguez