Embed Size (px)
Citation preview
eb s
ite
at th
is is
an
auth
or-p
rodu
ced
PD
F of
an
artic
le a
ccep
ted
for p
ublic
atio
n fo
llow
ing
peer
revi
ew. T
he d
efin
itive
pub
lishe
r-aut
hent
icat
ed v
ersi
on is
ava
ilabl
e on
the
publ
ishe
r W Food Research International March 2004; 37(2) : 181-193 http://dx.doi.org/10.1016/j.foodres.2003.12.006© 2004 Elsevier Ltd. All rights reserved
Archimer http://www.ifremer.fr/docelec/Archive Institutionnelle de l’Ifremer
Sensory characteristics of cold-smoked Atlantic salmon (Salmo salar) from European market and relationships with chemical, physical and
microbiological measurements
Mireille Cardinala*, Helga Gunnlaugsdottirb, Marit Bjoernevikc, Alexandra Ouissed,
Jean Luc Valleta and Françoise Leroia
a IFREMER, Laboratoire Génie Alimentaire, Valorisation des produits, rue de l’île d’Yeu, BP 21105, 44311, Nantes Cedex 3, France b Matra, Technological Institute of Iceland, Keldnaholt, IS-112, Iceland c Institute of Marine Research, Matre Aquaculture Research Station, 5984, Matredal, Norway d ADRIANT, rue P.Bobierre, BP 62303 – 44323 Nantes, Cedex 3, France *[email protected] Tel.: +33-2-40-37-40-61; fax: +33-2-40-37-40-71
Abstract: Samples of different brand names of cold-smoked salmon products were purchased in supermarkets in six different European countries (Belgium, Denmark, France, Germany, Italy and United Kingdom), to classify and select products of smoked salmon for preference establishment. From the 117 products obtained, 60 were selected to characterise the qualities of products available to European consumers. These 60 products of smoked salmon were then ordered directly from the producers in each country. Altogether 57 products were received and analysed. All samples were stored at 4 °C and then examined 2 and 3 weeks after production. For all samples, sensory evaluation, chemical (lipid, salt, phenol, TVB-N and trimethylamine content) and physical (texture, colour) analyses and microbiological measurements (total psychrotrophic count, total lactic acid bacteria, lactobacilli, Brochothrix thermosphacta, yeasts, Enterobacteriaceae) were performed at the same time. The results show that the samples could be classified into 11 groups according to specific sensory properties evaluated by a trained panel. The main discriminating factors were found to be colour, intensity and characteristic of smoke note, amine note and salty perception. Some of the chemical and physical measurements were found to be rather good indicators of sensory properties. Polynomial models were tested to find relationships between sensory properties and chemical/physical parameters. Keywords: Atlantic salmon; Smoking; Salting; Quality parameters; Sensory evaluation
Ple
ase
note
th
1
1. Introduction
Vacuum packed cold-smoked salmon is a product with wide range of consumption in
Europe and thus of considerable economic importance for the seafood market. Among
countries that produce smoked salmon, France is in the lead with 19000t, followed by
Denmark (15660t), Germany (15100t) and United Kingdom (10250t) (FAO, 2001).
Consumption is mainly distributed among France, Germany, United Kingdom, Italy and
Belgium.
Smoked salmon is now a product of general consumption and has lost its luxury image.
The development of aquaculture in Northern countries is one of the main reasons contributing
to this new status of the product and its wide distribution on the market.
Many studies have been carried out in aquaculture to understand, to control and to
optimise salmon growth parameters as well as the main factors involved in the quality of the
flesh. A lot of works has been conducted on the onset of the rigor (Berg, Erikson, &
Nordtvedt, 1997), the gaping phenomenon (Andersen, Stromsnes, Steinsholt & Thomassen,
1994; Skjervold, Fjaera, Ostby, & Einen, 2001), the flesh colour (Sheehan, O’Connor,
Sheehy, Buckley & FitzGerald, 1998), the fish lipid content (Aursand, Bleivik, Rainuzzo,
Jorgensen & Morhr, 1994; Hillestad, Austreng, & Johnsen, 1995; Lie, 2001; Robb, Kestin,
Warriss & Nute, 2002), the slaughtering techniques (Roth, Moeller, Veland, Imsland &
Slinde, 2002; Sheehan, O’Connor, Sheehy, Buckley & FitzGerald, 1996) as well as the
processing conditions of the raw material as pre or post rigor filleting effect (Skjervold,
Fjaera, Ostby, Isaksson, Einen & Taylor, 2001; Skjervold, Rora, Fjaera, Vegusdal, Vorre, &
Einen, 2001; Einen, Guerin, Fjaera & Skjervold, 2002). Among these factors, the tailoring of
fish fat content is of considerable interest and various studies have followed the effect of a
modification of the fish diet on flesh quality (Arzel, Lopez, Métailler, Stéphan, Viau &
2

Gandemer, 1994; Regost, Arzel, Cardinal, Laroche, & Kaushik 2001, Sérot, Régost & Arzel,
2002, Nordgarden, Hemre, & Hansen, 2002, Turchini et al. 2003; Rora, Regost & Lampe,
2003). Replacement of fish oils by vegetable oils during the growth has been tested in order to
identify how to maintain a good growth rate while controlling the lipid content of the flesh
and managing the available lipid sources (Grisdale-Helland et al., 2002).
At the same time, processors of smoked salmon have made efforts to adapt their
production parameters to this raw material in order to respect the market demand and to
satisfy their requirement for profit. The choice of the processes used (salting techniques,
drying and smoking procedures, type of equipment) is large and for each step of the process,
the choice of control parameters such as time of salting, concentration of brine or smoking
temperature allows specific finished product characteristics to be reached (Chan, Toledo &
Deng, 1975; Cardinal, Berdagué, Dinel, Knockaert, & Vallet, 1997; Indrasena, Hansen &
Gill, 2000). The knowledge of raw material characteristics is an important factor to control in
order to obtain the required product quality and many studies have shown their effect on final
characteristics and yield (Beltran & Moral, 1991; Rora, Kvale, Morkore, Rorvik, Steien &
Thomassen, 1998; Cardinal et al., 2001).
The wide range of raw salmon characteristics as well as the many salting and smoking
techniques used by different processors gives rise to a wide range of smoked salmon
characteristics available on the market. All year round there is a wide selection of products
available to consumers. However, consumers have great difficulties in identifying criteria in
order to be able to choose a product according to their preference. Often, the only information
available which can help consumers to make their selection are the appearance (e.g. the
colour) of the product, the brand name, processing references e.g. dry salting, the shelf life of
the product and of course the price. Recent French market surveys on smoked salmon
products, published by consumer review point out a general decrease of quality of smoked
3
salmon on the market (Maleysson & Bonneff, 2001; anonymous, 2002). The main criticisms
on the quality of the product refer to the appearance, the texture related to fat content, the
level of salt and the taste. A study performed on the Italian market reveals that the hygienic
quality of the smoked salmon is poor at the expiry date (Vergara, Di Pinto, Losito & Tantillo,
2001)
The purpose of the present study was to describe the smoked salmon characteristics
sold on the European market by sensory evaluation, physical measurements (colour,
expressible liquid), chemical analyses (lipid content, salt and phenol level, TVB-N and TMA
content) and microbiological analyses (total flora, lactic flora or other specific groups) in
order to get an objective overview of the quality of the smoked salmon. The aim of the study
was also to evaluate whether it was possible to classify the products according to their sensory
properties and to identify whether there was any relationship between sensory characteristics
and the chemical/physical parameters.
2. Materials and Methods
2.1 Materials
2.1.1 Sampling in supermarkets
Samples of commercial smoked salmon products were collected in six countries, France,
Germany, United Kingdom, Italy, Belgium and Denmark. In the first five countries, large
quantities of smoked salmon are consumed, while Denmark is on the forefront of smoked
salmon production. It was decided to collect all products available in supermarkets in one or
two towns in each country. Supermarkets were chosen as source of sampling because
consumers generally purchase cold-smoked salmon there.
Samples of sliced vacuum packed cold-smoked salmon (Salmo salar) were purchased during
January and February 2001, sent to IFREMER laboratory in refrigerated truck for a first
4
screening in order to choose a sub set of 60 samples covering the product variability available
on the market in these six countries. In total, 117 products were received: 13 samples from
Belgium (5 of these were produced in France and 2 in Germany), 58 samples from France (5
of these were produced in UK and 2 in Germany), 4 samples from Denmark, 14 samples from
Germany (1 of them produced in Denmark), 22 samples from United Kingdom and 6 samples
from Italy (2 of them produced in Denmark). Altogether the sampling corresponded to 4
producers in Belgium, 6 in Denmark, 12 in France, 6 in Germany, 2 in Italy and 9 in the
United Kingdom.
A sensory description test was performed on each product by a panel consisting of 5 people
with a large experience in tasting smoked salmon. The following criteria were used: odour,
appearance, flavour and texture. Each panellist described the main characteristics of the
products as well as the intensity of perception. All the samples were evaluated in 9 sessions
where 10 to 15 products were assessed. After an individual evaluation of each product, a
discussion allowed panellists descriptions to be compared and samples were gathered in class
according to their common characteristics. Finally, this screening allowed products to be
sorted out and 60 products were selected. These products represented the span of smoked
salmon sensory properties available to European consumer today.
2.1.2 Sampling in Industry
These 60 samples of smoked salmon were then ordered directly from the producers in each
country. This was done in order to control our experimental design according to the shelf life
of the product. All the samples were vacuum packed and evaluated after two (T2) and three
weeks (T3) of storage at +4°C in order to include the effect of the shelf life in the study and to
simulate the habits of consumer consumption for this product. Altogether 57 out of 60
products were received and analysed. Among these 57 products, 6 originated from Belgium, 7
5
from Denmark, 21 from France, 6 from Germany, 4 from Italy and 13 from the United
Kingdom.
2.2 Methods
2.2.1. Sensory evaluation
A descriptive test with conventional profiling (Stone & Sidel, 1985) was carried out to
evaluate the sensory characteristics of smoked salmon. All 57 samples were scored by twenty-
four panellists belonging to the IFREMER staff and trained on sensory descriptors for smoked
salmon. The descriptors related to the appearance, odour, flavour and texture of smoked
salmon slices were : odour: global intensity, wood fire, cold ashes, bacon, tuna, raw salmon,
herring, rancid, amine, rubber; appearance: pink colour, orange colour, homogeneity of
colour; tearing of the slices (brittleness), translucent appearance, fatty aspect, white stripes;
flavour: global intensity, wood fire, cold ashes, bacon, raw salmon, herring, rancid, salty taste,
sour, amine, rubber; and texture: firmness, crunchy texture, melting texture, fatty texture,
pasty texture.
An experimental design was constructed in order to balance various parameters, the
characteristics of products presented within a session (it was decided to present samples that
had previously identified as samples belonging to different groups at the same session), the
country of origin of the product and the remaining shelf life i.e. a balance between T2 and T3
was decided. Four smoked salmon samples were presented in each session. Thirty-one
sessions were necessary to test all the products.
According to the package weight (100g or 200g), seven to fourteen packages from each
sample were necessary to give one slice to each panellist. All samples were stored at +4°C
until sensory analysis was performed. The day of sensory analysis, the packages of smoked
salmon were opened and kept open for 15 minutes at ambient temperature, after that each
6
slice was individually repacked in aluminium foil. Sessions were performed in individual
partitioned booths equipped with a computerised system (Fizz system, Biosystèmes, Dijon,
France). These conditions were conducive to concentration and avoided communication
between assessors and disturbance by external factors (NF V-09-105, 1995). Panellists rated
the sensory attributes on a continuous unstructured line scale from low intensity (0) to high
intensity (10). Products were assigned 3-digit numbers, randomised and served
simultaneously. Mineral water and bread were proposed between samples.
2.2.2. Microbiological analyses
When sensory evaluation was carried out, three packages per sample were opened and a 30 g
portion of each bag, representing all the slices, was stomached in 120 ml chilled diluents
(0.85% NaCl and 0.1% peptone) for two min in a stomacher 400 (Lab. Blender, London,
UK). After 30 min at room temperature for resuscitation, 10 ml of the three homogenates
were pooled together to constitute the "mother" solution. Spread plates of modified Long and
Hammer's medium (LH, van Spreekens 1974) incubated at 15°C for 5 days were used to
determine the Total psychrotrophic count (TPC). Total lactic acid bacteria (LAB) were
enumerated on spread plates of Nitrite Actidione Polymyxin agar (NAP, Davidson and Cronin
1973) at pH 6.8 and lactobacilli on Rogosa agar (ROG, Biokar, Beauvais, France) at pH 5.5
as suggested by Leroi et al. (2000). NAP and ROG plates were incubated at 20°C in anaerobic
conditions (Anaerocult A, Merck, Darmstadt, Germany). Yeasts were enumerated on
Oxytetracycline Glucose Agar (OGA) made with OGA base (Biokar) and 0.01%
oxytetracycline (Oxoid, Basingstoke, England). Enterobacteriaceae counts were determined in
pour plates of CASO agar (Merck) overlaid by Violet Red Bile Glucose agar (Oxoid),
incubated at 30°C for 2 days. Assuming that non-typical colonies could also belong to the
Enterobacteriaceae family (unpublished data), all the colonies growing in the plate were
7
enumerated. B. thermosphacta was enumerated on spread plates of STAA (Gardner 1966)
(2% peptone, 0.2% yeast extract, 0.1% KH2PO4, 0.1% MgSO4 7H2O, 1.5% glycerol, 1.3%
agar, 0.05% streptomycin, 0.005% cycloheximide and 0.005% thallium acetate) incubated at
20°C, after confirming the Gram, catalase and oxidase reactions of the colonies.
2.2.3. Chemical analyses
The remaining flesh in the 3 packages opened for microbiological analysis was homogenized
in a Warring Blender. The flesh was diluted fives times with distilled water and measured
using a pH meter, Mettler 320 (Mettler-Toledo, England). The total volatile basic nitrogen
(TVBN) and trimethylamine (TMA) were measured in duplicate using the Conway
microdiffusion method (Conway and Byrne, 1933).
Dry matter content was analysed by oven drying 10 g of smoked salmon at 103°C
until a constant weight was reached. Total fat content was determined by hexane extraction,
and salt content was measured with a Chloride Analyser 926 (Corning, Halstead, England)
and expressed in g 100 g-1 of flesh (wt/wt). For total phenols quantification, 4 g were
homogenized with 50 ml ethanol (95%) for 1 min using a blender (Ultraturax, GmbH,
Dottingen, Germany). After centrifugation (2500g, 10 min), 5 ml supernatant was put in a
decantation flask and energetically mixed with 30 ml distilled water and 0.6 ml of a 2%
phenyl-2,3-dimethyl-4-amino-5-pyrazolone solution (Merck, Darmstadt, Germany). 2 ml of
2N ammonia solution were added and the mixture homogenized manually. This procedure
was then repeated with 2 ml of 2% potassium hexacyanoferrate solution (Prolabo, Fontenay
sous bois, France). The mixture was then left to stand for 5 min before adding 10 ml
chloroform and mixing energetically for 15 min with a stirring machine. After decantation,
the chloroform phase was filtered through a Durieux filter (n°126) containing 3 g of
anhydrous sodium sulphate. Optical density was read at 455 nm on a spectrophotometer and
8
compared to a standard curve established with a serially diluted 1 mg/l standard phenol
solution (Prolabo, Fontenay sous bois, France).
2.2.4. Colour measurement
Colour was determined from two packages of each sample, using a Hunterlab Miniscan/EX
instrument with a D65 light source and a 10° observer (Hunter Associates Laboratory Inc.,
Reston, USA) calibrated to black and white standards. The tristimulus L*, a*, b*
measurement mode was used as this relates to human eye response to colour. The L* variable
represents lightness (L* = 0 for black, L* = 100 for white), while the a* scale represents the
red/green dimension, with positive values for red and negative ones for green. The b* scale
represents the yellow/blue dimension, with positive values for yellow and negative ones for
blue (Hunter & Harold, 1987). Colour was measured on three different spots in each package
Results are shown as the mean of these measurements.
2.2.5. Expressible liquid
The expressible liquid gives an indication of the water holding and textural properties of the
smoked salmon slices. This measurement was thus considered as a possible method to
evaluate liquid leakage from smoked salmon, which is identified as an important quality
problem in some products on the market. It was measured as the quantity of water squeezed
from smoked samples upon compression. Measurements were performed using a Texture
Analyser TA.XT2® (Stable Micro Systems, Haslemere, Surrey, UK) by a flat ended probe,
100 mm in diameter, at 50% deformation according to Lee and Chung (1989) and LeBlanc
and LeBlanc (1992) with some modifications. Three packages of smoked salmon were used
and 15 replicates for each product were compressed between layers of weighed Whatman
filter papers no. 4. The speed of the probe was 0.8 mm sec-1. After compression the samples
9
were removed and the filter papers were reweighed. The expressible liquid was calculated on
the basis of the fluid absorbed by the filter paper compared to the sample weight. This
measurement includes water and fat release.
2.2.6. Statistical analysis
Summary statistics (mean, standard deviation, minimum, maximum), analysis of variance and
Duncan's multiple range test were performed using Statgraphics Plus 3.1 software (Sigma
Plus, Paris, France). The significant statistical level was set at p < 0.05. Multivariate data
processing was performed with Uniwin Plus 3.02 software (Sigma Plus, Paris, France).
Principal component analysis (PCA) without standardization was performed on the means of
the sensory scores and cold-smoked salmon samples were clustered using the Ward’s
hierarchical clustering method with the Euclidean distance calculated with the projection of
the sensory attributes on the first four principal components of the PCA. When multiple linear
regression model were calculated, the adjusted R-squared, taking into account the numbers of
independent variables, was given to show the part of explanation of the variability with the
model.
3. Results-Discussion
3.1. Samples shelf life
Samples of smoked salmon were ordered directly from the producers in each country with a
request of manufacturing the product on a predetermined date. It was not always possible for
the producers to manage the date of production according to the chosen experimental design
and in many cases the exact date of smoking was unknown. The only information available
was the declared expiry date (use by date) on the package. Therefore the number of days
between the date of analysis and the use by date of the product was used to compare the
10
samples, this we call the remaining time (RT). Table 1 shows a large variation of this
remaining time from one sample to another. Products analysed two weeks after processing
had a mean of 11 days remaining before the use by date. Table 1 reveals that for all samples
evaluated, the remaining time varied from 43 remaining days to 11 days past the use by date.
This large distribution is a consequence of the difference of shelf life of the products
evaluated. The shelf life of commercial smoked salmon apparently depends on which country
(market) the products are available. A shelf life between 21 and 30 days is common in France
and Belgium, while a shelf life of 14 days is frequent in Germany, United Kingdom and
Denmark. In contrast to these countries, the shelf life of products sold on the Italian market is
60 days or more. In our experiment, we were sometimes forced to suppress the second
sensory analysis point after three weeks of storage, as, some products were past the use by
date and/or because chemical, microbiological and sensorial quality indicated spoilage.
3.2. Chemical and physical results
Water and lipid content
Table 1 gives the main characteristics of the 57 samples analysed two (T2) and three (T3)
weeks after processing. As expected an inverse linear relationship between the water and lipid
content was observed (R2 = 0.78); the mean water content was 62.9% ± 2.8 (w/w) and the
lipid content 10.4% ± 3.3 (w/w). It is likely that the minimum and maximum values for the
water content i.e. 56.1% and 70.1% are linked to the salting process (dry and injection
salting). The fillet fat level is also an important factor for salt diffusion and water loss during
salting, this is especially true for the dry salting technique. For the lipid content, a significant
difference was observed between the samples according to the origin of the salmon. Salmon
from Norway gives the highest fat content in finished product (n = 56, 28 products and 2
11
analyses) with 11.4%. Cold-smoked salmon from Irish salmon or Scottish salmon reach fat
content values of 9.9% (n = 10, 5 products) and 9.3% (n = 48, 24 products) respectively.
Salt and phenol content
Table 1 reveals that the products have an average salt content of 3.1 ± 0.6% (w/w) with a
large distribution of values. Some samples received a light treatment, less than 2.0% (w/w)
while for a few samples as much as 4-5% (w/w) was applied. The salt content is significantly
different depending on the country of production. Table 1 shows that products from Belgium
and United Kingdom have a lower salt content compared to products originating from the
other four countries.
The phenol content is fairly low in all samples with an average of 0.6 mg 100g-1 (Table 1).
However, some products had a high level of phenol (up to 2 mg 100g-1) which suggests that
an intense smoking process has been applied. The highest phenol level were observed in
German, British, and Danish products. For samples from Great Britain, a larger variation in
the phenol content values was observed, from 0.14 to 1.81 mg 100g-1. Different reasons can
explain these large distribution of values, the kind of smoke production (autocombustion,
friction, liquid smoke), the type of smokehouse used with open or closed air conditioning and
the applied smoking time (Chan et al.,1975; Cardinal et al.,1997; Cardinal et al, 2001; Sérot,
Baron, Knockaert & Vallet, 2003).
Chemical criteria of spoilage
The mean values for TVB-N and TMA were 22.4 mg-N 100g-1 and 4.7 mg-N 100g-1,
respectively (Table 1). Concentrations ranged from 14 to 46 mg-N 100g-1 for TVB-N and
from 0 to 19 mg-N 100g-1 for TMA which indicate different stages of spoilage among the
samples. Previous studies (Truelstrup Hansen, Gill & Huss, 1995; Leroi, Joffraud &
12
Chevalier, 2000) have shown the evolution of these indicators during storage of samples and
the relation to the applied treatment (i.e. salt level and storage temperature). Results obtained
by Leroi et al.(2001) showed that, depending on the level of lactobacilli, samples with TVB-N
concentration of 30 mg-N 100 g-1 were considered spoiled by a group of panellists. The high
TVB-N and TMA values observed in our study are a strong indicator for poor preservation
quality of some of the cold-smoked salmon evaluated. The comparison of these indicators at
T2 and T3 does not show a real effect of storage time. Indeed the mean values for TVB-N
increase from 21.2 –to 23.5 mg-N 100 g-1 and those of TMA from 4.1 to 5.2 mg-N 100g-1.
The main reason for this low increase is that most of the samples were stable regarding these
indicators. Either they did not show any sign of spoilage (TVB-N value < 20 mg-N 100 g-1) at
T2 and T3 or they are already spoiled (TVB-N > 25-30 mg-N 100 g-1). Only 19% of the
samples (i.e. 11 out of the 57) increased hardly in TVB-N and TMA values. Values for pH
were quite stable for all products ranging from 5.77 to 6.37 (results not shown).
Expressible Liquid
The expressible liquid gives an indication of the water holding and textural properties of the
smoked salmon slices. The measurements of expressible liquid show a mean value of 7.7%
with a minimum and a maximum ranging from 5.1 to 12.7%. It is likely that the salting
method has an effect on the expressible moisture. When the injection salting technique is
applied, a salt brine is injected into the fish muscle using needles. This procedure will modify
the integrity of the muscle structure, which on the other hand may increase the expressible
liquid.
13
Colour
Previous studies on smoked salmon have shown that colour is related to pigment
received in the diet (Sheehan, O’connor, Sheedy, Buckley and FitzGerald, 1998) the fat
content of the fish (Rora et al., 1998) and to the smoking parameters applied (Cardinal et al.,
2001).
The measured colour of the 114 smoked salmon samples evaluated in this study clearly
reflects this variability. Lightness values of the samples ranged from 45.4 to 61.8 and the
values of red and yellow colour, a* and b*, range respectively from 13.4 to 34.2 and from
16.9 to 33.7. This measurement of colour can be of great interest for producers or retailers
because of the effect on consumer purchase (Gormley, 1992)
3.3. Microbiological results
The total psychrotrophic count (TPC) were very different from one sample to another,
varying from 0 to 109.6 cfu g-1. Among samples that had not exceeded the use by date at T2,
55% of the samples had a total viable count equal or higher to 106 cfu g-1 and 32% higher than
107 which means these samples do not pass the existing regulation (for the French market
where the limit is 106 cfu g-1). However, it is important to point out that the TPC were
enumerated on spread plates of Long and Hammer (LH) medium instead of the pour Plate
Count Agar (PCA) medium recommended in the French standard, and it has been clearly
shown that counts on LH are generally one logarithm higher than PCA counts (Joffraud &
Leroi, 2000; Joffraud J.J. and Leroi (2000). Final report of european contrat FAIR-PL- 95-
1207 - Spoilage and safety of cold-smoked fish). Based on the different microbiological
counts, the 114 samples could be divided into 6 groups by the Ward’s hierarchical clustering
method. Groups 1, 2 and 3 consisted of samples with generally high contamination level (TPC
> 106 cfu/g). Group 1 (23 samples) was composed of a mixture of LAB (mostly
Lactobacillus), Enterobacteriaceae and in a lesser extend Brochothrix thermosphacta. As TPC
14
was on average one log higher than the other flora, and based on results from Leroi et al.
(1998, 2001), we presume that marine Gram negative bacteria such as Vibrio spp,
Photobacterium sp, Aeromonas, Shewanella spp are also dominant. In group 2 (23 samples),
LAB (mostly Lactobacillus) and Vibrionaceae were the dominating flora while group 3 (n=
15) was dominated by Enterobacteriaceae and Vibrionaceae. Groups 4, 5 and 6 consisted of
samples with better hygienic profile. Groups 4 and 6 consisted of samples with a relatively
low TPC (104 cfu/g) but with different qualitative microflora composition. Microflora of
group 4 (21 samples) was dominated by LAB, probably belonging to Carnobacterium genus,
while Lactobacilli selective count on Rogosa agar was very low. In Group 6 (18 samples), all
counts enumerated on selective media were very low and TPC was probably constituted of
Vibrionaceae. Group 5 (10 samples) was a particular group, consisting of samples for which
all the counts were below the detection threshold (50 cfu/g).
3.4. Sensory characteristics
A principal component analysis (PCA) without standardisation was performed on the panel
mean score obtained for each descriptor on 102 out of 114 products. The twelve remaining
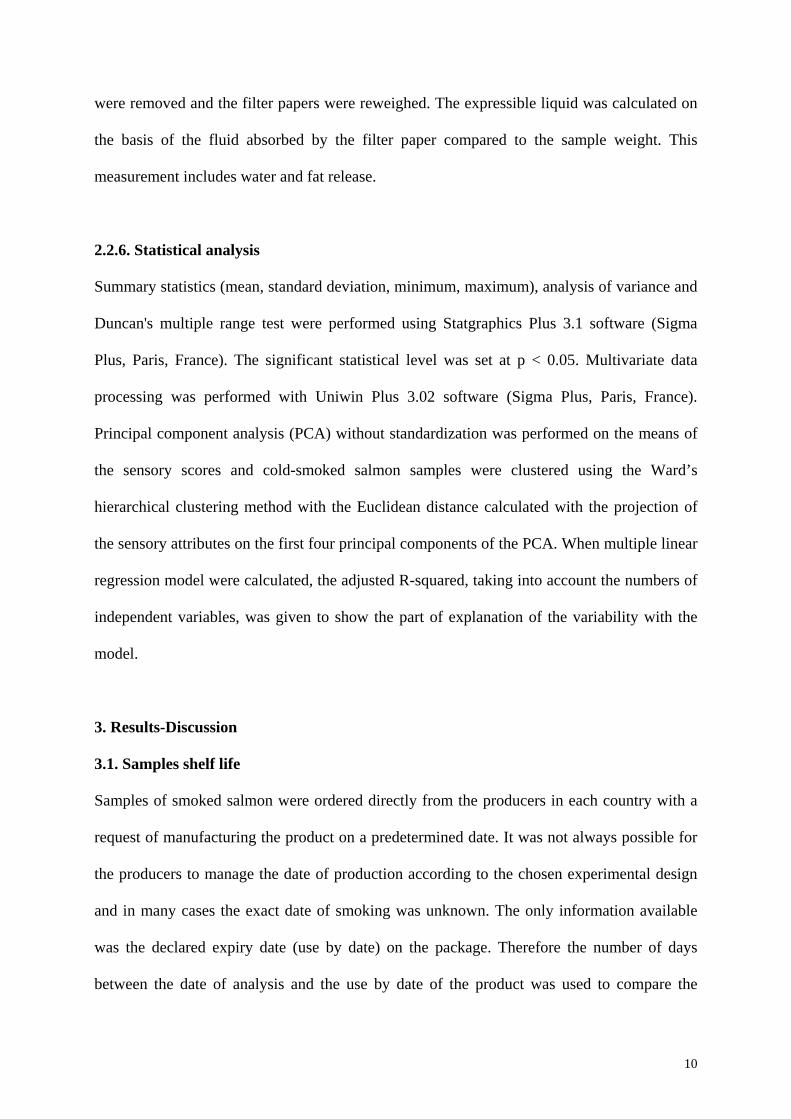
samples were identified as highly spoiled at T2 and thus not evaluated at T3. Figure 1
illustrates that the first principal component is mainly defined by descriptors of appearance
and that criteria of odour as amine note or wood fire smoke note are mostly involved in the
creation of the second axis. This first plane accounts for 50.3% of inertia.
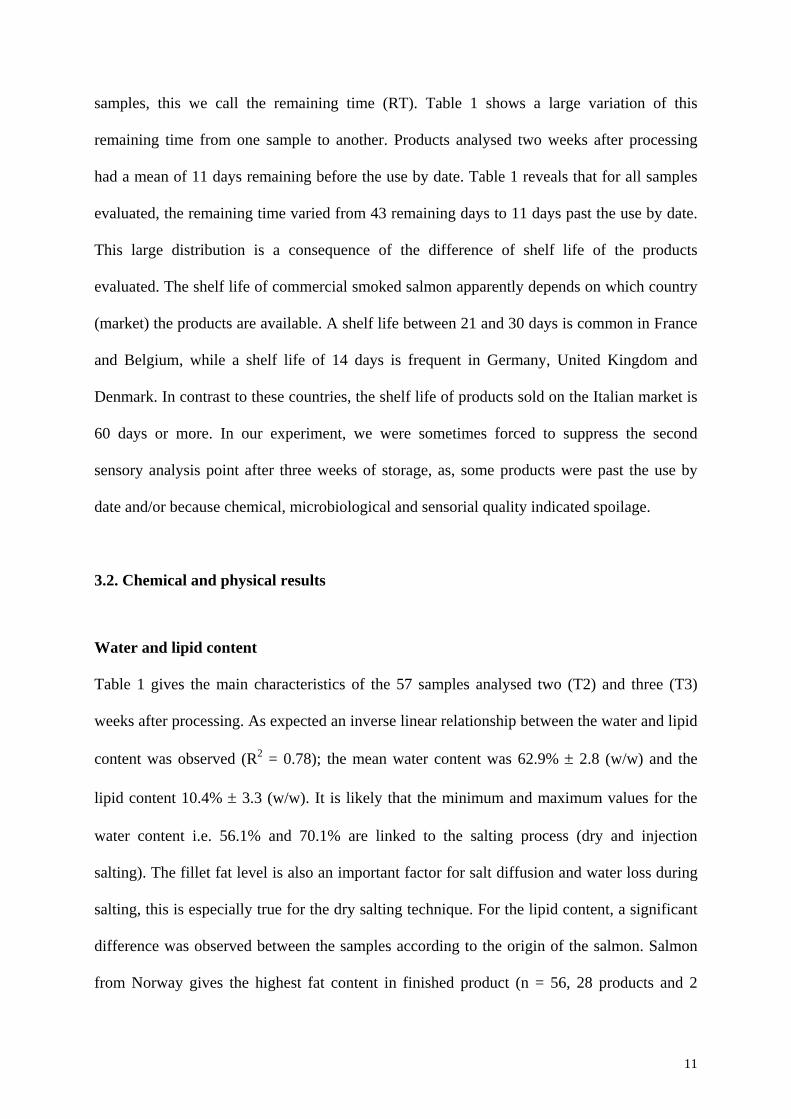
The projection of products in the 1-2 plane of PCA (Figure 2) shows a large distribution of
sensory characteristics in smoked salmon. Appearance is very different from one sample to
another, with a colour that varies from a very pink colour to a strong orange and
homogeneous colour. Regarding texture, the samples range from firm and crunchy texture to
pasty texture and there seems to be a relationship between descriptors of colour and texture.
Generally the firmer products also are orange in colour, while the more pasty products
15

generally have a pink colour. On the second axis, samples with sign of spoilage (i.e. amine
odour and flavour) are located on the top of the figure whereas products with a wood smoke
characteristic are on the bottom. Flavour is also a discriminative characteristic in this plane
through the perceived salt level.
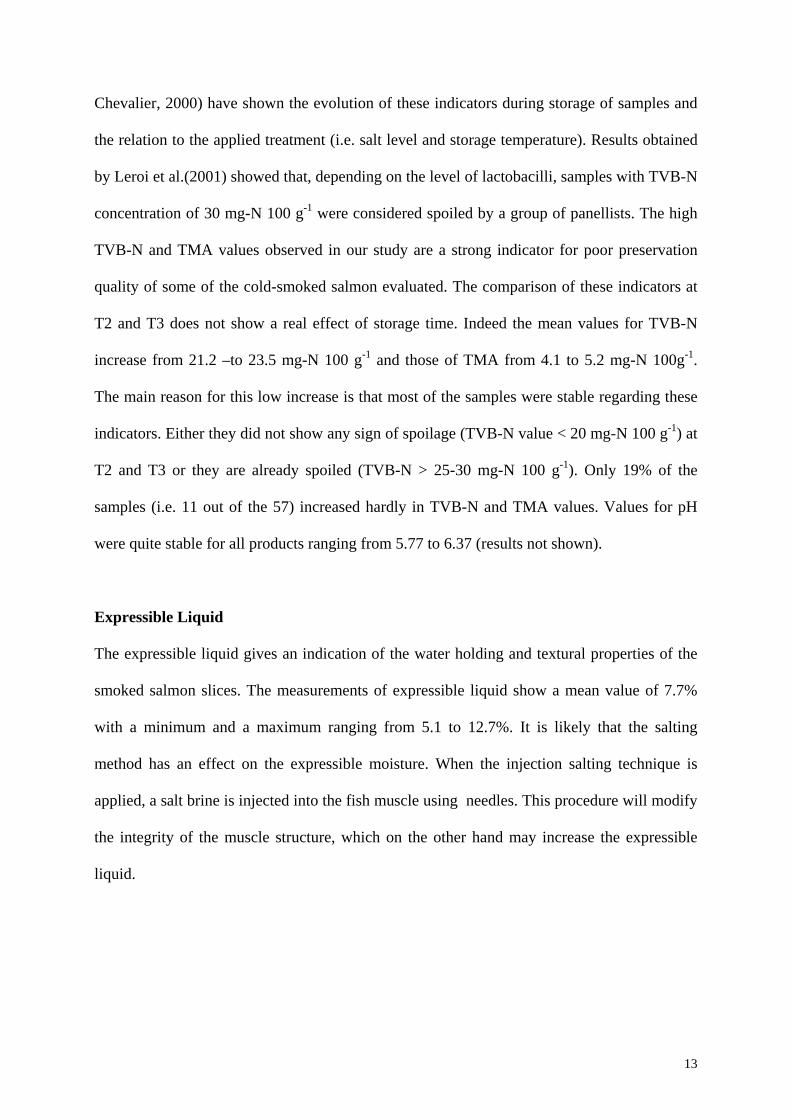
The third axis (10.9%) mainly consists of the global intensity of odour and flavour and the
fourth (6.5%) of fatty appearance and texture. In the 3-4 plane (not shown) samples are
ranked from low odour products to strong note. These notes can be described as wood fire
characteristic or strong cold ash, even a rubber note, and for some samples, notes which refer
to a certain degree of spoilage.
To identify groups of products with similar characteristics a cluster analysis (Ward’s
hierarchical clustering) has been performed on the projection of the samples for the first four
principal components of the PCA. Results show three main categories of products (A, B, C)
which can be detailed in eleven classes of samples identified in Figure 2. The main sensory
characteristics are presented in Table 2. Group A contains samples with mainly pink colour
and a tearing texture with different characteristics of smoke note which allows to identify
three sub set of samples (class 1, class 2 and class 3). Group B consists of samples with a
spoilage note. According to the intensity of the characteristics and to the intensity of smoke
note and salt level, three sub groups have been identified (class 4, class 5 and class 6). The
third main group, C, is a group of products with an orange colour. Five sub sets of samples
can be identified (classes 7, 8, 9, 10 and 11) according to the kind of smoke note (wood fire,
cold ash or rubber) the intensity of smoking, the intensity of raw fish note or the intensity of
salt perception (class 7 appears on the plane 3-4 of PCA, not shown). Neither the origin of the
salmon (Norway, Scotland or Ireland) nor the time of storage before analysis can be related to
the creation of these classes which means that it is probably more the process used as well as
16
the conditions of manufacturing in the process plants that have the main impact on product
sensory characteristics.
3.5. Relationship between sensory characteristics and chemical, physical and
microbiological parameters
The characterization of cold-smoked salmon through sensory properties leads to the
identification of different groups of products. Is it possible to use instrumental parameters to
correlate some of sensory characteristics? Indeed, sensory evaluation is a heavy measurement
tool which requires human subjects and time for training so it is interesting to know if
instrumental analyses could be an alternative solution to sensory evaluation for a product
characterization. The relationships between chemical, physical and microbiological
measurements and main sensory properties, identified as the most important in the
characterization and classification of the products, have been studied by calculating
correlation between principal components and each instrumental parameters (Figures 3 and
4).
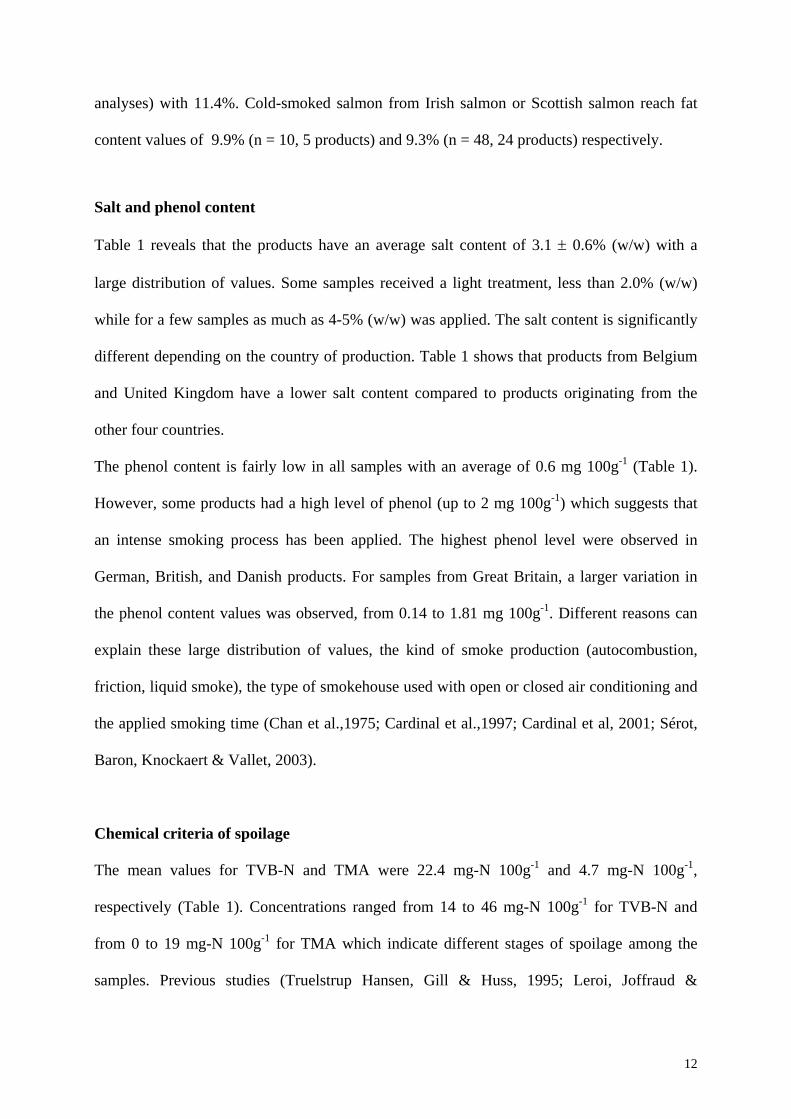
Colour
Figure 3 shows a good correlation between slice colour score (pink or orange) given by
the panel and the instrumental values L*, a* and b*. The L* value is low for orange colour
products and increase for pink colour samples. Instrumental hue values, a* and b*, show a
high relationship with the panel score for orange colour (Oran). A forward stepwise multiple
linear regression has been performed between orange colour and various parameters
potentially involved in colour such as, water, lipid, phenol, expressible liquid, L*, a* and b*.
The only significant variables to describe the orange colour were L* and b*. The following
model was obtained :
17
Oran = 13.2 - 0.25 L* + 0.19 b* R2 = 62.4
Samples with the most intense pink colour have a high L* value and generally the
highest expressible liquid values. A positive correlation is observed between L* and
expressible liquid and also a negative correlation between these two parameters and firmness,
crunchy texture and the brittleness of the slice. Two factors can affect the colour of the
smoked salmon slice: the kind and quantity of pigment the fish receives during rearing and
the process parameters in the smoking process. The influence of pigment included in salmon
feed during growing on flesh colour has been described in the literature (Baker, Pfeiffer,
Schöner & Smith-Lemmon, 2002). In our study, the lowest a* and b* values were obtained
for the organic salmon 13.4 and 16.9, respectively (Table 1). Regarding the effect of process
parameters on colour, recent study by this research group has shown that the salting process
has indeed an effect on the colour on the smoked salmon product so that pink colour is
observed when injection salting is used (unpublished data). In our study the process
parameters were generally not indicated on the packages of cold-smoked salmon products
analysed. Hence, we can only assume that injection salting had been used for the samples
with a characteristic pink colour. This salting technique could also explain the higher values
observed for expressible liquid, as, the use of needles during injection salting can affect the
integrity of the muscle and therefore renders the product more vulnerable to water and fat
leakage. The low correlation coefficient between water content and expressible liquid (0.11)
suggests that the salting process is likely to have a larger effect than the composition
characteristic of the samples.
Salty taste
18
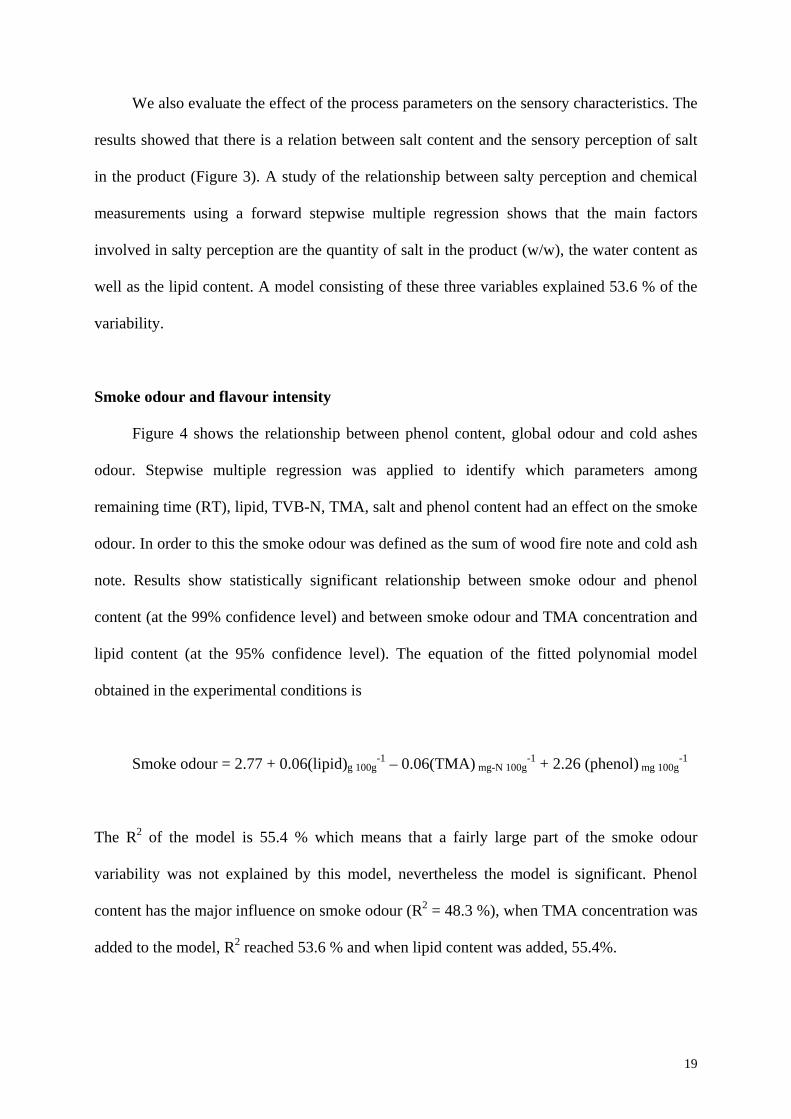
We also evaluate the effect of the process parameters on the sensory characteristics. The
results showed that there is a relation between salt content and the sensory perception of salt
in the product (Figure 3). A study of the relationship between salty perception and chemical
measurements using a forward stepwise multiple regression shows that the main factors
involved in salty perception are the quantity of salt in the product (w/w), the water content as
well as the lipid content. A model consisting of these three variables explained 53.6 % of the
variability.
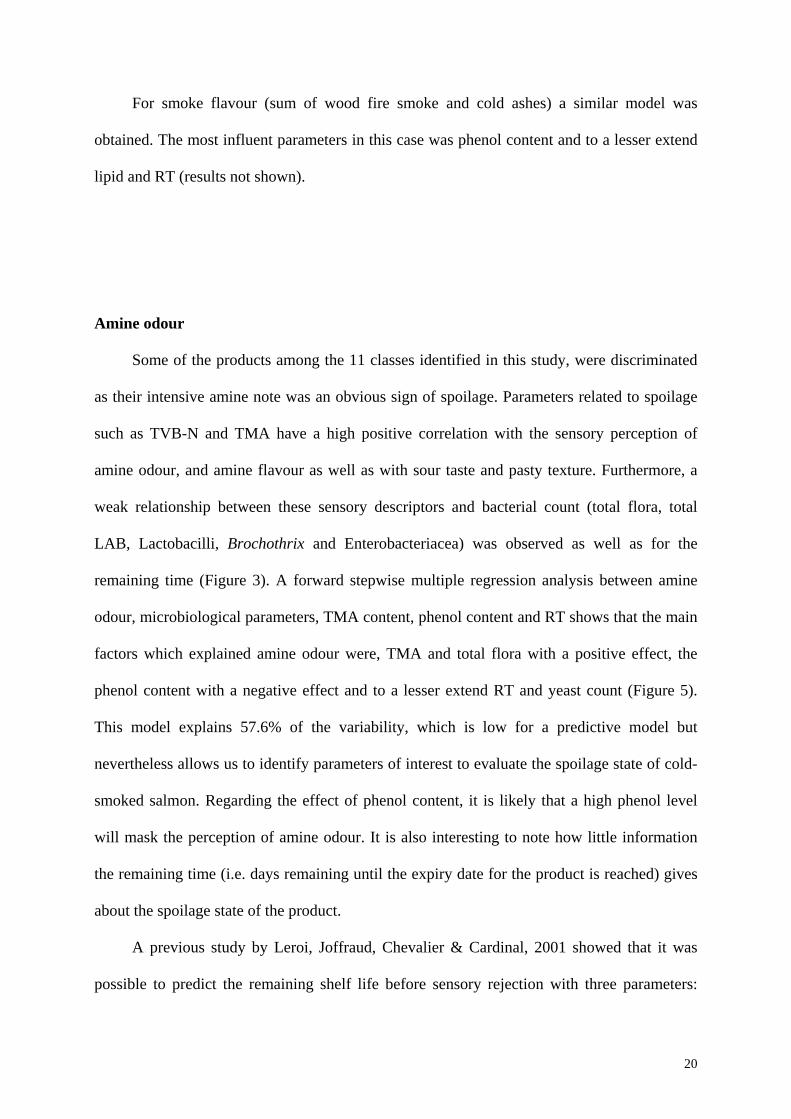
Smoke odour and flavour intensity
Figure 4 shows the relationship between phenol content, global odour and cold ashes
odour. Stepwise multiple regression was applied to identify which parameters among
remaining time (RT), lipid, TVB-N, TMA, salt and phenol content had an effect on the smoke
odour. In order to this the smoke odour was defined as the sum of wood fire note and cold ash
note. Results show statistically significant relationship between smoke odour and phenol
content (at the 99% confidence level) and between smoke odour and TMA concentration and
lipid content (at the 95% confidence level). The equation of the fitted polynomial model
obtained in the experimental conditions is
Smoke odour = 2.77 + 0.06(lipid)g 100g-1 – 0.06(TMA) mg-N 100g
-1 + 2.26 (phenol) mg 100g-1
The R2 of the model is 55.4 % which means that a fairly large part of the smoke odour
variability was not explained by this model, nevertheless the model is significant. Phenol
content has the major influence on smoke odour (R2 = 48.3 %), when TMA concentration was
added to the model, R2 reached 53.6 % and when lipid content was added, 55.4%.
19
For smoke flavour (sum of wood fire smoke and cold ashes) a similar model was
obtained. The most influent parameters in this case was phenol content and to a lesser extend
lipid and RT (results not shown).
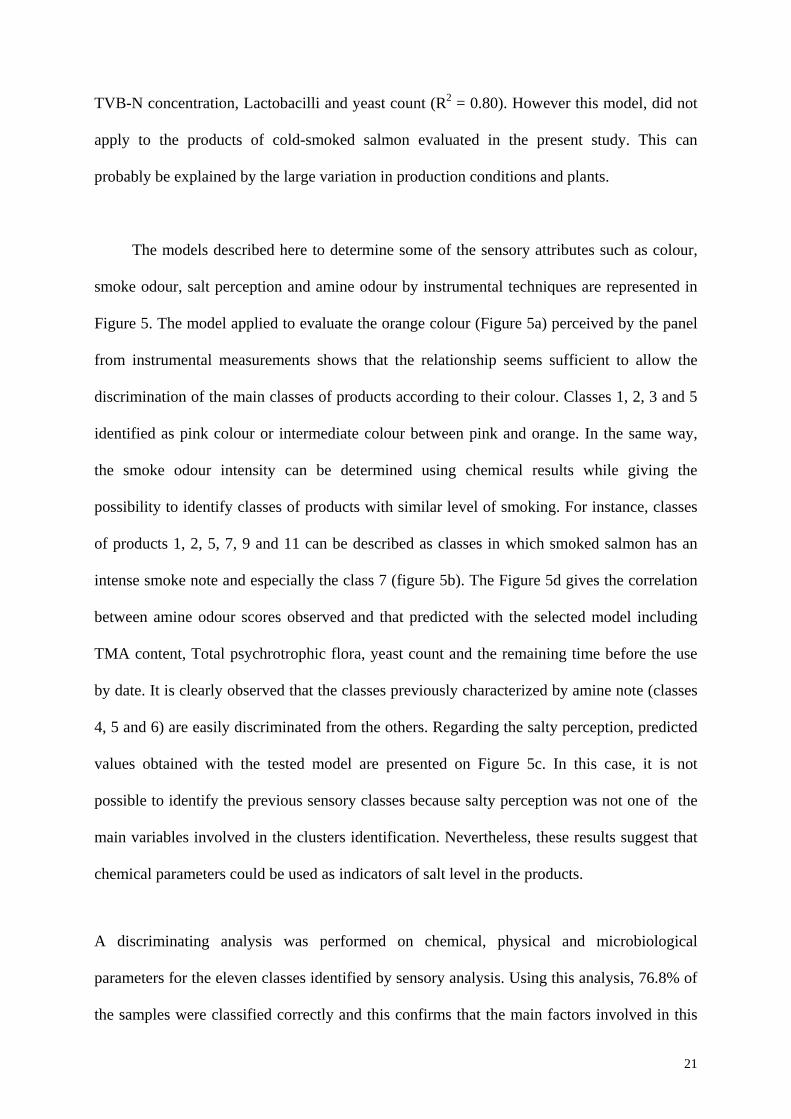
Amine odour
Some of the products among the 11 classes identified in this study, were discriminated
as their intensive amine note was an obvious sign of spoilage. Parameters related to spoilage
such as TVB-N and TMA have a high positive correlation with the sensory perception of
amine odour, and amine flavour as well as with sour taste and pasty texture. Furthermore, a
weak relationship between these sensory descriptors and bacterial count (total flora, total
LAB, Lactobacilli, Brochothrix and Enterobacteriacea) was observed as well as for the
remaining time (Figure 3). A forward stepwise multiple regression analysis between amine
odour, microbiological parameters, TMA content, phenol content and RT shows that the main
factors which explained amine odour were, TMA and total flora with a positive effect, the
phenol content with a negative effect and to a lesser extend RT and yeast count (Figure 5).
This model explains 57.6% of the variability, which is low for a predictive model but
nevertheless allows us to identify parameters of interest to evaluate the spoilage state of cold-
smoked salmon. Regarding the effect of phenol content, it is likely that a high phenol level
will mask the perception of amine odour. It is also interesting to note how little information
the remaining time (i.e. days remaining until the expiry date for the product is reached) gives
about the spoilage state of the product.
A previous study by Leroi, Joffraud, Chevalier & Cardinal, 2001 showed that it was
possible to predict the remaining shelf life before sensory rejection with three parameters:
20
TVB-N concentration, Lactobacilli and yeast count (R2 = 0.80). However this model, did not
apply to the products of cold-smoked salmon evaluated in the present study. This can
probably be explained by the large variation in production conditions and plants.
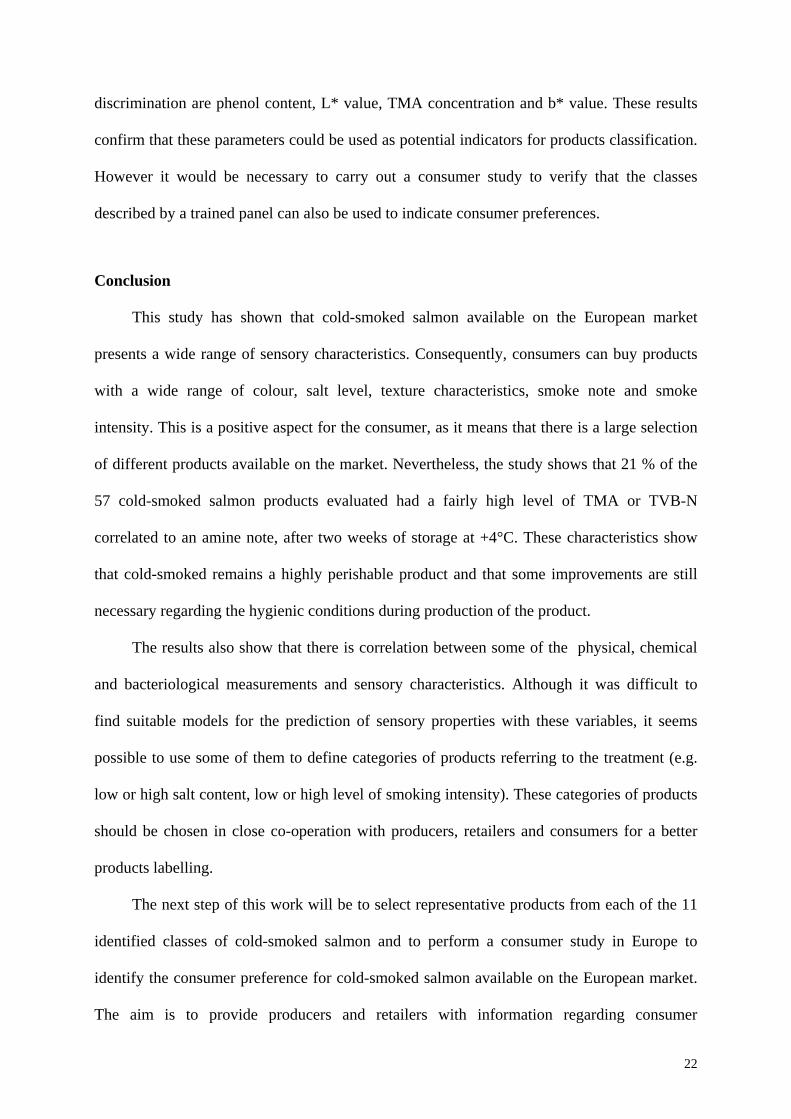
The models described here to determine some of the sensory attributes such as colour,
smoke odour, salt perception and amine odour by instrumental techniques are represented in
Figure 5. The model applied to evaluate the orange colour (Figure 5a) perceived by the panel
from instrumental measurements shows that the relationship seems sufficient to allow the
discrimination of the main classes of products according to their colour. Classes 1, 2, 3 and 5
identified as pink colour or intermediate colour between pink and orange. In the same way,
the smoke odour intensity can be determined using chemical results while giving the
possibility to identify classes of products with similar level of smoking. For instance, classes
of products 1, 2, 5, 7, 9 and 11 can be described as classes in which smoked salmon has an
intense smoke note and especially the class 7 (figure 5b). The Figure 5d gives the correlation
between amine odour scores observed and that predicted with the selected model including
TMA content, Total psychrotrophic flora, yeast count and the remaining time before the use
by date. It is clearly observed that the classes previously characterized by amine note (classes
4, 5 and 6) are easily discriminated from the others. Regarding the salty perception, predicted
values obtained with the tested model are presented on Figure 5c. In this case, it is not
possible to identify the previous sensory classes because salty perception was not one of the
main variables involved in the clusters identification. Nevertheless, these results suggest that
chemical parameters could be used as indicators of salt level in the products.
A discriminating analysis was performed on chemical, physical and microbiological
parameters for the eleven classes identified by sensory analysis. Using this analysis, 76.8% of
the samples were classified correctly and this confirms that the main factors involved in this
21
discrimination are phenol content, L* value, TMA concentration and b* value. These results
confirm that these parameters could be used as potential indicators for products classification.
However it would be necessary to carry out a consumer study to verify that the classes
described by a trained panel can also be used to indicate consumer preferences.
Conclusion
This study has shown that cold-smoked salmon available on the European market
presents a wide range of sensory characteristics. Consequently, consumers can buy products
with a wide range of colour, salt level, texture characteristics, smoke note and smoke
intensity. This is a positive aspect for the consumer, as it means that there is a large selection
of different products available on the market. Nevertheless, the study shows that 21 % of the
57 cold-smoked salmon products evaluated had a fairly high level of TMA or TVB-N
correlated to an amine note, after two weeks of storage at +4°C. These characteristics show
that cold-smoked remains a highly perishable product and that some improvements are still
necessary regarding the hygienic conditions during production of the product.
The results also show that there is correlation between some of the physical, chemical
and bacteriological measurements and sensory characteristics. Although it was difficult to
find suitable models for the prediction of sensory properties with these variables, it seems
possible to use some of them to define categories of products referring to the treatment (e.g.
low or high salt content, low or high level of smoking intensity). These categories of products
should be chosen in close co-operation with producers, retailers and consumers for a better
products labelling.
The next step of this work will be to select representative products from each of the 11
identified classes of cold-smoked salmon and to perform a consumer study in Europe to
identify the consumer preference for cold-smoked salmon available on the European market.
The aim is to provide producers and retailers with information regarding consumer
22
expectation, this will make it possible for them to tailor their production and market of cold-
smoked salmon according to consumer preferences. Furthermore, the aim is to provide more
information to consumer through better labelling on the package so that consumers can select
between the different products available according to their preferences.
Acknowledgements
This research was performed with the financial support of the European Union in the context
of QLK1-2000-01575 project (Improved quality of smoked salmon for the European
consumer). The sampling was possible thanks to the logistic support of ADRIANT, partner of
the project and its sub-contractors ASAP (Gesellschaft für Sensorische Analyse und
Produktentwicklung mbH, Munich), INN (Instituto Nazionale della Nutrizione, Rome),
CCFRA (Campden & Chorleywood Food Research Association), INSTITUT MEURICE
(Laboratory of Sensory Technology and Analysis, Bruxelles)
Authors also thank the trained panel of IFREMER for its long and hard work as well as Cécile
Lafficher, Frédérique Gigout, Josiane Cornet in charge of chemical, bacteriological and
sensory analyses, Randi Kvalvaagnes for colour measurements and Asbjörn Arnarsson for
texture measurements.
23
REFERENCES
Anonymous (2002). Le saumon fumé n’est pas à la fête. 60 millions de consommateurs,
Institut national de la consommation, 367, 48-54.
Andersen, U.B., Stromsnes, A.N., Steinsholt, K., & Thomassen, M.S. (1994). Fillet gaping
in farmed Atlantic salmon (Salmo salar). Norwegian Journal of Agricultural Sciences, 8, 165-
179.
Arzel, J., Lopez, F.X.M., Métailler, R., Stéphan, G.,Viau, M., & Gandemer, G. (1994).
Effect of dietary lipid on growth performance and body composition of brown trout (Salmo
trutta) reared in seawater. Aquaculture, 123, 361-375.
Aursand, M., Bleivik B., Rainuzzo, J. R., Jorgensen L., & Morhr V. (1994). Lipid
distribution and composition of commercially farmed Atlantic salmon (Salmo Salar). Journal
of the Science of Food and Agricultural, 64 (2), 239-248.
Baker, R.T.M., Pfeiffer, A.M., Schöner, F.-J., & Smith-Lemmon, L. (2002). Pigmenting
efficacy of astaxanthin and canthaxanthin in fresh-water reared Atlantic salmon, Salmo salar.
Animal Feed Science and Technology, 99, 97-106.
Beltran A. & Moral A. (1991) The effects of fat contents and storage temperature on the
storage life of smoked sardine fillets (Sardina pilchardus W.) prepared from frozen sardine.
Food Chemistry, 42 (3), 347-356.
Berg, T., Erikson, T., & Nordtvedt, T. S. (1997). Rigor mortis assessment of Atlantic
Salmon and effects on stress. Journal of Food Science, 62(3), 439-446.
Cardinal, M., Berdagué, J. L., Dinel, V., Knockaert, C., & Vallet J. L.(1997). Effet de
différentes techniques de fumage sur la nature des composés volatils et les caractéristiques
sensorielles de la chair de saumon. Science des Aliments, 17, 679-696.
24
Cardinal, M., Knockaert, C., Torrissen, O., Sigurgisladottir, S. Morkore, T., Thomasen, M.,
& Vallet, J. L. (2001). Relation of smoking parameters to the yield, colour and sensory quality
of smoked Atlantic salmon (Salmo salar). Food Research International, 34, 537-550.
Chan, W. S., Toledo, R. T., & Deng, J. (1975). Effect of smokehouse temperature,
humidity and air flow on smoke penetration into fish muscle. Journal of Food Science, 40,
240-243.
Einen, O., Guerin, T., Fjaera, S.O., & Skjervold, P.O. (2002). Freezing of pre-rigor fillets
of Atlantic salmon. Aquaculture, 212, 129-140.
F.A.O. (2000) Statistiques des pêches, 91, p 92.
Gardner, G.A. (1966) A selective medium for enumeration of Microbacterium
thermosphactum in meat and meat products. Journal of Applied Bacteriology, 29, 465-460.
Gormley, T.R. (1992). A note on consumer preference of smoked salmon colour. Irish
Journal of Agricultural and Food Research, 31, 199-202.
Grisdale-Helland, B., Ruyter, B., Rosenlind, G., Obach, A., Helland, S.J., Sandberg, M.G.,
Standal, H., & Rosjo, C. (2002). Influence of high contents of dietary soybean oil on growth,
feed utilization, tissue fatty acid composition, heart histology and standard oxygen
consumption of Atlantic salmon (Salmo salar) raised at two temperatures. Aquaculture, 207,
311-329.
Hillestad, M., Austreng, E., & Johnsen, F. (1995). Product quality in fast growing adult
Atlantic Salmon fed diets differing in fat content. Aquaculture Europe 95, European
Aquaculture Society, Special Publication No. 23, 180-181.
Hunter, RS., & Harold, RW. (1987). The Measurement of Appearance, (2nd Ed). New
York: John Wiley and Sons Inc., 411 p.
25

Indrasena, W.M., Hansen, L.T., & Gill, T.A. (2000). Effect of cold-smoking and drying on
the textural properties of farmed Atlantic salmon (Salmo salar). Journal of Aquatic Food
Product Technology, 9(1), 47-64.
LeBlanc, R.J., & LeBlanc, E.L. (1992). The effect of superchilling with CO2 snow on the
quality of commercially processed cod (Gadus morhua) and winter flounder
(Pseudopleuronectes americanus) fillets. In Huss, H.H., (eds) Quality Assurance in the Fish
Industry (pp.115-124), Elsevier Science Publishers B.V.
Lee, C.M., & Chung, K.H. (1989). Analysis of surimi gel properties by compression and
penetration tests. Journal of Texture Studies, 20, 363-377.
Lie, O., (2001). Flesh quality- The role of nutrition. Aquaculture Research, 32, 341-348.
Leroi, F., Joffraud, J.J., & Chevalier, F. (2000). Effect of salt and smoke on the
microbiological quality of cold-smoked salmon during storage at 5°C as estimated by the
factorial design method. Journal of food protection, 63, (4), 502-508.
Leroi, F., Joffraud, J.J., Chevalier, F., & Cardinal, M. (2001). Research of quality indices
for cold-smoked salmon using a stepwise multiple regression of microbiological counts and
physico-chemical parameters. Journal of Applied Microbiology, 90, 578-587.
Maleysson, F., & Bonneff, E. (2001). Tout va à vau l’eau. Que choisir, 388, 30-34.
NF V-09-105 (1995). Directives générales pour l’implantation de locaux destinés à
l’analyse sensorielle. In Contrôle de la qualité des produits alimentaires - Analyse sensorielle.
AFNOR, Paris .
Nordgarden, U., Hemre, G-I., & Hansen, T. (2002). Growth and body composition of
Atlantic salmon (Salmo salar L.) parr and smolt fed diets varying in protein and lipid
contents. Aquaculture, 207, 65-78.
26
Regost, C., Arzel, J., Cardinal, M., Laroche, M., & Kaushik, S. (2001). Fat deposition and
flesh quality in seawater reared, triploid brown trout (Salmo trutta) as affected by dietary fat
levels and starvation. Aquaculture, 193, 325-345.
Robb, D.H.F., Kestin, S.C., Warriss P.D., & Nute, G.R. (2002). Muscle lipid content
determines the eating quality of smoked and cooked Atlantic salmon (Salmo salar).
Aquaculture, 205, 345-358.
Rora, A. M. B., Kvale, A., Morkore, T., Rorvik, K.-A., Steien S. H., & Thomassen, M.S.
(1998). Process yield, colour and sensory quality of smoked Atlantic Salmon in relation to
raw material characteristics. Food Research International, 31(8), 601-609.
Rora, A. M. B., Regost, C., & Lampe, J. (2003). Liquid holding capacity, texture and fatty
acid profile of smoked fillets of Atlantic salmon fed diets containing fish oil or soybean oil.
Food Research International, 36, 231-239.
Roth, B., Moeller, D., Veland, J.O., Imsland, A., & Slinde, E. (2002). The effect of
stunning methods on rigor mortis and texture properties of Atlantic salmon (Salmo salar).
Journal of Food Science, 67,(4), 1462-1466.
Sérot, T., Régost, C., & Arzel, J. (2002). Identification of odour-active compounds in
muscle of brown trout (Salmo trutta) as affected by dietary lipid sources. Journal of the
Science of Food and Agriculture, 82, 636-643.
Sérot T., Baron R., Knockaert C. & Vallet J.L. (2003). Effect of smoking processes on the
contents of 10 major phenolic compounds in smoked herring fillets (Clupea harengus). Food
Chemistry; 85 (1) 111-120.
Sheehan, E.M., O’Connor, T.P., Sheehy, P.J.A., Buckley, D.J., & FitzGerald, R. (1996).
Effect of dietary fat intake on the quality of raw and smoked salmon. Irish Journal of
Agricultural and Food Research, 35, 37-42.
27
Sheehan, E.M., O’Connor, T.P., Sheehy, P.J.A., Buckley, D.J., & FitzGerald, R. (1998).
Stability of astaxanthin and canthaxanthin in raw and smoked Atlantic salmon (Salmo salar)
during frozen storage. Food Chemistry, 63 (3), 313-317.
Skjervold, P.O., Fjaera, S.O., Ostby, P.B., Isaksson, T., Einen, O., & Taylor, R. (2001).
Properties of salmon flesh from different locations on pre- and post-rigor fillets. Aquaculture,
201, 91-106.
Skjervold, P.O., Fjaera, S.O., Ostby P.B., & Einen, O. (2001). Live-chilling and crowding
stress before slaughter of Atlantic salmon (Salmo salar). Aquaculture, 192, 265-280.
Skjervold, P.O., Rora, A.M.B., Fjaera, S.O., Vegusdal, A., Vorre, A., & Einen, O. (2001).
Effect of pre-, in-, or post-rigor filleting of live chilled Atlantic salmon. Aquaculture, 194,
315-326.
Stone, H., & Sidel, J.L. (1985). Sensory evaluation practices. Academic Press Inc., New
York.
Truelstrup Hansen, L., Gill, T., & Huss, H.H., (1995). Effects of salt and storage
temperature on chemical, microbiological and sensory changes in cold-smoked salmon. Food
Researcch International, 28(2), 123-130.
Turchini, G.M., Menstati, T., Froyland, L., Orban, E., Caprino, F., Moretti, V.M., &
Valfré, F. (2003). Effects of alternative dietary lipid sources on performance, tissue chemical
composition, mitochondrial fatty acid oxidation capabilities and sensory characteristics in
brown trout (Salmo trutta L.). Aquaculture, 225, 251-267.
Vergara, A., Di Pinto, A., Losito, P., & Tantillo, G. (2001). Microbiological and chemical
quality of vacuum-packed smoked salmon up to the declared expiry date. Advances in Food
Sciences, 23, 1, 25-30.
Conway, E.J., Byrne, A., (1933). An absorption apparatus for the micro-determination of
certain volatile substances. Biochemistry Journal, 27, 419-429.
28
Leroi, F., Joffraud, J. J., Chevalier, F., & Cardinal, M. (1998). Study of the microbial
ecology of cold-smoked salmon during storage at 8°C. International Journal of Food
Microbiology, 39, 111-121.
Van Spreekens, K.J.A. (1974). The suitability of a modification of Long and Hammer’s
medium for the enumeration of more fastidious bacteria from fresh fishery products. Antonie
Leeuwenhoek, 25, 213-219.
29
Figure captions
Table 1. Chemical and physical characteristics of 57 vacuum packed cold-salmon analysed 2
and 3 weeks after processing
1 : RT= Remaining Time until the use by date. A positive value indicates that samples have passed the use by
date whereas a negative value shows the number of remaining days.
2 : mean values are given for each group; different letters indicate significant differences (p<0.05). Origin
country of salmon : S-Scottish; I-Ireland; N-Norway; Country of purchase : B-Belgium; D-Denmark; F-France;
G-Germany; I-Italy; UK-United Kingdom
3 : number of analyses for each group
Figure 1. Projection of variables in the plane 1-2 of the principal component analysis on
sensory descriptors
odour: global intensity (Oglo), wood fire (Owoodsm), cold ashes (Ocoldash), bacon (Obacon), tuna (Otuna), raw
salmon (Ofish), herring (Oherr), rancid (Orancid), amine (Oamine), rubber (Orubb); appearance: pink colour
(Apink), orange colour (Aoran), homogeneity of colour (Ahomog); no tearing of the slices (Anotear), translucent
appearance (Atrans), fatty aspect (Afatty), white stripes (Awhstr); flavour: global intensity (Fglo), wood fire
(Fwoodsm), cold ashes (Fcoldash), bacon (Fbacon), raw salmon (Ffish), herring (Fherr), rancid (Francid), salty
taste (Fsalty), sour taste (Fsour), amine (Famine), rubber (Frubb); and texture: firmness (Tfirm), crunchy texture
(Tcrunch), melting texture (Tmelt), fatty texture (Tfatty), pasty texture (Tpasty).
Figure 2. Projection of samples in the plane 1-2 of the principal component analysis on
sensory descriptors and identification of groups of products from hierarchical clustering
analysis
Figure 3. Correlation between chemical, physical, microbiological criteria and component 1
and 2 of the principal component analysis from sensory descriptors
30
odour: global intensity (Oglo), wood fire (Owoodsm), cold ashes (Ocoldash), bacon (Obacon), tuna (Otuna), raw
salmon (Ofish), herring (Oherr), rancid (Orancid), amine (Oamine), rubber (Orubb); appearance: pink colour
(Apink), orange colour (Aoran), homogeneity of colour (Ahomog); no tearing of the slices (Anotear), translucent
appearance (Atrans), fatty aspect (Afatty), white stripes (Awhstr); flavour: global intensity (Fglo), wood fire
(Fwoodsm), cold ashes (Fcoldash), bacon (Fbacon), raw salmon (Ffish), herring (Fherr), rancid (Francid), salty
taste (Fsalty), sour taste (Fsour), amine (Famine), rubber (Frubb); and texture: firmness (Tfirm), crunchy texture
(Tcrunch), melting texture (Tmelt), fatty texture (Tfatty), pasty texture (Tpasty).
Chemical, physical and microbiological parameters are underlined.
Figure 4. Correlation between chemical, physical, microbiological criteria and component 3
and 4 of the principal component analysis from sensory descriptors
Chemical, physical and microbiological parameters are underlined
Table 2. Sensory characteristics of main groups of cold-smoked salmon identified by cluster
analysis
Figure 5 : Correlation between some observed sensory characteristics (a) Orange colour, (b)
Smoke odour, (c) Salty taste, (d) Amine odour and that predicted with a model established on
physical, chemical or microbiological measurements with a forward stepwise multiple
regression procedure
31
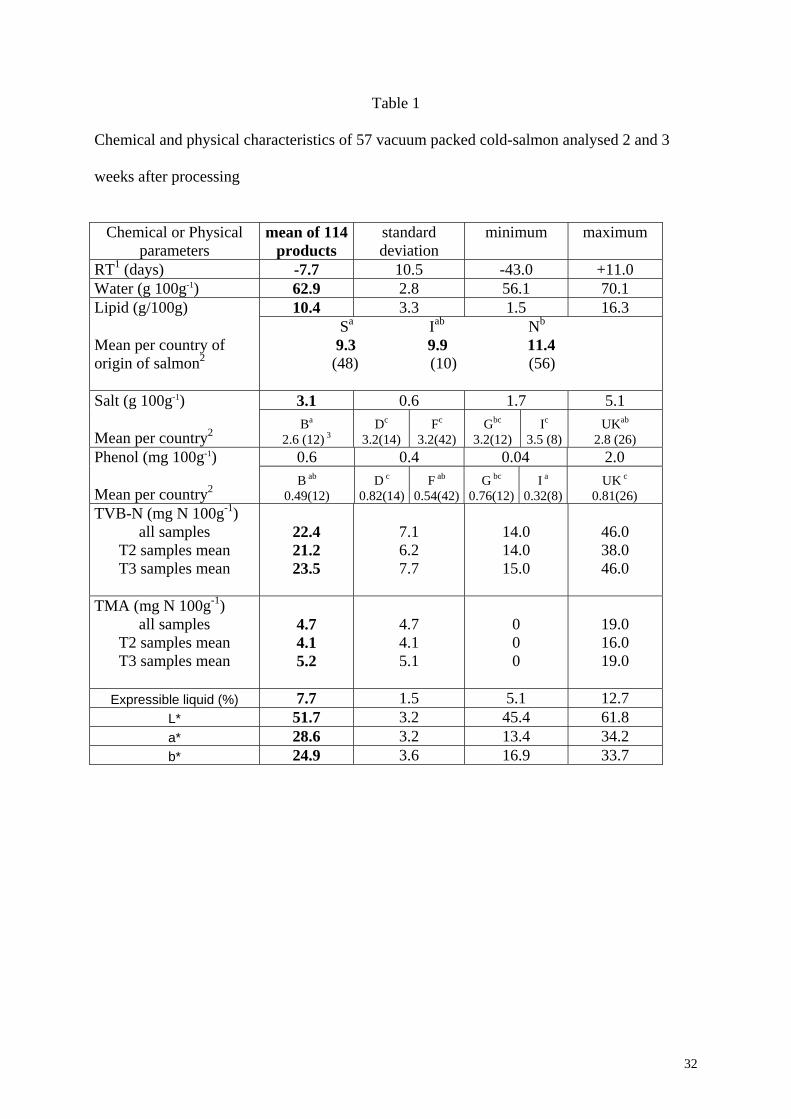
Table 1
Chemical and physical characteristics of 57 vacuum packed cold-salmon analysed 2 and 3
weeks after processing
Chemical or Physical
parameters mean of 114
products standard deviation
minimum maximum
RT1 (days) -7.7 10.5 -43.0 +11.0 Water (g 100g-1) 62.9 2.8 56.1 70.1 Lipid (g/100g) 10.4 3.3 1.5 16.3 Mean per country of origin of salmon2
Sa Iab Nb
9.3 9.9 11.4 (48) (10) (56)
Salt (g 100g-1) 3.1 0.6 1.7 5.1 Mean per country2
Ba
2.6 (12) 3Dc
3.2(14) Fc
3.2(42) Gbc
3.2(12) Ic
3.5 (8) UKab
2.8 (26) Phenol (mg 100g-1) 0.6 0.4 0.04 2.0 Mean per country2
B ab
0.49(12) D c
0.82(14)F ab
0.54(42)G bc
0.76(12)I a
0.32(8) UK c
0.81(26) TVB-N (mg N 100g-1)
all samples T2 samples mean T3 samples mean
22.4 21.2 23.5
7.1 6.2 7.7
14.0 14.0 15.0
46.0 38.0 46.0
TMA (mg N 100g-1)
all samples T2 samples mean T3 samples mean
4.7 4.1 5.2
4.7 4.1 5.1
0 0 0
19.0 16.0 19.0
Expressible liquid (%) 7.7 1.5 5.1 12.7
L* 51.7 3.2 45.4 61.8 a* 28.6 3.2 13.4 34.2 b* 24.9 3.6 16.9 33.7
32

Figure 1
0
Aoran Anotear
Ahomog Tfirm Tcrunch
Ffish Ofish
Oamine Famine
FsourFrancid
OrancidFrubb
Orubb
FwoodsmOwoodsm
Fsalty
OcoldashFcoldash
Fherr
FbaconObaconTmelt
OherrFgloOglo
TfattyOtunaAwhstr Atrans Apink
Tpasty
Component 1 (33.2%)
Component 2 (17.1%)
33
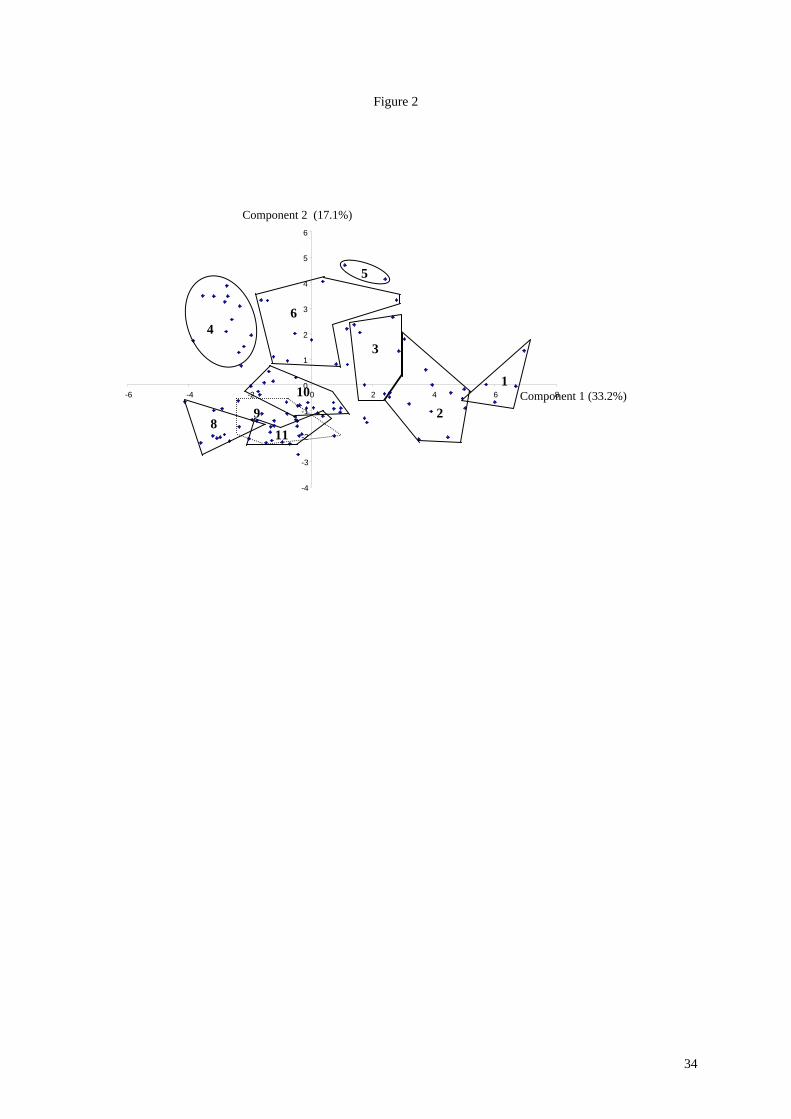
Figure 2
-6
6 Component 2 (17.1%)
-3
-2
-1
0 0
1
2
3
4
5
-4 -2 2 4 6 8 Component 1 (33.2%)
6
11
10 9
8
5
4 3
2
1
-4
34
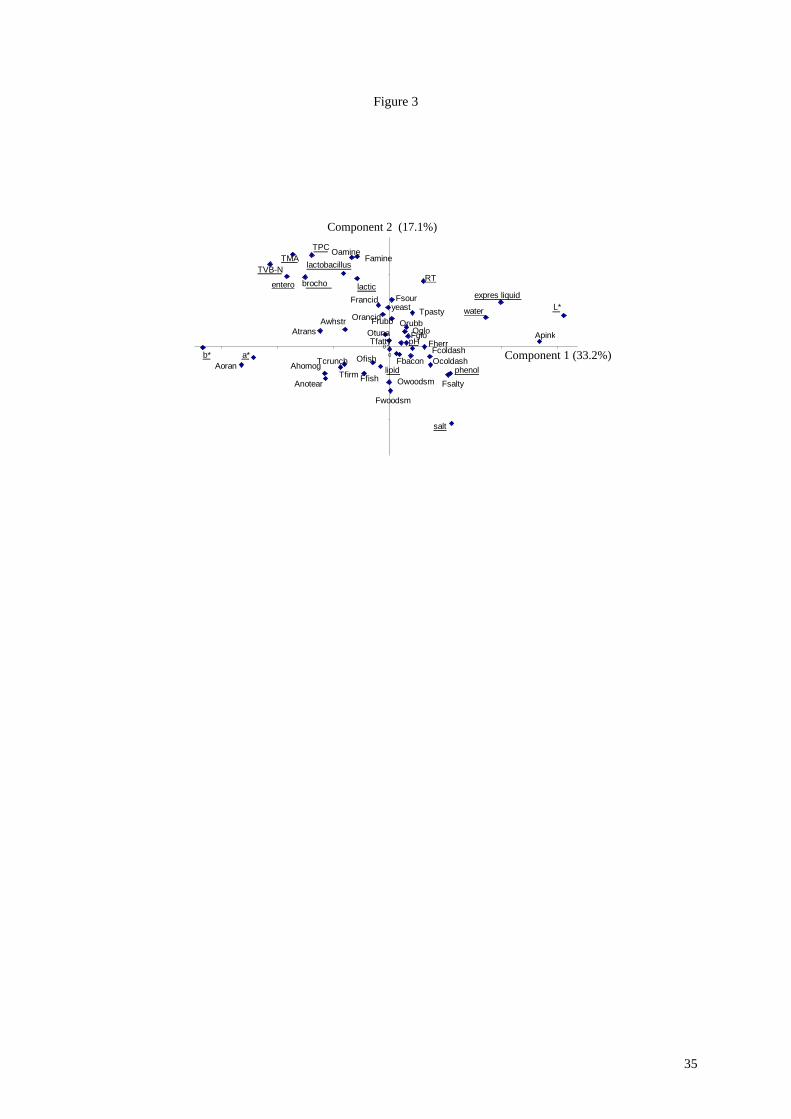
Figure 3
00b*
Aorana*
Anotear Ahomog
TfirmTcrunch
Ffish
Ofishlipid
salt
Fwoodsm
Owoodsm Fsaltyphenol
Ocoldash
Atrans Awhstr
entero TVB-N
TMA TPC
brocho lactic
lactobacillusOamine
Famine
FsourFrancidyeast
OrancidFrubbTpasty water L*
Apink
FcoldashFbacon
Fherr
OrubbOgloFgloOtuna
Tfatty pH
expres liquid
RT
Component 2 (17.1%)
Component 1 (33.2%)
35
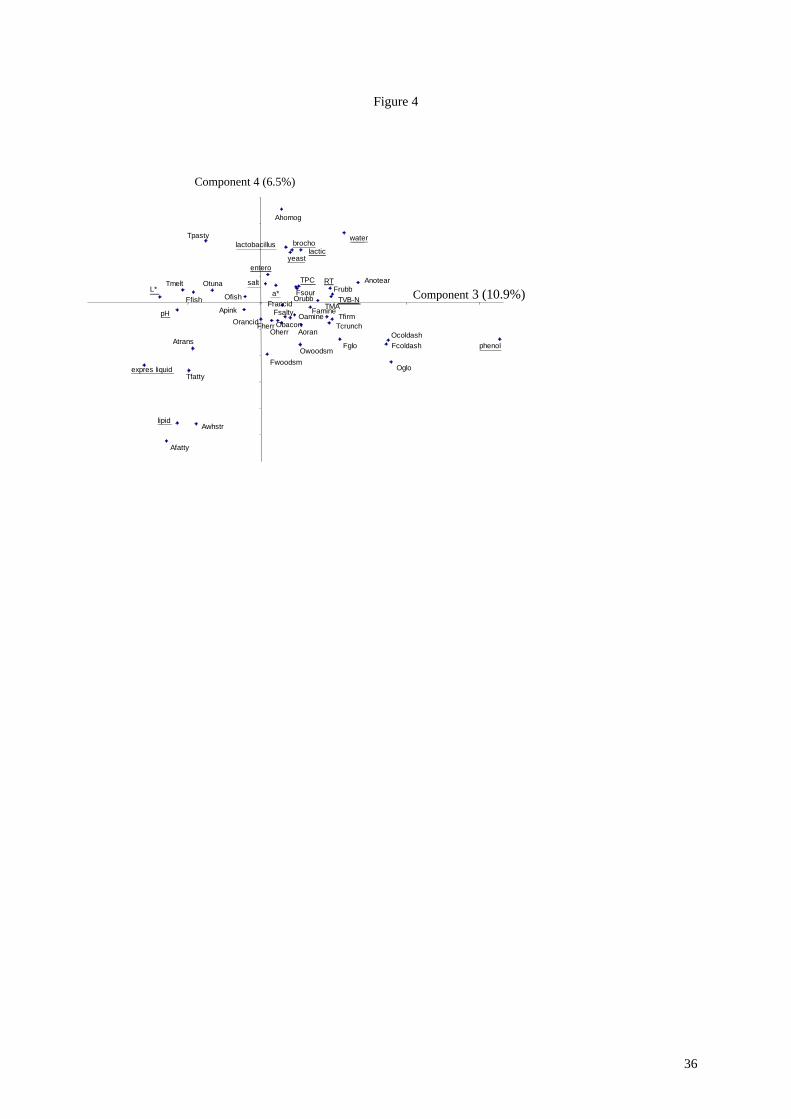
Figure 4
Afatty Awhstr lipid
Tfatty expres liquid Atrans
pH L*
Tmelt Ffish
Otuna
Tpasty Ahomog
water
lactic brocho yeast
lactobacillus
phenol
Oglo
OcoldashFcoldashFglo
Fwoodsm Owoodsm
TcrunchTfirm
TMA
Aoran
AnotearFrubb
TVB-N
entero salt
Ofish
ApinkOrancid
a* TPC
Fsour Orubb
FamineOamine
Francid Fherr
Oherr Obacon Fsalty
RT
Component 4 (6.5%)
Component 3 (10.9%)
36
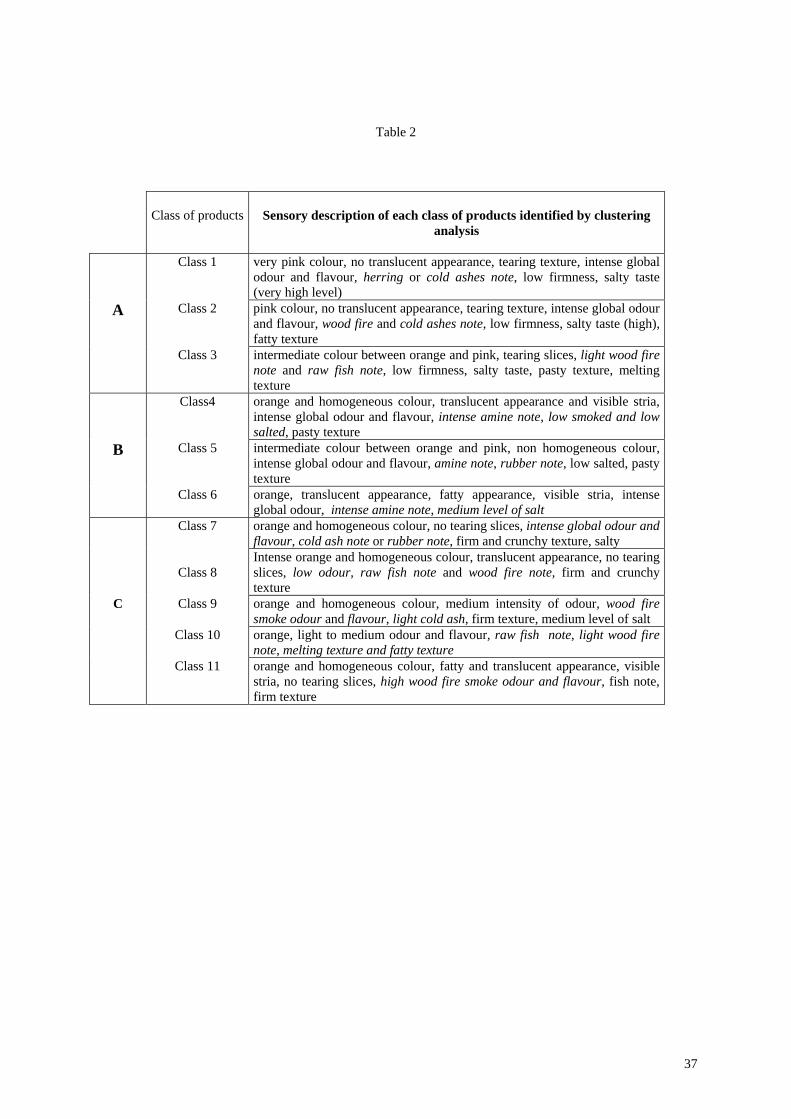
Table 2
Class of products
Sensory description of each class of products identified by clustering
analysis
Class 1 very pink colour, no translucent appearance, tearing texture, intense global odour and flavour, herring or cold ashes note, low firmness, salty taste (very high level)
A Class 2 pink colour, no translucent appearance, tearing texture, intense global odour and flavour, wood fire and cold ashes note, low firmness, salty taste (high), fatty texture
Class 3 intermediate colour between orange and pink, tearing slices, light wood fire note and raw fish note, low firmness, salty taste, pasty texture, melting texture
Class4 orange and homogeneous colour, translucent appearance and visible stria, intense global odour and flavour, intense amine note, low smoked and low salted, pasty texture
B Class 5 intermediate colour between orange and pink, non homogeneous colour, intense global odour and flavour, amine note, rubber note, low salted, pasty texture
Class 6 orange, translucent appearance, fatty appearance, visible stria, intense global odour, intense amine note, medium level of salt
Class 7 orange and homogeneous colour, no tearing slices, intense global odour and flavour, cold ash note or rubber note, firm and crunchy texture, salty
Class 8
Intense orange and homogeneous colour, translucent appearance, no tearing slices, low odour, raw fish note and wood fire note, firm and crunchy texture
C Class 9 orange and homogeneous colour, medium intensity of odour, wood fire smoke odour and flavour, light cold ash, firm texture, medium level of salt
Class 10
orange, light to medium odour and flavour, raw fish note, light wood fire note, melting texture and fatty texture
Class 11 orange and homogeneous colour, fatty and translucent appearance, visible stria, no tearing slices, high wood fire smoke odour and flavour, fish note, firm texture
37
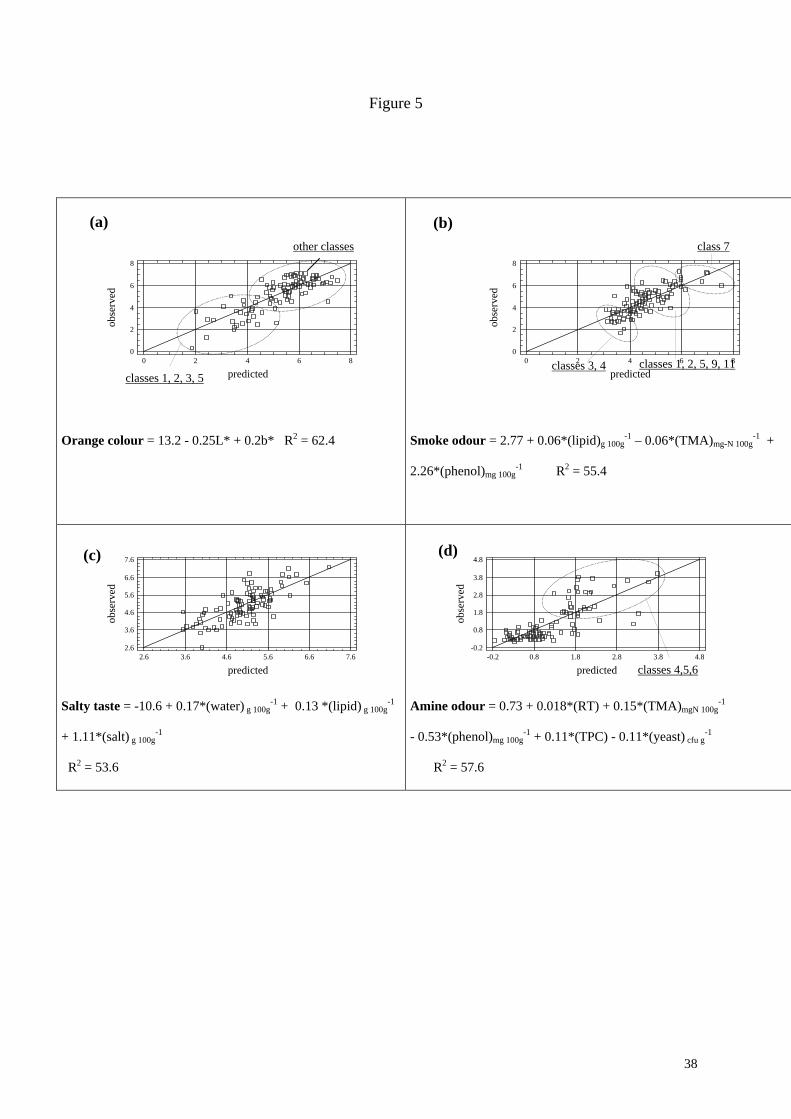
Figure 5
0 2 4 6 8
predicted
0
2
4
6
8
obse
rved
Orange colour = 13.2 - 0.25L* + 0.2b* R2 = 62.4
predicted
obse
rved
0 2 4 6 80
2
4
6
8
Smoke odour = 2.77 + 0.06*(lipid)g 100g-1 – 0.06*(TMA)mg-N 100g
-1 +
2.26*(phenol)mg 100g-1 R2 = 55.4
predicted
obse
rved
2.6 3.6 4.6 5.6 6.6 7.62.6
3.6
4.6
5.6
6.6
7.6
Salty taste = -10.6 + 0.17*(water) g 100g-1 + 0.13 *(lipid) g 100g
-1
+ 1.11*(salt) g 100g-1
R2 = 53.6
predicted
obse
rved
-0.2 0.8 1.8 2.8 3.8 4.8-0.2
0.8
1.8
2.8
3.8
4.8
Amine odour = 0.73 + 0.018*(RT) + 0.15*(TMA)mgN 100g-1
- 0.53*(phenol)mg 100g-1 + 0.11*(TPC) - 0.11*(yeast) cfu g
-1
R2 = 57.6
(a) (b) other classes
classes 3, 4 classes 1, 2, 5, 9, 11
class 7
classes 1, 2, 3, 5
(d) (c)
classes 4,5,6
38