Embed Size (px)
Citation preview
Behavioral/Cognitive
Sensory Gain Outperforms Efficient Readout Mechanisms inPredicting Attention-Related Improvements in Behavior
Sirawaj Itthipuripat,1 Edward F. Ester,2 Sean Deering,2 and John T. Serences1,2
1Neurosciences Graduate Program and 2Department of Psychology, University of California, San Diego, La Jolla, California 92093
Spatial attention has been postulated to facilitate perceptual processing via several different mechanisms. For instance, attention canamplify neural responses in sensory areas (sensory gain), mediate neural variability (noise modulation), or alter the manner in whichsensory signals are selectively read out by postsensory decision mechanisms (efficient readout). Even in the context of simple behavioraltasks, it is unclear how well each of these mechanisms can account for the relationship between attention-modulated changes in behaviorand neural activity because few studies have systematically mapped changes between stimulus intensity, attentional focus, neuralactivity, and behavioral performance. Here, we used a combination of psychophysics, event-related potentials (ERPs), and quantitativemodeling to explicitly link attention-related changes in perceptual sensitivity with changes in the ERP amplitudes recorded from humanobservers. Spatial attention led to a multiplicative increase in the amplitude of an early sensory ERP component (the P1, peaking�80 –130 ms poststimulus) and in the amplitude of the late positive deflection component (peaking �230 –330 ms poststimulus). Asimple model based on signal detection theory demonstrates that these multiplicative gain changes were sufficient to account forattention-related improvements in perceptual sensitivity, without a need to invoke noise modulation. Moreover, combining the observedmultiplicative gain with a postsensory readout mechanism resulted in a significantly poorer description of the observed behavioral data.We conclude that, at least in the context of relatively simple visual discrimination tasks, spatial attention modulates perceptual sensitivityprimarily by modulating the gain of neural responses during early sensory processing
Key words: attention; contrast discrimination; contrast response function; EEG; efficient readout; sensory gain
IntroductionSpatial attention has been postulated to facilitate perceptual sen-sitivity via several mechanisms, including sensory gain (Moranand Desimone, 1985; Motter, 1993; Luck et al., 1997), noise mod-ulation (Mitchell et al., 2007, 2009; Cohen and Maunsell, 2009)and the efficient “readout” of sensory representations (Palmer etal., 2000; Pestilli et al., 2011). However, it is unclear how mucheach of these mechanisms contributes to the relationship be-tween attention-modulated changes in behavior and neuralactivity.
Sensory gain models (Fig. 1A) postulate that attention ampli-fies sensory signals evoked by attended stimuli. In a typical study,
the magnitude of sensory responses is assessed as a function ofstimulus contrast, yielding a contrast response function (CRF).Using this approach, attention has been shown to modulate theCRF in several ways: response gain, contrast gain, or a combina-tion of both (Fig. 1B–D; Reynolds et al., 2000; Martínez-Trujilloand Treue, 2002; Williford and Maunsell, 2006; Buracas and Boy-nton, 2007; Kim et al., 2007; Murray, 2008; Lauritzen et al., 2010;Lee and Maunsell, 2010; Itthipuripat et al., 2014). The relation-ship between attention-related CRF and behavioral changes canthen be assessed using simple linking hypotheses. For example,signal detection theory predicts that increasing the slope of CRFs,which would happen with multiplicative gain, should amplify thedifferential response evoked by stimuli rendered at slightly differ-ent contrast levels and lead to better discriminability (Fig. 1A).Similarly, regardless of the nature of gain modulations, a reduc-tion in the trial-to-trial variability of neural responses should alsolead to better discriminability (Fig. 1E).
In contrast to sensory gain and noise modulation accounts, arecent fMRI study reported that linking modulations of the fMRIresponse to behavior required an efficient readout mechanismthat adaptively amplified the differential response evoked by tar-get and nontarget stimuli (Fig. 1F). However, the generality ofthese findings is unclear as fMRI measures of attentional modu-lation are largely independent of stimulus intensity (Buracas andBoynton, 2007; Murray, 2008), and may be strongly influencedby the magnitude of top-down input to a region as opposed tochanges in local spiking activity (Logothetis and Wandell, 2004).
Received June 4, 2014; revised Aug. 3, 2014; accepted Aug. 24, 2014.Author contributions: S.I. and J.T.S. designed research; S.I., S.D., and J.S. performed research; S.I. and J.T.S.
contributed unpublished reagents/analytic tools; S.I., E.F.E., and S.D. analyzed data; S.I., E.F.E., S.D., and J.T.S. wrotethe paper.
This work was supported by National Institutes of Health Grant R01-MH092345 to J.T.S., by a James S. McDonnellFoundation grant to J.T.S, and by an Howard Hughes Medical Institute international student fellowship to S.I. Wethank Suzanna K. Wong and Ivan Macias for help with data collection; Javier Garcia and Franco Pestilli for technicalsupport; and Steven Hillyard, Franco Pestilli, Justin Gardner, Thomas C. Sprague, and Anna Byers for usefuldiscussions.
The authors declare no competing financial interests.Correspondence should be addressed to either of the following: Sirawaj Itthipuripat, Neuroscience
Graduate Program, University of California, San Diego, 9500 Gilman Dr., La Jolla, CA 92093.E-mail: [email protected]; or John Serences, Department of Psychology and NeuroscienceGraduate Program, University of California, San Diego, 9500 Gilman Dr., La Jolla, CA 92093.E-mail: [email protected].
DOI:10.1523/JNEUROSCI.2277-14.2014Copyright © 2014 the authors 0270-6474/14/3313384-15$15.00/0
13384 • The Journal of Neuroscience, October 1, 2014 • 34(40):13384 –13398
Here, we quantitatively linked attention-related changes incontrast discrimination thresholds with changes in neural activ-ity measured using electroencephalography (EEG). We focus onattention-related changes in the amplitude of two event-relatedpotentials (ERPs): the P1, an early component thought to reflectsensory processing in early visual cortex (Van Voorhis and Hilly-ard, 1977; Woldorff et al., 1997), and the late positive deflection(LPD) component, which is thought to reflect decision-relatedprocessing (Hillyard et al., 1971; Squires et al., 1973, 1975a,1975b). Consistent with sensory gain models, we found that in-creases in the amplitude of the P1 and LPD components weresufficient to explain attention-induced changes in psychophysi-cal contrast discrimination thresholds, without a need to invokenoise modulation. In contrast, models that incorporated an effi-cient readout mechanism did not accurately capture the link be-tween ERP modulations and behavior. The results suggest that, atleast in relatively simple visual discrimination tasks, attention-related improvements in perceptual sensitivity are more closelylinked to sensory gain.
Materials and MethodsSubjects. Seventeen neurologically healthy human observers (18 –31years old, nine females, two left-handed) with normal or corrected-to-normal vision were recruited from the University of California, San Di-ego (UCSD). All participants provided written informed consent asrequired by the local institutional review board at UCSD. All participantsfirst underwent a 2.5 h behavioral training session where contrast dis-crimination thresholds were estimated using a staircase procedure (seebelow). Next, each subject participated in multiple sessions of the mainEEG experiment (4 – 6 d over a period of 2–3 weeks). Each EEG sessionlasted �3.5– 4 h, including EEG preparation, data acquisition, andbreaks. Data from one subject were discarded due to a failure to completethe experimental protocol (the subject withdrew after the second EEG ses-sion). Of the remaining 16 subjects, two subjects completed six EEG sessions(126 blocks, 7056 trials) and the rest completed four EEG sessions (84 blocks,4704 trials).
Stimuli and task. Stimuli were presented on a PC running Windows XPusing Matlab (Mathworks) and the Psychophysics Toolbox (version3.0.8; Brainard, 1997; Pelli, 1997). Participants were seated 60 cm fromthe CRT monitor (which had a gray background of 34.51 cd/m 2, 85 Hzrefresh rate) in a sound-attenuated and electromagnetically shieldedroom (ETS-Lindgren).
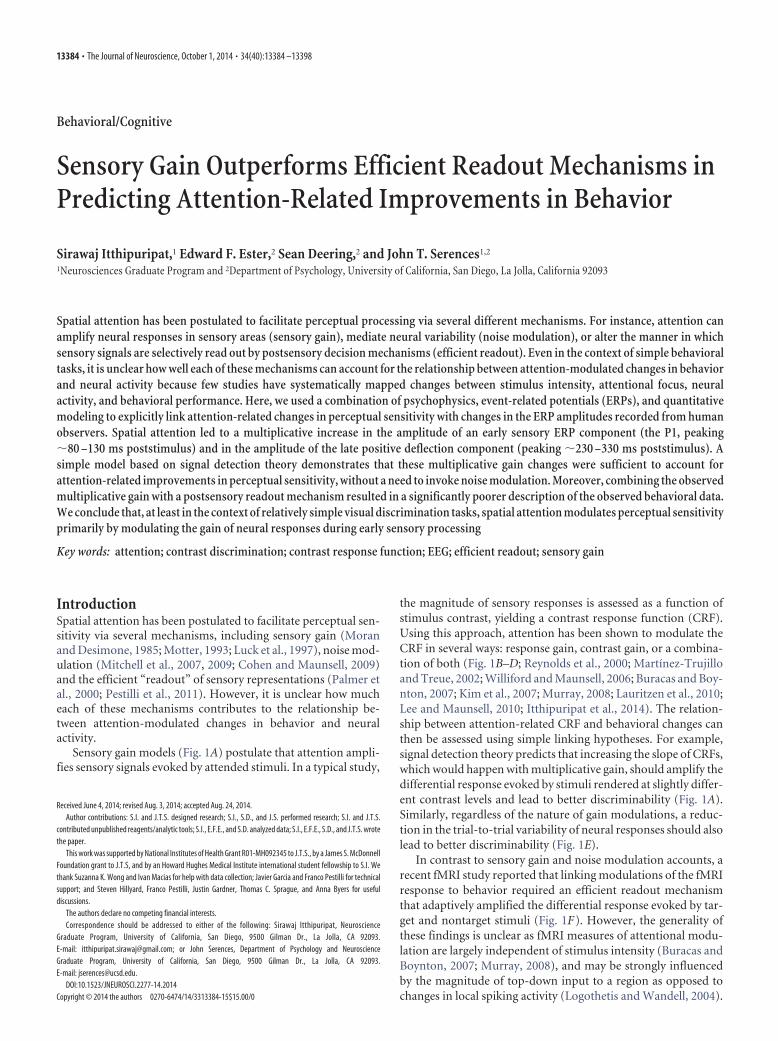
Participants performed a two-interval forced-choice contrast discrim-ination task (Fig. 2) similar to a procedure described by Pestilli et al.(2011). Each trial started with a red, green, or blue cue that instructed thesubject to either covertly attend to the lower left or the lower right quad-rant, or to attend to both quadrants. The relationship between cue colorand attention condition was counterbalanced across participants. Trialsin which the subject attended to either the left or the right quadrant weretermed focused-attention trials, and trials in which the subject attendedto both quadrants were termed divided-attention trials. The precue was100% valid for the focused-attention trials, whereas the target was equallylikely to appear in the left or right hemifield on divided-attention trials.The attention cue was presented for 500 ms and followed by a 400 – 600ms blank interstimulus-interval (ISI). This ISI was followed by two suc-
C
C
CR
R
Sensory Gainno
rmal
ized
res
pons
e
stimulus contrast
Efficient Read-out
C
C
C
C
Cstimulus contrast
norm
aliz
ed r
espo
nse
Max PoolingR R
focused target divided non-target
focused target divided targetdivided non-targetfocused non-target
A
F
C
C
C
RR
Noise Modulation
norm
aliz
ed r
espo
nse
stimulus contrast
focused target divided non-target
E
Rmax
C50
b
B Response Gain C Contrast Gain D Additive Shift
attendedignoredstimulus contrast
res
pons
e
Figure 1. Competing theories of selective spatial attention. A, The sensory gain model pre-dicts that focused spatial attention amplifies neural responses evoked by visual stimuli of dif-fering contrasts. According to the sensory gain model, increasing the slope of neural CRFs withattention will result in a reduction of the contrast increment (�C) that is required in thefocused-attention condition, compared with the divided-attention condition. Importantly, thismodel makes an explicit assumption that neural gain in early sensory areas is sufficient toaccount for attention-related improvements in perceptual performance. B–D, Note that manypast studies have reported that spatial attention leads to a variety of gain patterns in the neuralCRF: a multiplicative response gain (B), a contrast gain (C), or an additive baseline shift (D). Notethat we use the term additive shift instead of additive gain here since gain is multiplicative bydefinition. E, The noise modulation model predicts that focused spatial attention reduces trial-by-trial variability of neuronal responses and/or decreases correlated noises across neuronalpopulations. Under this scenario, if sensory gain modulations are insufficient to explain changesin psychophysical thresholds, changes in the noise parameter could be estimated to account for
4
the observed behavioral changes. F, The efficient readout model argues that attention does notstrongly modulate responses in early sensory areas and neither sensory gain nor noise modu-lation could sufficiently account for attention-induced improvements in behavioral perfor-mance. Instead, attentional modulation is driven primarily by the efficient selection or readoutof sensory signals in a manner that preferentially weights informative as opposed to noninfor-mative sensory signals (Eq. 10, a max-pooling rule). In brief, the model will preferentiallyweight the stimulus that evokes a relatively large response compared with a stimulus thatevokes a relatively small response, and consequently the stimulus evoking the larger responsewill increasingly influence downstream decision mechanisms.
Itthipuripat et al. • Sensory Gain Versus Efficient Readout J. Neurosci., October 1, 2014 • 34(40):13384 –13398 • 13385
cessive stimulus presentations, with each presentation consisting of twosinusoidal Gabor patches (spatial frequency, 1.04 cycles/°; SD of a Gauss-ian window, 1.90°) located in the lower left and right quadrants (�8.58and �7.63° from the horizontal and vertical meridians, respectively).Each stimulus pair was presented for 300 ms, followed by a 600 – 800 msISI. The pedestal contrasts of the two Gabor patches in each interval wererandomly selected from seven possible values (0, 2.04, 4.26, 8.90, 18.61,38.90, and 81.13% Michelson contrast). The stimulus contrast at eachpedestal contrast level, except for the 0% contrast value, was jittered�0.01 log contrast from the mean contrast value. For each trial, theorientations of the left and right Gabor stimuli were yoked and the ori-entation value was randomly drawn from a uniform distribution. Duringone of the two stimulus intervals, a small contrast increment (�c) wasadded to one of the Gabors for the entire interval. After the offset of thesecond stimulus array, a postcue appeared to inform subjects which ofthe two stimuli contained this increment, and subjects reported whetherthe increment occurred during the first or second stimulus interval. Par-ticipants were instructed to prioritize accuracy, and no response deadlinewas imposed.
Each EEG session contained a total of 21 experimental blocks, whichwere broken up into three minisessions consisting of seven blocks each.Each minisession contained 392 trials across which all experimental con-ditions were counterbalanced—i.e., 2 (attention cues: focused, di-vided) � 2 (target locations: left, right) � 2 (target intervals: first,second) � 7 (pedestal contrast levels of target) � 7 (pedestal contrastlevels of nontarget). Critically, �c for each target pedestal contrast andeach attention condition were adjusted after each minisession so thataccuracy was maintained at 76% across all experimental conditions. Notethat the contrast thresholds used in the first EEG minisession were ob-tained from the thresholds initially estimated in the 2.5 h behavioraltraining session using a staircase procedure that was applied indepen-
dently for each attention condition and each pedestal contrast level. Spe-cifically, three successive correct responses led to a 0.5% decrease in the�c that defined the target stimulus, while one incorrect response led to a0.5% increase in �c. Trials from the first five reversals were excluded andthe mean values of the contrast increments from remaining trials wereused as contrast discrimination thresholds in the first EEG minisession.
Psychophysical analysis. To examine relationships between stimuluscontrast and attention condition (i.e., focused vs distributed) we gener-ated a set of threshold-versus-contrast (TvC) functions by plotting �c asa function of pedestal contrast separately for each attention condition.We focused on data from the first six pedestal contrasts (0 –38.90%) as wecould not obtain stable �c estimates at the highest pedestal contrast, dueto scaling factors (i.e., the maximum contrast cannot be increased be-yond 100%, so �c was too small at the highest pedestal value).
Following previous studies (Nachmias and Sansbury, 1974; Legge andFoley, 1980; Ross et al., 1993; Boynton et al., 1999; Gorea and Sagi, 2001;Huang and Dobkins, 2005; Pestilli et al., 2011), we assumed that percep-tual sensitivity (indexed via d�) is limited by the differential neural re-sponse amplitude [R(c � �c) � R(c), or �R] divided by the magnitude ofsensory noise (�), as expressed in the following equation (Eq. 1):
d� ��R
��
Rc � �cc � Rc
�
where R is a hypothetical CRF that was estimated using the followingNaka-Rushton equation (Eq. 2) (Geisler and Albrecht, 1997; Reynolds etal., 2000; Pestilli et al., 2011):
Rc � Gr
cs�q
cq � Gcq � b
Here, Gr is a multiplicative response gain factor that determines thehighest response amplitude of the CRF, Gc is a contrast gain factor thatdetermines the horizontal position of the CRF, b is the baseline offset at0% contrast, and s and q are exponents controlling how quickly the CRFrises and reaches an asymptote. Since Gr, �R, and � are codependent (i.e.,they all control the vertical shift of the TvC), we set �R and � to 1. We alsoset b to zero since changing b would not affect the shape of the TvC. Withthe combination of the d� (Eq. 1) and Naka-Rushton (Eq. 2) equations,the contrast discrimination thresholds can be estimated based on thederivative (i.e., slope) of the hypothetical underlying CRF, as expressed inthe following equation (Eq. 3):
�c ��R
dR/dc
where dR/dc is the derivative of the underlying CRF (Boynton et al.,1999).
We fit the TvC functions with Equations 1–3 with Matlab’s fminsearchfunction (Nelder–Mead method; nonlinear least squares) to estimate amultiplicative response gain factor (Gr), a contrast gain factor (Gc), andtwo exponents (s and q) that describe the hypothetical CRF that bestaccounts for the observed TvC functions derived from the focused-attention and divided-attention conditions in each subject. Paired t testswere performed to examine the effects of focused and divided attentionon the Gr, Gc, s, and q parameters. Note that this analysis attempts torecover the shape of the hypothetical CRF that best explains attention-related changes in contrast discrimination thresholds under the assump-tion that the behavioral data can be predicted by the differential responseevoked by target and pedestal stimuli divided by the variability of re-sponses at each pedestal level (and that variability is constant across allresponse levels).
EEG recording. EEG data were recorded with a 64 � 8-channel BiosemiActiveTwo system (Biosemi Instrumentation) at a sampling rate of 512Hz. The 64 channels were equally spaced across the EEG cap and coveredthe whole head from above the eyebrows to slightly below the inion. Tworeference electrodes were placed at the mastoids. Vertical eye movementsand blinks were monitored via four extra electrodes placed below andabove the eyes. Horizontal eye movements were detected by another pairof electrodes, placed near the outer canthi of the eyes. Electrode imped-
Foc
used
Atte
ntio
nD
ivid
ed A
ttent
ion
Attention cue
500ms + 400-600ms blank
300ms + 600-800ms blank
300ms + 600-800ms blank
until responseemphasize accuracy
Stimulus 1 Stimulus 2 Target cue
time
Figure 2. Experimental design. The two-interval forced-choice contrast discrimination task.Each trial started with an attention cue (a color cue, first column) instructing subjects to covertlyattend to the lower left (a red cue) or right (a blue cue) quadrant (focused-attention conditions),or to both quadrants (a green cue, divided-attention condition). The white dotted rings in thesecond and third columns represent the spatial positions of the stimuli that the subjects weresupposed to attend to (although they were not shown in the actual display). The attention cuewas followed by two successive stimulus presentations, each consisting of two sinusoidal Gaborpatches located in the lower left and right quadrants. The pedestal contrasts for each of theGabor patches were randomly chosen from seven possible values (0 – 81.13% Michelson con-trast). During one of the two stimulus intervals, a Gabor patch (either left or right) had a contrastincrement (�c) added to its pedestal contrast. After the second stimulus interval, a target cueappeared, informing subjects of the exact location of the target stimulus. Subjects reportedwhether the first or second stimulus presentation contained the target stimulus of highercontrast.
13386 • J. Neurosci., October 1, 2014 • 34(40):13384 –13398 Itthipuripat et al. • Sensory Gain Versus Efficient Readout
ances were kept �20 k�, which is standard for this active-electrodesystem.
EEG preprocessing and analysis. The EEG data were preprocessed usinga combination of EEGlab11.0.3.1b (Delorme and Makeig, 2004) andcustom Matlab scripts. The continuous EEG data were first rereferencedto the algebraic mean of the two mastoid electrodes and then filtered byapplying 0.25 Hz high-pass and 55 Hz low-pass Butterworth filters (thirdorder). The data were then segmented into epochs extending from 195ms before to 3437 ms after the trial onset (i.e., the attention cue onset).Artifact rejection was performed off-line by discarding epochs contami-nated by eye blinks and vertical eye movements ( �80 –150 �V devia-tion from zero; exact thresholds were determined on a subject-by-subjectbasis due to differences in amplitudes of eye blink and vertical eye move-ment artifacts), horizontal eye movements ( �75 �V deviation fromzero), excessive muscle activity, or drifts using threshold rejection andvisual inspection on trial-by-trial basis, which resulted in the removal of17.46% (SD, 6.44%) of trials across all subjects.
Next, the artifact-free data were time-locked to the onset of the firstand second stimulus presentations and the algebraic mean of the pre-stimulus baseline (�100 – 0 ms preceding stimulus onset) was subtractedfrom each epoch. The data were then sorted into 112 different bins: 2(attention conditions: focused, divided) � 2 (stimulus intervals: first,second) � 2 (types of the stimulus of interest: target, nontarget) � 2(locations of the stimulus of interest: left, right) � 7 (pedestal contrastlevels). We arranged the electrode labels so that the electrodes that werecontralateral and ipsilateral to the stimulus of interest were on the rightand left hemispheres of the head model, respectively. Accordingly, wecollapsed trials across target position and averaged all epoched EEG data
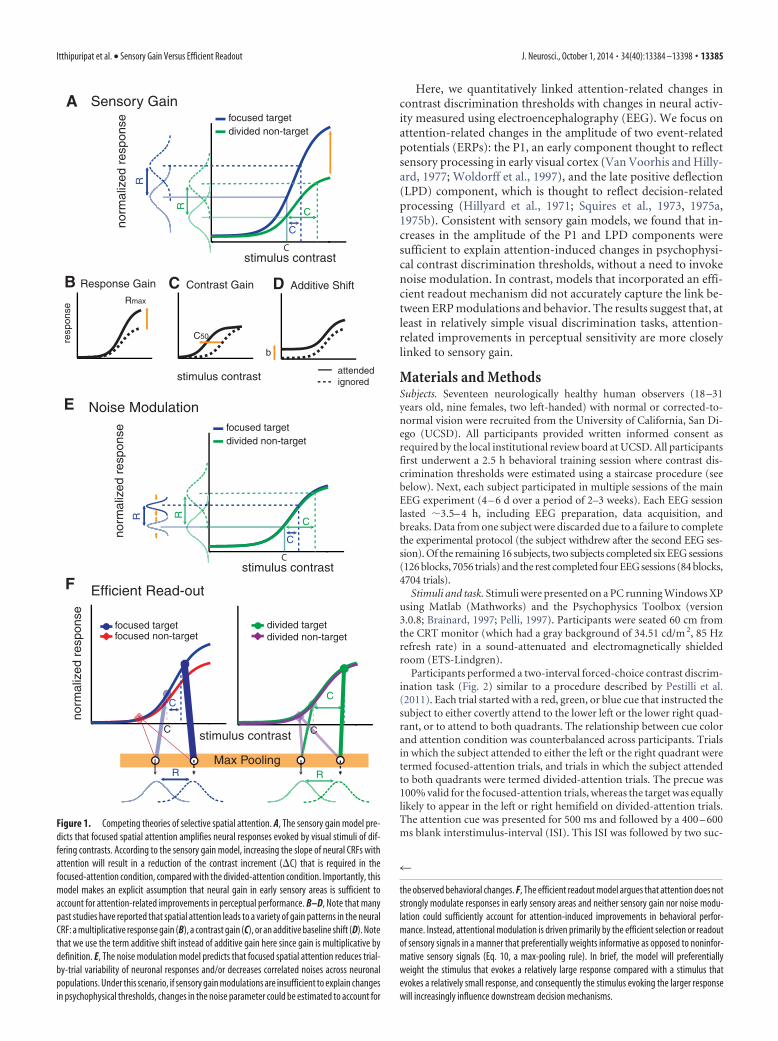
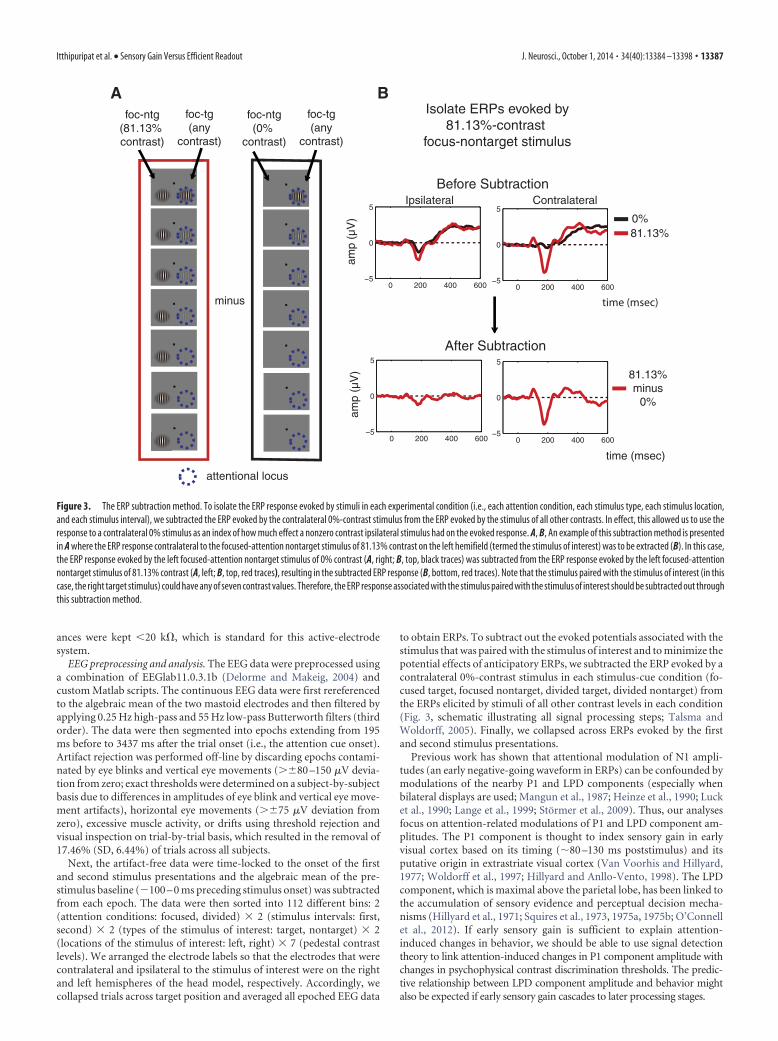
to obtain ERPs. To subtract out the evoked potentials associated with thestimulus that was paired with the stimulus of interest and to minimize thepotential effects of anticipatory ERPs, we subtracted the ERP evoked by acontralateral 0%-contrast stimulus in each stimulus-cue condition (fo-cused target, focused nontarget, divided target, divided nontarget) fromthe ERPs elicited by stimuli of all other contrast levels in each condition(Fig. 3, schematic illustrating all signal processing steps; Talsma andWoldorff, 2005). Finally, we collapsed across ERPs evoked by the firstand second stimulus presentations.
Previous work has shown that attentional modulation of N1 ampli-tudes (an early negative-going waveform in ERPs) can be confounded bymodulations of the nearby P1 and LPD components (especially whenbilateral displays are used; Mangun et al., 1987; Heinze et al., 1990; Lucket al., 1990; Lange et al., 1999; Stormer et al., 2009). Thus, our analysesfocus on attention-related modulations of P1 and LPD component am-plitudes. The P1 component is thought to index sensory gain in earlyvisual cortex based on its timing (�80 –130 ms poststimulus) and itsputative origin in extrastriate visual cortex (Van Voorhis and Hillyard,1977; Woldorff et al., 1997; Hillyard and Anllo-Vento, 1998). The LPDcomponent, which is maximal above the parietal lobe, has been linked tothe accumulation of sensory evidence and perceptual decision mecha-nisms (Hillyard et al., 1971; Squires et al., 1973, 1975a, 1975b; O’Connellet al., 2012). If early sensory gain is sufficient to explain attention-induced changes in behavior, we should be able to use signal detectiontheory to link attention-induced changes in P1 component amplitude withchanges in psychophysical contrast discrimination thresholds. The predic-tive relationship between LPD component amplitude and behavior mightalso be expected if early sensory gain cascades to later processing stages.
0 200 400 600−5
0
5
0 200 400 600−5
0
5
0 200 400 600−5
0
5
0 200 400 600−5
0
5
minus
Isolate ERPs evoked by81.13%-contrast
focus-nontarget stimulus
foc-ntg(81.13% contrast)
foc-tg(any
contrast)
foc-ntg(0%
contrast)
foc-tg(any
contrast)
Ipsilateral ContralateralBefore Subtraction
After Subtraction
attentional locus
0%81.13%
81.13%minus
0%
time (msec)
amp
(µV
)am
p (µ
V)
time (msec)
A B
Figure 3. The ERP subtraction method. To isolate the ERP response evoked by stimuli in each experimental condition (i.e., each attention condition, each stimulus type, each stimulus location,and each stimulus interval), we subtracted the ERP evoked by the contralateral 0%-contrast stimulus from the ERP evoked by the stimulus of all other contrasts. In effect, this allowed us to use theresponse to a contralateral 0% stimulus as an index of how much effect a nonzero contrast ipsilateral stimulus had on the evoked response. A, B, An example of this subtraction method is presentedin A where the ERP response contralateral to the focused-attention nontarget stimulus of 81.13% contrast on the left hemifield (termed the stimulus of interest) was to be extracted (B). In this case,the ERP response evoked by the left focused-attention nontarget stimulus of 0% contrast (A, right; B, top, black traces) was subtracted from the ERP response evoked by the left focused-attentionnontarget stimulus of 81.13% contrast (A, left; B, top, red traces), resulting in the subtracted ERP response (B, bottom, red traces). Note that the stimulus paired with the stimulus of interest (in thiscase, the right target stimulus) could have any of seven contrast values. Therefore, the ERP response associated with the stimulus paired with the stimulus of interest should be subtracted out throughthis subtraction method.
Itthipuripat et al. • Sensory Gain Versus Efficient Readout J. Neurosci., October 1, 2014 • 34(40):13384 –13398 • 13387
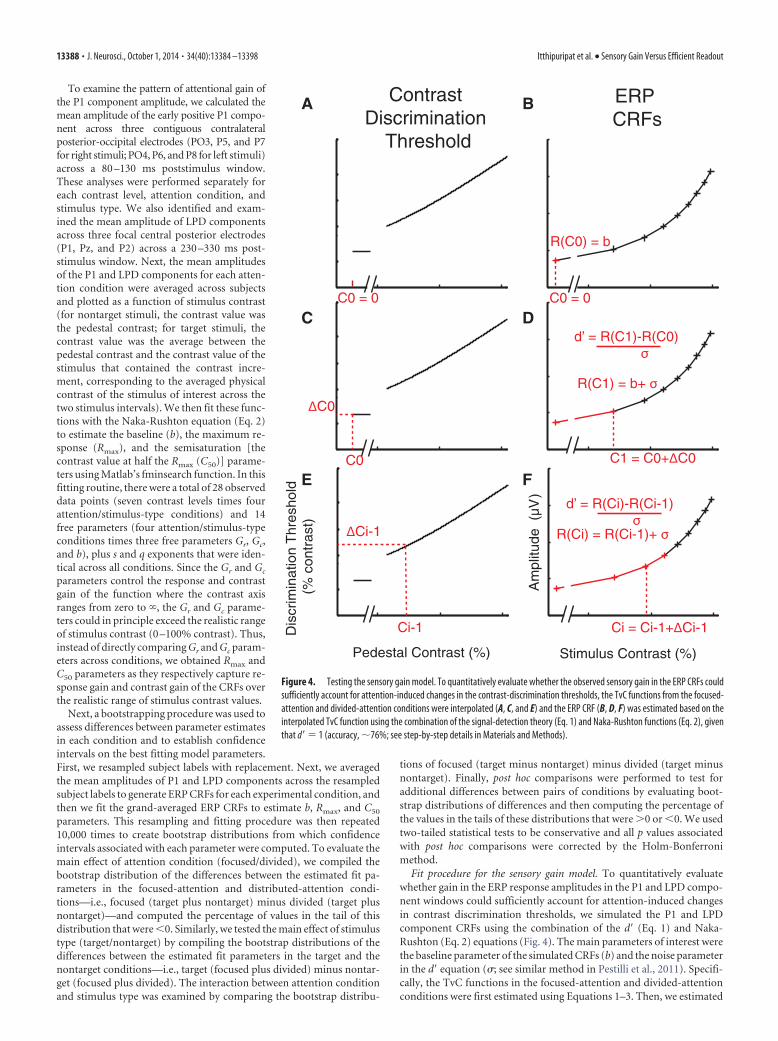
To examine the pattern of attentional gain ofthe P1 component amplitude, we calculated themean amplitude of the early positive P1 compo-nent across three contiguous contralateralposterior-occipital electrodes (PO3, P5, and P7for right stimuli; PO4, P6, and P8 for left stimuli)across a 80 –130 ms poststimulus window.These analyses were performed separately foreach contrast level, attention condition, andstimulus type. We also identified and exam-ined the mean amplitude of LPD componentsacross three focal central posterior electrodes(P1, Pz, and P2) across a 230 –330 ms post-stimulus window. Next, the mean amplitudesof the P1 and LPD components for each atten-tion condition were averaged across subjectsand plotted as a function of stimulus contrast(for nontarget stimuli, the contrast value wasthe pedestal contrast; for target stimuli, thecontrast value was the average between thepedestal contrast and the contrast value of thestimulus that contained the contrast incre-ment, corresponding to the averaged physicalcontrast of the stimulus of interest across thetwo stimulus intervals). We then fit these func-tions with the Naka-Rushton equation (Eq. 2)to estimate the baseline (b), the maximum re-sponse (Rmax), and the semisaturation [thecontrast value at half the Rmax (C50)] parame-ters using Matlab’s fminsearch function. In thisfitting routine, there were a total of 28 observeddata points (seven contrast levels times fourattention/stimulus-type conditions) and 14free parameters (four attention/stimulus-typeconditions times three free parameters Gr, Gc,and b), plus s and q exponents that were iden-tical across all conditions. Since the Gr and Gc
parameters control the response and contrastgain of the function where the contrast axisranges from zero to �, the Gr and Gc parame-ters could in principle exceed the realistic rangeof stimulus contrast (0 –100% contrast). Thus,instead of directly comparing Gr and Gc param-eters across conditions, we obtained Rmax andC50 parameters as they respectively capture re-sponse gain and contrast gain of the CRFs overthe realistic range of stimulus contrast values.
Next, a bootstrapping procedure was used toassess differences between parameter estimatesin each condition and to establish confidenceintervals on the best fitting model parameters.First, we resampled subject labels with replacement. Next, we averagedthe mean amplitudes of P1 and LPD components across the resampledsubject labels to generate ERP CRFs for each experimental condition, andthen we fit the grand-averaged ERP CRFs to estimate b, Rmax, and C50
parameters. This resampling and fitting procedure was then repeated10,000 times to create bootstrap distributions from which confidenceintervals associated with each parameter were computed. To evaluate themain effect of attention condition (focused/divided), we compiled thebootstrap distribution of the differences between the estimated fit pa-rameters in the focused-attention and distributed-attention condi-tions—i.e., focused (target plus nontarget) minus divided (target plusnontarget)—and computed the percentage of values in the tail of thisdistribution that were �0. Similarly, we tested the main effect of stimulustype (target/nontarget) by compiling the bootstrap distributions of thedifferences between the estimated fit parameters in the target and thenontarget conditions—i.e., target (focused plus divided) minus nontar-get (focused plus divided). The interaction between attention conditionand stimulus type was examined by comparing the bootstrap distribu-
tions of focused (target minus nontarget) minus divided (target minusnontarget). Finally, post hoc comparisons were performed to test foradditional differences between pairs of conditions by evaluating boot-strap distributions of differences and then computing the percentage ofthe values in the tails of these distributions that were 0 or �0. We usedtwo-tailed statistical tests to be conservative and all p values associatedwith post hoc comparisons were corrected by the Holm-Bonferronimethod.
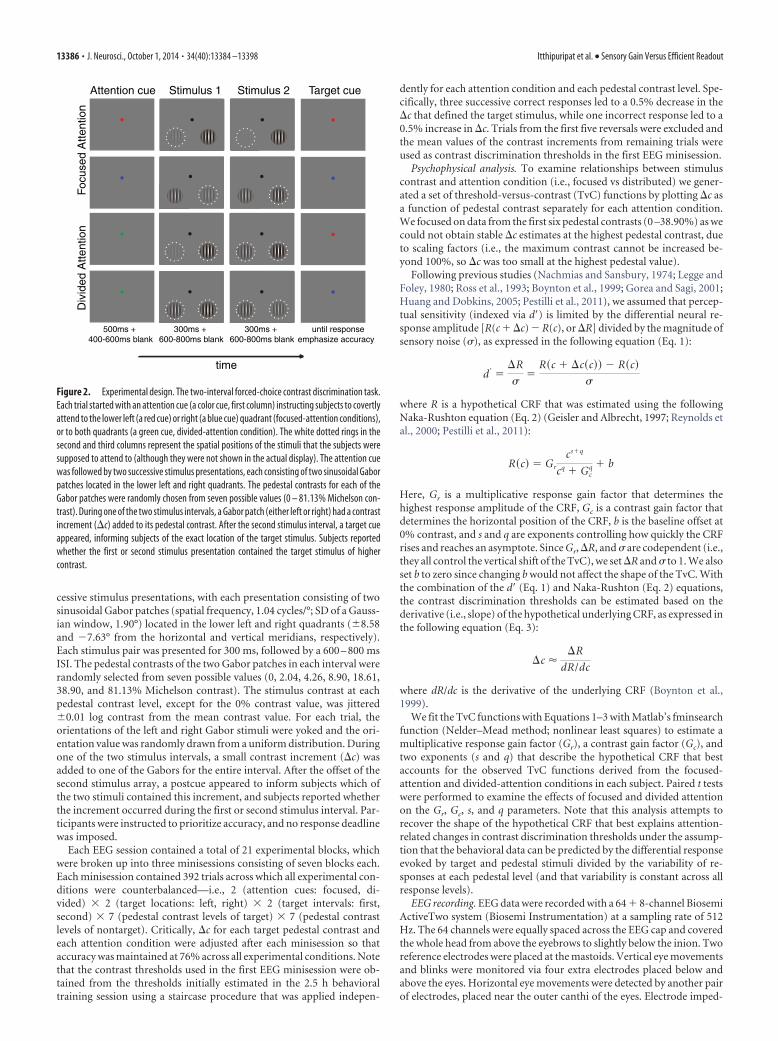
Fit procedure for the sensory gain model. To quantitatively evaluatewhether gain in the ERP response amplitudes in the P1 and LPD compo-nent windows could sufficiently account for attention-induced changesin contrast discrimination thresholds, we simulated the P1 and LPDcomponent CRFs using the combination of the d� (Eq. 1) and Naka-Rushton (Eq. 2) equations (Fig. 4). The main parameters of interest werethe baseline parameter of the simulated CRFs (b) and the noise parameterin the d� equation (�; see similar method in Pestilli et al., 2011). Specifi-cally, the TvC functions in the focused-attention and divided-attentionconditions were first estimated using Equations 1–3. Then, we estimated
R(C0) = b
R(C1) = b+ σ
ΔC0
C1 = C0+ΔC0
R(Ci) = R(Ci-1)+ σ
Ci-1
ΔCi-1
d’ = R(Ci)-R(Ci-1) σ
Pedestal Contrast (%) Stimulus Contrast (%)
Dis
crim
inat
ion
Thr
esho
ld (
% c
ontr
ast)
Am
plitu
de (
µV)
C0 = 0C0 = 0
d’ = R(C1)-R(C0) σ
C0
Contrast Discrimination
Threshold
ERP CRFs
A B
C D
E F
Ci = Ci-1+ΔCi-1
Figure 4. Testing the sensory gain model. To quantitatively evaluate whether the observed sensory gain in the ERP CRFs couldsufficiently account for attention-induced changes in the contrast-discrimination thresholds, the TvC functions from the focused-attention and divided-attention conditions were interpolated (A, C, and E) and the ERP CRF (B, D, F) was estimated based on theinterpolated TvC function using the combination of the signal-detection theory (Eq. 1) and Naka-Rushton functions (Eq. 2), giventhat d� � 1 (accuracy, �76%; see step-by-step details in Materials and Methods).
13388 • J. Neurosci., October 1, 2014 • 34(40):13384 –13398 Itthipuripat et al. • Sensory Gain Versus Efficient Readout
the P1 and LPD component CRFs for the divided condition based on theTvC function of the divided-attention condition. The fit routine startedby setting the first point on the estimated CRF (c0 � 0% contrast) to be abaseline parameter (b), for any given values of b and � (Fig. 4 A, B), asshown in the following equation (Eq. 4): R(c0) � b.
The next contrast (c1) for which a response was estimated was takenfrom the TvC function shown in the following equation (Eq. 5): c1 � c0 ��c0, where �c0 is the threshold at c0 (Fig. 4C). Then, the response at c1 wasestimated using the d� equation (Eq. 1) as shown in the following equa-tion (Eq. 6): R(c1) � b � �, given that d� � 1 (Fig. 4D). The next contrastwas selected in the same way, shown in the following equation (Eq. 7):c
i� ci � 1 � �ci � 1, where i is the number of the current iteration that is
1. Accordingly, the response at ci was estimated as the following equa-tion (Eq. 8): R(ci) � R(ci � 1) � �. This procedure was continued until theentire CRF was estimated (Fig. 4 E, F ). Finally, the b and � parameterswere optimized by minimizing the least-squares error between the sim-ulated CRFs and the observed P1 and LPD component CRFs in thedivided-attention condition (the average between divided-attentiontarget and nontarget conditions) using Matlab’s fminsearch function.To test whether the multiplicative response gain of the ERP CRFsalone could account for changes in the TvC function, we estimatedthe P1 and LPD component CRFs for the focused-attention target,using the modeling routine described above with the b and � param-eters that are identical to those obtained from in the divided-attentioncondition.
To test whether allowing changes in the noise (�) and baseline (b)parameters across the focused-attention and divided-attention condi-tions could significantly improve the fit of the P1 and LPD componentresponses, we estimated the P1 and LPD component CRFs derived fromthe focused-attention condition as we did above except that we allowed �and b parameters to vary freely to find the best fit. The R 2 value obtainedfrom the model with fixed � and b parameters (reduced model) was thencompared with the R 2 value from the model with free � and b parametersin the focused-attention condition (full model), using an F test statistic asshown in the following equation (Eq. 9):
FDf1,Df2 �Rfull
2 � Rred2
Df1�1 � Rfull
2
Df2
where Rfull2 and Rred
2 are obtained from the best fits of the full and reducedmodels, respectively. Df1 is the number of parameters in the full model(four free parameters: � and b for the divided-attention condition, and �and b for the focused-attention condition) minus the number of theparameters in the reduced model (two free parameters: � and b, sharedacross the divided-attention and focused-attention conditions). Df2 isthe number of observations (seven contrast levels times two attentionconditions) minus the number of the free parameters in the full modelminus one. The F distribution was then used to estimate the probabilitythat the full model differed significantly from the reduced model.
To determine whether allowing the optimization of � and b in thefocused-attention condition led to a significant change in these parame-ters in the divided-attention condition, we used a bootstrapping proce-dure to establish confidence intervals on the best fitting modelparameters (� and b for the divided-attention condition, and � and b forthe focused-attention condition). First, we resampled subject labels withreplacement. Next, we averaged the psychophysical contrast discrimina-tion thresholds and the mean amplitudes of P1 and LPD componentsacross the resampled subject labels to generate new TvC and ERP CRFfunctions for each experimental condition. Then, the TvC functions wereinterpolated using Equations 1–3. In turn, the interpolated TvC func-tions were used to estimate the ERP CRFs via the model as described inFigure 4 and � and b for each of the attention conditions were optimizedusing Matlab’s fminsearch function. To test the difference between �parameters obtained from the divided-attention and focused-attentionconditions, we compiled the bootstrap distribution of the differencesbetween the estimated fit parameters in the focused-attention and thedistributed-attention conditions, and computed the percentage of valuesin the tail of this distribution that were different from zero. An identicalanalysis was then performed for b parameters.
In addition, to examine the variability of the P1 and LPD componentamplitudes across focused-target and divided-target conditions, we resa-mpled half of the trials for each pedestal contrast level and each attentioncondition (focused-target and divided-target conditions) separately forindividual subjects. The ERP for each pedestal contrast and each atten-tion condition was obtained by averaging the stimulus-locked EEG dataacross these resampled trials and applying the subtraction method (Fig.3). This resampling method was repeated 1000 times and the SEM am-plitudes of these resampled and subtracted ERPs (P1 component from 80to 130 ms and LPD component from 230 to 330) was obtained for eachsubject.
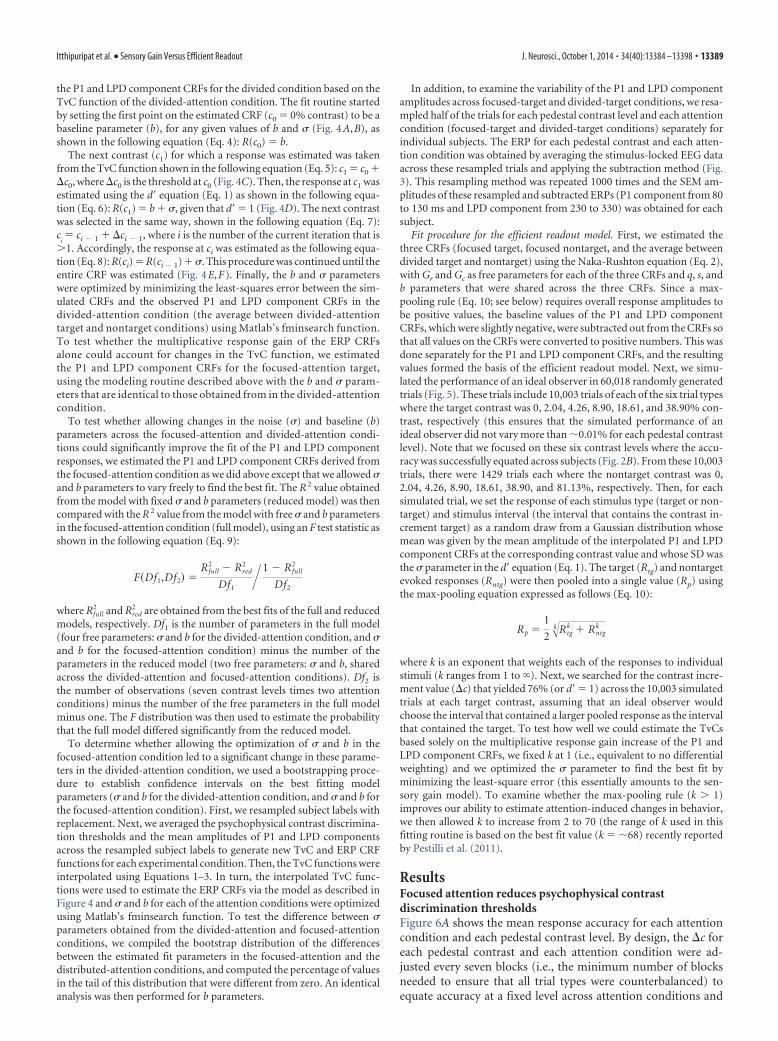
Fit procedure for the efficient readout model. First, we estimated thethree CRFs (focused target, focused nontarget, and the average betweendivided target and nontarget) using the Naka-Rushton equation (Eq. 2),with Gr and Gc as free parameters for each of the three CRFs and q, s, andb parameters that were shared across the three CRFs. Since a max-pooling rule (Eq. 10; see below) requires overall response amplitudes tobe positive values, the baseline values of the P1 and LPD componentCRFs, which were slightly negative, were subtracted out from the CRFs sothat all values on the CRFs were converted to positive numbers. This wasdone separately for the P1 and LPD component CRFs, and the resultingvalues formed the basis of the efficient readout model. Next, we simu-lated the performance of an ideal observer in 60,018 randomly generatedtrials (Fig. 5). These trials include 10,003 trials of each of the six trial typeswhere the target contrast was 0, 2.04, 4.26, 8.90, 18.61, and 38.90% con-trast, respectively (this ensures that the simulated performance of anideal observer did not vary more than �0.01% for each pedestal contrastlevel). Note that we focused on these six contrast levels where the accu-racy was successfully equated across subjects (Fig. 2B). From these 10,003trials, there were 1429 trials each where the nontarget contrast was 0,2.04, 4.26, 8.90, 18.61, 38.90, and 81.13%, respectively. Then, for eachsimulated trial, we set the response of each stimulus type (target or non-target) and stimulus interval (the interval that contains the contrast in-crement target) as a random draw from a Gaussian distribution whosemean was given by the mean amplitude of the interpolated P1 and LPDcomponent CRFs at the corresponding contrast value and whose SD wasthe � parameter in the d� equation (Eq. 1). The target (Rtg) and nontargetevoked responses (Rntg) were then pooled into a single value (Rp) usingthe max-pooling equation expressed as follows (Eq. 10):
Rp �1
2�k Rtg
k � Rntgk
where k is an exponent that weights each of the responses to individualstimuli (k ranges from 1 to �). Next, we searched for the contrast incre-ment value (�c) that yielded 76% (or d� � 1) across the 10,003 simulatedtrials at each target contrast, assuming that an ideal observer wouldchoose the interval that contained a larger pooled response as the intervalthat contained the target. To test how well we could estimate the TvCsbased solely on the multiplicative response gain increase of the P1 andLPD component CRFs, we fixed k at 1 (i.e., equivalent to no differentialweighting) and we optimized the � parameter to find the best fit byminimizing the least-square error (this essentially amounts to the sen-sory gain model). To examine whether the max-pooling rule (k 1)improves our ability to estimate attention-induced changes in behavior,we then allowed k to increase from 2 to 70 (the range of k used in thisfitting routine is based on the best fit value (k � �68) recently reportedby Pestilli et al. (2011).
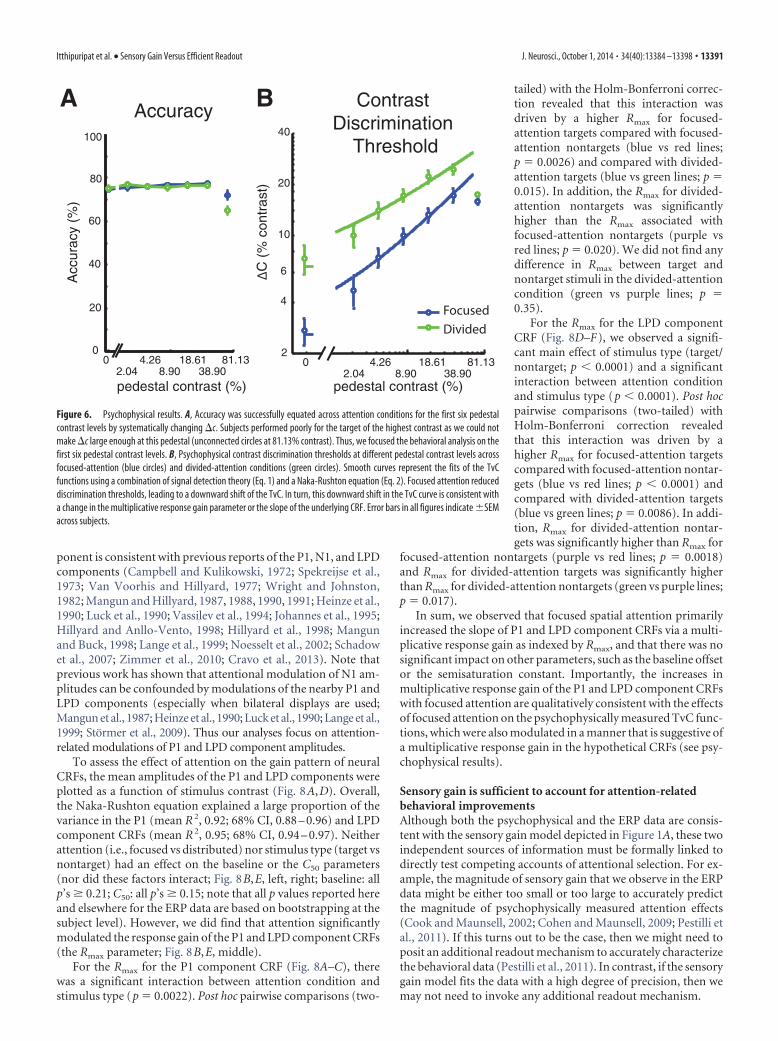
ResultsFocused attention reduces psychophysical contrastdiscrimination thresholdsFigure 6A shows the mean response accuracy for each attentioncondition and each pedestal contrast level. By design, the �c foreach pedestal contrast and each attention condition were ad-justed every seven blocks (i.e., the minimum number of blocksneeded to ensure that all trial types were counterbalanced) toequate accuracy at a fixed level across attention conditions and
Itthipuripat et al. • Sensory Gain Versus Efficient Readout J. Neurosci., October 1, 2014 • 34(40):13384 –13398 • 13389
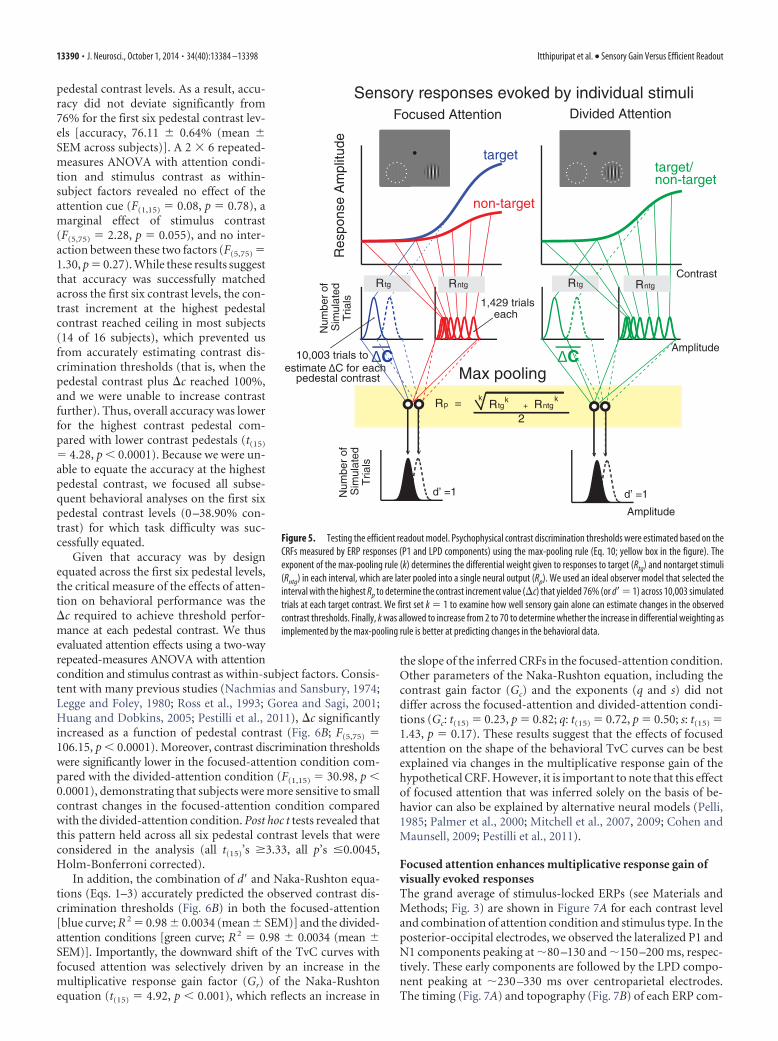
pedestal contrast levels. As a result, accu-racy did not deviate significantly from76% for the first six pedestal contrast lev-els [accuracy, 76.11 � 0.64% (mean �SEM across subjects)]. A 2 � 6 repeated-measures ANOVA with attention condi-tion and stimulus contrast as within-subject factors revealed no effect of theattention cue (F(1,15) � 0.08, p � 0.78), amarginal effect of stimulus contrast(F(5,75) � 2.28, p � 0.055), and no inter-action between these two factors (F(5,75) �1.30, p � 0.27). While these results suggestthat accuracy was successfully matchedacross the first six contrast levels, the con-trast increment at the highest pedestalcontrast reached ceiling in most subjects(14 of 16 subjects), which prevented usfrom accurately estimating contrast dis-crimination thresholds (that is, when thepedestal contrast plus �c reached 100%,and we were unable to increase contrastfurther). Thus, overall accuracy was lowerfor the highest contrast pedestal com-pared with lower contrast pedestals (t(15)
� 4.28, p � 0.0001). Because we were un-able to equate the accuracy at the highestpedestal contrast, we focused all subse-quent behavioral analyses on the first sixpedestal contrast levels (0 –38.90% con-trast) for which task difficulty was suc-cessfully equated.
Given that accuracy was by designequated across the first six pedestal levels,the critical measure of the effects of atten-tion on behavioral performance was the�c required to achieve threshold perfor-mance at each pedestal contrast. We thusevaluated attention effects using a two-wayrepeated-measures ANOVA with attentioncondition and stimulus contrast as within-subject factors. Consis-tent with many previous studies (Nachmias and Sansbury, 1974;Legge and Foley, 1980; Ross et al., 1993; Gorea and Sagi, 2001;Huang and Dobkins, 2005; Pestilli et al., 2011), �c significantlyincreased as a function of pedestal contrast (Fig. 6B; F(5,75) �106.15, p � 0.0001). Moreover, contrast discrimination thresholdswere significantly lower in the focused-attention condition com-pared with the divided-attention condition (F(1,15) � 30.98, p �0.0001), demonstrating that subjects were more sensitive to smallcontrast changes in the focused-attention condition comparedwith the divided-attention condition. Post hoc t tests revealed thatthis pattern held across all six pedestal contrast levels that wereconsidered in the analysis (all t(15)’s �3.33, all p’s �0.0045,Holm-Bonferroni corrected).
In addition, the combination of d� and Naka-Rushton equa-tions (Eqs. 1–3) accurately predicted the observed contrast dis-crimination thresholds (Fig. 6B) in both the focused-attention[blue curve; R 2 � 0.98 � 0.0034 (mean � SEM)] and the divided-attention conditions [green curve; R2 � 0.98 � 0.0034 (mean �SEM)]. Importantly, the downward shift of the TvC curves withfocused attention was selectively driven by an increase in themultiplicative response gain factor (Gr) of the Naka-Rushtonequation (t(15) � 4.92, p � 0.001), which reflects an increase in
the slope of the inferred CRFs in the focused-attention condition.Other parameters of the Naka-Rushton equation, including thecontrast gain factor (Gc) and the exponents (q and s) did notdiffer across the focused-attention and divided-attention condi-tions (Gc: t(15) � 0.23, p � 0.82; q: t(15) � 0.72, p � 0.50; s: t(15) �1.43, p � 0.17). These results suggest that the effects of focusedattention on the shape of the behavioral TvC curves can be bestexplained via changes in the multiplicative response gain of thehypothetical CRF. However, it is important to note that this effectof focused attention that was inferred solely on the basis of be-havior can also be explained by alternative neural models (Pelli,1985; Palmer et al., 2000; Mitchell et al., 2007, 2009; Cohen andMaunsell, 2009; Pestilli et al., 2011).
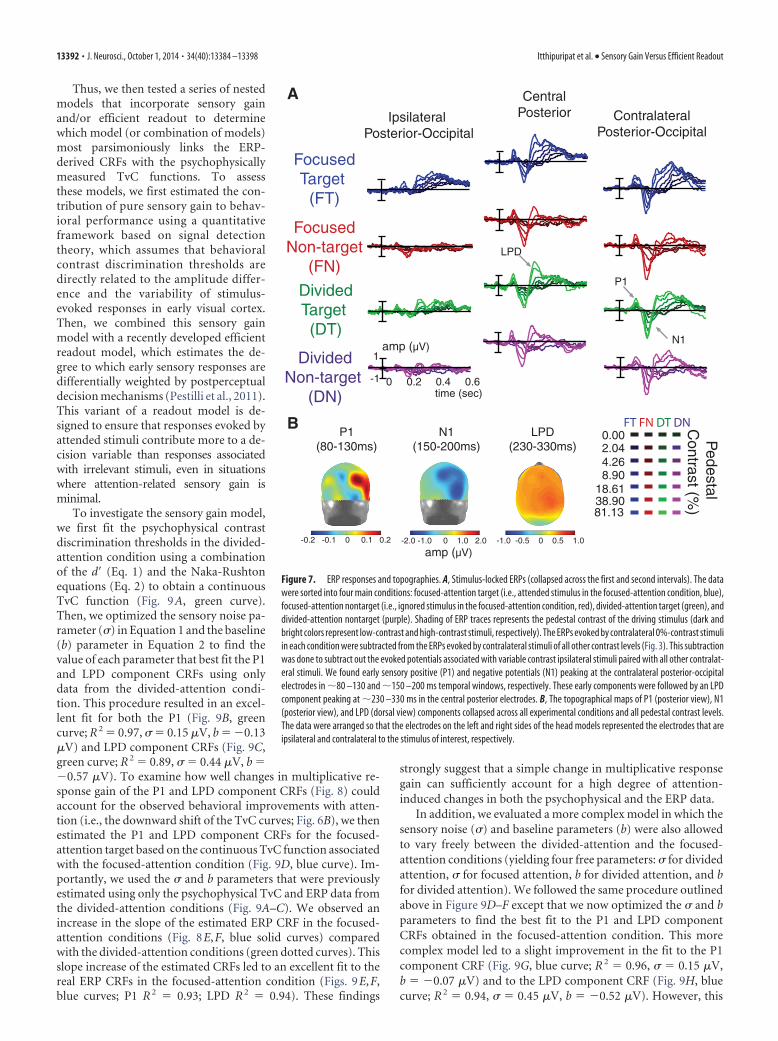
Focused attention enhances multiplicative response gain ofvisually evoked responsesThe grand average of stimulus-locked ERPs (see Materials andMethods; Fig. 3) are shown in Figure 7A for each contrast leveland combination of attention condition and stimulus type. In theposterior-occipital electrodes, we observed the lateralized P1 andN1 components peaking at �80 –130 and �150 –200 ms, respec-tively. These early components are followed by the LPD compo-nent peaking at �230 –330 ms over centroparietal electrodes.The timing (Fig. 7A) and topography (Fig. 7B) of each ERP com-
Focused Attention Divided Attention
Num
ber
of
Sim
ulat
edTr
ials
Amplitude
d’ =1 d’ =1
Res
pons
e A
mpl
itude
Contrast
Sensory responses evoked by individual stimuli
Max pooling
Rp = k
2Rtg + Rntg
k k
RntgRtg
Num
ber
of
Sim
ulat
edT
rials
Amplitude
1,429 trials each
target
non-target
target/non-target
10,003 trials to estimate ΔC for each
pedestal contrast
Rtg Rntg
ΔC ΔC
Figure 5. Testing the efficient readout model. Psychophysical contrast discrimination thresholds were estimated based on theCRFs measured by ERP responses (P1 and LPD components) using the max-pooling rule (Eq. 10; yellow box in the figure). Theexponent of the max-pooling rule (k) determines the differential weight given to responses to target (Rtg) and nontarget stimuli(Rntg) in each interval, which are later pooled into a single neural output (Rp). We used an ideal observer model that selected theinterval with the highest Rp to determine the contrast increment value (�c) that yielded 76% (or d�� 1) across 10,003 simulatedtrials at each target contrast. We first set k � 1 to examine how well sensory gain alone can estimate changes in the observedcontrast thresholds. Finally, k was allowed to increase from 2 to 70 to determine whether the increase in differential weighting asimplemented by the max-pooling rule is better at predicting changes in the behavioral data.
13390 • J. Neurosci., October 1, 2014 • 34(40):13384 –13398 Itthipuripat et al. • Sensory Gain Versus Efficient Readout
ponent is consistent with previous reports of the P1, N1, and LPDcomponents (Campbell and Kulikowski, 1972; Spekreijse et al.,1973; Van Voorhis and Hillyard, 1977; Wright and Johnston,1982; Mangun and Hillyard, 1987, 1988, 1990, 1991; Heinze et al.,1990; Luck et al., 1990; Vassilev et al., 1994; Johannes et al., 1995;Hillyard and Anllo-Vento, 1998; Hillyard et al., 1998; Mangunand Buck, 1998; Lange et al., 1999; Noesselt et al., 2002; Schadowet al., 2007; Zimmer et al., 2010; Cravo et al., 2013). Note thatprevious work has shown that attentional modulation of N1 am-plitudes can be confounded by modulations of the nearby P1 andLPD components (especially when bilateral displays are used;Mangun et al., 1987; Heinze et al., 1990; Luck et al., 1990; Lange et al.,1999; Stormer et al., 2009). Thus our analyses focus on attention-related modulations of P1 and LPD component amplitudes.
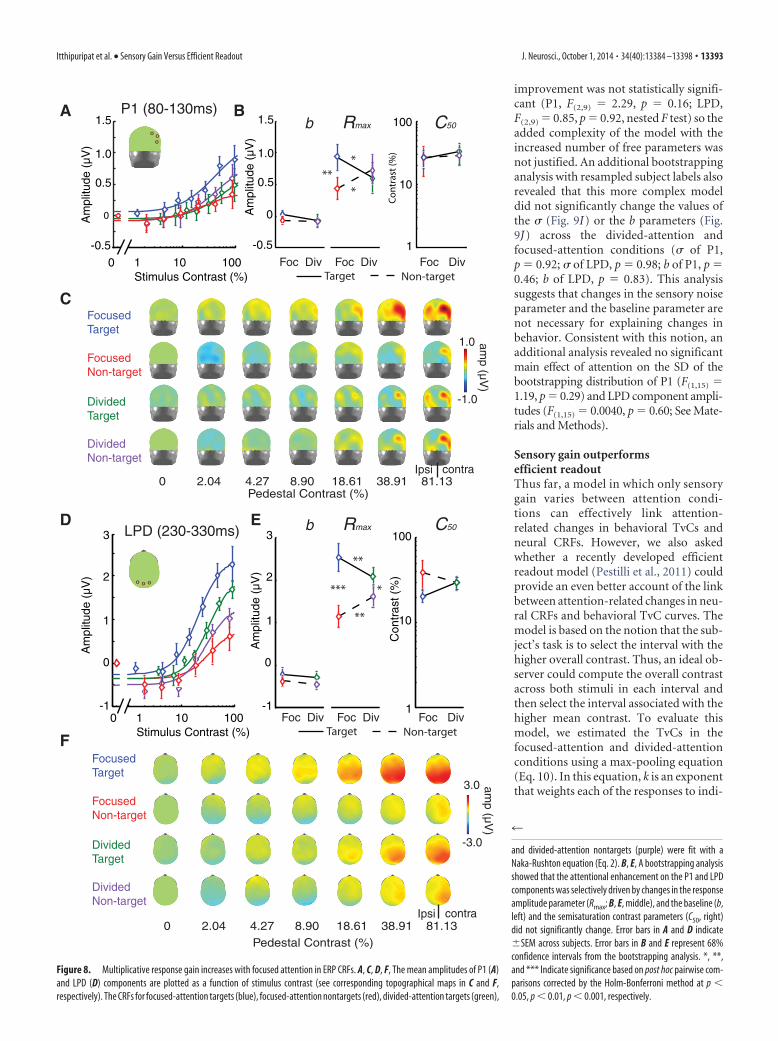
To assess the effect of attention on the gain pattern of neuralCRFs, the mean amplitudes of the P1 and LPD components wereplotted as a function of stimulus contrast (Fig. 8A,D). Overall,the Naka-Rushton equation explained a large proportion of thevariance in the P1 (mean R 2, 0.92; 68% CI, 0.88 – 0.96) and LPDcomponent CRFs (mean R 2, 0.95; 68% CI, 0.94 – 0.97). Neitherattention (i.e., focused vs distributed) nor stimulus type (target vsnontarget) had an effect on the baseline or the C50 parameters(nor did these factors interact; Fig. 8B,E, left, right; baseline: allp’s � 0.21; C50: all p’s � 0.15; note that all p values reported hereand elsewhere for the ERP data are based on bootstrapping at thesubject level). However, we did find that attention significantlymodulated the response gain of the P1 and LPD component CRFs(the Rmax parameter; Fig. 8B,E, middle).
For the Rmax for the P1 component CRF (Fig. 8A–C), therewas a significant interaction between attention condition andstimulus type (p � 0.0022). Post hoc pairwise comparisons (two-
tailed) with the Holm-Bonferroni correc-tion revealed that this interaction wasdriven by a higher Rmax for focused-attention targets compared with focused-attention nontargets (blue vs red lines;p � 0.0026) and compared with divided-attention targets (blue vs green lines; p �0.015). In addition, the Rmax for divided-attention nontargets was significantlyhigher than the Rmax associated withfocused-attention nontargets (purple vsred lines; p � 0.020). We did not find anydifference in Rmax between target andnontarget stimuli in the divided-attentioncondition (green vs purple lines; p �0.35).
For the Rmax for the LPD componentCRF (Fig. 8D–F), we observed a signifi-cant main effect of stimulus type (target/nontarget; p � 0.0001) and a significantinteraction between attention conditionand stimulus type (p � 0.0001). Post hocpairwise comparisons (two-tailed) withHolm-Bonferroni correction revealedthat this interaction was driven by ahigher Rmax for focused-attention targetscompared with focused-attention nontar-gets (blue vs red lines; p � 0.0001) andcompared with divided-attention targets(blue vs green lines; p � 0.0086). In addi-tion, Rmax for divided-attention nontar-gets was significantly higher than Rmax for
focused-attention nontargets (purple vs red lines; p � 0.0018)and Rmax for divided-attention targets was significantly higherthan Rmax for divided-attention nontargets (green vs purple lines;p � 0.017).
In sum, we observed that focused spatial attention primarilyincreased the slope of P1 and LPD component CRFs via a multi-plicative response gain as indexed by Rmax, and that there was nosignificant impact on other parameters, such as the baseline offsetor the semisaturation constant. Importantly, the increases inmultiplicative response gain of the P1 and LPD component CRFswith focused attention are qualitatively consistent with the effectsof focused attention on the psychophysically measured TvC func-tions, which were also modulated in a manner that is suggestive ofa multiplicative response gain in the hypothetical CRFs (see psy-chophysical results).
Sensory gain is sufficient to account for attention-relatedbehavioral improvementsAlthough both the psychophysical and the ERP data are consis-tent with the sensory gain model depicted in Figure 1A, these twoindependent sources of information must be formally linked todirectly test competing accounts of attentional selection. For ex-ample, the magnitude of sensory gain that we observe in the ERPdata might be either too small or too large to accurately predictthe magnitude of psychophysically measured attention effects(Cook and Maunsell, 2002; Cohen and Maunsell, 2009; Pestilli etal., 2011). If this turns out to be the case, then we might need toposit an additional readout mechanism to accurately characterizethe behavioral data (Pestilli et al., 2011). In contrast, if the sensorygain model fits the data with a high degree of precision, then wemay not need to invoke any additional readout mechanism.
Focused Divided
0 4.26 18.61 81.13
100
80
60
40
20
0
ΔC
(%
con
tras
t)
Acc
urac
y (%
)
Contrast Discrimination
Threshold
Accuracy
pedestal contrast (%)
40
20
10
6
4
2
pedestal contrast (%)
A B
2.04 8.90 38.90 0 4.26 18.61 81.13
2.04 8.90 38.90
Figure 6. Psychophysical results. A, Accuracy was successfully equated across attention conditions for the first six pedestalcontrast levels by systematically changing �c. Subjects performed poorly for the target of the highest contrast as we could notmake �c large enough at this pedestal (unconnected circles at 81.13% contrast). Thus, we focused the behavioral analysis on thefirst six pedestal contrast levels. B, Psychophysical contrast discrimination thresholds at different pedestal contrast levels acrossfocused-attention (blue circles) and divided-attention conditions (green circles). Smooth curves represent the fits of the TvCfunctions using a combination of signal detection theory (Eq. 1) and a Naka-Rushton equation (Eq. 2). Focused attention reduceddiscrimination thresholds, leading to a downward shift of the TvC. In turn, this downward shift in the TvC curve is consistent witha change in the multiplicative response gain parameter or the slope of the underlying CRF. Error bars in all figures indicate �SEMacross subjects.
Itthipuripat et al. • Sensory Gain Versus Efficient Readout J. Neurosci., October 1, 2014 • 34(40):13384 –13398 • 13391
Thus, we then tested a series of nestedmodels that incorporate sensory gainand/or efficient readout to determinewhich model (or combination of models)most parsimoniously links the ERP-derived CRFs with the psychophysicallymeasured TvC functions. To assessthese models, we first estimated the con-tribution of pure sensory gain to behav-ioral performance using a quantitativeframework based on signal detectiontheory, which assumes that behavioralcontrast discrimination thresholds aredirectly related to the amplitude differ-ence and the variability of stimulus-evoked responses in early visual cortex.Then, we combined this sensory gainmodel with a recently developed efficientreadout model, which estimates the de-gree to which early sensory responses aredifferentially weighted by postperceptualdecision mechanisms (Pestilli et al., 2011).This variant of a readout model is de-signed to ensure that responses evoked byattended stimuli contribute more to a de-cision variable than responses associatedwith irrelevant stimuli, even in situationswhere attention-related sensory gain isminimal.
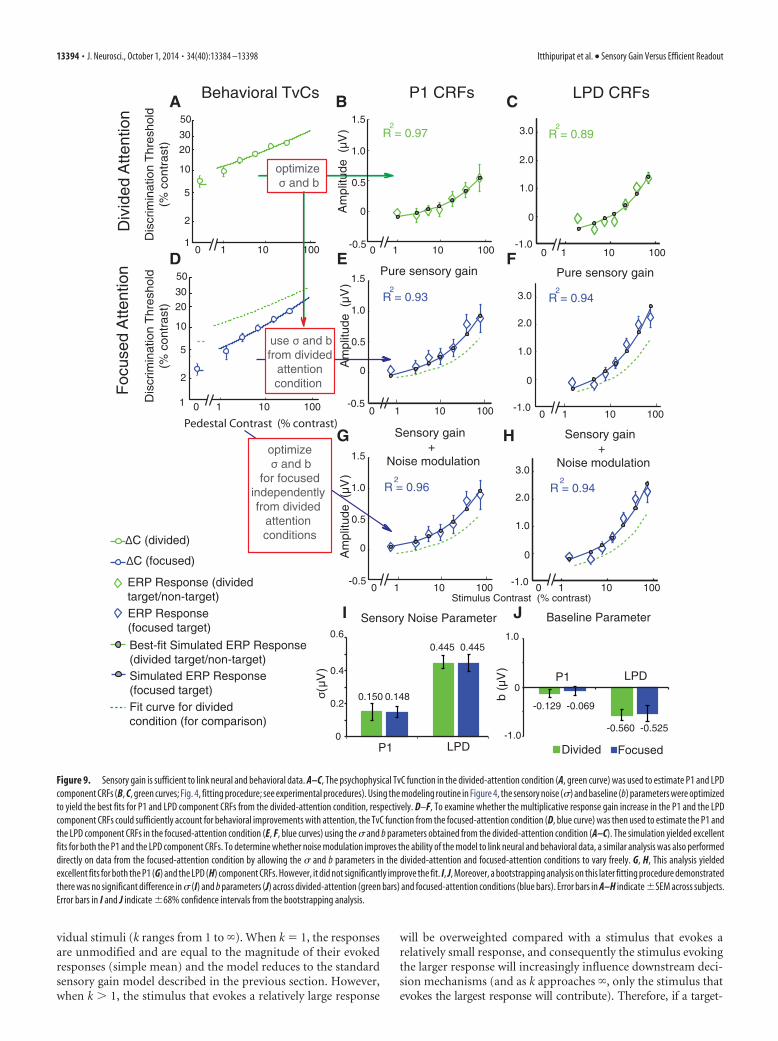
To investigate the sensory gain model,we first fit the psychophysical contrastdiscrimination thresholds in the divided-attention condition using a combinationof the d� (Eq. 1) and the Naka-Rushtonequations (Eq. 2) to obtain a continuousTvC function (Fig. 9A, green curve).Then, we optimized the sensory noise pa-rameter (�) in Equation 1 and the baseline(b) parameter in Equation 2 to find thevalue of each parameter that best fit the P1and LPD component CRFs using onlydata from the divided-attention condi-tion. This procedure resulted in an excel-lent fit for both the P1 (Fig. 9B, greencurve; R 2 � 0.97, � � 0.15 �V, b � �0.13�V) and LPD component CRFs (Fig. 9C,green curve; R 2 � 0.89, � � 0.44 �V, b ��0.57 �V). To examine how well changes in multiplicative re-sponse gain of the P1 and LPD component CRFs (Fig. 8) couldaccount for the observed behavioral improvements with atten-tion (i.e., the downward shift of the TvC curves; Fig. 6B), we thenestimated the P1 and LPD component CRFs for the focused-attention target based on the continuous TvC function associatedwith the focused-attention condition (Fig. 9D, blue curve). Im-portantly, we used the � and b parameters that were previouslyestimated using only the psychophysical TvC and ERP data fromthe divided-attention conditions (Fig. 9A–C). We observed anincrease in the slope of the estimated ERP CRF in the focused-attention conditions (Fig. 8E,F, blue solid curves) comparedwith the divided-attention conditions (green dotted curves). Thisslope increase of the estimated CRFs led to an excellent fit to thereal ERP CRFs in the focused-attention condition (Figs. 9E,F,blue curves; P1 R 2 � 0.93; LPD R 2 � 0.94). These findings
strongly suggest that a simple change in multiplicative responsegain can sufficiently account for a high degree of attention-induced changes in both the psychophysical and the ERP data.
In addition, we evaluated a more complex model in which thesensory noise (�) and baseline parameters (b) were also allowedto vary freely between the divided-attention and the focused-attention conditions (yielding four free parameters: � for dividedattention, � for focused attention, b for divided attention, and bfor divided attention). We followed the same procedure outlinedabove in Figure 9D–F except that we now optimized the � and bparameters to find the best fit to the P1 and LPD componentCRFs obtained in the focused-attention condition. This morecomplex model led to a slight improvement in the fit to the P1component CRF (Fig. 9G, blue curve; R 2 � 0.96, � � 0.15 �V,b � �0.07 �V) and to the LPD component CRF (Fig. 9H, bluecurve; R 2 � 0.94, � � 0.45 �V, b � �0.52 �V). However, this
P1
N1
1
-1 0 0.2 0.4 0.6
FocusedTarget
(FT)
FocusedNon-target
(FN)
DividedTarget (DT)
DividedNon-target
(DN)
Ipsilateral Posterior-Occipital
ContralateralPosterior-Occipital
CentralPosterior
time (sec)
LPD
Pedestal
Contrast (%
)
amp (µV)
0.002.044.268.90
18.6138.9081.13
FT FN DT DN
A
BP1
(80-130ms)N1
(150-200ms)LPD
(230-330ms)
-0.2 -0.1 0 0.1 0.2 -2.0 -1.0 0 1.0 2.0 -1.0 -0.5 0 0.5 1.0
amp (µV)
Figure 7. ERP responses and topographies. A, Stimulus-locked ERPs (collapsed across the first and second intervals). The datawere sorted into four main conditions: focused-attention target (i.e., attended stimulus in the focused-attention condition, blue),focused-attention nontarget (i.e., ignored stimulus in the focused-attention condition, red), divided-attention target (green), anddivided-attention nontarget (purple). Shading of ERP traces represents the pedestal contrast of the driving stimulus (dark andbright colors represent low-contrast and high-contrast stimuli, respectively). The ERPs evoked by contralateral 0%-contrast stimuliin each condition were subtracted from the ERPs evoked by contralateral stimuli of all other contrast levels (Fig. 3). This subtractionwas done to subtract out the evoked potentials associated with variable contrast ipsilateral stimuli paired with all other contralat-eral stimuli. We found early sensory positive (P1) and negative potentials (N1) peaking at the contralateral posterior-occipitalelectrodes in �80 –130 and �150 –200 ms temporal windows, respectively. These early components were followed by an LPDcomponent peaking at �230 –330 ms in the central posterior electrodes. B, The topographical maps of P1 (posterior view), N1(posterior view), and LPD (dorsal view) components collapsed across all experimental conditions and all pedestal contrast levels.The data were arranged so that the electrodes on the left and right sides of the head models represented the electrodes that areipsilateral and contralateral to the stimulus of interest, respectively.
13392 • J. Neurosci., October 1, 2014 • 34(40):13384 –13398 Itthipuripat et al. • Sensory Gain Versus Efficient Readout
improvement was not statistically signifi-cant (P1, F(2,9) � 2.29, p � 0.16; LPD,F(2,9) � 0.85, p � 0.92, nested F test) so theadded complexity of the model with theincreased number of free parameters wasnot justified. An additional bootstrappinganalysis with resampled subject labels alsorevealed that this more complex modeldid not significantly change the values ofthe � (Fig. 9I) or the b parameters (Fig.9J) across the divided-attention andfocused-attention conditions (� of P1,p � 0.92; � of LPD, p � 0.98; b of P1, p �0.46; b of LPD, p � 0.83). This analysissuggests that changes in the sensory noiseparameter and the baseline parameter arenot necessary for explaining changes inbehavior. Consistent with this notion, anadditional analysis revealed no significantmain effect of attention on the SD of thebootstrapping distribution of P1 (F(1,15) �1.19, p � 0.29) and LPD component ampli-tudes (F(1,15) � 0.0040, p � 0.60; See Mate-rials and Methods).
Sensory gain outperformsefficient readoutThus far, a model in which only sensorygain varies between attention condi-tions can effectively link attention-related changes in behavioral TvCs andneural CRFs. However, we also askedwhether a recently developed efficientreadout model (Pestilli et al., 2011) couldprovide an even better account of the linkbetween attention-related changes in neu-ral CRFs and behavioral TvC curves. Themodel is based on the notion that the sub-ject’s task is to select the interval with thehigher overall contrast. Thus, an ideal ob-server could compute the overall contrastacross both stimuli in each interval andthen select the interval associated with thehigher mean contrast. To evaluate thismodel, we estimated the TvCs in thefocused-attention and divided-attentionconditions using a max-pooling equation(Eq. 10). In this equation, k is an exponentthat weights each of the responses to indi-
P1 (80-130ms)
0
-1
1
2
3
0
-0.5
0.5
1.0
1.5
0 1 10 100 Foc Div Foc Div Foc Div
b Rmax C50
*
* **
0
-0.5
0.5
1.0
1.5 100
10
1
0
-1
1
2
3
***
**
**
*
Am
plitu
de (
µV)
Con
tras
t (%
)
100
10
1
Am
plitu
de (
µV)
1.0 amp (µV
)
-1.0
Am
plitu
de (
µV)
Cont
rast
(%)
0 2.04 4.27 8.90 18.61 38.91 81.13Pedestal Contrast (%)
b Rmax C50
contraIpsi
Am
plitu
de (
µV)
LPD (230-330ms)
Focused Target
Focused Non-target
Divided Target
Divided Non-target
ooo
oo o
Stimulus Contrast (%) Target Non-target
3.0 amp (µV
)
-3.0
0 2.04 4.27 8.90 18.61 38.91 81.13Pedestal Contrast (%)
Focused Target
Focused Non-target
Divided Target
Divided Non-target
contraIpsi
0 1 10 100 Foc Div Foc Div Foc DivStimulus Contrast (%) Target Non-target
A B
C
D E
F
Figure 8. Multiplicative response gain increases with focused attention in ERP CRFs. A, C, D, F, The mean amplitudes of P1 (A)and LPD (D) components are plotted as a function of stimulus contrast (see corresponding topographical maps in C and F,respectively). The CRFs for focused-attention targets (blue), focused-attention nontargets (red), divided-attention targets (green),
4
and divided-attention nontargets (purple) were fit with aNaka-Rushton equation (Eq. 2). B, E, A bootstrapping analysisshowed that the attentional enhancement on the P1 and LPDcomponents was selectively driven by changes in the responseamplitude parameter (Rmax; B, E, middle), and the baseline (b,left) and the semisaturation contrast parameters (C50, right)did not significantly change. Error bars in A and D indicate�SEM across subjects. Error bars in B and E represent 68%confidence intervals from the bootstrapping analysis. *, **,and *** Indicate significance based on post hoc pairwise com-parisons corrected by the Holm-Bonferroni method at p �0.05, p � 0.01, p � 0.001, respectively.
Itthipuripat et al. • Sensory Gain Versus Efficient Readout J. Neurosci., October 1, 2014 • 34(40):13384 –13398 • 13393
vidual stimuli (k ranges from 1 to �). When k � 1, the responsesare unmodified and are equal to the magnitude of their evokedresponses (simple mean) and the model reduces to the standardsensory gain model described in the previous section. However,when k 1, the stimulus that evokes a relatively large response
will be overweighted compared with a stimulus that evokes arelatively small response, and consequently the stimulus evokingthe larger response will increasingly influence downstream deci-sion mechanisms (and as k approaches �, only the stimulus thatevokes the largest response will contribute). Therefore, if a target-
-0.5
0
0.5
1.0
1.5
-0.5
0
0.5
1.0
1.5
-0.5
0
0.5
1.0
1.5
0 1 10 100
30
20
10
5
2
1
50
Pure sensory gain
0 1 10 100
30
20
10
5
2
50
1
Dis
crim
inat
ion
Thr
esho
ld (
% c
ontr
ast)
Am
plitu
de (
µV)
Pedestal Contrast (% contrast)
Stimulus Contrast (% contrast)
A B C
D E F
G HSensory gain +
Noise modulation
Behavioral TvCs P1 CRFs
ΔC (divided)
ΔC (focused)
ERP Response (dividedtarget/non-target)ERP Response (focused target)
Simulated ERP Response (focused target)
Best-fit Simulated ERP Response (divided target/non-target)
LPD CRFs
use σ and bfrom divided
attention condition
-1.0
0
1.0
2.0
3.0
0 1 10 100
Dis
crim
inat
ion
Thr
esho
ld (
% c
ontr
ast)
Am
plitu
de (
µV)
Am
plitu
de (
µV)
-1.0
0
1.0
2.0
3.0
0 1 10 100
Div
ided
Atte
ntio
nF
ocus
ed A
ttent
ion
0 1 10 100 -1.0
0
1.0
2.0
3.0
optimize σ and b
for focusedindependently from divided
attention conditions
optimize σ and b
0 1 10 100
0 1 10 100
0 1 10 100
Fit curve for divided condition (for comparison)
P1 LPD
Sensory Noise Parameter Baseline Parameter
0.150 0.148
0.445 0.445
0
0.2
0.6
0.4
Divided Focused
P1 LPD
-0.129 -0.069
-0.560 -0.525
b (µ
V)
σ(µV
)
1.0
-1.0
0
Pure sensory gain
Sensory gain +
Noise modulation
R = 0.972
R = 0.892
R = 0.932
R = 0.942
R = 0.962
R = 0.942
JI
Figure 9. Sensory gain is sufficient to link neural and behavioral data. A–C, The psychophysical TvC function in the divided-attention condition (A, green curve) was used to estimate P1 and LPDcomponent CRFs (B, C, green curves; Fig. 4, fitting procedure; see experimental procedures). Using the modeling routine in Figure 4, the sensory noise (�) and baseline (b) parameters were optimizedto yield the best fits for P1 and LPD component CRFs from the divided-attention condition, respectively. D–F, To examine whether the multiplicative response gain increase in the P1 and the LPDcomponent CRFs could sufficiently account for behavioral improvements with attention, the TvC function from the focused-attention condition (D, blue curve) was then used to estimate the P1 andthe LPD component CRFs in the focused-attention condition (E, F, blue curves) using the � and b parameters obtained from the divided-attention condition (A–C). The simulation yielded excellentfits for both the P1 and the LPD component CRFs. To determine whether noise modulation improves the ability of the model to link neural and behavioral data, a similar analysis was also performeddirectly on data from the focused-attention condition by allowing the � and b parameters in the divided-attention and focused-attention conditions to vary freely. G, H, This analysis yieldedexcellent fits for both the P1 (G) and the LPD (H) component CRFs. However, it did not significantly improve the fit. I, J, Moreover, a bootstrapping analysis on this later fitting procedure demonstratedthere was no significant difference in � (I) and b parameters (J) across divided-attention (green bars) and focused-attention conditions (blue bars). Error bars in A–H indicate �SEM across subjects.Error bars in I and J indicate �68% confidence intervals from the bootstrapping analysis.
13394 • J. Neurosci., October 1, 2014 • 34(40):13384 –13398 Itthipuripat et al. • Sensory Gain Versus Efficient Readout
evoked response on a given trial is higher than a nontarget-evokedresponse, the pooling model will exacerbate this differential re-sponse in favor of the target response, and the interval containingthe target will tend to be selected correctly. However, if anontarget-evoked response on a given trial is higher than a target-evoked response, then this model will overweight the nontarget-evoked response and the probability of a correct response willdecrease.
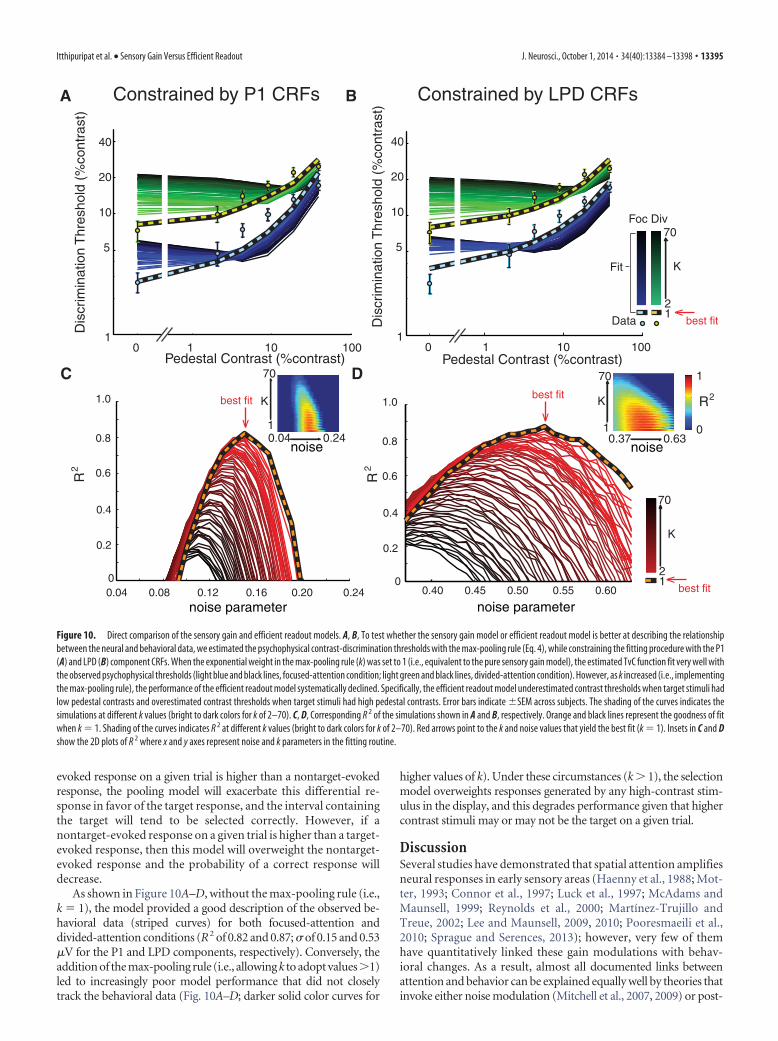
As shown in Figure 10A–D, without the max-pooling rule (i.e.,k � 1), the model provided a good description of the observed be-havioral data (striped curves) for both focused-attention anddivided-attention conditions (R2 of 0.82 and 0.87; � of 0.15 and 0.53�V for the P1 and LPD components, respectively). Conversely, theaddition of the max-pooling rule (i.e., allowing k to adopt values 1)led to increasingly poor model performance that did not closelytrack the behavioral data (Fig. 10A–D; darker solid color curves for
higher values of k). Under these circumstances (k 1), the selectionmodel overweights responses generated by any high-contrast stim-ulus in the display, and this degrades performance given that highercontrast stimuli may or may not be the target on a given trial.
DiscussionSeveral studies have demonstrated that spatial attention amplifiesneural responses in early sensory areas (Haenny et al., 1988; Mot-ter, 1993; Connor et al., 1997; Luck et al., 1997; McAdams andMaunsell, 1999; Reynolds et al., 2000; Martínez-Trujillo andTreue, 2002; Lee and Maunsell, 2009, 2010; Pooresmaeili et al.,2010; Sprague and Serences, 2013); however, very few of themhave quantitatively linked these gain modulations with behav-ioral changes. As a result, almost all documented links betweenattention and behavior can be explained equally well by theories thatinvoke either noise modulation (Mitchell et al., 2007, 2009) or post-
Dis
crim
inat
ion
Thr
esho
ld (
%co
ntra
st)
2
70
K
1
Foc Div
Data
Fit
A BConstrained by P1 CRFs Constrained by LPD CRFs
40
20
10
5
10 1 10 100
Dis
crim
inat
ion
Thr
esho
ld (
%co
ntra
st)
Pedestal Contrast (%contrast)
40
20
10
5
10 1 10 100
2
70
K
1
1.0
0.8
0.6
0.4
0.2
0
1.0
0.8
0.6
0.4
0.2
00.04 0.08 0.12 0.16 0.20 0.24 0.40 0.45 0.50 0.55 0.60
R2
K
1
70
K
1
70
0.37 0.63
C DR
2
0.04 0.24V
R2
1
0V
Pedestal Contrast (%contrast)
best fitbest fit
best fit
V
best fit
V
noise noise
noise parameter noise parameter
Figure 10. Direct comparison of the sensory gain and efficient readout models. A, B, To test whether the sensory gain model or efficient readout model is better at describing the relationshipbetween the neural and behavioral data, we estimated the psychophysical contrast-discrimination thresholds with the max-pooling rule (Eq. 4), while constraining the fitting procedure with the P1(A) and LPD (B) component CRFs. When the exponential weight in the max-pooling rule (k) was set to 1 (i.e., equivalent to the pure sensory gain model), the estimated TvC function fit very well withthe observed psychophysical thresholds (light blue and black lines, focused-attention condition; light green and black lines, divided-attention condition). However, as k increased (i.e., implementingthe max-pooling rule), the performance of the efficient readout model systematically declined. Specifically, the efficient readout model underestimated contrast thresholds when target stimuli hadlow pedestal contrasts and overestimated contrast thresholds when target stimuli had high pedestal contrasts. Error bars indicate �SEM across subjects. The shading of the curves indicates thesimulations at different k values (bright to dark colors for k of 2–70). C, D, Corresponding R 2 of the simulations shown in A and B, respectively. Orange and black lines represent the goodness of fitwhen k � 1. Shading of the curves indicates R 2 at different k values (bright to dark colors for k of 2–70). Red arrows point to the k and noise values that yield the best fit (k � 1). Insets in C and Dshow the 2D plots of R 2 where x and y axes represent noise and k parameters in the fitting routine.
Itthipuripat et al. • Sensory Gain Versus Efficient Readout J. Neurosci., October 1, 2014 • 34(40):13384 –13398 • 13395
sensory readout mechanisms (Pelli, 1985; Palmer et al., 2000; al-though see Cohen and Maunsell, 2009; Pestilli et al., 2011). Here,we examined the relative contributions of sensory gain, noisemodulation, and readout to attention-dependent changes in per-ceptual sensitivity by simultaneously linking psychophysical andneurophysiological data using quantitative frameworks based oneither signal detection theory or a combination of signal detec-tion theory and efficient readout. We find that a model basedsolely on a multiplicative increase in the amplitude of the P1 andthe LPD component-evoked potentials captures nearly all thevariance in behavior, even in an absence of noise modulation.Moreover, this sensory gain model outperforms models that alsoincorporate an efficient readout mechanism.
Our results stand in contrast with a recent fMRI study (Pestilliet al., 2011), which found that attention induced an additive shiftin hemodynamic CRFs. This additive shift cannot explainattention-related changes in TvCs via a sensory gain model, aschanges in behavioral sensitivity are only predicted if the CRFslope changes. Note that we use the term additive “shift” insteadof additive “gain” here since gain is multiplicative by definition.Alternatively, Pestilli et al. (2011) adopted a readout mechanismbased on a max-pooling rule that uses exponentiation to increasedifferential responses evoked by pedestal and target stimuli. Un-like our study, the nontarget contrast values in Pestilli et al.(2011) by design were very close to the target contrast value.Thus, the additive shift in hemodynamic CRFs ensures thattarget-related responses will be higher than nontarget-related re-sponses. As the exponent of the max-pooling rule increases, thecontrast increment that defines the target will elicit a larger dif-ferential response and an ideal observer will more accurately dis-cern the interval that contained the target. Accordingly, thismax-pooling rule enabled them to accurately predict the rela-tionship between attention-induced changes in TvCs and hemo-dynamic CRFs even without changes in slopes of the CRFs.
It is possible that a lack of quantitative evidence for sensorygain in Pestilli et al. (2011) may be due to the insensitivity of fMRIto detect attention-induced sensory gain changes. For example, itis known that attention-related additive increases in hemody-namic CRFs are independent of stimulus intensity (Buracas andBoynton, 2007; Murray, 2008), which is not typically observed inelectrophysiological data (Reynolds et al., 2000; Di Russo et al.,2001; Martínez-Trujillo and Treue, 2002; but see Williford andMaunsell, 2006; Kim et al., 2007; Lauritzen et al., 2010; Lee andMaunsell, 2010; Itthipuripat et al., 2014). The stimulus-independentnature of hemodynamic responses is consistent with other reportsshowing large anticipatory/top-down effects of spatial attentionon fMRI signals (Kastner et al., 1999; Ress et al., 2000; Serences etal., 2004; McMains et al., 2007; Sylvester et al., 2009) and thisanticipatory/top-down modulation may not always be tightly as-sociated with local neuronal activity (Sirotin and Das, 2009; Car-doso et al., 2012). Moreover, there is evidence from the clinicalliterature suggesting that fMRI may be insensitive to localchanges in sensory gain, as presumed deficits in sensory gain inschizophrenic patients could be captured by EEG but not byfMRI (Calderone et al., 2013).
In contrast to fMRI studies (Buracas and Boynton, 2007; Mur-ray, 2008; Pestilli et al., 2011), studies using EEG (Di Russo et al.,2001; Kim et al., 2007; Lauritzen et al., 2010; Wang and Wade,2011; Itthipuripat et al., 2014) have shown various gain patternsresembling those measured using single-unit recording (Reyn-olds et al., 2000; Martínez-Trujillo and Treue, 2002; Lee andMaunsell, 2010). Among these studies, EEG does not typicallyexhibit an additive offset with attention and it appears to be sen-
sitive to changes in sensory-evoked responses. This sensitivity tosensory responses enables us to assess the interaction of attentionand stimulus-evoked responses to evaluate how well a modelbased on sensory gain can account for behavioral changes. Wefound that a multiplicative response gain of the ERP-based CRFswas sufficient to explain attention-related changes in behavior.As a result of this strong predictive relationship between ERP gainprofiles and behavior, the implementation of a max-pooling ruleimpaired model fits, as little variance was left to be explained.Also note that by design, target and nontarget pedestal contrastswere fully crossed and independent. Thus a max-pooling rulewould not always give more weight to the target-evoked response(e.g., when a low-contrast target paired with a high-contrastnontarget).
One resolution to the discrepancies between different mea-surements is offered by Hara et al. (2014), who argue thatpopulation-based metrics that index the activity from broadlytuned neurons will give rise to additive shifts with attention asobserved in hemodynamic CRFs. In contrast, well-tuned cells, asis the case in most single-unit electrophysiology, will exhibit ei-ther response or contrast gain, which is thought to be determinedby the relative size of the stimulus with respect to the scope ofspatial attention as predicted by the normalization model of at-tention (Reynolds and Heeger, 2009; Herrmann et al., 2010; It-thipuripat et al., 2014). However, this possibility does not by itselfoffer a clear account for differences between fMRI and EEG, asEEG also provides a broad population-based activity. Furthercomplicating matters, recent work using voltage-sensitive dyeimaging (VSDI) also reported additive attention effects in mon-key V1 (Chen and Seidemann, 2012). As suggested by Hara et al.(2014), each of these population-level measures (EEG, fMRI, andVSDI) might be differentially sensitive to well tuned and broadlytuned neurons, with EEG perhaps dominated more by responsesfrom well tuned neurons. However, as mentioned above, it is alsopossible that EEG may be more sensitive to attentional modula-tions of local stimulus-evoked spiking activity, whereas fMRI andVSDI may be more sensitive to top-down signals. Consistent withthis idea, fMRI has been suggested to be sensitive to capture syn-aptic inputs to particular cortical areas instead of spiking outputsfrom the areas (Logothetis, 2002, 2008; Logothetis and Wandell,2004; Viswanathan and Freeman, 2007). Similarly, VSDI primar-ily captures the top-down inputs to V1 rather than the local mod-ulations of spiking in V1 (Chen and Seidemann, 2012). Incontrast to fMRI and VSDI, EEG has been closely associated withspiking activity in visual cortex (Whittingstall and Logothetis,2009) and tightly linked to the perceived appearance of a stimulus(Campbell and Kulikowski, 1972; Stormer et al., 2009). Thus, it ispossible that attentional modulation of stimulus-evoked spikingactivity, which might be better captured by EEG, is more closelyrelated to perceptual experience and its behavioral outcomes.Nonetheless, these attention-related changes in stimulus-evokedsensory responses are presumably being modulated by top-downattention signals, so understanding how different metrics of brainactivity index different aspects of attentional modulation is cru-cial to develop a more complete understanding of cortical infor-mation processing.
Contrary to the sensory gain and efficient readout accounts,recent studies in monkeys have demonstrated that attentionmodulates neural noise. Attention has been shown to modulatethe trial-by-trial variability of single neuron spike rates as well aspairwise correlations between neurons in early visual areas(Mitchell et al., 2007, 2009; Cohen and Maunsell, 2009; Nieber-gall et al., 2011; Herrero et al., 2013). These noise modulations
13396 • J. Neurosci., October 1, 2014 • 34(40):13384 –13398 Itthipuripat et al. • Sensory Gain Versus Efficient Readout
have been hypothesized to lead to a larger improvement in thesignal-to-noise ratio (SNR) of neural populations compared withpure changes in sensory gain (Cohen and Maunsell, 2009; Mitch-ell et al., 2009). In our study, we found that sensory gain in ERPscould satisfactorily account for the observed behavioral improve-ments, even under the assumption that the trial-by-trial variabil-ity of ERP amplitudes is unaltered across attention conditions.Note, however, that our results are not necessarily inconsistentwith observations from monkey data showing that attention doesmodulate neural noise, because EEG measures do not providedirect estimates of single-unit variability or population-level co-variance measures (and the same limitation also applies for fMRImeasures). Indeed, it is possible that attention-related modula-tions in neural noise might contribute to changes in ERP ampli-tudes. For example, if sensory neurons fire more consistently, andif changes in noise correlation improve the SNR of pooled neu-ronal signals, then these noise modulations may strengthen thesynchronization across local neural populations and thus amplifythe electrical dipole that generates an ERP on the scalp (Cooper etal., 1965; Gloor, 1985; Makeig et al., 2002; Murakami and Okada,2006). Therefore, it is also possible that changes in the noisecharacteristics of underlying neural generators might influenceattentional modulation of the P1 and LPD components.
ReferencesBoynton GM, Demb JB, Glover GH, Heeger DJ (1999) Neuronal basis of
contrast discrimination. Vision Res 39:257–269. CrossRef MedlineBrainard DH (1997) The psychophysics toolbox. Spat Vis 10:433– 436.
CrossRef MedlineBuracas GT, Boynton GM (2007) The effect of spatial attention on contrast re-
sponse functions in human visual cortex. J Neurosci 27:93–97. CrossRef MedlineCalderone DJ, Martinez A, Zemon V, Hoptman MJ, Hu G, Watkins JE, Javitt
DC, Butler PD (2013) Comparison of psychophysical, electrophysiolog-ical, and fMRI assessment of visual contrast responses in patients withschizophrenia. Neuroimage 67:153–162. CrossRef Medline
Campbell FW, Kulikowski JJ (1972) The visual evoked potential as a func-tion of contrast of a grating pattern. J Physiol 222:345–356. Medline
Cardoso MM, Sirotin YB, Lima B, Glushenkova E, Das A (2012) The neu-roimaging signal is a linear sum of neurally distinct stimulus- and task-related components. Nat Neurosci 15:1298 –1306. CrossRef Medline
Chen Y, Seidemann E (2012) Attentional modulations related to spatial gat-ing but not to allocation of limited resources in primate V1. Neuron74:557–566. CrossRef Medline
Cohen MR, Maunsell JH (2009) Attention improves performance primarilyby reducing interneuronal correlations. Nat Neurosci 12:1594 –1600.CrossRef Medline
Connor CE, Preddie DC, Gallant JL, Van Essen DC (1997) Spatial attentioneffects in macaque area V4. J Neurosci 17:3201–3214. Medline
Cook EP, Maunsell JH (2002) Dynamics of neuronal responses in macaque MTand VIP during motion detection. Nat Neurosci 5:985–994. CrossRef Medline
Cooper R, Winter AL, Crow HJ, Walter WG (1965) Comparison of subcortical,cortical, and scalp activity using chronically indwelling electrodes in man.Electroencephalogr Clin Neurophysiol 18:217–228. CrossRef Medline
Cravo AM, Rohenkohl G, Wyart V, Nobre AC (2013) Temporal expectationenhances contrast sensitivity by phase entrainment of low-frequency os-cillations in visual cortex. J Neurosci 33:4002– 4010. CrossRef Medline
Delorme A, Makeig S (2004) EEGLAB: an open source toolbox for analysisof single-trial EEG dynamics including independent component analysis.J Neurosci Methods 134:9 –21. CrossRef Medline
Di Russo F, Spinelli D, Morrone MC (2001) Automatic gain control con-trast mechanisms are modulated by attention in humans: evidence fromvisual evoked potentials. Vision Res 41:2435–2447. CrossRef Medline
Gloor P (1985) Neuronal generators and the problem of localization in elec-troencephalography: Application of volume conductor theory to electro-encephalography. J Clin Neurophysiol 2:327–354. CrossRef Medline
Gorea A, Sagi D (2001) Disentangling signal from noise in visual contrastdiscrimination. Nat Neurosci 4:1146 –1150. CrossRef Medline
Haenny PE, Maunsell JH, Schiller PH (1988) State dependent activity in
monkey visual cortex. I. Single cell activity in V1 and V4 on visual tasks.Exp Brain Res 69:245–259. CrossRef Medline
Hara Y, Pestilli F, Gardner JL (2014) Differing effects of attention in single-units and populations are well predicted by heterogeneous tuning and thenormalization model of attention. Front Comput Neurosci 8:12.CrossRef Medline
Heinze HJ, Luck SJ, Mangun GR, Hillyard SA (1990) Visual event-relatedpotentials index focused attention within bilateral stimulus arrays. I. Ev-idence for early selection. Electroencephalogr Clin Neurophysiol 75:511–527. CrossRef Medline
Herrero JL, Gieselmann MA, Sanayei M, Thiele A (2013) Attention-inducedvariance and noise correlation reduction in macaque V1 is mediated byNMDA receptors. Neuron 78:729 –739. CrossRef Medline
Herrmann K, Montaser-Kouhsari L, Carrasco M, Heeger DJ (2010) Whensize matters: attention affects performance by contrast or response gain.Nat Neurosci 13:1554 –1559. CrossRef Medline
Hillyard SA, Anllo-Vento L (1998) Event-related brain potentials in thestudy of visual selective attention. Proc Natl Acad Sci U S A 95:781–787.CrossRef Medline
Hillyard SA, Squires KC, Bauer JW, Lindsay PH (1971) Evoked potential correlatesof auditory signal detection. Science 172:1357–1360. CrossRef Medline
Hillyard SA, Vogel EK, Luck SJ (1998) Sensory gain control (amplification) as amechanism of selective attention: electrophysiological and neuroimaging ev-idence. Philos Trans R Soc Lond B Biol Sci 353:1257–1270. CrossRef Medline
Huang L, Dobkins KR (2005) Attentional effects on contrast discriminationin humans: evidence for both contrast gain and response gain. Vision Res45:1201–1212. Medline
Itthipuripat S, Garcia JO, Rungratsameetaweemana N, Sprague TC, SerencesJT (2014) Changing the spatial scope of attention alters patterns of neu-ral gain in human cortex. J Neurosci 34:112–123. CrossRef Medline
Johannes S, Muente TF, Heinze HJ, Mangun GR (1995) Luminance andspatial attention effects on early visual processing. Cogn Brain Res 2:189 –205. CrossRef
Kastner S, Pinsk MA, De Weerd P, Desimone R, Ungerleider LG (1999)Increased activity in human visual cortex during directed attention in theabsence of visual stimulation. Neuron 22:751–761. CrossRef Medline
Kim YJ, Grabowecky M, Paller KA, Muthu K, Suzuki S (2007) Attentioninduces synchronization-based response gain in steady-state visualevoked potentials. Nat Neurosci 10:117–125. CrossRef Medline
Lange JJ, Wijers AA, Mulder LJM, Mulder G (1999) ERP effects of spatialattention and display search with unilateral and bilateral stimulus dis-plays. Biol Psych 50:203–233. CrossRef
Lauritzen TZ, Ales J, Wade AR (2010) The effects of visuospatial attentionmeasured across visual cortex using source-imaged, steady-state EEG. JVis 10(14):1–17. CrossRef Medline
Lee J, Maunsell JH (2009) A normalization model of attentional modulationof single unit responses. PLoS One 4:e4651. CrossRef Medline
Lee J, Maunsell JH (2010) The effect of attention on neuronal responses to highand low contrast stimuli. J Neurophysiol 104:960–971. CrossRef Medline
Legge GE, Foley JM (1980) Contrast masking in human vision. J Opt SocAm 70:1458 –1471. CrossRef Medline
Logothetis NK (2002) The neural basis of the blood-oxygen-level-dependent functional magnetic resonance imaging signal. Philos Trans RSoc Lond B Biol Sci 357:1003–1037. CrossRef Medline
Logothetis NK (2008) What we can do and what we cannot do with fMRI.Nature 453:869 – 878. CrossRef Medline
Logothetis NK, Wandell BA (2004) Interpreting the BOLD signal. Annu RevPhysiol 66:735–769. CrossRef Medline
Luck SJ, Heinze HJ, Mangun GR, Hillyard SA (1990) Visual event-relatedpotentials index focused attention within bilateral stimulus arrays. II.Functional dissociation of P1 and N1 components. ElectroencephalogrClin Neurophysiol 75:528 –542. CrossRef Medline
Luck SJ, Chelazzi L, Hillyard SA, Desimone R (1997) Neural mechanisms ofspatial selective attention in areas V1, V2 and V4 of macaque visual cortex.J Neurophysiol 77:24 – 42. Medline
Makeig S, Westerfield M, Jung TP, Enghoff S, Townsend J, Courchesne E,Sejnowski TJ (2002) Dynamic brain sources of visual evoked responses.Science 295:690 – 694. CrossRef Medline
Mangun GR, Buck LA (1998) Sustained visual-spatial attention producescosts and benefits in response time and evoked neural activity. Neuropsy-chologia 36:189 –200. CrossRef Medline
Itthipuripat et al. • Sensory Gain Versus Efficient Readout J. Neurosci., October 1, 2014 • 34(40):13384 –13398 • 13397
Mangun GR, Hillyard SA (1987) The spatial allocation of visual attention asindexed by event-related brain potentials. Hum Factors 29:195–211. Medline
Mangun GR, Hillyard SA (1988) Spatial gradients of visual attention: be-havioral and electrophysiological evidence. Electroencephalogr Clin Neu-rophysiol 70:417– 428. CrossRef Medline
Mangun GR, Hillyard SA (1990) Allocation of visual attention to spatiallocations: tradeoff functions for event-related brain potentials and detec-tion performance. Percept Psychophys 47:532–550. CrossRef Medline
Mangun GR, Hillyard SA (1991) Modulations of sensory-evoked brain poten-tials indicate changes in perceptual processing during visual-spatial priming.J Exp Psychol Hum Percept Perform 17:1057–1074. CrossRef Medline
Martínez-Trujillo J, Treue S (2002) Attentional modulation strength in cor-tical area MT depends on stimulus contrast. Neuron 35:365–370.CrossRef Medline
McAdams CJ, Maunsell JH (1999) Effects of attention on orientation-tuning functions of single neurons in macaque cortical area V4. J Neuro-sci 19:431– 441. Medline
McMains SA, Fehd HM, Emmanouil TA, Kastner S (2007) Mechanisms offeature- and space-based attention: response modulation and baselineincreases. J Neurophysiol 98:2110 –2121. CrossRef Medline
Mitchell JF, Sundberg KA, Reynolds JH (2007) Differential attention-dependent response modulation across cell classes in macaque visual areaV4. Neuron 55:131–141. CrossRef Medline
Mitchell JF, Sundberg KA, Reynolds JH (2009) Spatial attention decorre-lates intrinsic activity fluctuations in macaque area V4. Neuron 63:879 –888. CrossRef Medline
Moran J, Desimone R (1985) Selective attention gates visual processing inthe extrastriate cortex. Science 229:782–784. CrossRef Medline
Motter BC (1993) Focal attention produces spatially selective processing invisual cortical areas V1, V2 and V4 in the presences of competing stimuli.J Neurophysiol 70:909 –919. Medline
Murakami S, Okada Y (2006) Contributions of principal neocortical neu-rons to magnetoencephalography and electroencephalography signals.J Physiol 575:925–936. CrossRef Medline
Murray SO (2008) The effects of spatial attention in early human visualcortex are stimulus independent. J Vis 8(10):2.1–2.11. CrossRef Medline
Nachmias J, Sansbury RV (1974) Letter: grating contrast: discrimination maybe better than detection. Vision Res 14:1039–1042. CrossRef Medline
Niebergall R, Khayat PS, Treue S, Martinez-Trujillo JC (2011) Expansion ofMT neurons excitatory receptive fields during covert attentive tracking.J Neurosci 31:15499 –15510. CrossRef Medline
Noesselt T, Hillyard SA, Woldorff MG, Schoenfeld A, Hagner T, Jancke L, Tem-pelmann C, Hinrichs H, Heinze HJ (2002) Delayed striate cortical activa-tion during spatial attention. Neuron 35:575–587. CrossRef Medline
O’Connell RG, Dockree PM, Kelly SP (2012) A supramodal accumulation-to-bound signal that determines perceptual decisions in humans. NatNeurosci 15:1729 –1735. CrossRef Medline
Palmer J, Verghese P, Pavel M (2000) The psychophysics of visual search.Vision Res 40:1227–1268. CrossRef Medline
Pelli DG (1985) Uncertainty explains many aspects of visual contrast detec-tion and discrimination. J Opt Soc Am 2:1508 –1532. CrossRef
Pelli DG (1997) The VideoToolbox software for visual psychophysics: trans-forming numbers into movies. Spat Vis 10:437–442. CrossRef Medline
Pestilli F, Carrasco M, Heeger DJ, Gardner JL (2011) Attentional enhance-ment via selection and pooling of early sensory responses in human visualcortex. Neuron 72:832– 846. CrossRef Medline
Pooresmaeili A, Poort J, Thiele A, Roelfsema PR (2010) Separable codes forattention and luminance contrast in the primary visual cortex. J Neurosci30:12701–12711. CrossRef Medline
Ress D, Backus BT, Heeger DJ (2000) Activity in primary visual cortex pre-dicts performance in a visual detection task. Nat Neurosci 3:940 –945.CrossRef Medline
Reynolds JH, Heeger DJ (2009) The normalization model of attention. Neu-ron 61:168 –185. CrossRef Medline
Reynolds JH, Pasternak T, Desimone R (2000) Attention increases sensitiv-ity of V4 neurons. Neuron 26:703–714. CrossRef Medline
Ross J, Speed HD, Morgan MJ (1993) The effects of adaptation and maskingon incremental thresholds for contrast. Vision Res 33:2051–2056.CrossRef Medline
Schadow J, Lenz D, Thaerig S, Busch NA, Frund I, Herrmann CS (2007)Stimulus intensity affects early sensory processing: sound intensity mod-ules auditory evoked gamma-band activity in human EEG. Int J Psycho-physiol 65:152–161. CrossRef Medline
Serences JT, Yantis S, Culberson A, Awh E (2004) Preparatory activity in visual cortexindexes distractor suppression during covert spatial orienting. J Neurophysiol92:3538–3545. CrossRef Medline
Sirotin YB, Das A (2009) Anticipatory haemodynamic signals in sensorycortex not predicted by local neuronal activity. Nature 457:475– 479.CrossRef Medline
Spekreijse H, van der Twell LH, Zuidema T (1973) Contrast evoked re-sponses in man. Vision Res 13:1577–1601. CrossRef Medline
Sprague TC, Serences JT (2013) Attention modulates spatial priority maps inthe human occipital, parietal and frontal cortices. Nat Neurosci 16:1879 –1887. CrossRef Medline
Squires KC, Hillyard SA, Lindsay PH (1973) Cortical potentials evoked byconfirming and disconfirming feedback following an auditory discrimi-nation. Percept Psychophys 13:25–31. CrossRef
Squires KC, Squires NK, Hillyard SA (1975a) Vertex evoked potentials in arating-scale detection task relation to signal probability. Behav Biol 3:21–34. Medline
Squires KC, Squires NK, Hillyard SA (1975b) Decision-related cortical poten-tials during an auditory signal detection task with cued observation intervals.J Exp Psychol Hum Percept Perform 1:268–279. CrossRef Medline
Stormer VS, McDonald JJ, Hillyard SA (2009) Cross-modal cueing of atten-tion alters appearance and early cortical processing of visual stimuli. ProcNatl Acad Sci U S A 106:22456 –22461. CrossRef Medline
Sylvester CM, Shulman GL, Jack AI, Corbetta M (2009) Anticipatory andstimulus-evoked blood oxygenation level-dependent modulations re-lated to spatial attention reflect a common additive signal. J Neurosci29:10671–10682. CrossRef Medline
Talsma D, Woldorff MG (2005) Selective attention and multisensory inte-gration: multiple phases of effects on the evoked brain activity. J CognNeurosci 17:1098 –1114. CrossRef Medline
Van Voorhis S, Hillyard SA (1977) Visual evoked potentials and selectiveattention to points in space. Percept Psychophys 22:54 – 62. CrossRef
Vassilev A, Stomonyakov V, Manahilov V (1994) Spatial-frequency specificcontrast gain and flicker masking of human transient VEP. Vision Res34:863– 872. CrossRef Medline
Viswanathan A, Freeman RD (2007) Neurometabolic coupling in cerebralcortex reflects synaptic more than spiking activity. Nat Neurosci 10:1308 –1312. CrossRef Medline
Wang J, Wade AR (2011) Differential attentional modulation of cortical re-sponses to S-cone and luminance stimuli. J Vis 11(6):1–15. CrossRef Medline
Whittingstall K, Logothetis NK (2009) Frequency-band coupling in surfaceEEG reflects spiking activity in monkey visual cortex. Neuron 64:281–289.CrossRef Medline
Williford T, Maunsell JH (2006) Effects of spatial attention on contrast responsefunctions in macaque area V4. J Neurophysiol 96:40–54. CrossRef Medline
Woldorff MG, Fox PT, Matzke M, Lancaster JL, Veeraswamy S, Zamarripa F,Seabolt M, Glass T, Gao JH, Martin CC, Jerabek P (1997) Retinotopicorganization of early visual spatial attention effects as revealed by PET andERPs. Hum Brain Mapp 5:280 –286. CrossRef Medline
Wright MJ, Johnston A (1982) The effects of contrast and length of gratings onthe visual evoked potential. Vision Res 22:1389–1399. CrossRef Medline
Zimmer U, Itthipanyanan S, Grent-‘t-Jong T, Woldorff MG (2010) Theelectrophysiological time course of the interaction of stimulus conflictand the multisensory spread of attention. Eur J Neurosci 31:1744 –1754.CrossRef Medline
13398 • J. Neurosci., October 1, 2014 • 34(40):13384 –13398 Itthipuripat et al. • Sensory Gain Versus Efficient Readout