Embed Size (px)
Citation preview
Fluent LLC <[email protected]>
Click here to Reply
loading...
Inbox
Sent
Drafts
Spam
Trash
1
CONSUMER PERCEPTIONS OF EMAIL
REVEAL MORE
T Inbox Report
he
INBOX REPORT 3
Americans are addicted to email. Thanks to the wide adoption of smartphones, we carry the internet in our pockets, always connected to updates from friends, family, and work. While we are plugged in throughout our day – from commuting to work, checking news and social media, playing games to pass the time – email remains a critical tool for marketers to deepen brand connections and generate sales.
To help marketers understand how Americans view and interact with their emails, we examined consumers’ perceptions of email marketing and their latest behaviors with email.
Based on a survey of 2,667 Americans, the report contains fresh data and insights for marketers such as how often Americans check email, what impact emails have on consumers’ purchase decisions, the motivations behind subscribing to email lists, and more.
Here are some of the key findings:
• 3 in 5 Americans say they check their email at least a few times a day, opening proverbial doors to marketers for real-time engagement.
• Mobile enables marketers to reach consumers anywhere. About 3 in 5 consumers check their email on the go and 75% of Americans say they use their smartphones most often to check email.
• Email is here to stay. Over 3 in 4 people expect to use email more or about the same five years from now.
• Email drives sales across multiple devices and channels – including offline. After seeing a marketing email, half of consumers (50%) have purchased through mobile websites, 35% on a computer, 27% in-store, and 24% through a smartphone app.
Inbox Report 2018
| INBOX REPORT 5indicates significantly higher than comparison group at 95% confidence interval
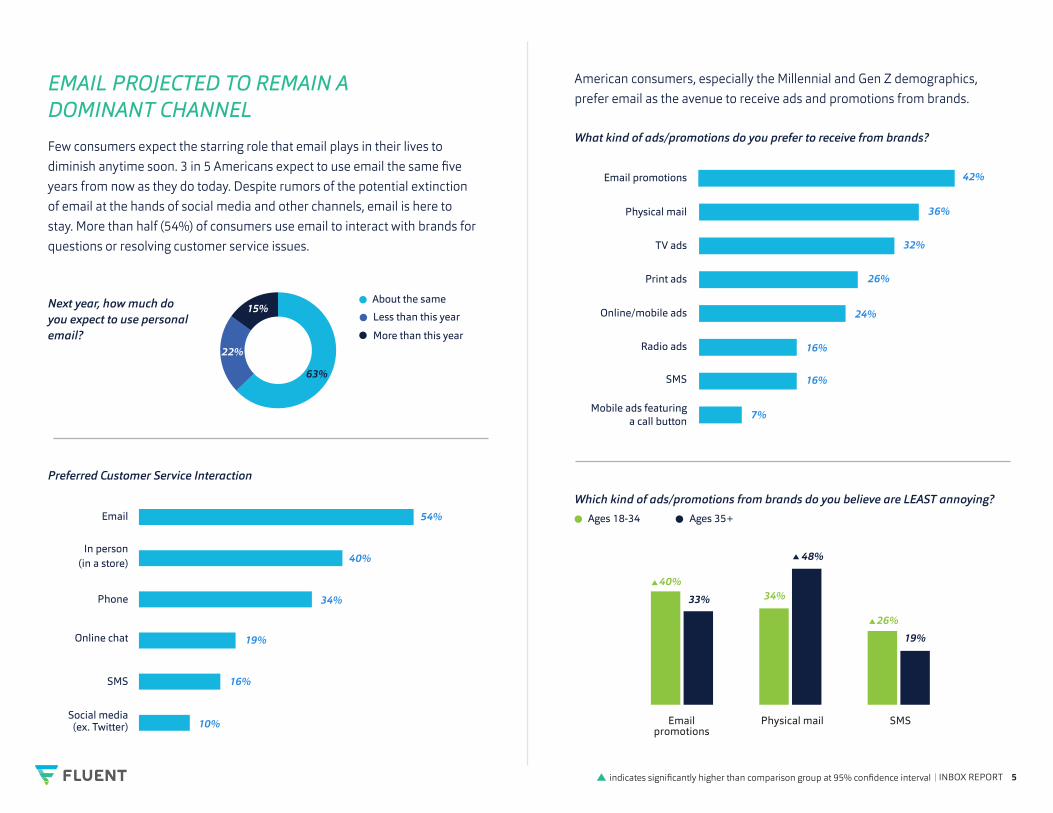
EMAIL PROJECTED TO REMAIN A DOMINANT CHANNEL
Few consumers expect the starring role that email plays in their lives to diminish anytime soon. 3 in 5 Americans expect to use email the same five years from now as they do today. Despite rumors of the potential extinction of email at the hands of social media and other channels, email is here to stay. More than half (54%) of consumers use email to interact with brands for questions or resolving customer service issues.
American consumers, especially the Millennial and Gen Z demographics, prefer email as the avenue to receive ads and promotions from brands.
Next year, how much do you expect to use personal email?
About the same
Less than this year
More than this year
Preferred Customer Service Interaction
What kind of ads/promotions do you prefer to receive from brands?
Which kind of ads/promotions from brands do you believe are LEAST annoying?Email
Email promotions
Physical mail
TV ads
Print ads
Online/mobile ads
Radio ads
SMS
Mobile ads featuring a call button
In person (in a store)
Online chat
Social media (ex. Twitter)
Phone
SMS
54%
42%
36%
32%
26%
24%
16%
16%
7%
40%
34%
19%
16%
10% Email promotions
Physical mail SMS
Ages 18-34 Ages 35+
40%34%
26%
48%
33%
19%
63%
22%
15%
| INBOX REPORT 7indicates significantly higher than comparison group at 95% confidence interval
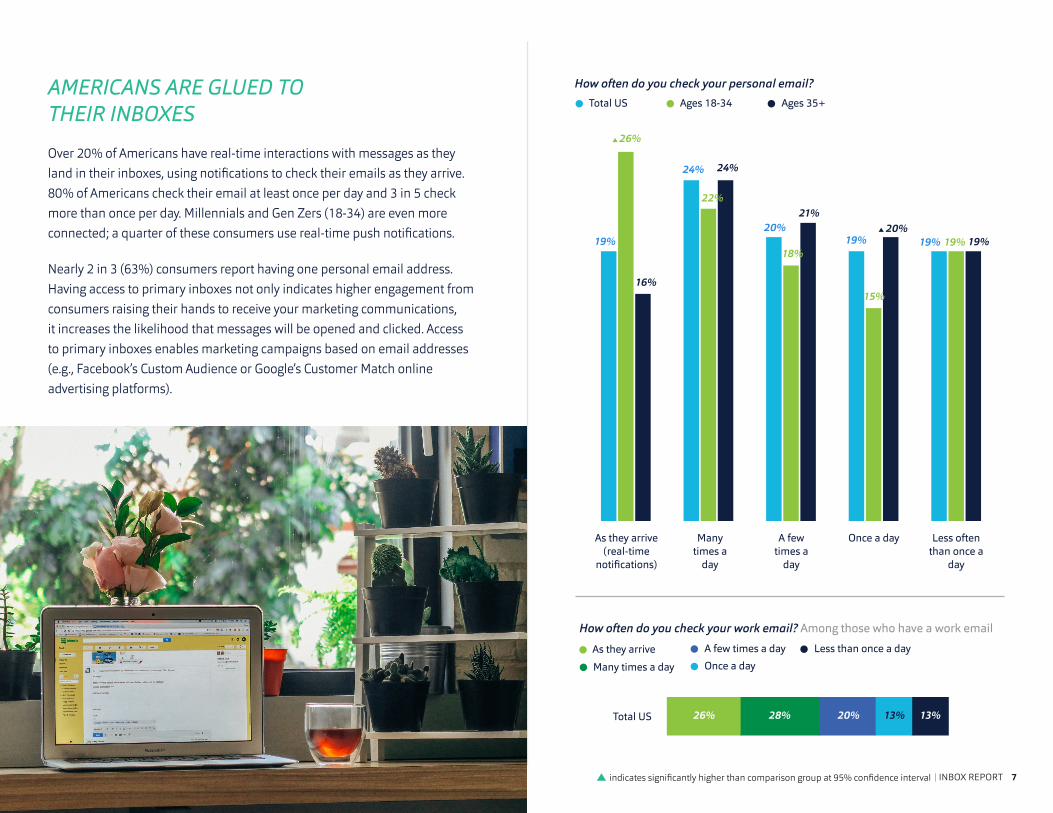
AMERICANS ARE GLUED TO THEIR INBOXES
Over 20% of Americans have real-time interactions with messages as they land in their inboxes, using notifications to check their emails as they arrive. 80% of Americans check their email at least once per day and 3 in 5 check more than once per day. Millennials and Gen Zers (18-34) are even more connected; a quarter of these consumers use real-time push notifications.
Nearly 2 in 3 (63%) consumers report having one personal email address. Having access to primary inboxes not only indicates higher engagement from consumers raising their hands to receive your marketing communications, it increases the likelihood that messages will be opened and clicked. Access to primary inboxes enables marketing campaigns based on email addresses (e.g., Facebook’s Custom Audience or Google’s Customer Match online advertising platforms).
How often do you check your personal email?
Total US
As they arrive (real-time
notifications)
Many times a
day
A few times a
day
Once a day Less often than once a
day
Ages 18-34 Ages 35+
19%20%
21%
24%
16%
19%20%
24%
19%19% 19%18%
22%
26%
15%
How often do you check your work email? Among those who have a work email
As they arrive
Many times a day
A few times a day
Once a day
Less than once a day
26% 28% 20% 13% 13%Total US
| INBOX REPORT 9indicates significantly higher than comparison group at 95% confidence interval
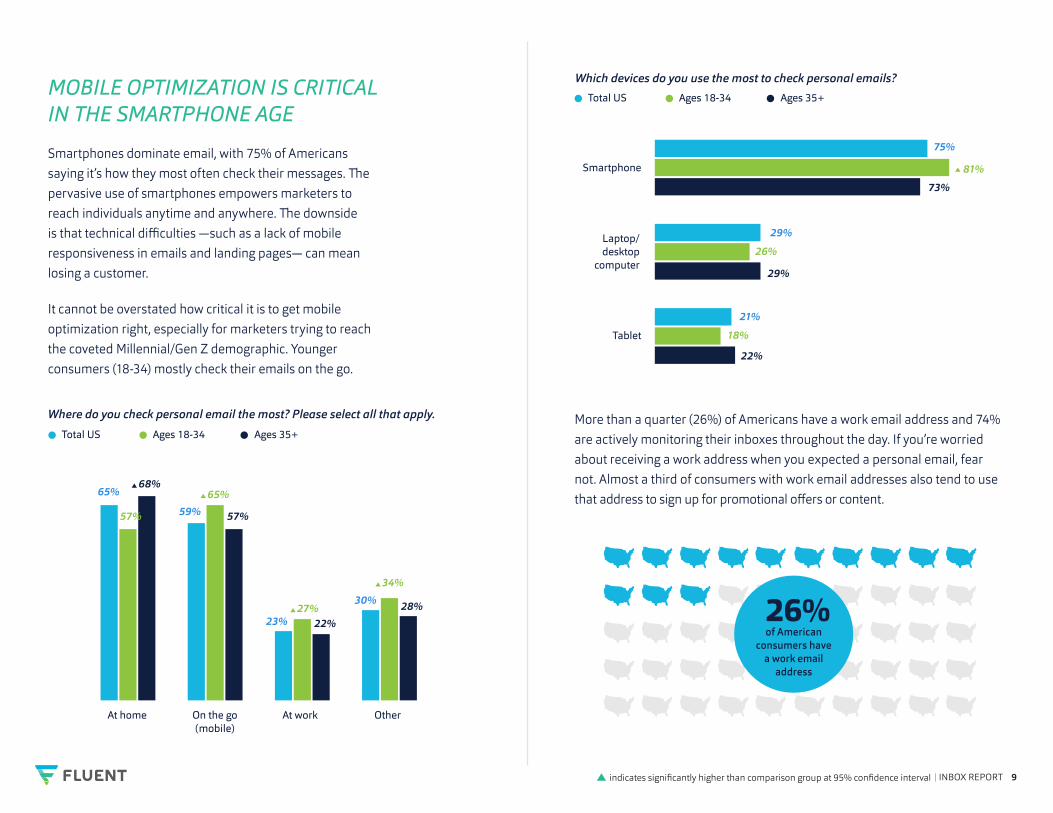
Smartphones dominate email, with 75% of Americans saying it’s how they most often check their messages. The pervasive use of smartphones empowers marketers to reach individuals anytime and anywhere. The downside is that technical difficulties —such as a lack of mobile responsiveness in emails and landing pages— can mean losing a customer.
It cannot be overstated how critical it is to get mobile optimization right, especially for marketers trying to reach the coveted Millennial/Gen Z demographic. Younger consumers (18-34) mostly check their emails on the go.
MOBILE OPTIMIZATION IS CRITICAL IN THE SMARTPHONE AGE
Where do you check personal email the most? Please select all that apply.
Which devices do you use the most to check personal emails?
Total US Ages 18-34 Ages 35+
Total US Ages 18-34 Ages 35+
65%68%
57%
65%
57%
27%22%
34%
28%
59%
23%
30%
At home
Smartphone
Tablet
Laptop/desktop
computer
On the go (mobile)
At work Other
75%
29%
21%
73%
29%
22%
81%
26%
18%
More than a quarter (26%) of Americans have a work email address and 74% are actively monitoring their inboxes throughout the day. If you’re worried about receiving a work address when you expected a personal email, fear not. Almost a third of consumers with work email addresses also tend to use that address to sign up for promotional offers or content.
of American consumers have
a work email address
26%
| INBOX REPORT 11
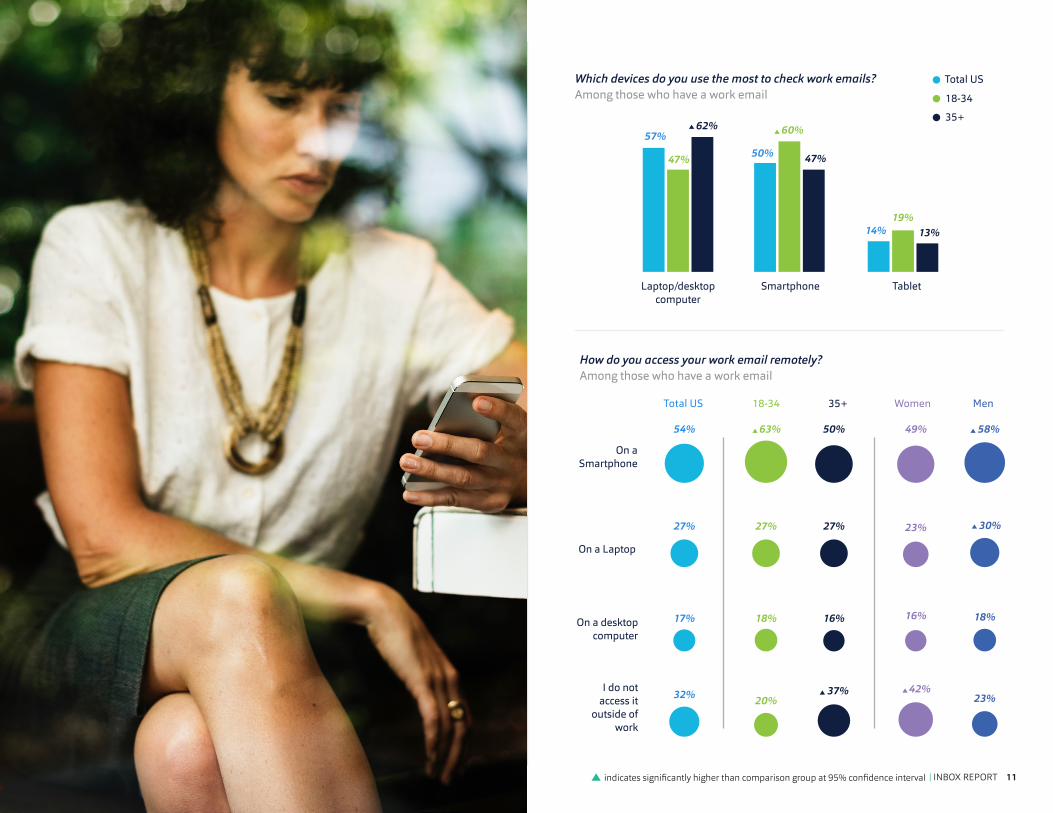
How do you access your work email remotely? Among those who have a work email
On a Laptop
On a desktop computer
I do not access it
outside of work
On a Smartphone
Total US 18-34 35+ Women Men
63%54%
27%
17%
32%
50%
27%
16%
37%
49%
23%
16%
42%
58%
30%
18%
23%
27%
18%
20%
Which devices do you use the most to check work emails? Among those who have a work email
Total US
18-34
35+
Laptop/desktop computer
Smartphone Tablet
57%50%
14%
62%
47%
13%
47%
60%
19%
indicates significantly higher than comparison group at 95% confidence interval
| INBOX REPORT 13
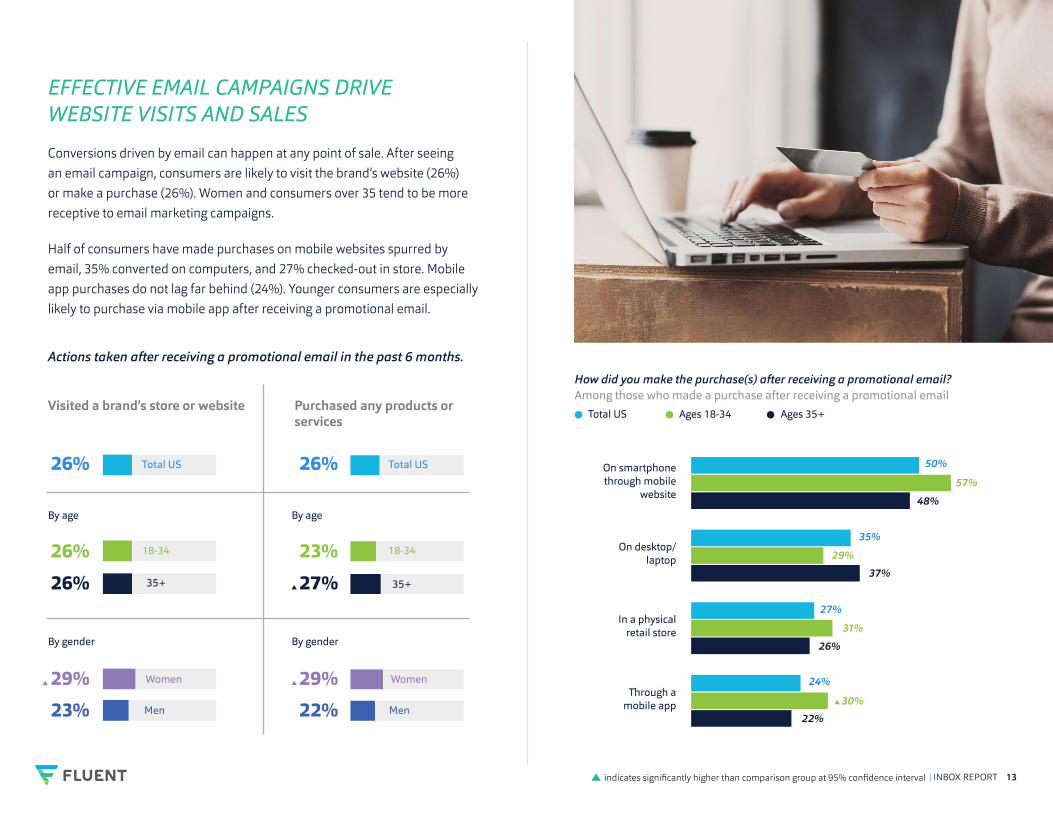
Conversions driven by email can happen at any point of sale. After seeing an email campaign, consumers are likely to visit the brand’s website (26%) or make a purchase (26%). Women and consumers over 35 tend to be more receptive to email marketing campaigns.
Half of consumers have made purchases on mobile websites spurred by email, 35% converted on computers, and 27% checked-out in store. Mobile app purchases do not lag far behind (24%). Younger consumers are especially likely to purchase via mobile app after receiving a promotional email.
EFFECTIVE EMAIL CAMPAIGNS DRIVE WEBSITE VISITS AND SALES
Actions taken after receiving a promotional email in the past 6 months.
26%
26%
26%
29%
23%
26%
23%
27%
29%
22%
Total US Total US
18-34
Purchased any products or services
Visited a brand’s store or website
18-34
35+ 35+
Women Women
Men Men
By gender By gender
By age By age
How did you make the purchase(s) after receiving a promotional email? Among those who made a purchase after receiving a promotional email
Total US Ages 18-34 Ages 35+
50%
24%
27%
35%
48%
37%
26%
22%
57%
31%
30%
29%
On smartphone through mobile
website
On desktop/laptop
In a physical retail store
Through a mobile app
indicates significantly higher than comparison group at 95% confidence interval
INBOX REPORT 15
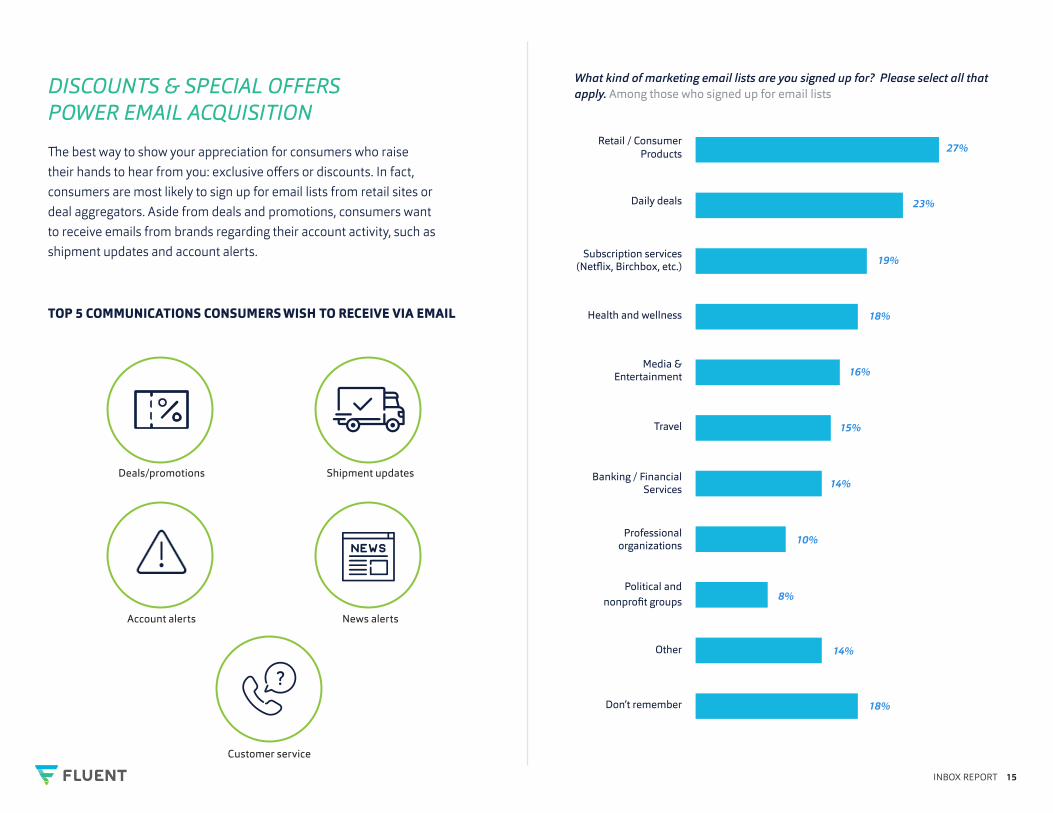
DISCOUNTS & SPECIAL OFFERS POWER EMAIL ACQUISITION
The best way to show your appreciation for consumers who raise their hands to hear from you: exclusive offers or discounts. In fact, consumers are most likely to sign up for email lists from retail sites or deal aggregators. Aside from deals and promotions, consumers want to receive emails from brands regarding their account activity, such as shipment updates and account alerts.
TOP 5 COMMUNICATIONS CONSUMERS WISH TO RECEIVE VIA EMAIL
Deals/promotions Shipment updates
Account alerts News alerts
Customer service
What kind of marketing email lists are you signed up for? Please select all that apply. Among those who signed up for email lists
Retail / Consumer Products
Daily deals
Health and wellness
Travel
Other
Don’t remember
Professional organizations
Political and nonprofit groups
Banking / Financial Services
Media & Entertainment
Subscription services (Netflix, Birchbox, etc.)
27%
23%
19%
18%
16%
15%
14%
10%
8%
14%
18%
| INBOX REPORT 17
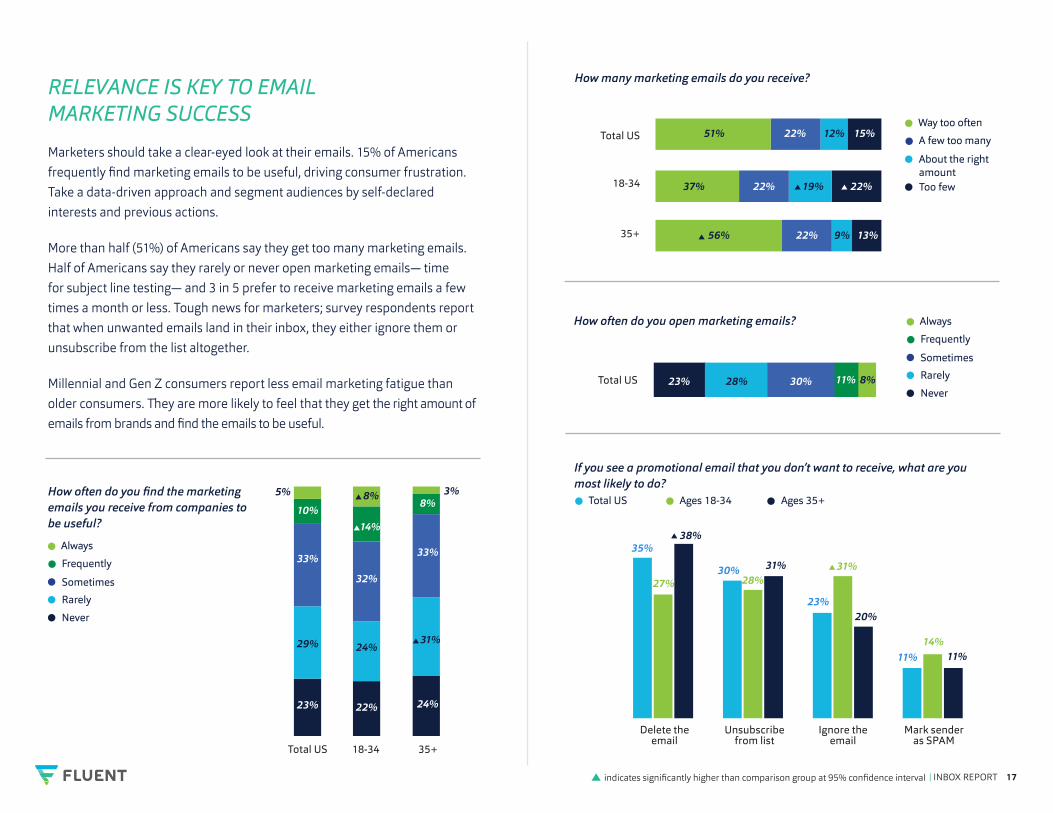
RELEVANCE IS KEY TO EMAIL MARKETING SUCCESS
Marketers should take a clear-eyed look at their emails. 15% of Americans frequently find marketing emails to be useful, driving consumer frustration. Take a data-driven approach and segment audiences by self-declared interests and previous actions.
More than half (51%) of Americans say they get too many marketing emails. Half of Americans say they rarely or never open marketing emails— time for subject line testing— and 3 in 5 prefer to receive marketing emails a few times a month or less. Tough news for marketers; survey respondents report that when unwanted emails land in their inbox, they either ignore them or unsubscribe from the list altogether.
Millennial and Gen Z consumers report less email marketing fatigue than older consumers. They are more likely to feel that they get the right amount of emails from brands and find the emails to be useful.
How often do you find the marketing emails you receive from companies to be useful?
Always
Frequently
Sometimes
Rarely
Never
10%14%
8%
33%
31%
24%
3%5%
32%
24%
8%
22%
33%
23%
29%
Total US 18-34 35+
If you see a promotional email that you don’t want to receive, what are you most likely to do?
How often do you open marketing emails?
How many marketing emails do you receive?
Always
Frequently
Sometimes
Rarely
Never
51% 22% 12% 15%
37% 22% 19% 22%
56% 22% 13%9%
Total US
Delete the email
Unsubscribe from list
Ignore the email
Mark sender as SPAM
Way too often
A few too many
About the right amountToo few
Total US
18-34
35+
8%11%30%28%23%
Total US Ages 18-34 Ages 35+
35%
30%
23%
11%
38%
31%
20%
11%
27% 28%31%
14%
indicates significantly higher than comparison group at 95% confidence interval
MOBILE OPTIMIZATION IS CRITICAL.
Smartphones are by far the most used device to access email. Mobile optimization of the purchase path can ensure that marketers reach and convert the large group of consumers who regularly check their email.
DON’T WEAR OUT YOUR WELCOME.
Most email users say they receive too many emails and it is the top reason they unsubscribe from email lists. It’s critical to aim for a “sweet spot” with your email marketing – frequent enough to spur purchases and brand awareness, but not so often that consumers unsubscribe.
CAREFULLY TAILOR YOUR MESSAGE TO THE RIGHT AUDIENCE.
With email overload causing many to unsubscribe from marketing lists, customize your offers to be relevant enough to engage your customers. Relevant emails drive sales and traffic to your website and are the antidote to consumers unsubscribing from your list.
EMAIL MARKETING IS ESPECIALLY EFFECTIVE WITH MILLENNIALS.
Email users aged 18-34 are easiest for email marketers to reach and convert into customers. Millennials are less likely to think they receive too many emails and are more likely to view email as a less annoying marketing tactic compared to direct mail or SMS.
INVEST IN EMAIL, BECAUSE IT’S NOT GOING AWAY ANYTIME SOON. Over 78% of email users say they will continue to use email about as much or more than they currently do in five years.
OUR TOP TIPS FOR EMAIL MARKETING SUCCESS Methodology:
Fluent is a data-driven marketing company. Fluent’s 2018 Inbox Report survey was conducted online within the United States by Fluent, LLC on November 28, 2017 among 2,667 adults (aged 18 and up for both waves). Due to rounding, percentages may not always add up to 100%. Fluent’s proprietary ad serving technology includes a real-time survey module that was used to facilitate the data collection for this study. Respondents were randomly selected and data was weighted to US Census 2010 population distribution. https://factfinder.census.gov/faces/nav/jsf/pages/index.xhtml

ABOUT FLUENT
Fluent (NASDAQ: FLNT) drives acquisition for growing brands. Leveraging our proprietary first party data asset, Fluent creates marketing programs that deliver better digital advertising experiences for consumers and measurable results for advertisers. Founded in 2010, the company is headquartered in New York City.
fluentco.com I [email protected] I 646.669.7272