Embed Size (px)
Citation preview
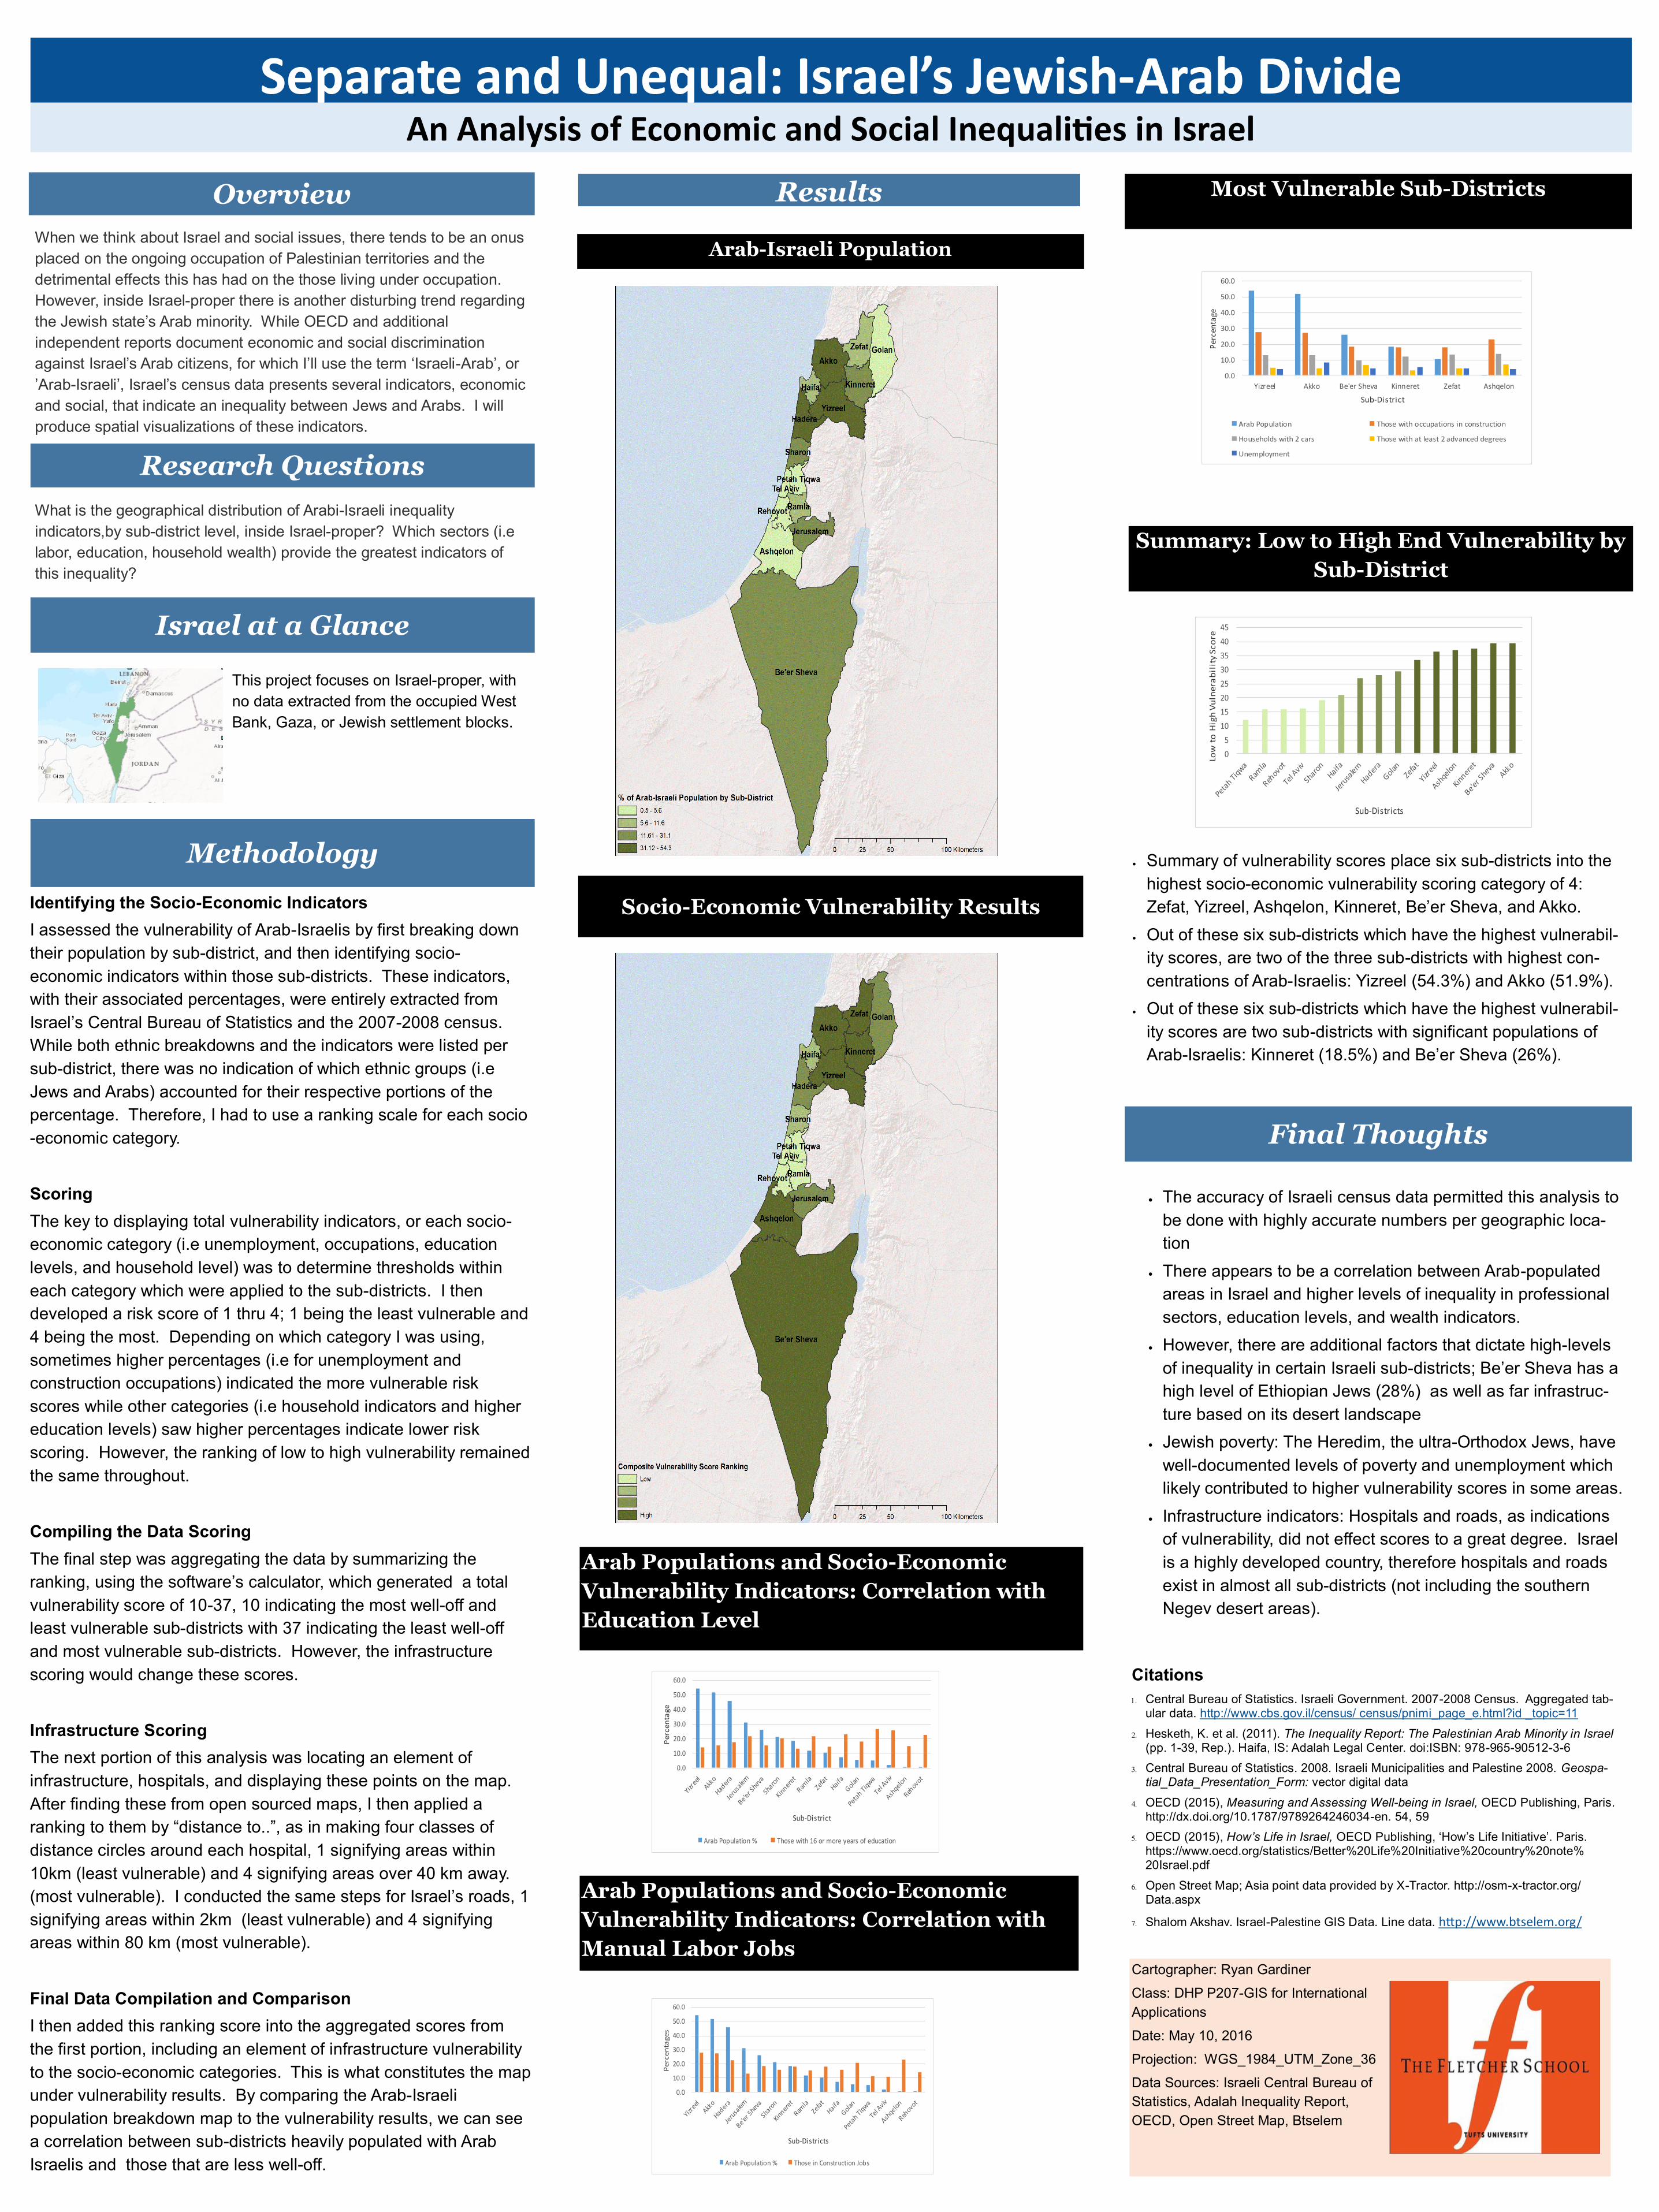
Separate and Unequal: Israel’s Jewish-Arab Divide
Cartographer: Ryan Gardiner
Class: DHP P207-GIS for International
Applications
Date: May 10, 2016
Projection: WGS_1984_UTM_Zone_36
Data Sources: Israeli Central Bureau of
Statistics, Adalah Inequality Report,
OECD, Open Street Map, Btselem
Overview
When we think about Israel and social issues, there tends to be an onus
placed on the ongoing occupation of Palestinian territories and the
detrimental effects this has had on the those living under occupation.
However, inside Israel-proper there is another disturbing trend regarding
the Jewish state’s Arab minority. While OECD and additional
independent reports document economic and social discrimination
against Israel’s Arab citizens, for which I’ll use the term ‘Israeli-Arab’, or
’Arab-Israeli’, Israel’s census data presents several indicators, economic
and social, that indicate an inequality between Jews and Arabs. I will
produce spatial visualizations of these indicators.
Research Questions
What is the geographical distribution of Arabi-Israeli inequality
indicators,by sub-district level, inside Israel-proper? Which sectors (i.e
labor, education, household wealth) provide the greatest indicators of
this inequality?
Methodology
Citations
Central Bureau of Statistics. Israeli Government. 2007-2008 Census. Aggregated tab-ular data. http://www.cbs.gov.il/census/ census/pnimi_page_e.html?id _topic=11
Hesketh, K. et al. (2011). The Inequality Report: The Palestinian Arab Minority in Israel (pp. 1-39, Rep.). Haifa, IS: Adalah Legal Center. doi:ISBN: 978-965-90512-3-6
Central Bureau of Statistics. 2008. Israeli Municipalities and Palestine 2008. Geospa-tial_Data_Presentation_Form: vector digital data
OECD (2015), Measuring and Assessing Well-being in Israel, OECD Publishing, Paris. http://dx.doi.org/10.1787/9789264246034-en. 54, 59
OECD (2015), How’s Life in Israel, OECD Publishing, ‘How’s Life Initiative’. Paris. https://www.oecd.org/statistics/Better%20Life%20Initiative%20country%20note%20Israel.pdf
Open Street Map; Asia point data provided by X-Tractor. http://osm-x-tractor.org/Data.aspx
Shalom Akshav. Israel-Palestine GIS Data. Line data. http://www.btselem.org/
An Analysis of Economic and Social Inequalities in Israel
Results
Identifying the Socio-Economic Indicators
I assessed the vulnerability of Arab-Israelis by first breaking down
their population by sub-district, and then identifying socio-
economic indicators within those sub-districts. These indicators,
with their associated percentages, were entirely extracted from
Israel’s Central Bureau of Statistics and the 2007-2008 census.
While both ethnic breakdowns and the indicators were listed per
sub-district, there was no indication of which ethnic groups (i.e
Jews and Arabs) accounted for their respective portions of the
percentage. Therefore, I had to use a ranking scale for each socio
-economic category.
Scoring
The key to displaying total vulnerability indicators, or each socio-
economic category (i.e unemployment, occupations, education
levels, and household level) was to determine thresholds within
each category which were applied to the sub-districts. I then
developed a risk score of 1 thru 4; 1 being the least vulnerable and
4 being the most. Depending on which category I was using,
sometimes higher percentages (i.e for unemployment and
construction occupations) indicated the more vulnerable risk
scores while other categories (i.e household indicators and higher
education levels) saw higher percentages indicate lower risk
scoring. However, the ranking of low to high vulnerability remained
the same throughout.
Compiling the Data Scoring
The final step was aggregating the data by summarizing the
ranking, using the software’s calculator, which generated a total
vulnerability score of 10-37, 10 indicating the most well-off and
least vulnerable sub-districts with 37 indicating the least well-off
and most vulnerable sub-districts. However, the infrastructure
scoring would change these scores.
Infrastructure Scoring
The next portion of this analysis was locating an element of
infrastructure, hospitals, and displaying these points on the map.
After finding these from open sourced maps, I then applied a
ranking to them by “distance to..”, as in making four classes of
distance circles around each hospital, 1 signifying areas within
10km (least vulnerable) and 4 signifying areas over 40 km away.
(most vulnerable). I conducted the same steps for Israel’s roads, 1
signifying areas within 2km (least vulnerable) and 4 signifying
areas within 80 km (most vulnerable).
Final Data Compilation and Comparison
I then added this ranking score into the aggregated scores from
the first portion, including an element of infrastructure vulnerability
to the socio-economic categories. This is what constitutes the map
under vulnerability results. By comparing the Arab-Israeli
population breakdown map to the vulnerability results, we can see
a correlation between sub-districts heavily populated with Arab
Israelis and those that are less well-off.
Arab-Israeli Population
Socio-Economic Vulnerability Results
Summary of vulnerability scores place six sub-districts into the
highest socio-economic vulnerability scoring category of 4:
Zefat, Yizreel, Ashqelon, Kinneret, Be’er Sheva, and Akko.
Out of these six sub-districts which have the highest vulnerabil-
ity scores, are two of the three sub-districts with highest con-
centrations of Arab-Israelis: Yizreel (54.3%) and Akko (51.9%).
Out of these six sub-districts which have the highest vulnerabil-
ity scores are two sub-districts with significant populations of
Arab-Israelis: Kinneret (18.5%) and Be’er Sheva (26%).
Arab Populations and Socio-Economic
Vulnerability Indicators: Correlation with
Education Level
Israel at a Glance
This project focuses on Israel-proper, with
no data extracted from the occupied West
Bank, Gaza, or Jewish settlement blocks.
Summary: Low to High End Vulnerability by
Sub-District
Final Thoughts
The accuracy of Israeli census data permitted this analysis to
be done with highly accurate numbers per geographic loca-
tion
There appears to be a correlation between Arab-populated
areas in Israel and higher levels of inequality in professional
sectors, education levels, and wealth indicators.
However, there are additional factors that dictate high-levels
of inequality in certain Israeli sub-districts; Be’er Sheva has a
high level of Ethiopian Jews (28%) as well as far infrastruc-
ture based on its desert landscape
Jewish poverty: The Heredim, the ultra-Orthodox Jews, have
well-documented levels of poverty and unemployment which
likely contributed to higher vulnerability scores in some areas.
Infrastructure indicators: Hospitals and roads, as indications
of vulnerability, did not effect scores to a great degree. Israel
is a highly developed country, therefore hospitals and roads
exist in almost all sub-districts (not including the southern
Negev desert areas).
Most Vulnerable Sub-Districts
0.0
10.0
20.0
30.0
40.0
50.0
60.0
Pe
rce
nta
ge
Sub-District
Arab Population % Those with 16 or more years of education
0.0
10.0
20.0
30.0
40.0
50.0
60.0
Pe
rce
nta
ge
s
Sub-Districts
Arab Population % Those in Construction Jobs
Arab Populations and Socio-Economic
Vulnerability Indicators: Correlation with
Manual Labor Jobs
0
5
10
15
20
25
30
35
40
45
Low
to
Hig
h V
uln
era
bil
ity
Sc
ore
Sub-Districts
0.0
10.0
20.0
30.0
40.0
50.0
60.0
Yizreel Akko Be'er Sheva Kinneret Zefat Ashqelon
Per
cen
tage
Sub-District
Arab Population Those with occupations in construction
Households with 2 cars Those with at least 2 advanced degrees
Unemployment