Embed Size (px)
Citation preview
Survey Highlights
FinScopeSouth Africa 2012

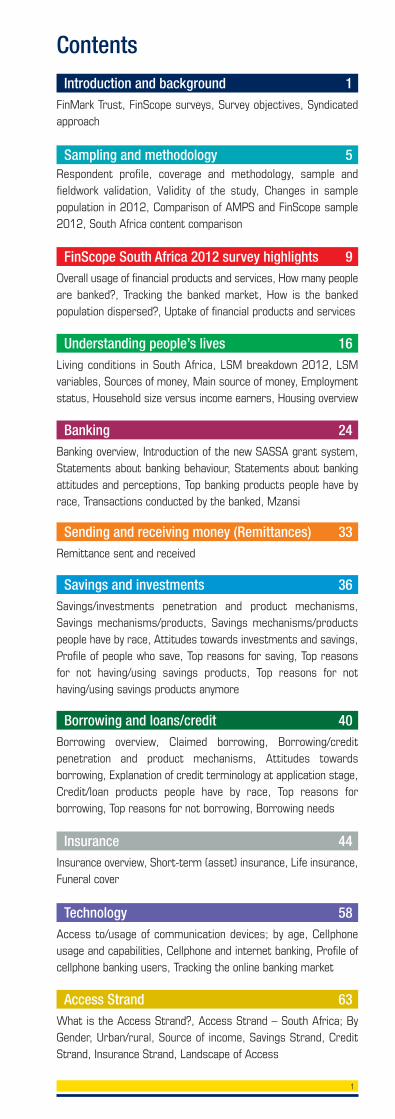
Contents
1
FinMark Trust, FinScope surveys, Survey objectives, Syndicatedapproach
Respondent profile, coverage and methodology, sample andfieldwork validation, Validity of the study, Changes in samplepopulation in 2012, Comparison of AMPS and FinScope sample2012, South Africa content comparison
Introduction and background 1
Sampling and methodology 5
Overall usage of financial products and services, How many peopleare banked?, Tracking the banked market, How is the bankedpopulation dispersed?, Uptake of financial products and services
FinScope South Africa 2012 survey highlights 9
Living conditions in South Africa, LSM breakdown 2012, LSMvariables, Sources of money, Main source of money, Employmentstatus, Household size versus income earners, Housing overview
Understanding people’s lives 16
Banking overview, Introduction of the new SASSA grant system,Statements about banking behaviour, Statements about bankingattitudes and perceptions, Top banking products people have byrace, Transactions conducted by the banked, Mzansi
Banking 24
Remittance sent and received
Sending and receiving money (Remittances) 33
Savings/investments penetration and product mechanisms,Savings mechanisms/products, Savings mechanisms/productspeople have by race, Attitudes towards investments and savings,Profile of people who save, Top reasons for saving, Top reasonsfor not having/using savings products, Top reasons for nothaving/using savings products anymore
Savings and investments 36
Borrowing overview, Claimed borrowing, Borrowing/creditpenetration and product mechanisms, Attitudes towardsborrowing, Explanation of credit terminology at application stage,Credit/loan products people have by race, Top reasons forborrowing, Top reasons for not borrowing, Borrowing needs
Borrowing and loans/credit 40
Insurance overview, Short-term (asset) insurance, Life insurance,Funeral cover
Insurance 44
Access to/usage of communication devices; by age, Cellphoneusage and capabilities, Cellphone and internet banking, Profile ofcellphone banking users, Tracking the online banking market
Technology 58
What is the Access Strand?, Access Strand – South Africa; ByGender, Urban/rural, Source of income, Savings Strand, CreditStrand, Insurance Strand, Landscape of Access
Access Strand 63
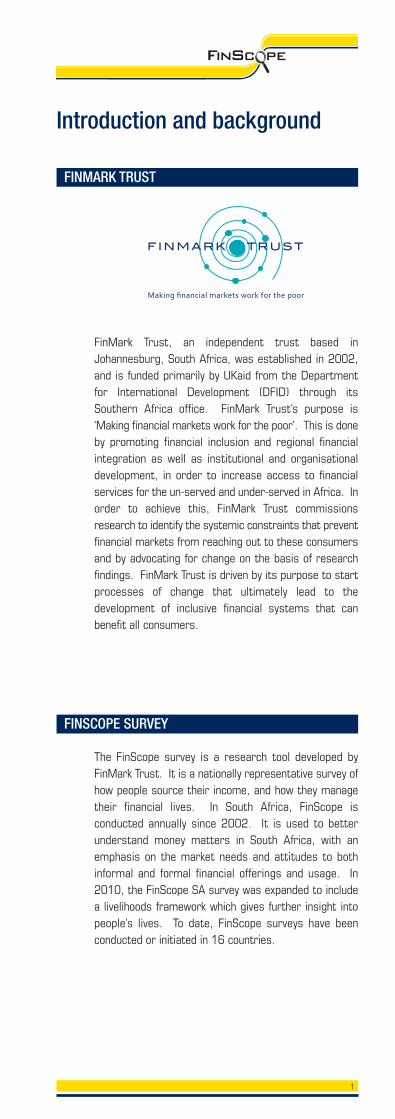
FinMark Trust, an independent trust based inJohannesburg, South Africa, was established in 2002,and is funded primarily by UKaid from the Departmentfor International Development (DFID) through itsSouthern Africa office. FinMark Trust’s purpose is‘Making financial markets work for the poor’. This is doneby promoting financial inclusion and regional financialintegration as well as institutional and organisationaldevelopment, in order to increase access to financialservices for the un-served and under-served in Africa. Inorder to achieve this, FinMark Trust commissionsresearch to identify the systemic constraints that preventfinancial markets from reaching out to these consumersand by advocating for change on the basis of researchfindings. FinMark Trust is driven by its purpose to startprocesses of change that ultimately lead to thedevelopment of inclusive financial systems that canbenefit all consumers.
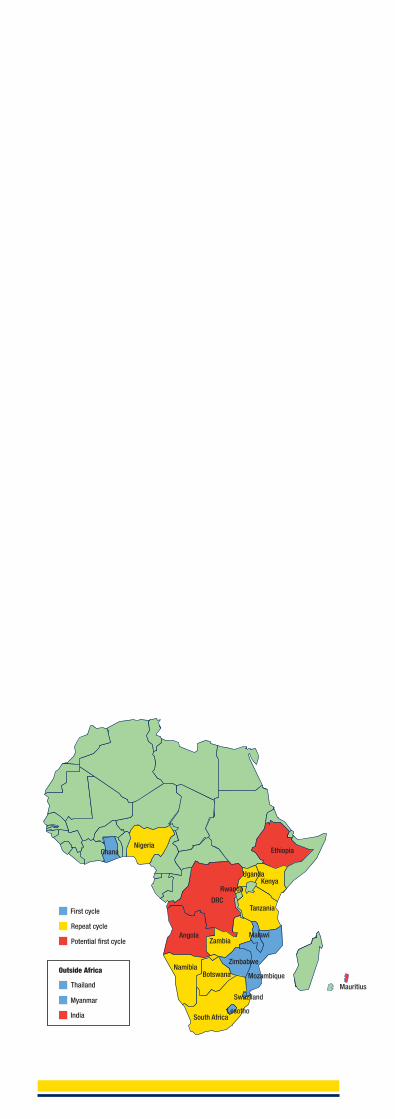
The FinScope survey is a research tool developed byFinMark Trust. It is a nationally representative survey ofhow people source their income, and how they managetheir financial lives. In South Africa, FinScope isconducted annually since 2002. It is used to betterunderstand money matters in South Africa, with anemphasis on the market needs and attitudes to bothinformal and formal financial offerings and usage. In2010, the FinScope SA survey was expanded to includea livelihoods framework which gives further insight intopeople’s lives. To date, FinScope surveys have beenconducted or initiated in 16 countries.
Introduction and background
1
FINMARK TRUST
FINSCOPE SURVEY
To measure and profile the levels of access to financialservices by all adults in South Africa, across incomeranges and other demographics, and making thisinformation available for use by key stakeholders such aspolicy-makers, regulators, and financial serviceproviders.
Information provided by the survey helps extend the reachof financial services in the country, as it provides anunderstanding of the adult population in South Africa interms of:
■ Livelihoods and how they generate their income;■ Their financial needs and/or demands;■ Their financial perceptions, attitudes, and behaviours;■ Their demographic and geographic distribution;■ The obstacles they face and the factors that would
have an influence on their financial situations;■ Current levels of access to, and utilisation of,
financial services and products (formal and/orinformal);
■ The landscape of access (i.e. types of products usedin terms of transactions, savings, credit, insuranceand remittances);
■ Drivers of financial products and service utilisation;■ Barriers to utilisation of, and access to, financial
products and services;■ The size of the market;■ The similarities and differences between different
market segments.
2
SURVEY OBJECTIVES
Since its inception in 2003, the FinScope study in SouthAfrica has followed a syndicate-funded approach,involving by design a range of stakeholders from theprivate and public sectors in the country. The syndicatemembers form an integral part in the FinScopequestionnaire design and offer valuable insight intoconsumer demand behaviour. Syndicate members alsouse the annual FinScope South Africa results to developnew products or processes and to enrich the overallobjective of increasing financial inclusion in South Africathrough a process of cross-learning and sharing ofinformation.
A SYNDICATED APPROACH
3
SOUTH AFRICA 2012 SYNDICATE MEMBERS
4
5
■ Adult population – South African residents 16 yearsand older (minimum age is defined by the age at whichindividuals can enter into a legal financial transactionin their own capacity)
Sampling and methodology
RESPONDENT PROFILE
■ Coverage: nation-wide■ Fieldwork conducted from May to July 2012■ Questionnaire translated into isiXhosa, isiZulu,
Sesotho, Setswana, Sepedi and Afrikaans■ 3 900 interviews conducted by TNS
COVERAGE AND METHODOLOGY
■ Nationally representative sample (weighted/benchmarked to Stats SA 2011 mid-year populationestimates)
■ Sample drawn systematically with ProbabilityProportional to Size (PPS).
■ Enumerator Area (EA) based, 650 EAs and sixinterviews per EA
■ To identify respondents, two further levels ofrandom sampling were applied:
❏ Households were randomly selected within eachsampled EA
❏ Individual respondents were then randomlyselected from a list of all adult members
(16 years and older)in the selected householdusing the Kish grid method
SAMPLE AND FIELDWORK VALIDATION
To ensure the comparability of data, the 2012 FinScopesurvey sample was drawn similar to previous samples(FinScope 2003 to 2011).
Dr. Ariane Neethling: “The 2012 FinScope was designedand drawn as specified by Finmark Trust. The adjustedfactors of the weights in the benchmarking of the weightedFinScope 2012 sample records were within acceptablelimits. No abnormal or unusual skewnesses or otherdeviations were found.”
VALIDITY OF THE STUDY
2012(n=3900)
2011(n=3900)
2010(n=3900)
Race % % %
Black 77 77 77
White 11 11 11
Coloured 10 9 9
Asian 3 3 3
Gender % % %
Male 47 47 48
Female 53 53 52
Age % % %
16 – 17 4 4 5
18 – 29 37 36 37
30 – 44 29 30 35
45 – 59 18 17 11
60+ 12 12 11
LSM % % %
1 – 2 4 2 5
3 – 4 18 15 16
5 – 6 52 49 42
7 – 8 14 19 19
9 – 10 12 15 18
Personal monthly income % % %
Irregular monthly income* n/a 6 11
I receive money, however notmonthly* n/a 2 2
No income 12 10 17
R1 – R999 20 14 16
R1 000 – R2 999 26 23 21
R3 000 – R7 999 10 11 10
R8 000 – R11 999 3 3 3
R12 000 – R24 999 4 3 3
R25 000+ 1 1 1
Refuse/Uncertain/Don’t know 24 27 16
6
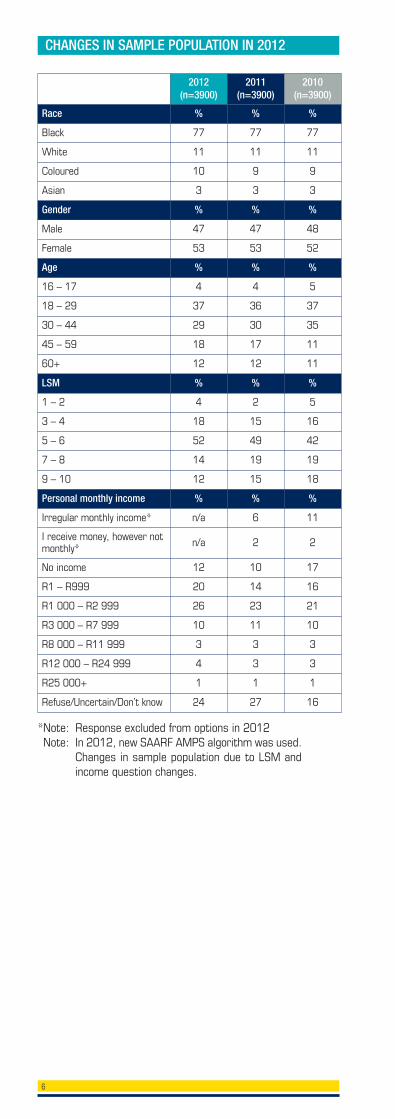
CHANGES IN SAMPLE POPULATION IN 2012
*Note: Response excluded from options in 2012*Note: In 2012, new SAARF AMPS algorithm was used.
Changes in sample population due to LSM andincome question changes.
7
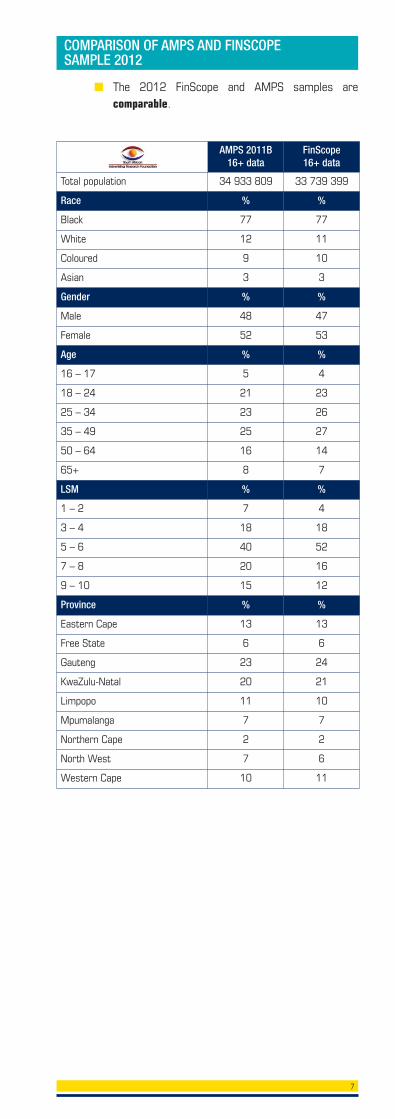
COMPARISON OF AMPS AND FINSCOPE SAMPLE 2012
AMPS 2011B16+ data
FinScope16+ data
Total population 34 933 809 33 739 399
Race % %
Black 77 77
White 12 11
Coloured 9 10
Asian 3 3
Gender % %
Male 48 47
Female 52 53
Age % %
16 – 17 5 4
18 – 24 21 23
25 – 34 23 26
35 – 49 25 27
50 – 64 16 14
65+ 8 7
LSM % %
1 – 2 7 4
3 – 4 18 18
5 – 6 40 52
7 – 8 20 16
9 – 10 15 12
Province % %
Eastern Cape 13 13
Free State 6 6
Gauteng 23 24
KwaZulu-Natal 20 21
Limpopo 11 10
Mpumalanga 7 7
Northern Cape 2 2
North West 7 6
Western Cape 10 11
■ The 2012 FinScope and AMPS samples arecomparable.
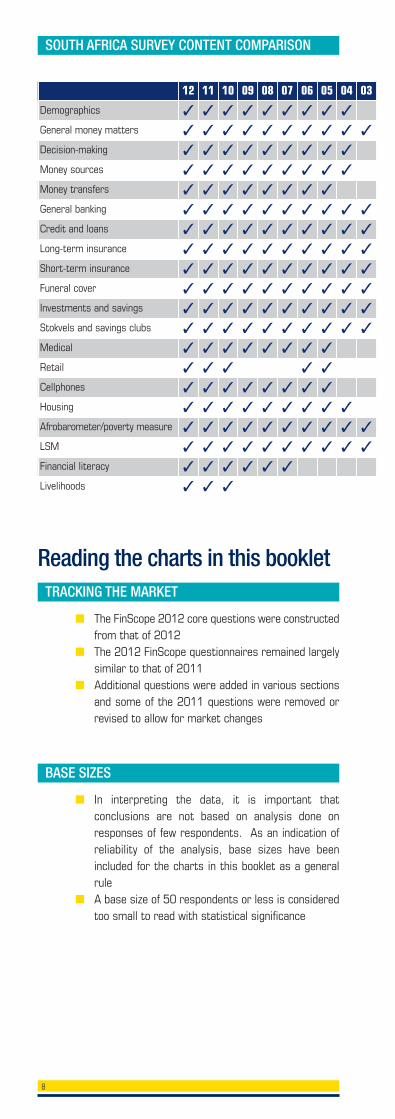
■ The FinScope 2012 core questions were constructedfrom that of 2012
■ The 2012 FinScope questionnaires remained largelysimilar to that of 2011
■ Additional questions were added in various sectionsand some of the 2011 questions were removed orrevised to allow for market changes
Reading the charts in this booklet
■ In interpreting the data, it is important thatconclusions are not based on analysis done onresponses of few respondents. As an indication ofreliability of the analysis, base sizes have beenincluded for the charts in this booklet as a generalrule
■ A base size of 50 respondents or less is consideredtoo small to read with statistical significance
8
12 11 10 09 08 07 06 05 04 03
Demographics ✓ ✓ ✓ ✓ ✓ ✓ ✓ ✓ ✓
General money matters ✓ ✓ ✓ ✓ ✓ ✓ ✓ ✓ ✓ ✓
Decision-making ✓ ✓ ✓ ✓ ✓ ✓ ✓ ✓ ✓
Money sources ✓ ✓ ✓ ✓ ✓ ✓ ✓ ✓ ✓
Money transfers ✓ ✓ ✓ ✓ ✓ ✓ ✓ ✓
General banking ✓ ✓ ✓ ✓ ✓ ✓ ✓ ✓ ✓ ✓
Credit and loans ✓ ✓ ✓ ✓ ✓ ✓ ✓ ✓ ✓ ✓
Long-term insurance ✓ ✓ ✓ ✓ ✓ ✓ ✓ ✓ ✓ ✓
Short-term insurance ✓ ✓ ✓ ✓ ✓ ✓ ✓ ✓ ✓ ✓
Funeral cover ✓ ✓ ✓ ✓ ✓ ✓ ✓ ✓ ✓ ✓
Investments and savings ✓ ✓ ✓ ✓ ✓ ✓ ✓ ✓ ✓ ✓
Stokvels and savings clubs ✓ ✓ ✓ ✓ ✓ ✓ ✓ ✓ ✓ ✓
Medical ✓ ✓ ✓ ✓ ✓ ✓ ✓ ✓
Retail ✓ ✓ ✓ ✓ ✓
Cellphones ✓ ✓ ✓ ✓ ✓ ✓ ✓ ✓
Housing ✓ ✓ ✓ ✓ ✓ ✓ ✓ ✓ ✓
Afrobarometer/poverty measure ✓ ✓ ✓ ✓ ✓ ✓ ✓ ✓ ✓ ✓
LSM ✓ ✓ ✓ ✓ ✓ ✓ ✓ ✓ ✓ ✓
Financial literacy ✓ ✓ ✓ ✓ ✓ ✓
Livelihoods ✓ ✓ ✓
SOUTH AFRICA SURVEY CONTENT COMPARISON
TRACKING THE MARKET
BASE SIZES
9
FinScope South Africa 2012Survey Highlights
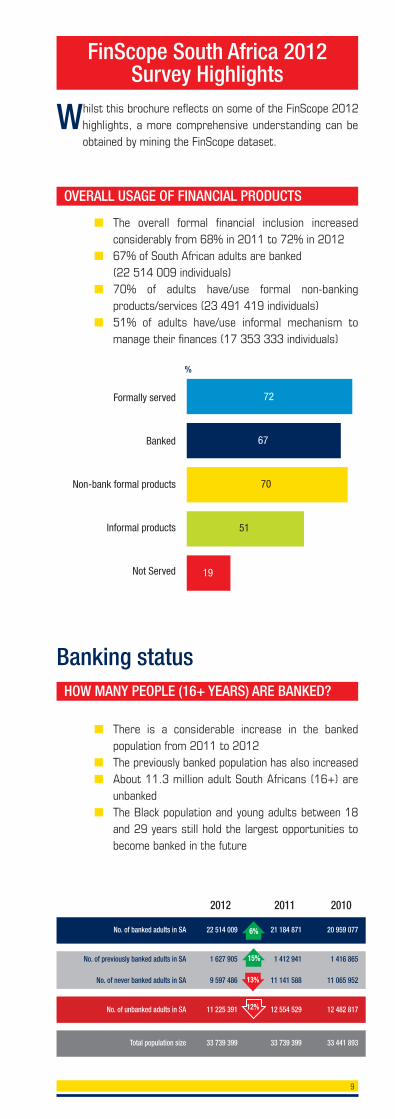
■ The overall formal financial inclusion increasedconsiderably from 68% in 2011 to 72% in 2012
■ 67% of South African adults are banked (22 514 009 individuals)■ 70% of adults have/use formal non-banking
products/services (23 491 419 individuals)■ 51% of adults have/use informal mechanism to
manage their finances (17 353 333 individuals)
OVERALL USAGE OF FINANCIAL PRODUCTS
Whilst this brochure reflects on some of the FinScope 2012highlights, a more comprehensive understanding can beobtained by mining the FinScope dataset.
Formally served
Banked
Non-bank formal products
Informal products
Not Served
%
72
67
70
51
19
■ There is a considerable increase in the bankedpopulation from 2011 to 2012
■ The previously banked population has also increased■ About 11.3 million adult South Africans (16+) are
unbanked■ The Black population and young adults between 18
and 29 years still hold the largest opportunities tobecome banked in the future
Banking statusHOW MANY PEOPLE (16+ YEARS) ARE BANKED?
2012 2011 2010
No. of banked adults in SA
No. of previously banked adults in SA
No. of never banked adults in SA
No. of unbanked adults in SA
Total population size
22 514 009
1 627 905
9 597 486
11 225 391
33 739 399
21 184 871
1 412 941
11 141 588
12 554 529
33 739 399
20 959 077
1 416 865
11 065 952
12 482 817
33 441 893
13%
6%
15%
12%
10
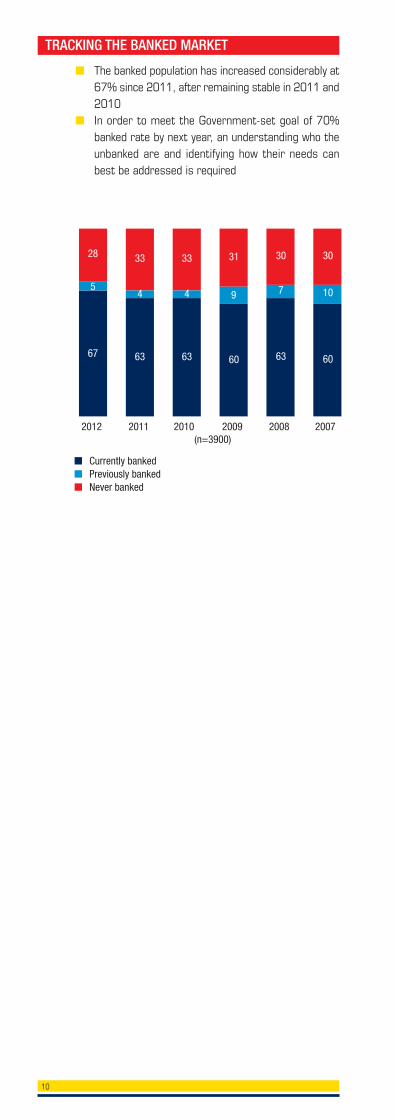
■ The banked population has increased considerably at67% since 2011, after remaining stable in 2011 and2010
■ In order to meet the Government-set goal of 70%banked rate by next year, an understanding who theunbanked are and identifying how their needs canbest be addressed is required
TRACKING THE BANKED MARKET
2012 2011 2010 2009 2008 2007(n=3900)
67
54 4 9
28 33 33 31 30 30
7 10
63 63 60 63 60
■ Currently banked■ Previously banked■ Never banked
11
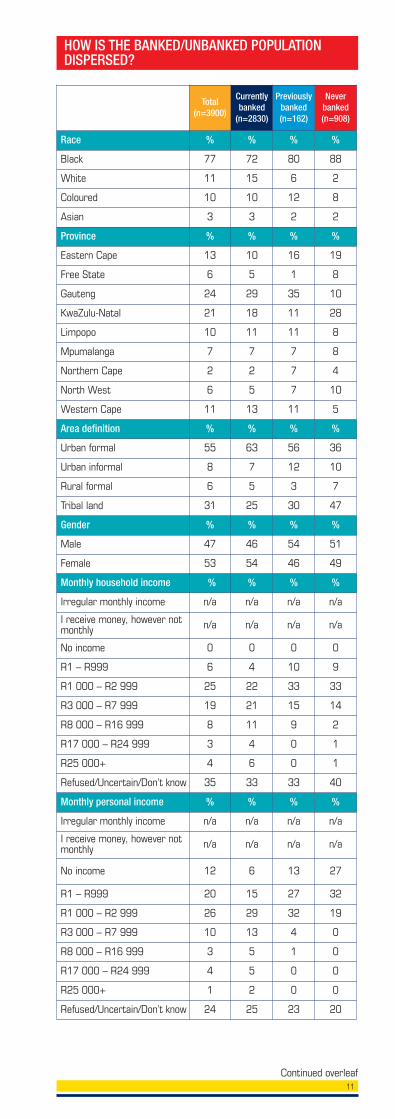
HOW IS THE BANKED/UNBANKED POPULATIONDISPERSED?
Total(n=3900)
Currentlybanked
(n=2830)
Previouslybanked(n=162)
Neverbanked(n=908)
Race % % % %
Black 77 72 80 88
White 11 15 6 2
Coloured 10 10 12 8
Asian 3 3 2 2
Province % % % %
Eastern Cape 13 10 16 19
Free State 6 5 1 8
Gauteng 24 29 35 10
KwaZulu-Natal 21 18 11 28
Limpopo 10 11 11 8
Mpumalanga 7 7 7 8
Northern Cape 2 2 7 4
North West 6 5 7 10
Western Cape 11 13 11 5
Area definition % % % %
Urban formal 55 63 56 36
Urban informal 8 7 12 10
Rural formal 6 5 3 7
Tribal land 31 25 30 47
Gender % % % %
Male 47 46 54 51
Female 53 54 46 49
Monthly household income % % % %
Irregular monthly income n/a n/a n/a n/a
I receive money, however notmonthly n/a n/a n/a n/a
No income 0 0 0 0
R1 – R999 6 4 10 9
R1 000 – R2 999 25 22 33 33
R3 000 – R7 999 19 21 15 14
R8 000 – R16 999 8 11 9 2
R17 000 – R24 999 3 4 0 1
R25 000+ 4 6 0 1
Refused/Uncertain/Don’t know 35 33 33 40
Monthly personal income % % % %
Irregular monthly income n/a n/a n/a n/a
I receive money, however notmonthly n/a n/a n/a n/a
No income 12 6 13 27
R1 – R999 20 15 27 32
R1 000 – R2 999 26 29 32 19
R3 000 – R7 999 10 13 4 0
R8 000 – R16 999 3 5 1 0
R17 000 – R24 999 4 5 0 0
R25 000+ 1 2 0 0
Refused/Uncertain/Don’t know 24 25 23 20
Continued overleaf
12
Total(n=3900)
Currentlybanked
(n=2830)
Previouslybanked(n=162)
Neverbanked(n=908)
Age % % % %
16 – 17 4 1 0 12
18 – 29 37 32 26 51
30 – 44 29 34 34 18
45 – 59 18 20 25 12
60+ 12 13 14 7
Education % % % %
No schooling 2 2 2 4
Primary school 11 9 20 15
Some high school 39 32 59 54
Matric 37 43 19 24
Apprenticeship 2 2 0 0
Diploma 5 8 0 1
University Degree 3 5 0 0
Other 0 0 1 0
Living Standards Measure % % % %
LSM 1 – 2 4 3 5 6
LSM 3 – 4 18 12 23 31
LSM 5 – 6 52 51 57 56
LSM 7 – 8 14 18 10 6
LSM 9 – 10 12 17 5 2
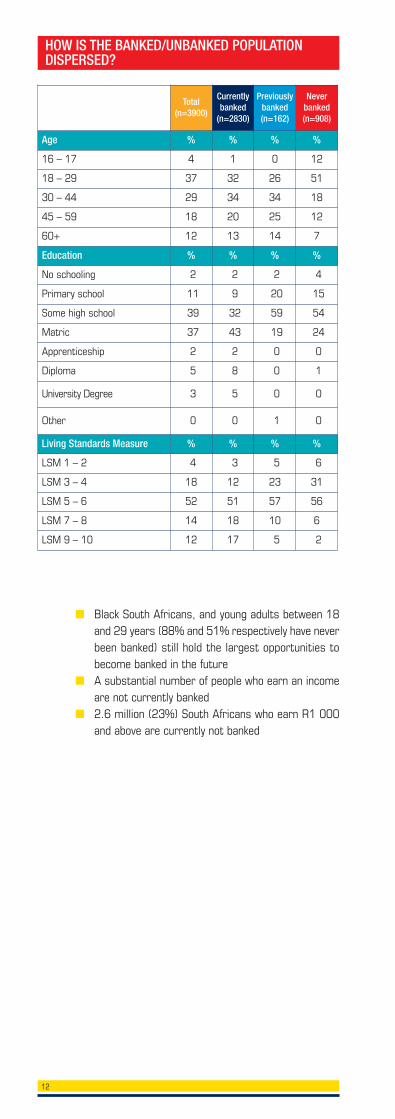
■ Black South Africans, and young adults between 18and 29 years (88% and 51% respectively have neverbeen banked) still hold the largest opportunities tobecome banked in the future
■ A substantial number of people who earn an incomeare not currently banked
■ 2.6 million (23%) South Africans who earn R1 000and above are currently not banked
HOW IS THE BANKED/UNBANKED POPULATIONDISPERSED?
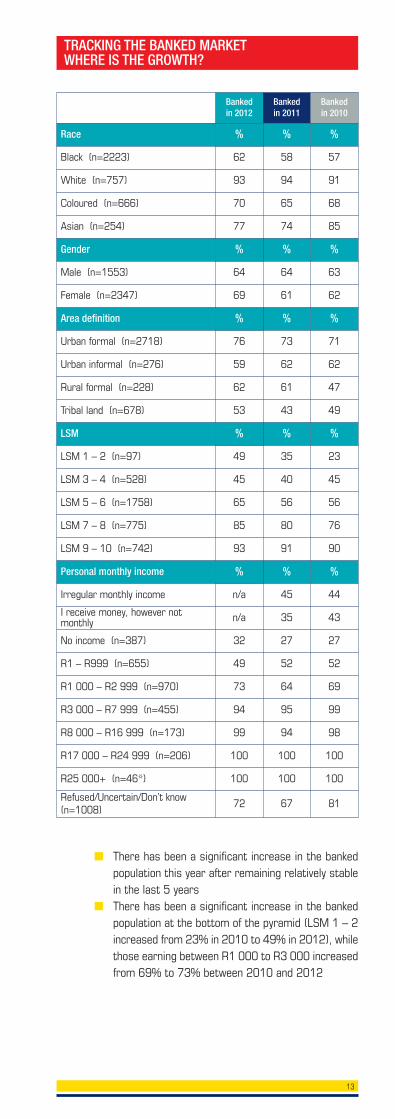
■ There has been a significant increase in the bankedpopulation this year after remaining relatively stablein the last 5 years
■ There has been a significant increase in the bankedpopulation at the bottom of the pyramid (LSM 1 – 2increased from 23% in 2010 to 49% in 2012), whilethose earning between R1 000 to R3 000 increasedfrom 69% to 73% between 2010 and 2012
TRACKING THE BANKED MARKETWHERE IS THE GROWTH?
Bankedin 2012
Bankedin 2011
Bankedin 2010
Race % % %
Black (n=2223) 62 58 57
White (n=757) 93 94 91
Coloured (n=666) 70 65 68
Asian (n=254) 77 74 85
Gender % % %
Male (n=1553) 64 64 63
Female (n=2347) 69 61 62
Area definition % % %
Urban formal (n=2718) 76 73 71
Urban informal (n=276) 59 62 62
Rural formal (n=228) 62 61 47
Tribal land (n=678) 53 43 49
LSM % % %
LSM 1 – 2 (n=97) 49 35 23
LSM 3 – 4 (n=528) 45 40 45
LSM 5 – 6 (n=1758) 65 56 56
LSM 7 – 8 (n=775) 85 80 76
LSM 9 – 10 (n=742) 93 91 90
Personal monthly income % % %
Irregular monthly income n/a 45 44
I receive money, however notmonthly n/a 35 43
No income (n=387) 32 27 27
R1 – R999 (n=655) 49 52 52
R1 000 – R2 999 (n=970) 73 64 69
R3 000 – R7 999 (n=455) 94 95 99
R8 000 – R16 999 (n=173) 99 94 98
R17 000 – R24 999 (n=206) 100 100 100
R25 000+ (n=46*) 100 100 100
Refused/Uncertain/Don’t know(n=1008)
72 67 81
13

* Question changed – similar to 2009** Questionnaire restructured to probe into burial societies and usage of stokvels and saving clubs
Financial services consumption
2012 2011 2010 2009 2008 2007
Financial services consumption 67% 63% 63% 60% 63% 60%
ATM card n/a 52 57 55 58 55
*ATM card/Debit card 61 52 57 55 58 55
Debit/cheque card n/a 37 39 33 27 25
*Savings account 39 n/a n/a n/a n/a n/a
*Transaction account 6 n/a n/a n/a n/a n/a
Savings/transaction account n/a 30 34 36 38 43
Mzansi account 6 10 15 13 11 10
Current/cheque account 9 8 10 9 9 8
Cellphone banking 13 8 12 4 4 4
Deposit account 8 7 6 5 6 5
Credit card 8 6 7 8 9 9
Internet banking 7 6 7 4 4 4
Home loan 6 5 5 5 5 6
Personal loan from a big bank 3 5 5 3 3 4
Bank vehicle finance 4 4 5 4 3 3
Postbank savings/transaction account 2 4 4 3 3 4
Savings book at bank 2 4 4 3 3 3
Overdraft 3 3 3 3 2 2
Personal garage card/petrol card 2 2 2 2 3 2
Money market account n/a 2 2 1 1 1
Call account 1 2 1 1 1 0
Credit and loan products held – formal 25% 24% 24% 24% 16% 26%
Store card or account 18 17 10 19 9 16
Credit card 8 6 7 8 5 9
Home loan 6 5 5 5 5 6
Vehicle finance through bank or dealer 4 4 5 4 3 3
Personal loan from a big bank 3 5 5 3 3 4
Overdraft facility 3 3 3 3 2 2
Personal loan from a smaller bank n/a 1 1 1 1 1
Personal loan from a retail store 1 1 1 3 2 5
Credit and loan products held – informal 15% 15% 12% 14% 13% 8%
Borrowing from a friend or family 12 18 9 12 11 5
Borrowing from a colleague 1 3 n/a n/a n/a n/a
Borrowing from a local spaza 1 2 2 1 1 1
Borrowing from a mashonisa/loan shark 1 1 1 2 1 n/a
Borrowing from a stokvel/umgalelo/savings club 3 1 1 1 1 1
Borrowing from an employer 1 1 1 0 1 1
Borrowing from or arrangement with pawn shop 0 0 0 0 0 n/a
Funeral 43% 38% 46% 40% 43% 46%
**Belong to a burial society 29 12 16 20 25 29
Funeral policy with a bank 8 10 12 12 8 7
Funeral cover through anundertaker/funeral parlour 10 9 10 8 9 9
Funeral policy with an insurancecompany 7 8 12 8 8 8
Funeral cover from a funeral home 4 5 5 5 3 0
Funeral cover from any other provider n/a 5 5 2 3 0
Funeral cover from a shop or store 2 2 3 3 0 0
Funeral cover from current employer orunion 2 2 3 1 1 2
Funeral policy through a cellphonecompany n/a 1 1 0 0 0
14
■ These tables indicate the extent of general uptake offinancial products and services – both formal andinformal
2012 2011 2010 2009 2008 2007
Investment and savings products – formal 13% 17% 17% 11% 10% 11%
Investment/savings policy 4 7 8 5 5 4
Deposit account 8 7 6 5 6 5
Education policy/plan 2 2 4 2 3 3
Savings book at bank 2 4 4 3 3 3
Endowment policy with or withoutdeath/disability cover
1 2 2 3 4 3
Unit trust 1 1 2 1 1 1
Shares on the stock exchange 1 0 1 0 1 1
Cooperative or village bank savings 0 0 0 0 0 1
Investment and savings products – savings club 18% 12% 13% 20% 15% 13%
Keep cash or savings at home 9 10 7 13 8 7
**Stokvel/savings club 12 4 7 8 9 6
Giving money to someone for safe keeping 2 2 1 2 1 1
Long-term insurance products held 17% 19% 26% 15% 14% 10%
Life insurance/life cover 12 14 19 14 12 10
Medical aid/scheme 8 9 14 10 8 9
Insurance that pays your loan orborrowing when you die 1 3 4 6 7 n/a
Accidental death and disability cover n/a 6 8 4 5 n/a
Disability insurance/cover 4 5 5 3 4 4
Personal accident insurance/cover 4 5 5 2 3 n/a
Loss of earnings insurance 2 2 2 3 3 1
Hospital cash plan 2 3 2 2 2 2
Dreaded disease insurance 3 3 2 1 1 1
Professional indemnity cover 0 1 1 0 0 1
Short-term insurance product held 10% 11% 11% 15% 14% 10%
Vehicle insurance 7 7 11 7 7 7
Household content 5 7 9 6 6 5
Insurance on house structure 4 5 7 5 5 3
Cellphone insurance 3 3 5 3 4 2
Insurance for hand tools or agricultureequipment
0 1 1 1 1 0
Investment and savings products 17% 16% 18% 14% 13% 13%
Pension fund 12 11 13 11 9 8
Provident fund 10 9 12 8 6 5
Retirement annuity 9 9 10 7 6 n/a
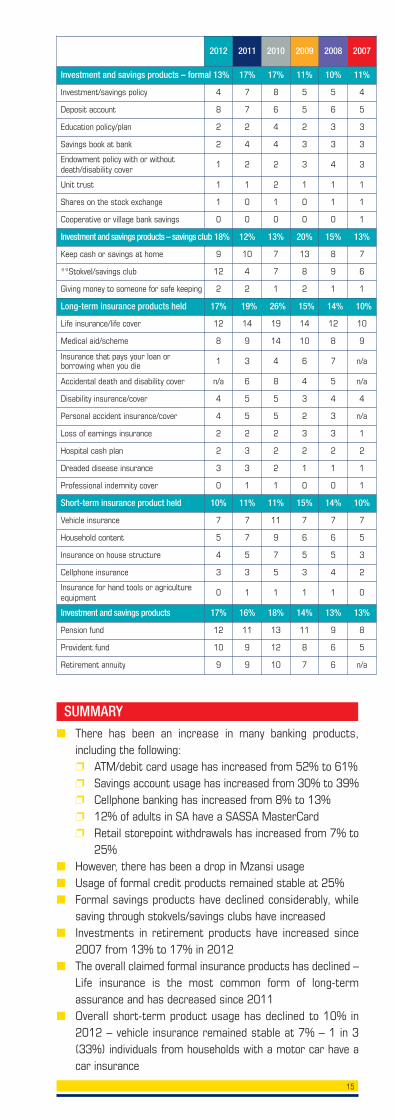
■ There has been an increase in many banking products,including the following:
❐ ATM/debit card usage has increased from 52% to 61% ❐ Savings account usage has increased from 30% to 39% ❐ Cellphone banking has increased from 8% to 13% ❐ 12% of adults in SA have a SASSA MasterCard ❐ Retail storepoint withdrawals has increased from 7% to
25%■ However, there has been a drop in Mzansi usage■ Usage of formal credit products remained stable at 25%■ Formal savings products have declined considerably, while
saving through stokvels/savings clubs have increased■ Investments in retirement products have increased since
2007 from 13% to 17% in 2012■ The overall claimed formal insurance products has declined –
Life insurance is the most common form of long-termassurance and has decreased since 2011
■ Overall short-term product usage has declined to 10% in2012 – vehicle insurance remained stable at 7% – 1 in 3(33%) individuals from households with a motor car have acar insurance
SUMMARY
15
16
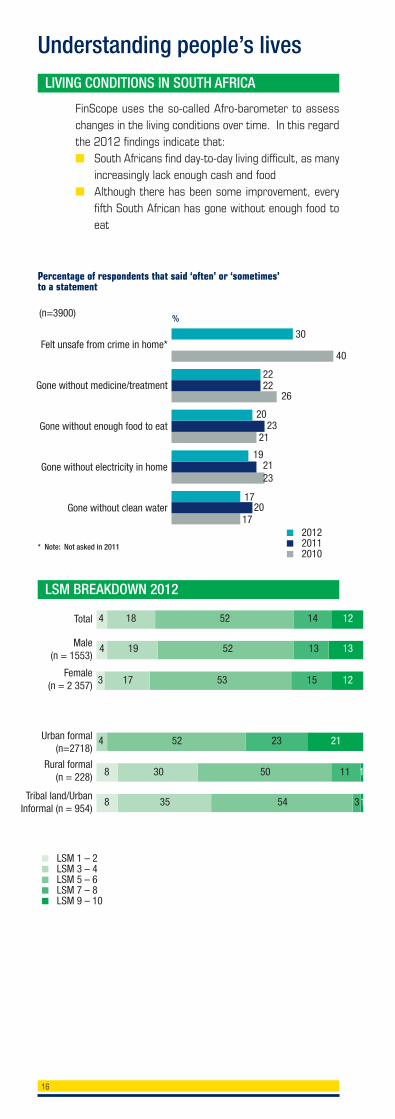
Understanding people’s lives
FinScope uses the so-called Afro-barometer to assesschanges in the living conditions over time. In this regardthe 2012 findings indicate that:■ South Africans find day-to-day living difficult, as many
increasingly lack enough cash and food■ Although there has been some improvement, every
fifth South African has gone without enough food toeat
LIVING CONDITIONS IN SOUTH AFRICA
Felt unsafe from crime in home*
Gone without medicine/treatment
Gone without enough food to eat
Gone without electricity in home
Gone without clean water
Total
Male(n = 1553)
Female(n = 2 357)
Urban formal(n=2718)
Rural formal(n = 228)
Tribal land/UrbanInformal (n = 954)
%
30
2222
26
2023
21
192123
1720
17
40
■ 2012■ 2011■ 2010
■ LSM 1 – 2■ LSM 3 – 4■ LSM 5 – 6■ LSM 7 – 8■ LSM 9 – 10
Percentage of respondents that said ‘often’ or ‘sometimes’to a statement
(n=3900)
LSM BREAKDOWN 2012
* Note: Not asked in 2011
4 18 52 14 12
4 19 52 13 13
3 17 53 15 12
4 52 23 21
8 30 50 11 1
8 35 54 31
17
2012(n=3900)
%
TV set(s) 86
Electric stove 84
Fridge with/without freezer 78
Flush toilet in house/on plot 61
Microwave oven 57
Built-in kitchen sink 46
More than 1 radio excluding car radio 23
Hot running water 31
Washing machine 36
Home theatre system 33
Computer/laptop at home 17
Vacuum cleaner/Floor polisher 15
Home security service 12
Telkom telephone 9
Tumble dryer 9
Deep freezer 25
Water in home/on stand 81
M-Net and/or DStv 31
Dishwashing machine 4
Metropolitan area 47
DVD player 57
House/cluster/townhouse 69
1/more motor vehicles 24
Domestic servant 10
Two cellphones in household 28
Three or more cellphones in household 45
Air Conditioner 6
Live anywhere in GP or WP, non-rural area 41
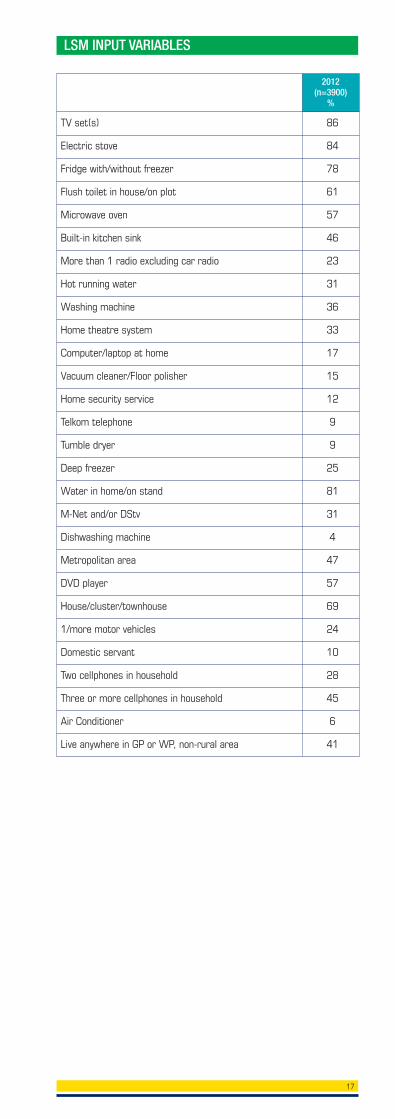
LSM INPUT VARIABLES
18
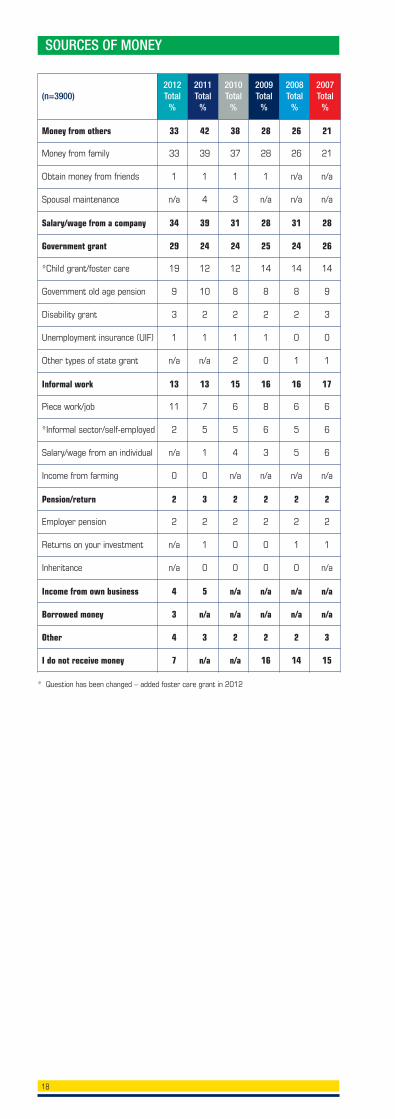
SOURCES OF MONEY
(n=3900)2012Total
%
2011Total
%
2010Total
%
2009 Total
%
2008 Total
%
2007 Total
%
Money from others 33 42 38 28 26 21
Money from family 33 39 37 28 26 21
Obtain money from friends 1 1 1 1 n/a n/a
Spousal maintenance n/a 4 3 n/a n/a n/a
Salary/wage from a company 34 39 31 28 31 28
Government grant 29 24 24 25 24 26
*Child grant/foster care 19 12 12 14 14 14
Government old age pension 9 10 8 8 8 9
Disability grant 3 2 2 2 2 3
Unemployment insurance (UIF) 1 1 1 1 0 0
Other types of state grant n/a n/a 2 0 1 1
Informal work 13 13 15 16 16 17
Piece work/job 11 7 6 8 6 6
*Informal sector/self-employed 2 5 5 6 5 6
Salary/wage from an individual n/a 1 4 3 5 6
Income from farming 0 0 n/a n/a n/a n/a
Pension/return 2 3 2 2 2 2
Employer pension 2 2 2 2 2 2
Returns on your investment n/a 1 0 0 1 1
Inheritance n/a 0 0 0 0 n/a
Income from own business 4 5 n/a n/a n/a n/a
Borrowed money 3 n/a n/a n/a n/a n/a
Other 4 3 2 2 2 3
I do not receive money 7 n/a n/a 16 14 15
* Question has been changed – added foster care grant in 2012
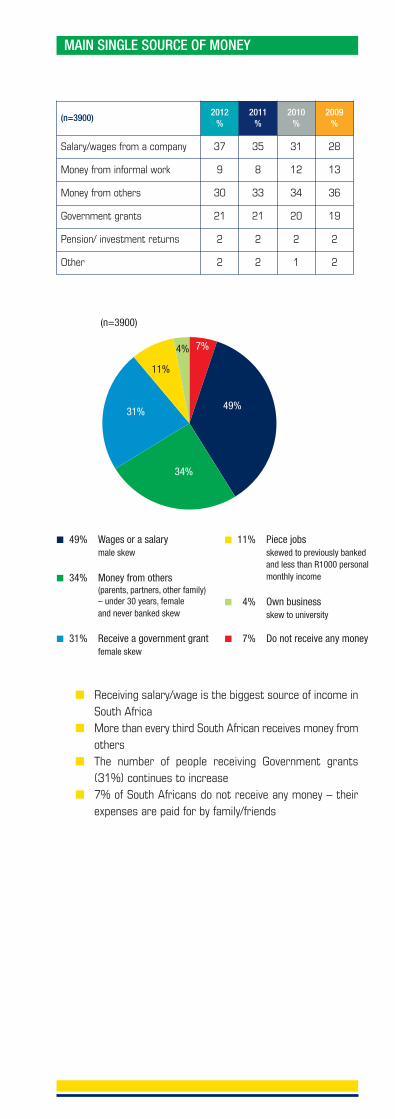
MAIN SINGLE SOURCE OF MONEY
49%
34%
31%
11%
4% 7%
■ 49% Wages or a salary male skew
■ 34% Money from others (parents, partners, other family) – under 30 years, female and never banked skew
■ 31% Receive a government grant female skew
■ 11% Piece jobs skewed to previously banked
and less than R1000 personalmonthly income
■ 4% Own business skew to university
■ 7% Do not receive any money
(n=3900)
(n=3900)2012
%2011
%2010
%2009
%
Salary/wages from a company 37 35 31 28
Money from informal work 9 8 12 13
Money from others 30 33 34 36
Government grants 21 21 20 19
Pension/ investment returns 2 2 2 2
Other 2 2 1 2
■ Receiving salary/wage is the biggest source of income inSouth Africa
■ More than every third South African receives money fromothers
■ The number of people receiving Government grants(31%) continues to increase
■ 7% of South Africans do not receive any money – theirexpenses are paid for by family/friends
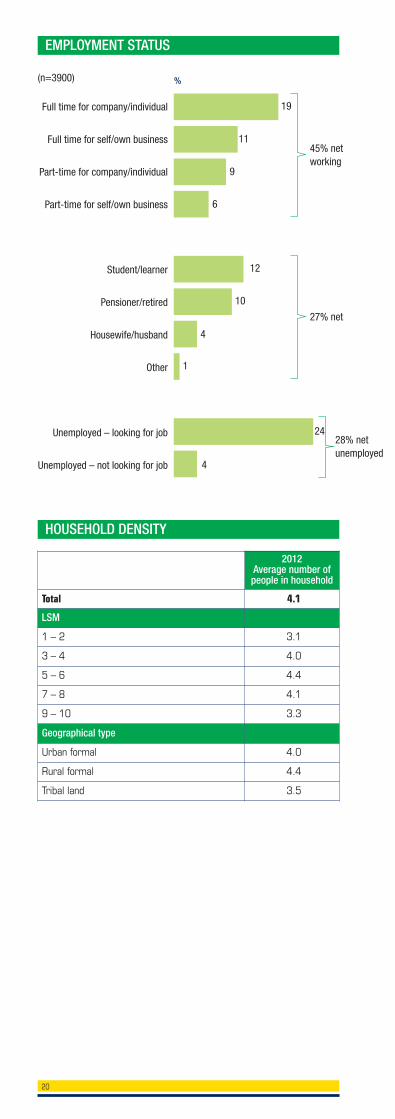
EMPLOYMENT STATUS
Full time for company/individual
Full time for self/own business
Part-time for company/individual
Part-time for self/own business
Student/learner
Pensioner/retired
Housewife/husband
Other
Unemployed – looking for job
Unemployed – not looking for job
%
19
11
9
6
12
10
4
1
24
4
(n=3900)
45% networking
27% net
28% netunemployed
2012 Average number ofpeople in household
Total 4.1
LSM
1 – 2 3.1
3 – 4 4.0
5 – 6 4.4
7 – 8 4.1
9 – 10 3.3
Geographical type
Urban formal 4.0
Rural formal 4.4
Tribal land 3.5
HOUSEHOLD DENSITY
20
2012 Average number of
income earnerscontributing to
household
Total 1.8
Monthly household income %
R1 – R999 1.2
R1 000 – R2 999 1.7
R3 000 – R7 999 2.0
R8 000 – R11 999 2.0
R12 000 – R24 999 2.1
R25 000 or more 2.0
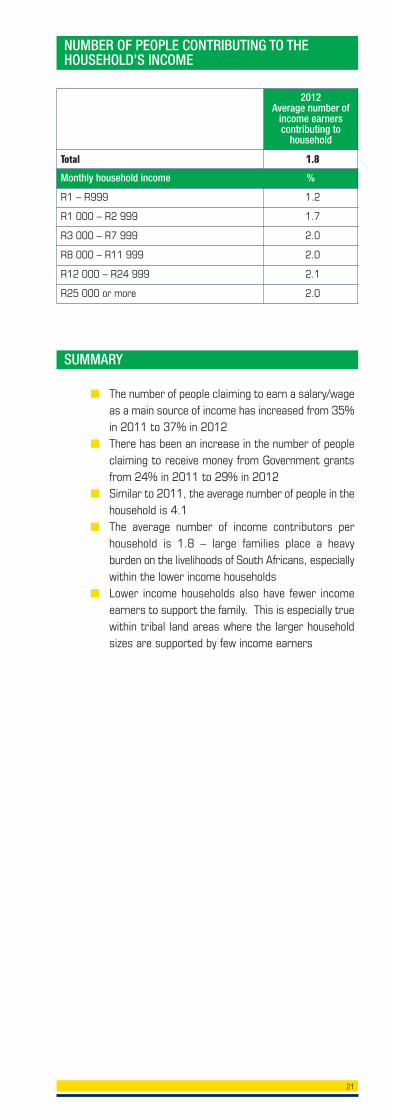
NUMBER OF PEOPLE CONTRIBUTING TO THEHOUSEHOLD’S INCOME
SUMMARY
■ The number of people claiming to earn a salary/wageas a main source of income has increased from 35%in 2011 to 37% in 2012
■ There has been an increase in the number of peopleclaiming to receive money from Government grantsfrom 24% in 2011 to 29% in 2012
■ Similar to 2011, the average number of people in thehousehold is 4.1
■ The average number of income contributors perhousehold is 1.8 – large families place a heavyburden on the livelihoods of South Africans, especiallywithin the lower income households
■ Lower income households also have fewer incomeearners to support the family. This is especially truewithin tribal land areas where the larger householdsizes are supported by few income earners
21
22
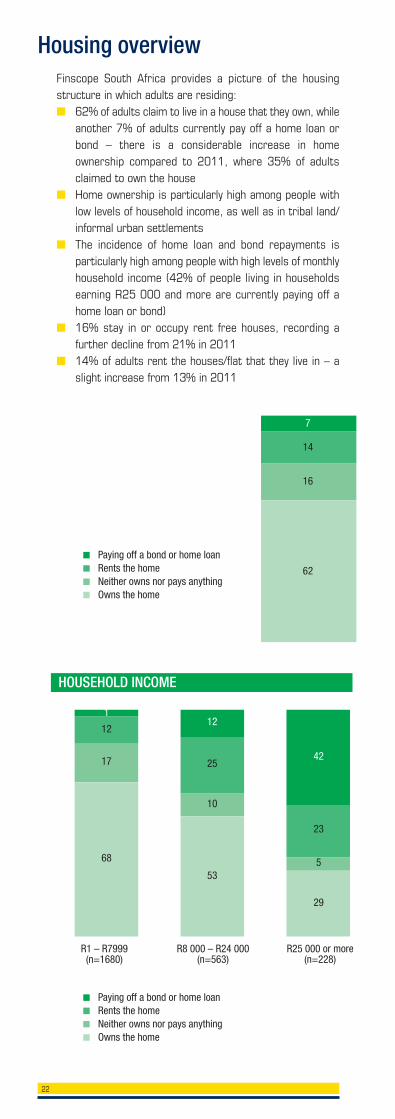
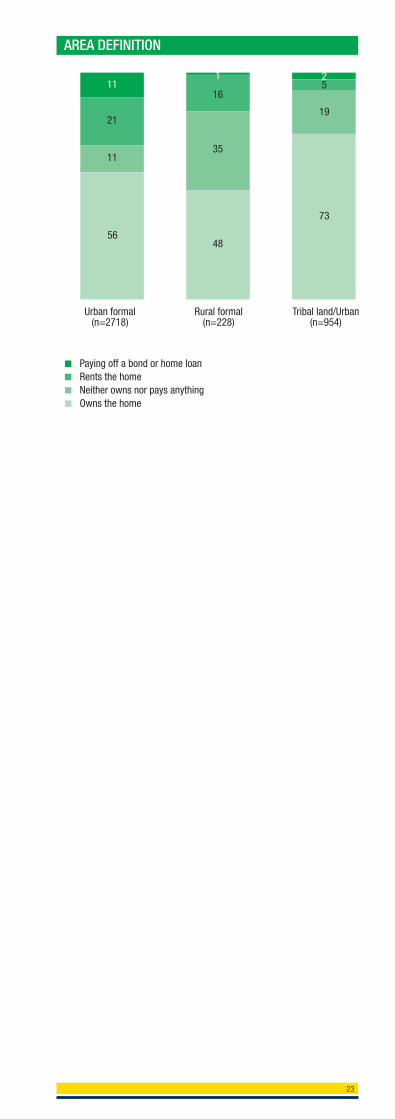
Housing overviewFinscope South Africa provides a picture of the housingstructure in which adults are residing:■ 62% of adults claim to live in a house that they own, while
another 7% of adults currently pay off a home loan orbond – there is a considerable increase in homeownership compared to 2011, where 35% of adultsclaimed to own the house
■ Home ownership is particularly high among people withlow levels of household income, as well as in tribal land/informal urban settlements
■ The incidence of home loan and bond repayments isparticularly high among people with high levels of monthlyhousehold income (42% of people living in householdsearning R25 000 and more are currently paying off ahome loan or bond)
■ 16% stay in or occupy rent free houses, recording afurther decline from 21% in 2011
■ 14% of adults rent the houses/flat that they live in – aslight increase from 13% in 2011
■ Paying off a bond or home loan■ Rents the home■ Neither owns nor pays anything■ Owns the home
■ Paying off a bond or home loan■ Rents the home■ Neither owns nor pays anything■ Owns the home
14
16
62
7
23
5
29
42
R1 – R7999 R8 000 – R24 000 R25 000 or more(n=1680) (n=563) (n=228)
12
17
68
1
25
10
53
12
HOUSEHOLD INCOME
23
5
19
73
2
Urban formal Rural formal Tribal land/Urban(n=2718) (n=228) (n=954)
21
11
56
1116
35
48
1
AREA DEFINITION
■ Paying off a bond or home loan■ Rents the home■ Neither owns nor pays anything■ Owns the home
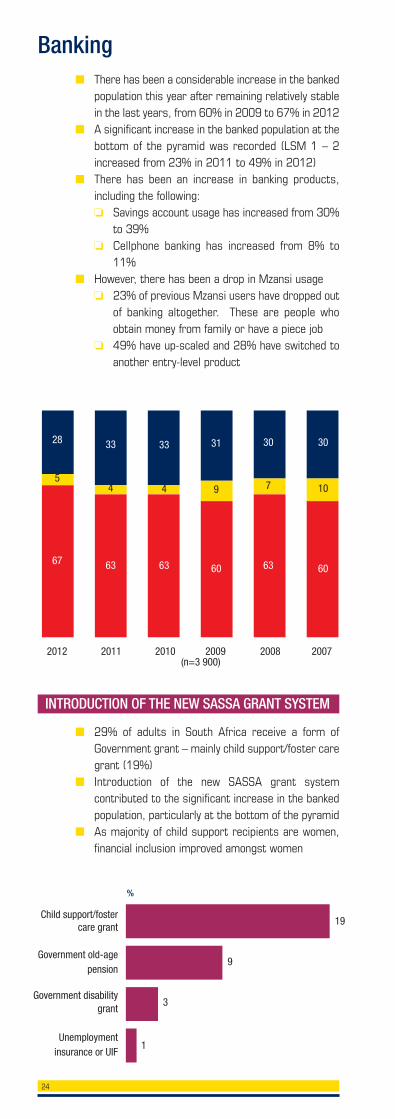
■ There has been a considerable increase in the bankedpopulation this year after remaining relatively stablein the last years, from 60% in 2009 to 67% in 2012
■ A significant increase in the banked population at thebottom of the pyramid was recorded (LSM 1 – 2increased from 23% in 2011 to 49% in 2012)
■ There has been an increase in banking products,including the following:
❏ Savings account usage has increased from 30%to 39%
❏ Cellphone banking has increased from 8% to11%
■ However, there has been a drop in Mzansi usage ❏ 23% of previous Mzansi users have dropped out
of banking altogether. These are people whoobtain money from family or have a piece job
❏ 49% have up-scaled and 28% have switched toanother entry-level product
Banking
2012 2011 2010 2009 2008 2007(n=3 900)
5
67
28
4
63
33
4
63
33
9
60
31
7
63
30
10
60
30
INTRODUCTION OF THE NEW SASSA GRANT SYSTEM
■ 29% of adults in South Africa receive a form ofGovernment grant – mainly child support/foster caregrant (19%)
■ Introduction of the new SASSA grant systemcontributed to the significant increase in the bankedpopulation, particularly at the bottom of the pyramid
■ As majority of child support recipients are women,financial inclusion improved amongst women
Child support/fostercare grant
Government old-agepension
Government disabilitygrant
Unemploymentinsurance or UIF
%
19
9
3
1
24
You
can
obta
in o
r with
draw
mon
eyfro
m a
sho
p til
l usi
ng y
our S
ASSA
car
d
You
like
SASS
A’S
new
soc
ial g
rant
sys
tem
The
chea
pest
way
to w
ithdr
aw m
oney
is
from
a s
hop
till u
sing
you
r SAS
SA c
ard
Both
the
new
ban
k sy
stem
and
Net
1sy
stem
wer
e ex
plai
ned
to y
ou
Whe
n yo
u re
gist
ered
for t
he n
ewSA
SSA
Mas
terC
ard
acco
unt,
you
wer
e as
ked
whe
ther
you
had
ano
ther
ban
k ac
coun
t to
trans
fer y
our m
oney
to
■ Don’t know■ No■ Yes
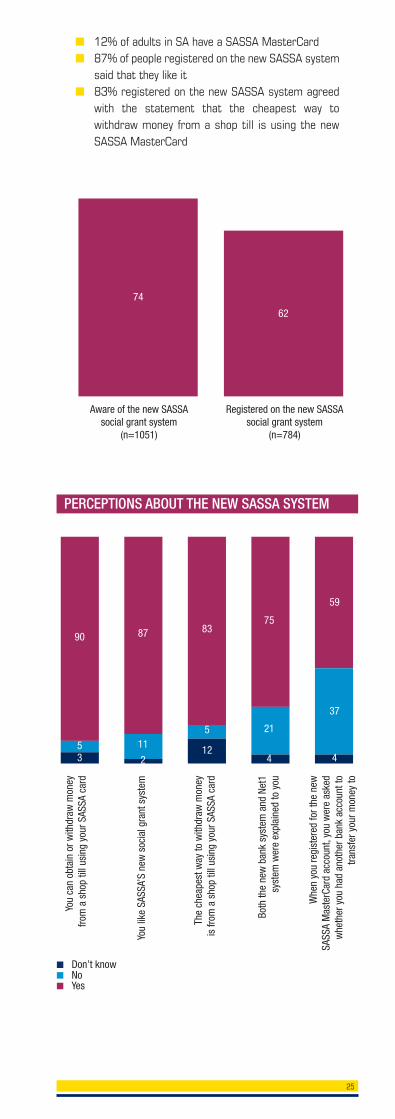
■ 12% of adults in SA have a SASSA MasterCard■ 87% of people registered on the new SASSA system
said that they like it■ 83% registered on the new SASSA system agreed
with the statement that the cheapest way towithdraw money from a shop till is using the newSASSA MasterCard
Aware of the new SASSAsocial grant system
(n=1051)
Registered on the new SASSAsocial grant system
(n=784)
74
62
53
90
11
2
87
5
12
83
21
4
75
37
4
59
PERCEPTIONS ABOUT THE NEW SASSA SYSTEM
25
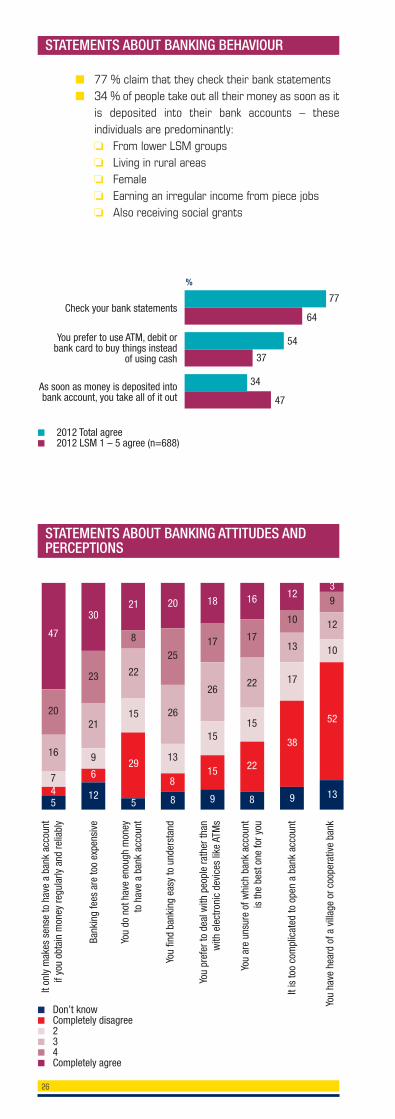
STATEMENTS ABOUT BANKING BEHAVIOUR
Check your bank statements
You prefer to use ATM, debit or bank card to buy things instead
of using cash
As soon as money is deposited into bank account, you take all of it out
%
77
■ 2012 Total agree■ 2012 LSM 1 – 5 agree (n=688)
26
■ 77 % claim that they check their bank statements■ 34 % of people take out all their money as soon as it
is deposited into their bank accounts – theseindividuals are predominantly:
❏ From lower LSM groups ❏ Living in rural areas ❏ Female ❏ Earning an irregular income from piece jobs ❏ Also receiving social grants
64
54
37
34
47
It on
ly m
akes
sen
se to
hav
e a
bank
acc
ount
if yo
u ob
tain
mon
ey re
gula
rly a
nd re
liabl
y
Bank
ing
fees
are
too
expe
nsiv
e
You
do n
ot h
ave
enou
gh m
oney
to
hav
e a
bank
acc
ount
You
find
bank
ing
easy
to u
nder
stan
d
You
pref
er to
dea
l with
peo
ple
rath
er th
an
with
ele
ctro
nic
devi
ces
like
ATM
s
You
are
unsu
re o
f whi
ch b
ank
acco
unt
is th
e be
st o
ne fo
r you
It is
too
com
plic
ated
to o
pen
a ba
nk a
ccou
nt
You
have
hea
rd o
f a v
illag
e or
coo
pera
tive
bank
■ Don’t know■ Completely disagree■ 2■ 3■ 4■ Completely agree
20
16
7
54
47
23
21
9
12
6
30
8
22
15
5
29
21
25
26
13
8
8
20
17
26
15
9
15
18
17
22
15
8
22
16
10
13
17
9
38
129
12
10
13
52
3
STATEMENTS ABOUT BANKING ATTITUDES ANDPERCEPTIONS
27
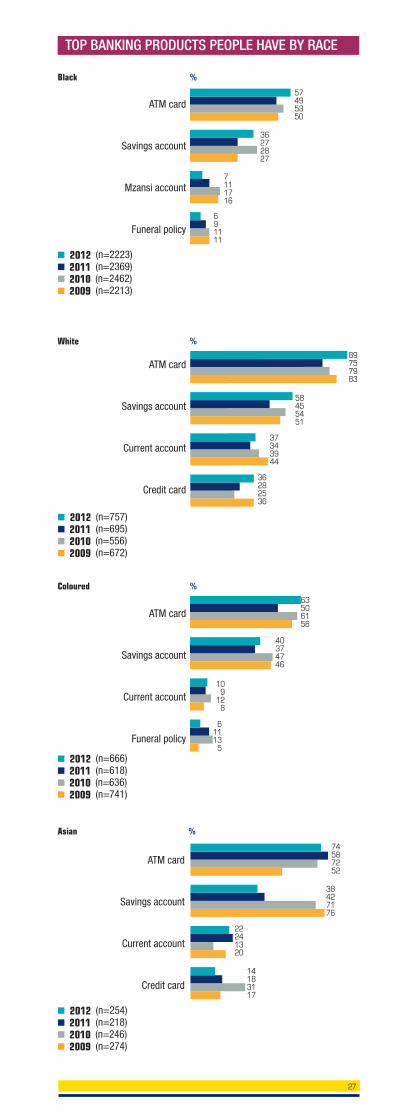
TOP BANKING PRODUCTS PEOPLE HAVE BY RACE
ATM card
Savings account
Mzansi account
Funeral policy
Black
■ 2012 (n=2223)■ 2011 (n=2369)■ 2010 (n=2462)■ 2009 (n=2213)
■ 2012 (n=757)■ 2011 (n=695)■ 2010 (n=556)■ 2009 (n=672)
■ 2012 (n=666)■ 2011 (n=618)■ 2010 (n=636)■ 2009 (n=741)
■ 2012 (n=254)■ 2011 (n=218)■ 2010 (n=246)■ 2009 (n=274)
White
Coloured
Asian
ATM card
Savings account
Current account
Credit card
ATM card
Savings account
Current account
Funeral policy
ATM card
Savings account
Current account
Credit card
%
%
%
%
5749 5350
36272827
7111716
691111
89757983
58455451
37343944
36282536
63506158
40374746
10091208
06111305
74587252
38427176
22241320
14183117
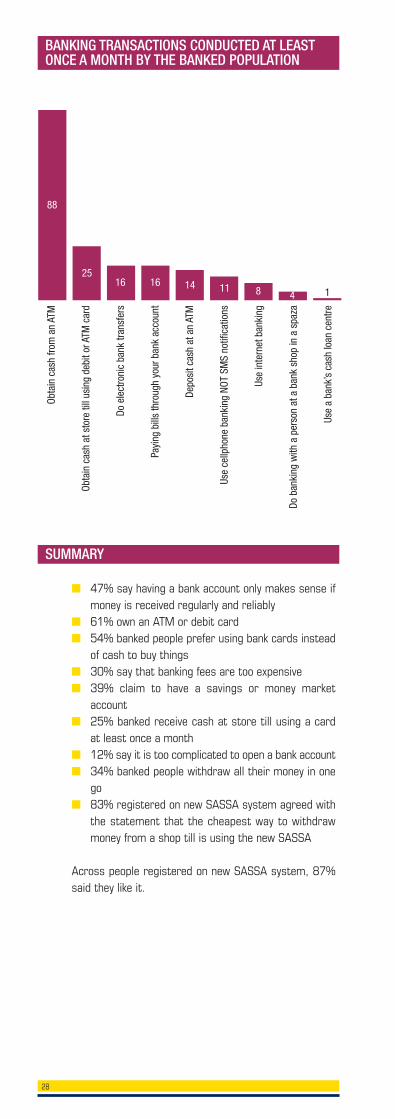
BANKING TRANSACTIONS CONDUCTED AT LEASTONCE A MONTH BY THE BANKED POPULATION
28
Obta
in c
ash
from
an
ATM
Obta
in c
ash
at s
tore
till
usin
g de
bit o
r ATM
car
d
Do e
lect
roni
c ba
nk tr
ansf
ers
Payi
ng b
ills
thro
ugh
your
ban
k ac
coun
t
Depo
sit c
ash
at a
n AT
M
Use
cellp
hone
ban
king
NOT
SM
S no
tific
atio
ns
Use
inte
rnet
ban
king
Do b
anki
ng w
ith a
per
son
at a
ban
k sh
op in
a s
paza
Use
a ba
nk’s
cas
h lo
an c
entre
88
2516 16 14 11 8 4 1
SUMMARY
■ 47% say having a bank account only makes sense ifmoney is received regularly and reliably
■ 61% own an ATM or debit card ■ 54% banked people prefer using bank cards instead
of cash to buy things■ 30% say that banking fees are too expensive■ 39% claim to have a savings or money market
account ■ 25% banked receive cash at store till using a card
at least once a month ■ 12% say it is too complicated to open a bank account ■ 34% banked people withdraw all their money in one
go ■ 83% registered on new SASSA system agreed with
the statement that the cheapest way to withdrawmoney from a shop till is using the new SASSA
Across people registered on new SASSA system, 87%said they like it.
29
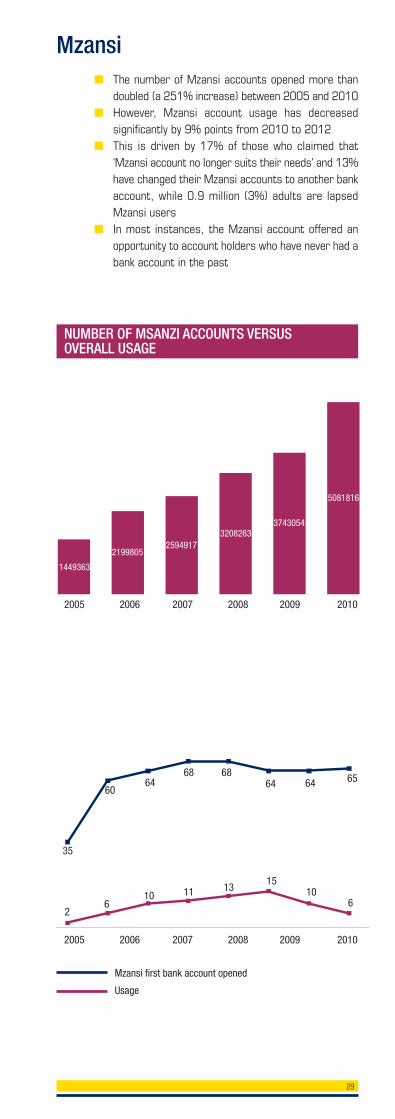
■ The number of Mzansi accounts opened more thandoubled (a 251% increase) between 2005 and 2010
■ However, Mzansi account usage has decreasedsignificantly by 9% points from 2010 to 2012
■ This is driven by 17% of those who claimed that‘Mzansi account no longer suits their needs’ and 13%have changed their Mzansi accounts to another bankaccount, while 0.9 million (3%) adults are lapsedMzansi users
■ In most instances, the Mzansi account offered anopportunity to account holders who have never had abank account in the past
Mzansi
1449363
21998052594917
32082633743054
5081816
NUMBER OF MSANZI ACCOUNTS VERSUS OVERALL USAGE
2005 2006 2007 2008 2009 2010
2005 2006 2007 2008 2009 2010
35
6064
68 6864 64 65
26
10 11 1315
106
Mzansi first bank account opened
Usage
30
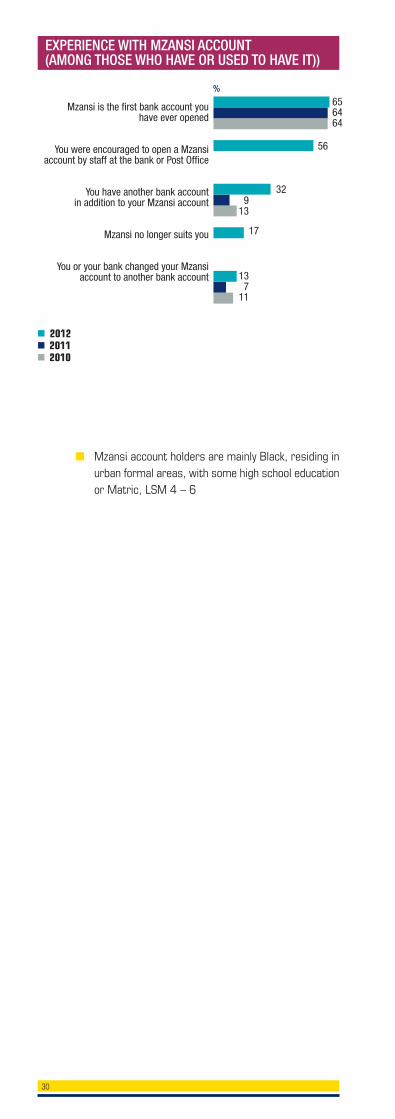
Mzansi is the first bank account you have ever opened
You were encouraged to open a Mzansiaccount by staff at the bank or Post Office
You have another bank accountin addition to your Mzansi account
Mzansi no longer suits you
You or your bank changed your Mzansiaccount to another bank account
%656464
130711
0913
56
32
17
EXPERIENCE WITH MZANSI ACCOUNT (AMONG THOSE WHO HAVE OR USED TO HAVE IT))
■ 2012■ 2011■ 2010
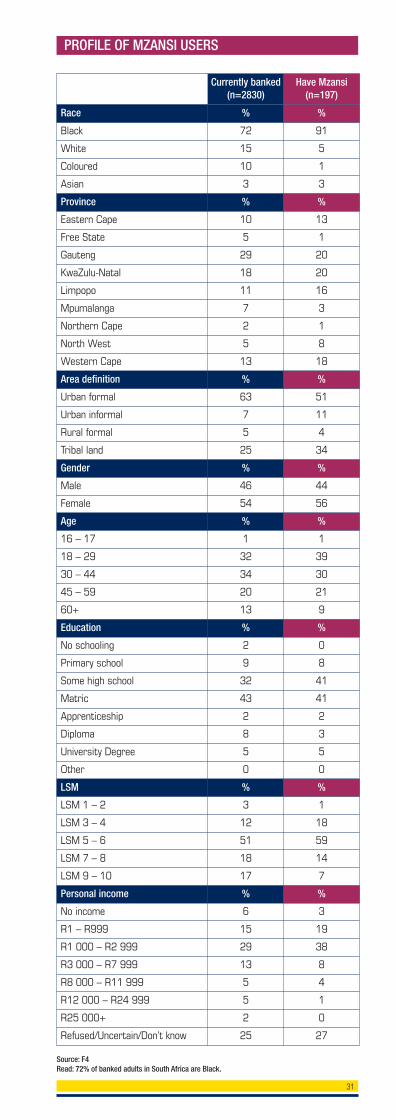
■ Mzansi account holders are mainly Black, residing inurban formal areas, with some high school educationor Matric, LSM 4 – 6
31
PROFILE OF MZANSI USERS
Currently banked(n=2830)
Have Mzansi(n=197)
Race % %
Black 72 91
White 15 5
Coloured 10 1
Asian 3 3
Province % %
Eastern Cape 10 13
Free State 5 1
Gauteng 29 20
KwaZulu-Natal 18 20
Limpopo 11 16
Mpumalanga 7 3
Northern Cape 2 1
North West 5 8
Western Cape 13 18
Area definition % %
Urban formal 63 51
Urban informal 7 11
Rural formal 5 4
Tribal land 25 34
Gender % %
Male 46 44
Female 54 56
Age % %
16 – 17 1 1
18 – 29 32 39
30 – 44 34 30
45 – 59 20 21
60+ 13 9
Education % %
No schooling 2 0
Primary school 9 8
Some high school 32 41
Matric 43 41
Apprenticeship 2 2
Diploma 8 3
University Degree 5 5
Other 0 0
LSM % %
LSM 1 – 2 3 1
LSM 3 – 4 12 18
LSM 5 – 6 51 59
LSM 7 – 8 18 14
LSM 9 – 10 17 7
Personal income % %
No income 6 3
R1 – R999 15 19
R1 000 – R2 999 29 38
R3 000 – R7 999 13 8
R8 000 – R11 999 5 4
R12 000 – R24 999 5 1
R25 000+ 2 0
Refused/Uncertain/Don’t know 25 27
Source: F4Read: 72% of banked adults in South Africa are Black.
32
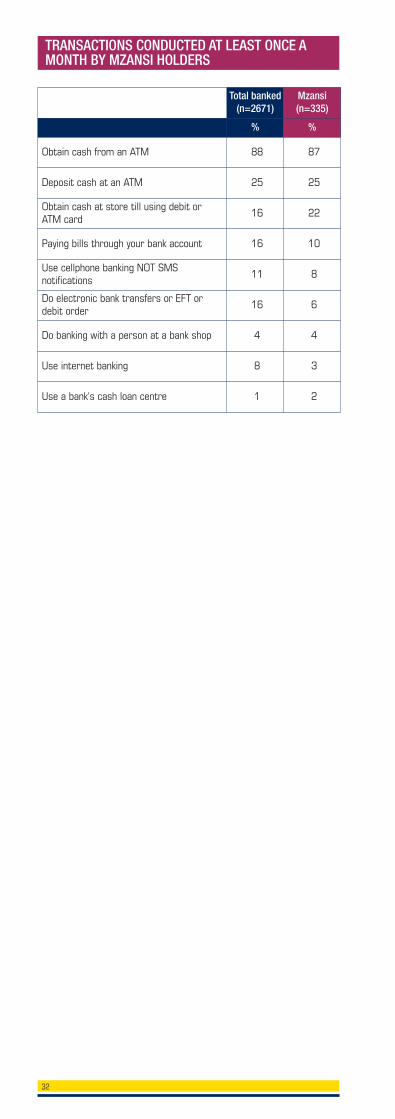
TRANSACTIONS CONDUCTED AT LEAST ONCE AMONTH BY MZANSI HOLDERS
Total banked(n=2671)
Mzansi (n=335)
% %
Obtain cash from an ATM 88 87
Deposit cash at an ATM 25 25
Obtain cash at store till using debit or ATM card
16 22
Paying bills through your bank account 16 10
Use cellphone banking NOT SMSnotifications
11 8
Do electronic bank transfers or EFT or debit order
16 6
Do banking with a person at a bank shop 4 4
Use internet banking 8 3
Use a bank's cash loan centre 1 2
33
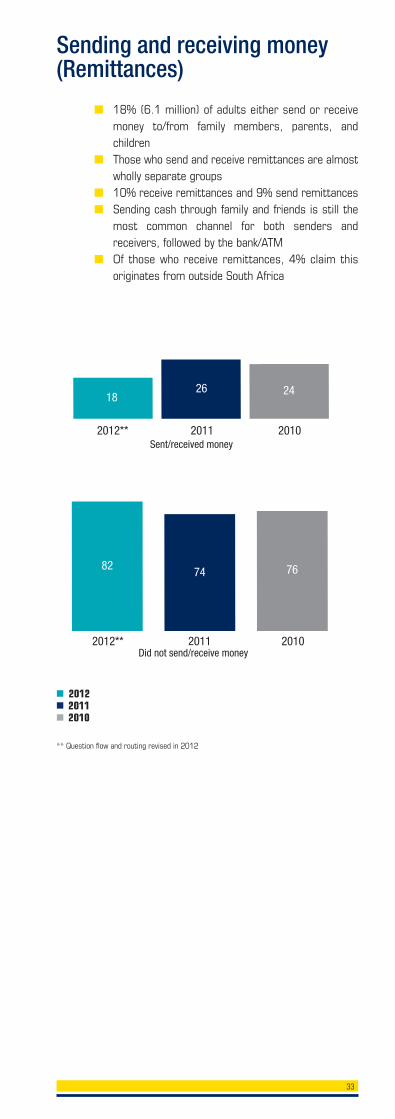
■ 18% (6.1 million) of adults either send or receivemoney to/from family members, parents, andchildren
■ Those who send and receive remittances are almostwholly separate groups
■ 10% receive remittances and 9% send remittances■ Sending cash through family and friends is still the
most common channel for both senders andreceivers, followed by the bank/ATM
■ Of those who receive remittances, 4% claim thisoriginates from outside South Africa
Sending and receiving money(Remittances)
2012** 2011 2010
1826 24
Sent/received money
■ 2012■ 2011■ 2010
** Question flow and routing revised in 2012
2012** 2011 2010
82 74 76
Did not send/receive money
34
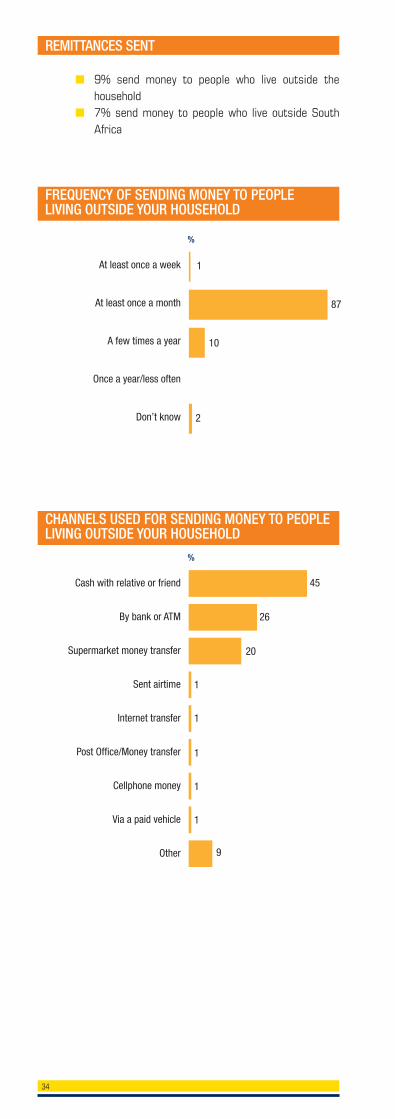
REMITTANCES SENT
At least once a week
At least once a month
A few times a year
Once a year/less often
Don’t know
1
%
■ 9% send money to people who live outside thehousehold
■ 7% send money to people who live outside SouthAfrica
FREQUENCY OF SENDING MONEY TO PEOPLELIVING OUTSIDE YOUR HOUSEHOLD
87
10
2
Cash with relative or friend
By bank or ATM
Supermarket money transfer
Sent airtime
Internet transfer
Post Office/Money transfer
Cellphone money
Via a paid vehicle
Other
45
%
26
20
1
1
1
1
1
9
CHANNELS USED FOR SENDING MONEY TO PEOPLELIVING OUTSIDE YOUR HOUSEHOLD
35
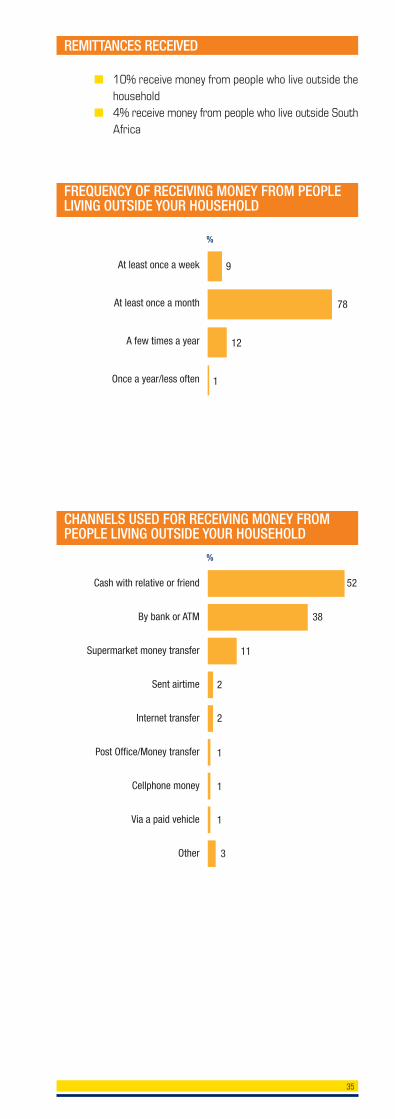
REMITTANCES RECEIVED
■ 10% receive money from people who live outside thehousehold
■ 4% receive money from people who live outside SouthAfrica
At least once a week
At least once a month
A few times a year
Once a year/less often
9
%
78
12
Cash with relative or friend
By bank or ATM
Supermarket money transfer
Sent airtime
Internet transfer
Post Office/Money transfer
Cellphone money
Via a paid vehicle
Other
52
%
38
11
2
2
1
1
1
3
CHANNELS USED FOR RECEIVING MONEY FROMPEOPLE LIVING OUTSIDE YOUR HOUSEHOLD
FREQUENCY OF RECEIVING MONEY FROM PEOPLELIVING OUTSIDE YOUR HOUSEHOLD
1
SAVINGS MECHANISMS/PRODUCTS
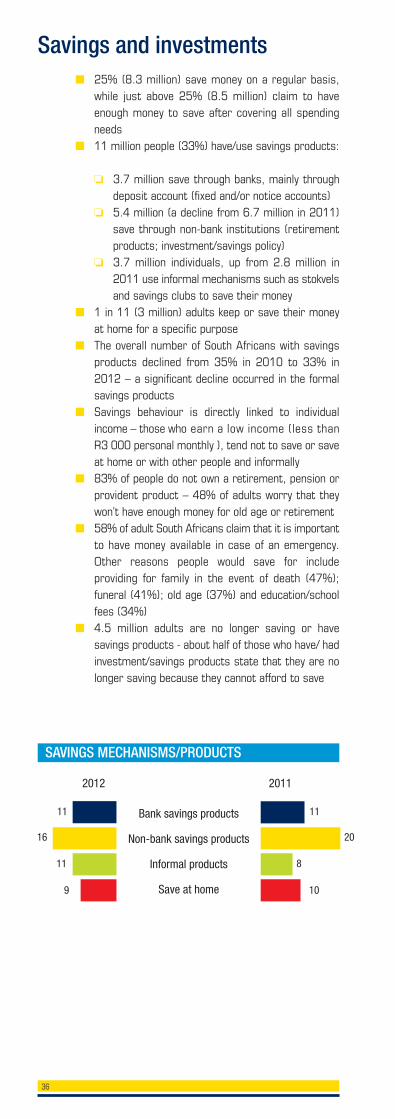
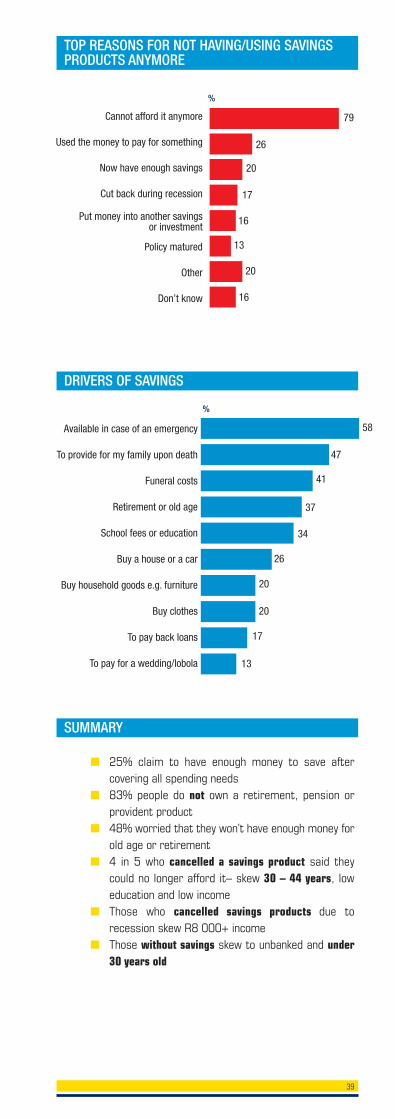
■ 25% (8.3 million) save money on a regular basis,while just above 25% (8.5 million) claim to haveenough money to save after covering all spendingneeds
■ 11 million people (33%) have/use savings products:
❏ 3.7 million save through banks, mainly throughdeposit account (fixed and/or notice accounts)
❏ 5.4 million (a decline from 6.7 million in 2011)save through non-bank institutions (retirementproducts; investment/savings policy)
❏ 3.7 million individuals, up from 2.8 million in2011 use informal mechanisms such as stokvelsand savings clubs to save their money
■ 1 in 11 (3 million) adults keep or save their moneyat home for a specific purpose
■ The overall number of South Africans with savingsproducts declined from 35% in 2010 to 33% in2012 – a significant decline occurred in the formalsavings products
■ Savings behaviour is directly linked to individualincome – those who earn a low income (less thanR3 000 personal monthly ), tend not to save or saveat home or with other people and informally
■ 83% of people do not own a retirement, pension orprovident product – 48% of adults worry that theywon’t have enough money for old age or retirement
■ 58% of adult South Africans claim that it is importantto have money available in case of an emergency.Other reasons people would save for includeproviding for family in the event of death (47%);funeral (41%); old age (37%) and education/schoolfees (34%)
■ 4.5 million adults are no longer saving or havesavings products - about half of those who have/ hadinvestment/savings products state that they are nolonger saving because they cannot afford to save
Savings and investments
36
11
20
8
10
11
16
11
9
Bank savings products
Non-bank savings products
Informal products
Save at home
2012 2011
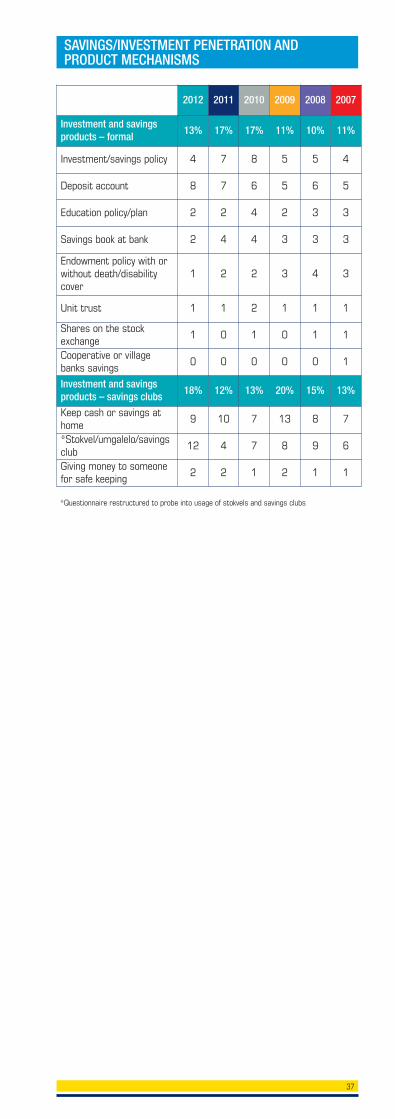
SAVINGS/INVESTMENT PENETRATION ANDPRODUCT MECHANISMS
2012 2011 2010 2009 2008 2007
Investment and savings products – formal
13% 17% 17% 11% 10% 11%
Investment/savings policy 4 7 8 5 5 4
Deposit account 8 7 6 5 6 5
Education policy/plan 2 2 4 2 3 3
Savings book at bank 2 4 4 3 3 3
Endowment policy with orwithout death/disabilitycover
1 2 2 3 4 3
Unit trust 1 1 2 1 1 1
Shares on the stockexchange
1 0 1 0 1 1
Cooperative or villagebanks savings
0 0 0 0 0 1
Investment and savings products – savings clubs
18% 12% 13% 20% 15% 13%
Keep cash or savings athome
9 10 7 13 8 7
*Stokvel/umgalelo/savingsclub
12 4 7 8 9 6
Giving money to someonefor safe keeping
2 2 1 2 1 1
37
*Questionnaire restructured to probe into usage of stokvels and savings clubs
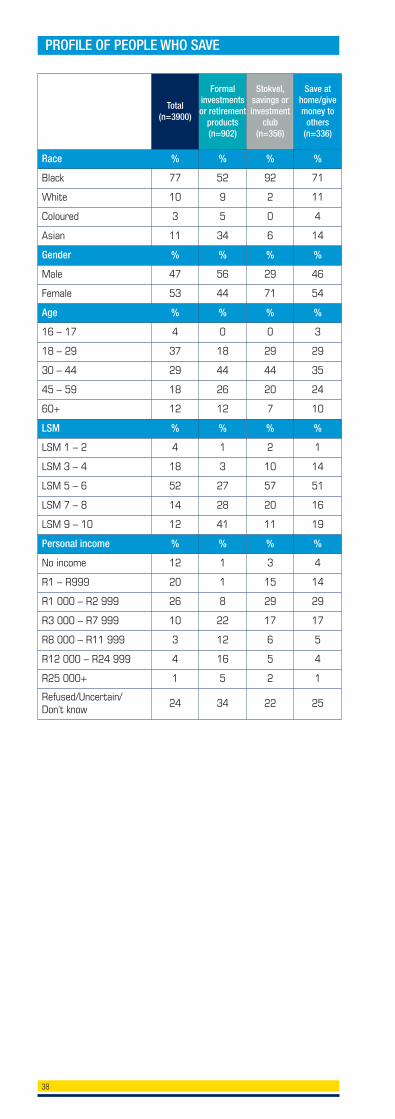
PROFILE OF PEOPLE WHO SAVE
Total(n=3900)
Formalinvestmentsor retirement
products(n=902)
Stokvel,savings orinvestment
club(n=356)
Save athome/givemoney to
others(n=336)
Race % % % %
Black 77 52 92 71
White 10 9 2 11
Coloured 3 5 0 4
Asian 11 34 6 14
Gender % % % %
Male 47 56 29 46
Female 53 44 71 54
Age % % % %
16 – 17 4 0 0 3
18 – 29 37 18 29 29
30 – 44 29 44 44 35
45 – 59 18 26 20 24
60+ 12 12 7 10
LSM % % % %
LSM 1 – 2 4 1 2 1
LSM 3 – 4 18 3 10 14
LSM 5 – 6 52 27 57 51
LSM 7 – 8 14 28 20 16
LSM 9 – 10 12 41 11 19
Personal income % % % %
No income 12 1 3 4
R1 – R999 20 1 15 14
R1 000 – R2 999 26 8 29 29
R3 000 – R7 999 10 22 17 17
R8 000 – R11 999 3 12 6 5
R12 000 – R24 999 4 16 5 4
R25 000+ 1 5 2 1
Refused/Uncertain/Don’t know
24 34 22 25
38
DRIVERS OF SAVINGS
Cannot afford it anymore
Used the money to pay for something
Now have enough savings
Cut back during recession
Put money into another savings or investment
Policy matured
Other
Don’t know
%
79
26
20
17
16
13
20
16
Available in case of an emergency
To provide for my family upon death
Funeral costs
Retirement or old age
School fees or education
Buy a house or a car
Buy household goods e.g. furniture
Buy clothes
To pay back loans
To pay for a wedding/lobola
%
58
47
41
37
34
26
20
20
17
13
TOP REASONS FOR NOT HAVING/USING SAVINGSPRODUCTS ANYMORE
SUMMARY
■ 25% claim to have enough money to save aftercovering all spending needs
■ 83% people do not own a retirement, pension orprovident product
■ 48% worried that they won’t have enough money forold age or retirement
■ 4 in 5 who cancelled a savings product said theycould no longer afford it– skew 30 – 44 years, loweducation and low income
■ Those who cancelled savings products due torecession skew R8 000+ income
■ Those without savings skew to unbanked and under30 years old
39
40
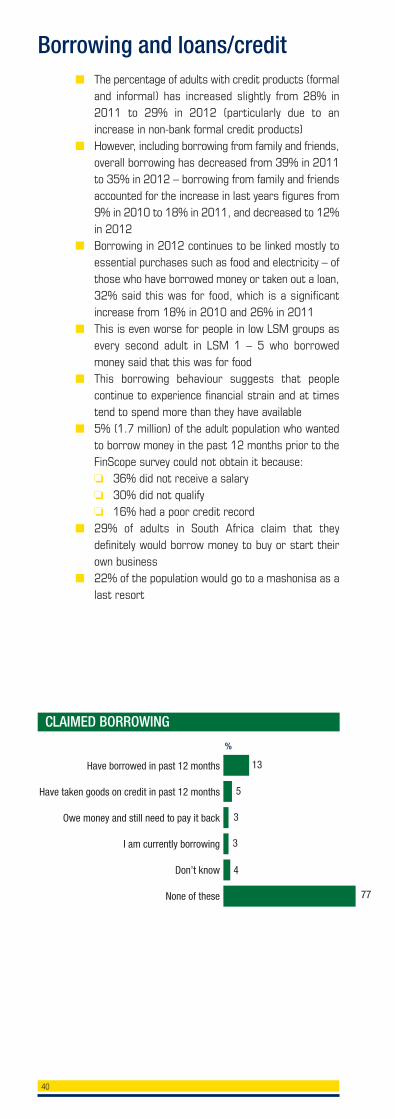
■ The percentage of adults with credit products (formaland informal) has increased slightly from 28% in2011 to 29% in 2012 (particularly due to anincrease in non-bank formal credit products)
■ However, including borrowing from family and friends,overall borrowing has decreased from 39% in 2011to 35% in 2012 – borrowing from family and friendsaccounted for the increase in last years figures from9% in 2010 to 18% in 2011, and decreased to 12%in 2012
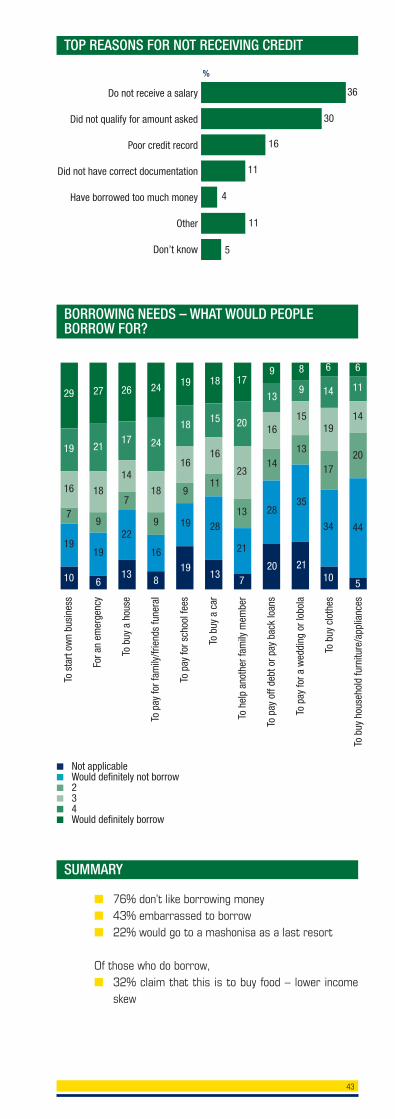
■ Borrowing in 2012 continues to be linked mostly toessential purchases such as food and electricity – ofthose who have borrowed money or taken out a loan,32% said this was for food, which is a significantincrease from 18% in 2010 and 26% in 2011
■ This is even worse for people in low LSM groups asevery second adult in LSM 1 – 5 who borrowedmoney said that this was for food
■ This borrowing behaviour suggests that peoplecontinue to experience financial strain and at timestend to spend more than they have available
■ 5% (1.7 million) of the adult population who wantedto borrow money in the past 12 months prior to theFinScope survey could not obtain it because:
❏ 36% did not receive a salary ❏ 30% did not qualify ❏ 16% had a poor credit record■ 29% of adults in South Africa claim that they
definitely would borrow money to buy or start theirown business
■ 22% of the population would go to a mashonisa as alast resort
Borrowing and loans/credit
CLAIMED BORROWING
Have borrowed in past 12 months
Have taken goods on credit in past 12 months
Owe money and still need to pay it back
I am currently borrowing
Don’t know
None of these
%
13
5
3
3
4
77
41
BORROWING/CREDIT PENETRATION AND PRODUCTMECHANISMS
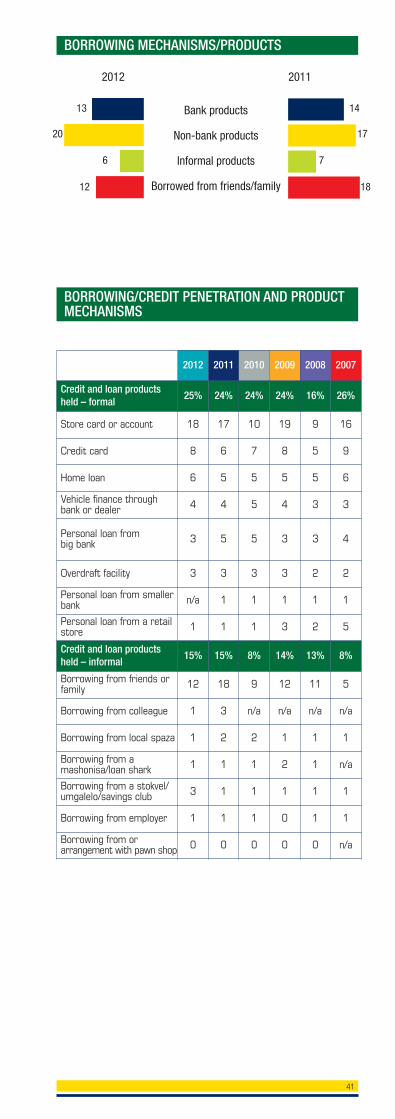
BORROWING MECHANISMS/PRODUCTS
14
17
7
18
13
20
6
12
Bank products
Non-bank products
Informal products
Borrowed from friends/family
2012 2011
2012 2011 2010 2009 2008 2007
Credit and loan productsheld – formal
25% 24% 24% 24% 16% 26%
Store card or account 18 17 10 19 9 16
Credit card 8 6 7 8 5 9
Home loan 6 5 5 5 5 6
Vehicle finance throughbank or dealer 4 4 5 4 3 3
Personal loan from big bank 3 5 5 3 3 4
Overdraft facility 3 3 3 3 2 2
Personal loan from smallerbank n/a 1 1 1 1 1
Personal loan from a retailstore 1 1 1 3 2 5
Credit and loan productsheld – informal
15% 15% 8% 14% 13% 8%
Borrowing from friends orfamily 12 18 9 12 11 5
Borrowing from colleague 1 3 n/a n/a n/a n/a
Borrowing from local spaza 1 2 2 1 1 1
Borrowing from amashonisa/loan shark 1 1 1 2 1 n/a
Borrowing from a stokvel/umgalelo/savings club 3 1 1 1 1 1
Borrowing from employer 1 1 1 0 1 1
Borrowing from orarrangement with pawn shop 0 0 0 0 0 n/a
42
You
don’
t lik
e to
bor
row
mon
ey in
cas
eyo
u ca
nnot
pay
it b
ack
Havi
ng a
ban
k ac
coun
t mak
es it
easi
er to
obt
ain
a lo
an
You
wou
ld b
e em
barr
asse
d if
you
had
to b
orro
w
You
wou
ld b
orro
w fr
om a
mon
eyle
nder
or m
asho
nisa
if y
ou h
ad n
o ot
her o
ptio
n
■ Don’t know■ No■ Yes
21
3
76
27
27
46
48
9
43
68
10
22
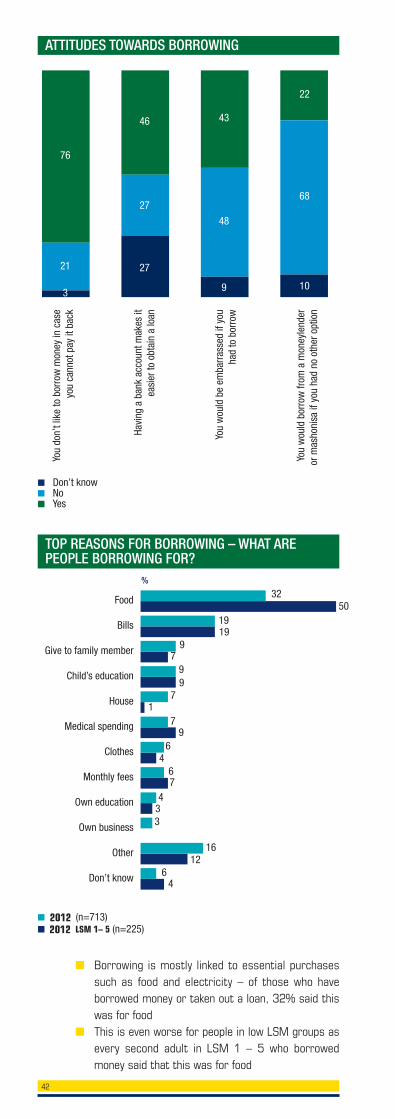
ATTITUDES TOWARDS BORROWING
TOP REASONS FOR BORROWING – WHAT AREPEOPLE BORROWING FOR?
32Food
Bills
Give to family member
Child’s education
House
Medical spending
Clothes
Monthly fees
Own education
Own business
Other
Don’t know
%
■ Borrowing is mostly linked to essential purchasessuch as food and electricity – of those who haveborrowed money or taken out a loan, 32% said thiswas for food
■ This is even worse for people in low LSM groups asevery second adult in LSM 1 – 5 who borrowedmoney said that this was for food
■ 2012 (n=713)■ 2012 LSM 1– 5 (n=225)
501919
6
97
99
71
79
64
67
33
4
1612
4
43
TOP REASONS FOR NOT RECEIVING CREDIT
SUMMARY
Do not receive a salary
Did not qualify for amount asked
Poor credit record
Did not have correct documentation
Have borrowed too much money
Other
Don’t know
%
36
30
16
11
4
11
5
■ 76% don’t like borrowing money ■ 43% embarrassed to borrow ■ 22% would go to a mashonisa as a last resort
Of those who do borrow, ■ 32% claim that this is to buy food – lower income
skew
■ Not applicable■ Would definitely not borrow■ 2■ 3■ 4■ Would definitely borrow
19
16
7
10
19
29
21
18
9
6
19
27
17
14
7
13
22
26
24
18
9
8
16
24
18
16
9
19
19
19
15
16
11
13
28
18
20
23
13
7
21
17
13
16
14
20
28
9
9
15
13
21
35
8
14
19
17
10
34
6
11
14
20
5
44
6
BORROWING NEEDS – WHAT WOULD PEOPLEBORROW FOR?
To s
tart
own
busi
ness
For a
n em
erge
ncy
To b
uy a
hou
se
To p
ay fo
r fam
ily/fr
iend
s fu
nera
l
To p
ay fo
r sch
ool f
ees
To b
uy a
car
To h
elp
anot
her f
amily
mem
ber
To p
ay o
ff de
bt o
r pay
bac
k lo
ans
To p
ay fo
r a w
eddi
ng o
r lob
ola
To b
uy c
loth
es
To b
uy h
ouse
hold
furn
iture
/app
lianc
es
44
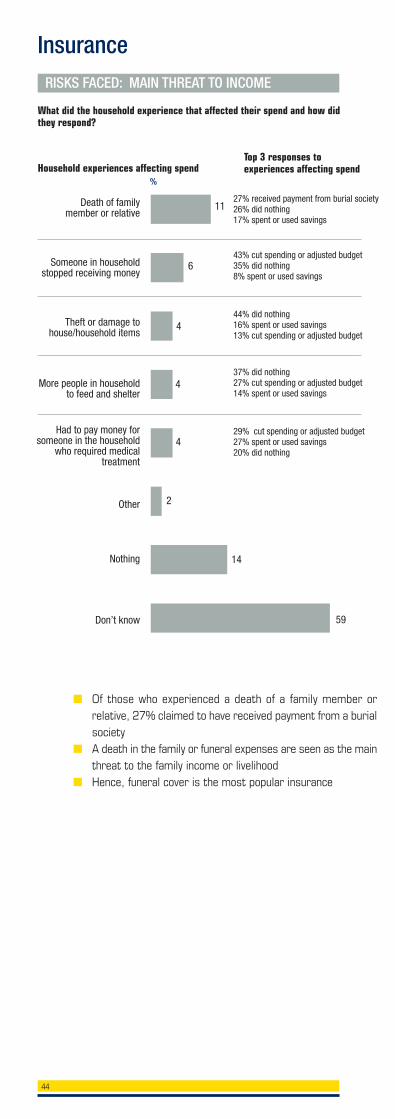
InsuranceRISKS FACED: MAIN THREAT TO INCOME
11
%
Death of family member or relative
Someone in householdstopped receiving money
Theft or damage tohouse/household items
More people in householdto feed and shelter
Had to pay money forsomeone in the household
who required medicaltreatment
Other
Nothing
Don’t know
27% received payment from burial society26% did nothing 17% spent or used savings
43% cut spending or adjusted budget35% did nothing 8% spent or used savings
44% did nothing 16% spent or used savings13% cut spending or adjusted budget
37% did nothing 27% cut spending or adjusted budget14% spent or used savings
29% cut spending or adjusted budget27% spent or used savings20% did nothing
6
4
4
2
14
59
4
What did the household experience that affected their spend and how didthey respond?
Household experiences affecting spendTop 3 responses toexperiences affecting spend
■ Of those who experienced a death of a family member orrelative, 27% claimed to have received payment from a burialsociety
■ A death in the family or funeral expenses are seen as the mainthreat to the family income or livelihood
■ Hence, funeral cover is the most popular insurance
45
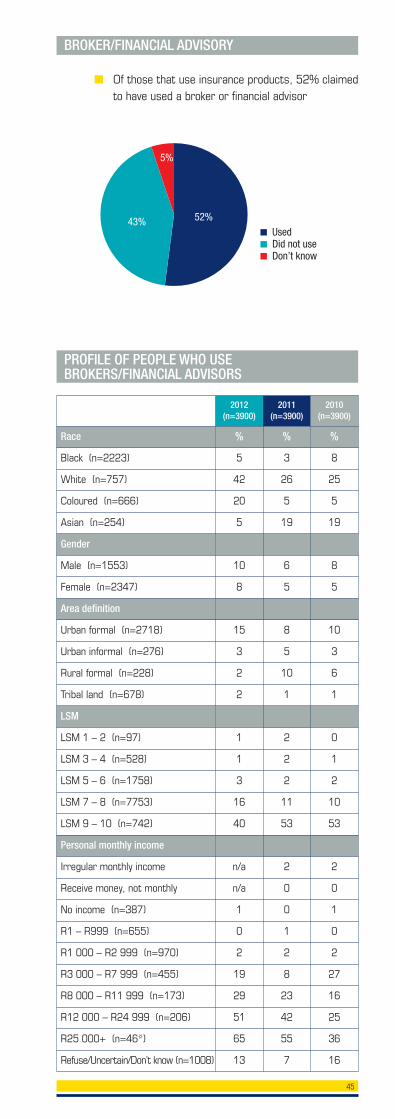
■ Of those that use insurance products, 52% claimedto have used a broker or financial advisor
BROKER/FINANCIAL ADVISORY
■ Used■ Did not use■ Don’t know
52%43%
5%
2012(n=3900)
2011 (n=3900)
2010(n=3900)
Race % % %
Black (n=2223) 5 3 8
White (n=757) 42 26 25
Coloured (n=666) 20 5 5
Asian (n=254) 5 19 19
Gender
Male (n=1553) 10 6 8
Female (n=2347) 8 5 5
Area definition
Urban formal (n=2718) 15 8 10
Urban informal (n=276) 3 5 3
Rural formal (n=228) 2 10 6
Tribal land (n=678) 2 1 1
LSM
LSM 1 – 2 (n=97) 1 2 0
LSM 3 – 4 (n=528) 1 2 1
LSM 5 – 6 (n=1758) 3 2 2
LSM 7 – 8 (n=7753) 16 11 10
LSM 9 – 10 (n=742) 40 53 53
Personal monthly income
Irregular monthly income n/a 2 2
Receive money, not monthly n/a 0 0
No income (n=387) 1 0 1
R1 – R999 (n=655) 0 1 0
R1 000 – R2 999 (n=970) 2 2 2
R3 000 – R7 999 (n=455) 19 8 27
R8 000 – R11 999 (n=173) 29 23 16
R12 000 – R24 999 (n=206) 51 42 25
R25 000+ (n=46*) 65 55 36
Refuse/Uncertain/Don’t know (n=1008) 13 7 16
PROFILE OF PEOPLE WHO USEBROKERS/FINANCIAL ADVISORS

46
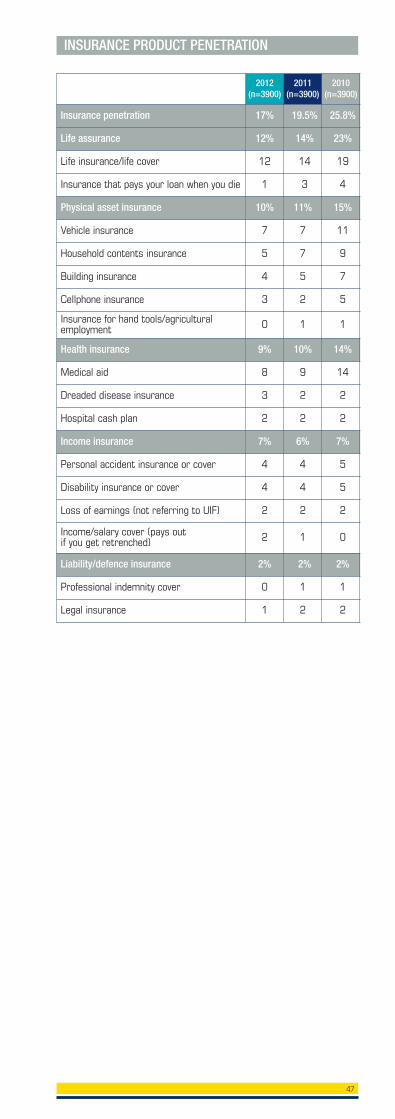
■ 2012 saw a further decline in insurance productpenetration from 19.5% in 2011 to 17% in 2012meaning that 5.7 million adults have at least one ormore insurance products (e.g. life insurance, assetinsurance, health insurance, and/or incomeinsurance)
■ A decline in insurance product penetration can beseen across all the categories, besides incomeinsurance. Income/salary cover increased by 1%point
■ Uptake of insurance is particularly low among peoplein lower LSM groups. Only 3% of people in LSM 1 –5 have insurance product(s) – uptake is driven by lifecover and cellphone insurance
■ Life insurance continues to decline: 12% (4.1 million)of adults in South Africa have some life assurancecovering defined risks, compared to 14% in 2011
■ There is a decline particularly among Asian/ Indianadults, among people residing in rural formal areas,as well as among people in low income groups
■ Monetary reasons (cannot afford/too expensive) isstated as the primary reason for not having lifeinsurance or life cover
■ The need for consumer education is again highlightedsince many have never thought of it, do not want it,do not know enough about it, or do not believe in it
■ 5% of adults currently have household contentsinsurance in their name while another 2% arecovered by someone else
■ Household contents insurance is common amongwomen than men (55% compared to 45%respectively)
INSURANCE PRODUCT USAGE
47
INSURANCE PRODUCT PENETRATION
2012(n=3900)
2011(n=3900)
2010(n=3900)
Insurance penetration 17% 19.5% 25.8%
Life assurance 12% 14% 23%
Life insurance/life cover 12 14 19
Insurance that pays your loan when you die 1 3 4
Physical asset insurance 10% 11% 15%
Vehicle insurance 7 7 11
Household contents insurance 5 7 9
Building insurance 4 5 7
Cellphone insurance 3 2 5
Insurance for hand tools/agriculturalemployment 0 1 1
Health insurance 9% 10% 14%
Medical aid 8 9 14
Dreaded disease insurance 3 2 2
Hospital cash plan 2 2 2
Income insurance 7% 6% 7%
Personal accident insurance or cover 4 4 5
Disability insurance or cover 4 4 5
Loss of earnings (not referring to UIF) 2 2 2
Income/salary cover (pays outif you get retrenched) 2 1 0
Liability/defence insurance 2% 2% 2%
Professional indemnity cover 0 1 1
Legal insurance 1 2 2
48
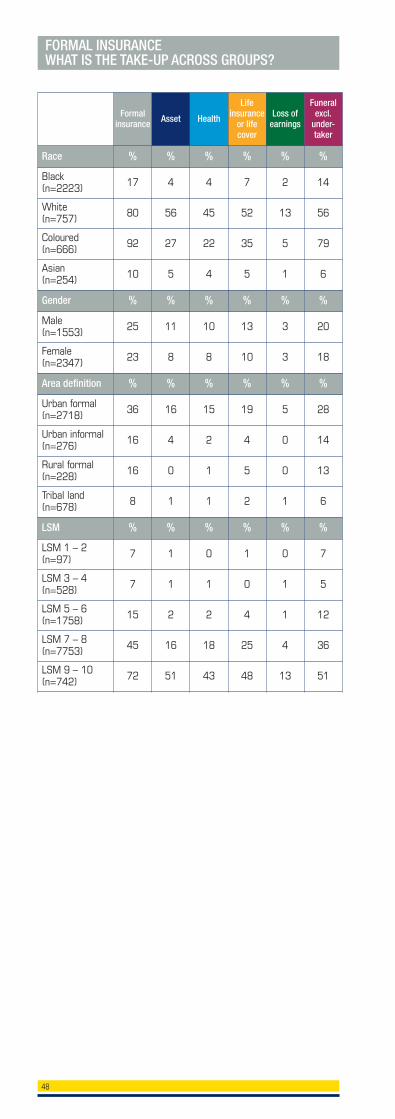
FORMAL INSURANCE WHAT IS THE TAKE-UP ACROSS GROUPS?
Formalinsurance Asset Health
Lifeinsurance
or lifecover
Loss ofearnings
Funeralexcl.
under-taker
Race % % % % % %
Black (n=2223) 17 4 4 7 2 14
White (n=757) 80 56 45 52 13 56
Coloured (n=666) 92 27 22 35 5 79
Asian (n=254) 10 5 4 5 1 6
Gender % % % % % %
Male (n=1553) 25 11 10 13 3 20
Female (n=2347) 23 8 8 10 3 18
Area definition % % % % % %
Urban formal (n=2718) 36 16 15 19 5 28
Urban informal (n=276) 16 4 2 4 0 14
Rural formal (n=228) 16 0 1 5 0 13
Tribal land (n=678) 8 1 1 2 1 6
LSM % % % % % %
LSM 1 – 2 (n=97) 7 1 0 1 0 7
LSM 3 – 4 (n=528) 7 1 1 0 1 5
LSM 5 – 6 (n=1758) 15 2 2 4 1 12
LSM 7 – 8 (n=7753) 45 16 18 25 4 36
LSM 9 – 10 (n=742) 72 51 43 48 13 51
49
2012 2011 2010
Race % % %
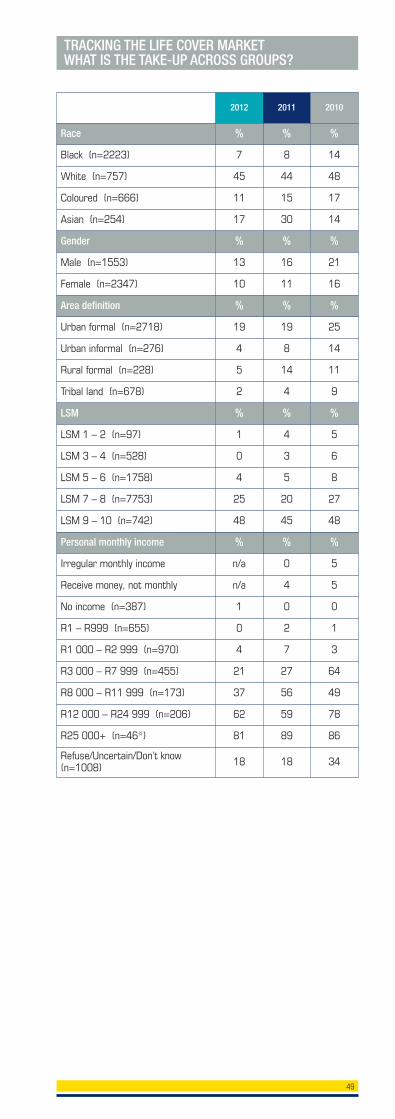
Black (n=2223) 7 8 14
White (n=757) 45 44 48
Coloured (n=666) 11 15 17
Asian (n=254) 17 30 14
Gender % % %
Male (n=1553) 13 16 21
Female (n=2347) 10 11 16
Area definition % % %
Urban formal (n=2718) 19 19 25
Urban informal (n=276) 4 8 14
Rural formal (n=228) 5 14 11
Tribal land (n=678) 2 4 9
LSM % % %
LSM 1 – 2 (n=97) 1 4 5
LSM 3 – 4 (n=528) 0 3 6
LSM 5 – 6 (n=1758) 4 5 8
LSM 7 – 8 (n=7753) 25 20 27
LSM 9 – 10 (n=742) 48 45 48
Personal monthly income % % %
Irregular monthly income n/a 0 5
Receive money, not monthly n/a 4 5
No income (n=387) 1 0 0
R1 – R999 (n=655) 0 2 1
R1 000 – R2 999 (n=970) 4 7 3
R3 000 – R7 999 (n=455) 21 27 64
R8 000 – R11 999 (n=173) 37 56 49
R12 000 – R24 999 (n=206) 62 59 78
R25 000+ (n=46*) 81 89 86
Refuse/Uncertain/Don’t know(n=1008) 18 18 34
TRACKING THE LIFE COVER MARKETWHAT IS THE TAKE-UP ACROSS GROUPS?
50
2012 2011 2010
Race % % %
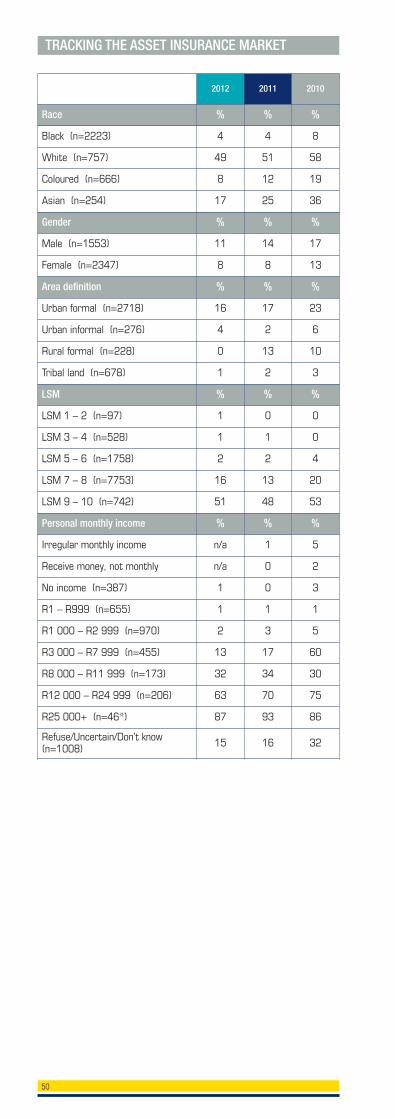
Black (n=2223) 4 4 8
White (n=757) 49 51 58
Coloured (n=666) 8 12 19
Asian (n=254) 17 25 36
Gender % % %
Male (n=1553) 11 14 17
Female (n=2347) 8 8 13
Area definition % % %
Urban formal (n=2718) 16 17 23
Urban informal (n=276) 4 2 6
Rural formal (n=228) 0 13 10
Tribal land (n=678) 1 2 3
LSM % % %
LSM 1 – 2 (n=97) 1 0 0
LSM 3 – 4 (n=528) 1 1 0
LSM 5 – 6 (n=1758) 2 2 4
LSM 7 – 8 (n=7753) 16 13 20
LSM 9 – 10 (n=742) 51 48 53
Personal monthly income % % %
Irregular monthly income n/a 1 5
Receive money, not monthly n/a 0 2
No income (n=387) 1 0 3
R1 – R999 (n=655) 1 1 1
R1 000 – R2 999 (n=970) 2 3 5
R3 000 – R7 999 (n=455) 13 17 60
R8 000 – R11 999 (n=173) 32 34 30
R12 000 – R24 999 (n=206) 63 70 75
R25 000+ (n=46*) 87 93 86
Refuse/Uncertain/Don’t know(n=1008) 15 16 32
TRACKING THE ASSET INSURANCE MARKET
51
2012 2011 2010
Race % % %
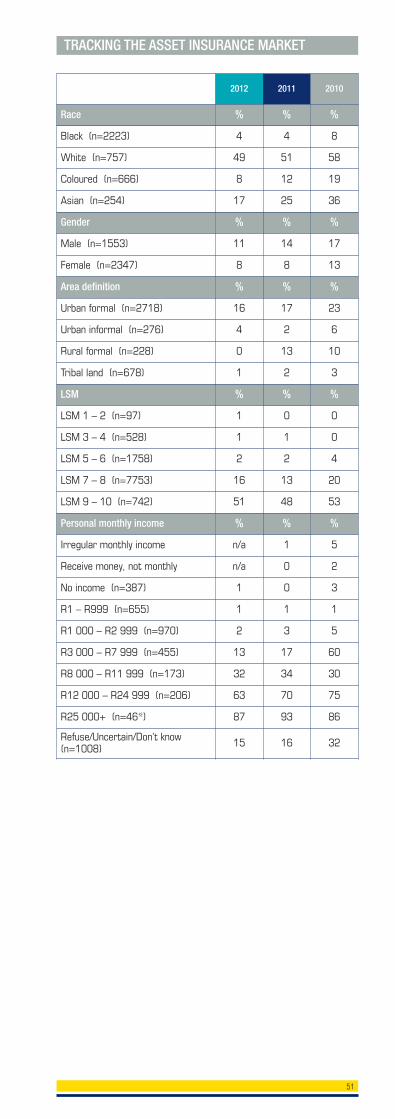
Black (n=2223) 4 4 8
White (n=757) 49 51 58
Coloured (n=666) 8 12 19
Asian (n=254) 17 25 36
Gender % % %
Male (n=1553) 11 14 17
Female (n=2347) 8 8 13
Area definition % % %
Urban formal (n=2718) 16 17 23
Urban informal (n=276) 4 2 6
Rural formal (n=228) 0 13 10
Tribal land (n=678) 1 2 3
LSM % % %
LSM 1 – 2 (n=97) 1 0 0
LSM 3 – 4 (n=528) 1 1 0
LSM 5 – 6 (n=1758) 2 2 4
LSM 7 – 8 (n=7753) 16 13 20
LSM 9 – 10 (n=742) 51 48 53
Personal monthly income % % %
Irregular monthly income n/a 1 5
Receive money, not monthly n/a 0 2
No income (n=387) 1 0 3
R1 – R999 (n=655) 1 1 1
R1 000 – R2 999 (n=970) 2 3 5
R3 000 – R7 999 (n=455) 13 17 60
R8 000 – R11 999 (n=173) 32 34 30
R12 000 – R24 999 (n=206) 63 70 75
R25 000+ (n=46*) 87 93 86
Refuse/Uncertain/Don’t know(n=1008) 15 16 32
TRACKING THE ASSET INSURANCE MARKET
52
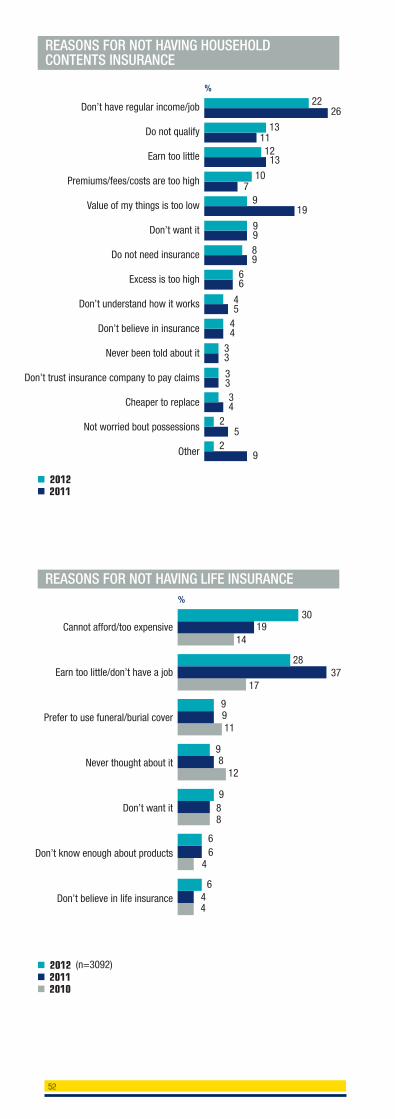
REASONS FOR NOT HAVING HOUSEHOLDCONTENTS INSURANCE
Don’t have regular income/job
Do not qualify
Earn too little
Premiums/fees/costs are too high
Value of my things is too low
Don’t want it
Do not need insurance
Excess is too high
Don’t understand how it works
Don’t believe in insurance
Never been told about it
Don’t trust insurance company to pay claims
Cheaper to replace
Not worried bout possessions
Other
22%
■ 2012■ 2011
26
131112
13
107
919
9989
66
44
33
3334
45
25
29
Cannot afford/too expensive
Earn too little/don’t have a job
Prefer to use funeral/burial cover
Never thought about it
Don’t want it
Don’t know enough about products
Don’t believe in life insurance
30
%
■ 2012 (n=3092)■ 2011■ 2010
1914
2837
17
9911
98
889
644
66
4
12
REASONS FOR NOT HAVING LIFE INSURANCE
53
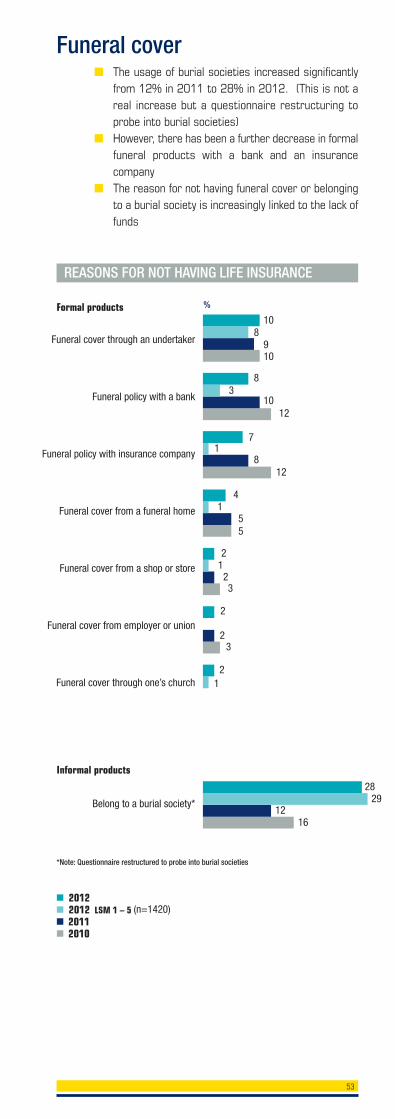
■ The usage of burial societies increased significantlyfrom 12% in 2011 to 28% in 2012. (This is not areal increase but a questionnaire restructuring toprobe into burial societies)
■ However, there has been a further decrease in formalfuneral products with a bank and an insurancecompany
■ The reason for not having funeral cover or belongingto a burial society is increasingly linked to the lack offunds
Funeral cover
■ 2012■ 2012 LSM 1 – 5 (n=1420)■ 2011■ 2010
Funeral cover through an undertaker
Funeral policy with a bank
Funeral policy with insurance company
Funeral cover from a funeral home
Funeral cover from a shop or store
Funeral cover from employer or union
Funeral cover through one’s church
Belong to a burial society*
10
%
8910
83
1012
71
8
51
4
23
2
23
21
2829
1216
5
21
12
REASONS FOR NOT HAVING LIFE INSURANCE
*Note: Questionnaire restructured to probe into burial societies
Formal products
Informal products
54
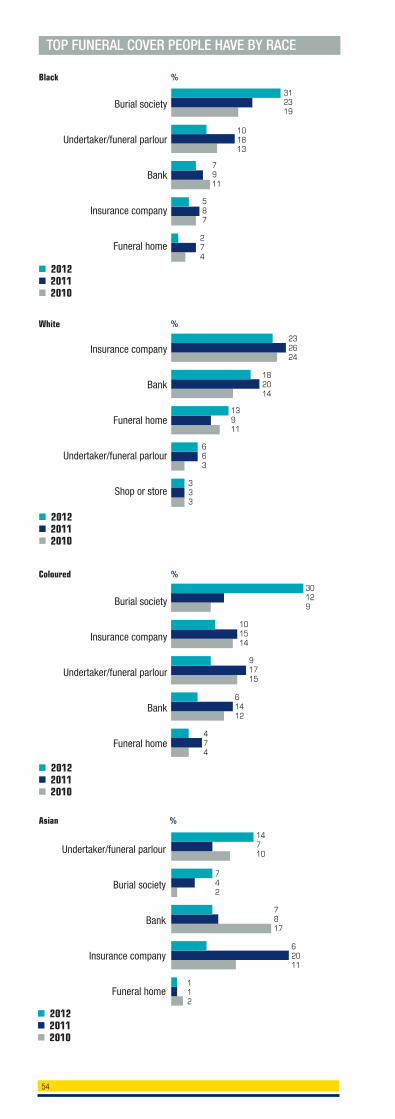
TOP FUNERAL COVER PEOPLE HAVE BY RACE
Burial society
Undertaker/funeral parlour
Bank
Insurance company
Funeral home
Black
■ 2012■ 2011■ 2010
■ 2012■ 2011■ 2010
■ 2012■ 2011■ 2010
■ 2012■ 2011■ 2010
White
Coloured
Asian
Insurance company
Bank
Funeral home
Undertaker/funeral parlour
Shop or store
Burial society
Insurance company
Undertaker/funeral parlour
Bank
Funeral home
Undertaker/funeral parlour
Burial society
Bank
Insurance company
Funeral home
%
%
%
%
312319
101813
7911
587
274
232624
182014
13911
663
333
30129
101514
91715
61412
474
14710
742
7817
62011
112
55
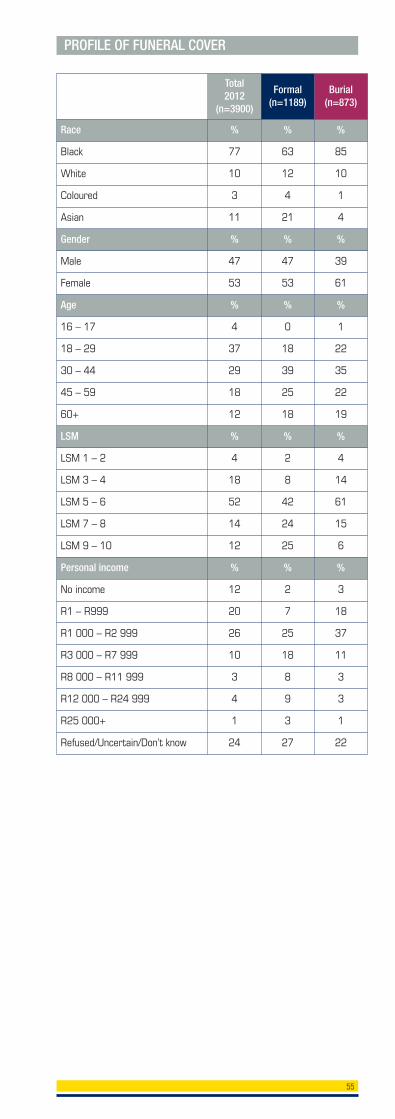
PROFILE OF FUNERAL COVER
Total2012
(n=3900)
Formal (n=1189)
Burial(n=873)
Race % % %
Black 77 63 85
White 10 12 10
Coloured 3 4 1
Asian 11 21 4
Gender % % %
Male 47 47 39
Female 53 53 61
Age % % %
16 – 17 4 0 1
18 – 29 37 18 22
30 – 44 29 39 35
45 – 59 18 25 22
60+ 12 18 19
LSM % % %
LSM 1 – 2 4 2 4
LSM 3 – 4 18 8 14
LSM 5 – 6 52 42 61
LSM 7 – 8 14 24 15
LSM 9 – 10 12 25 6
Personal income % % %
No income 12 2 3
R1 – R999 20 7 18
R1 000 – R2 999 26 25 37
R3 000 – R7 999 10 18 11
R8 000 – R11 999 3 8 3
R12 000 – R24 999 4 9 3
R25 000+ 1 3 1
Refused/Uncertain/Don’t know 24 27 22
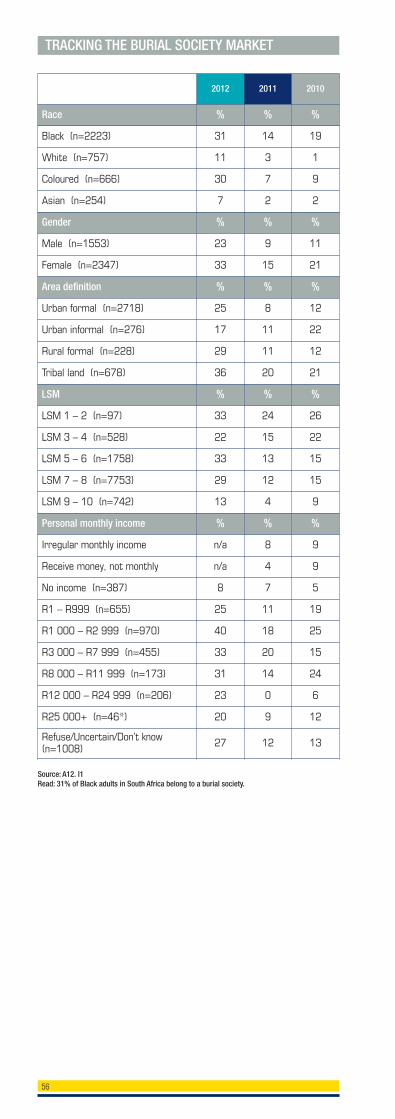
2012 2011 2010
Race % % %
Black (n=2223) 31 14 19
White (n=757) 11 3 1
Coloured (n=666) 30 7 9
Asian (n=254) 7 2 2
Gender % % %
Male (n=1553) 23 9 11
Female (n=2347) 33 15 21
Area definition % % %
Urban formal (n=2718) 25 8 12
Urban informal (n=276) 17 11 22
Rural formal (n=228) 29 11 12
Tribal land (n=678) 36 20 21
LSM % % %
LSM 1 – 2 (n=97) 33 24 26
LSM 3 – 4 (n=528) 22 15 22
LSM 5 – 6 (n=1758) 33 13 15
LSM 7 – 8 (n=7753) 29 12 15
LSM 9 – 10 (n=742) 13 4 9
Personal monthly income % % %
Irregular monthly income n/a 8 9
Receive money, not monthly n/a 4 9
No income (n=387) 8 7 5
R1 – R999 (n=655) 25 11 19
R1 000 – R2 999 (n=970) 40 18 25
R3 000 – R7 999 (n=455) 33 20 15
R8 000 – R11 999 (n=173) 31 14 24
R12 000 – R24 999 (n=206) 23 0 6
R25 000+ (n=46*) 20 9 12
Refuse/Uncertain/Don’t know(n=1008) 27 12 13
TRACKING THE BURIAL SOCIETY MARKET
Source: A12. I1Read: 31% of Black adults in South Africa belong to a burial society.
56
57
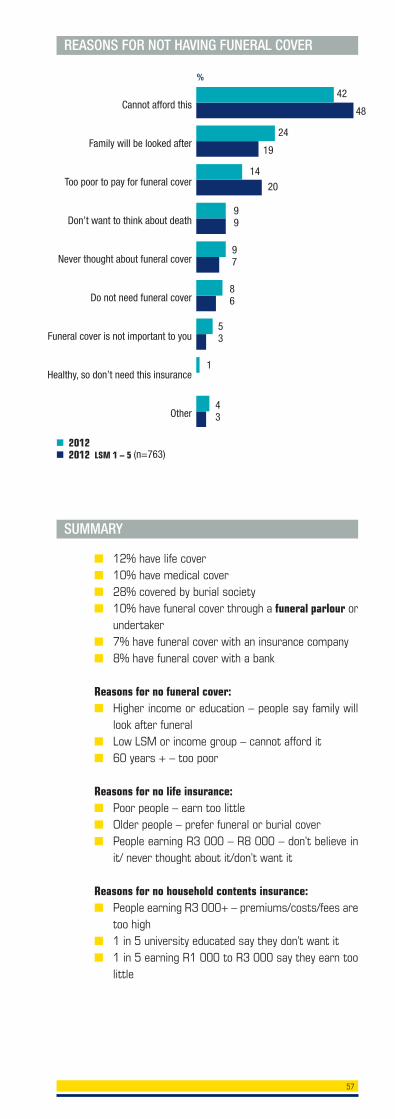
Cannot afford this
Family will be looked after
Too poor to pay for funeral cover
Don’t want to think about death
Never thought about funeral cover
Do not need funeral cover
Funeral cover is not important to you
Healthy, so don’t need this insurance
Other
42
%
■ 2012■ 2012 LSM 1 – 5 (n=763)
48
24
19
14
20
1
43
REASONS FOR NOT HAVING FUNERAL COVER
99
97
86
53
SUMMARY
■ 12% have life cover■ 10% have medical cover■ 28% covered by burial society■ 10% have funeral cover through a funeral parlour or
undertaker■ 7% have funeral cover with an insurance company■ 8% have funeral cover with a bank
Reasons for no funeral cover:■ Higher income or education – people say family will
look after funeral■ Low LSM or income group – cannot afford it■ 60 years + – too poor
Reasons for no life insurance:■ Poor people – earn too little■ Older people – prefer funeral or burial cover■ People earning R3 000 – R8 000 – don’t believe in
it/ never thought about it/don’t want it
Reasons for no household contents insurance:■ People earning R3 000+ – premiums/costs/fees are
too high■ 1 in 5 university educated say they don’t want it■ 1 in 5 earning R1 000 to R3 000 say they earn too
little
58
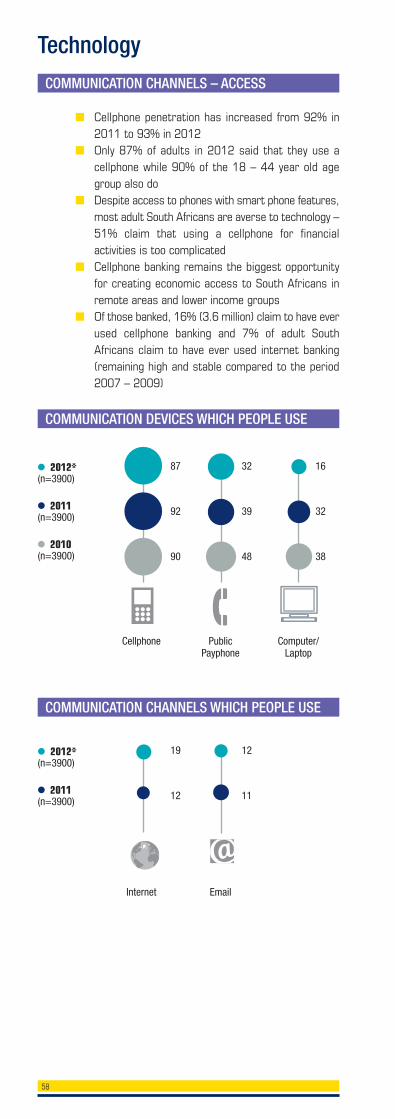
Technology
COMMUNICATION CHANNELS – ACCESS
COMMUNICATION DEVICES WHICH PEOPLE USE
■ Cellphone penetration has increased from 92% in2011 to 93% in 2012
■ Only 87% of adults in 2012 said that they use acellphone while 90% of the 18 – 44 year old agegroup also do
■ Despite access to phones with smart phone features,most adult South Africans are averse to technology –51% claim that using a cellphone for financialactivities is too complicated
■ Cellphone banking remains the biggest opportunityfor creating economic access to South Africans inremote areas and lower income groups
■ Of those banked, 16% (3.6 million) claim to have everused cellphone banking and 7% of adult SouthAfricans claim to have ever used internet banking(remaining high and stable compared to the period2007 – 2009)
● 2012*(n=3900)
● 2011(n=3900)
Internet Email
19
12
12
11
● 2012*(n=3900)
● 2011(n=3900)
● 2010(n=3900)
Cellphone PublicPayphone
Computer/Laptop
87
92
90
32
39
48
16
32
38
COMMUNICATION CHANNELS WHICH PEOPLE USE
59
87
79
90
90
87
72
32
34
36
34
28
18
19
22
22
20
17
07
16
15
14
21
18
08
12
07
12
15
13
16
Cellphone
Public pay phone
Internet
Computer/laptop
%
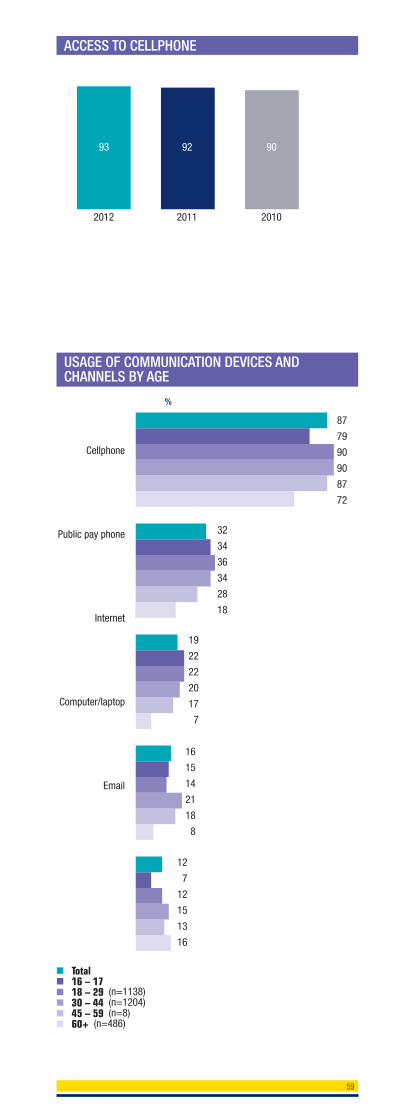
ACCESS TO CELLPHONE
93 92 90
2012 2011 2010
USAGE OF COMMUNICATION DEVICES ANDCHANNELS BY AGE
■ Total■ 16 – 17 ■ 18 – 29 (n=1138)■ 30 – 44 (n=1204)■ 45 – 59 (n=8)■ 60+ (n=486)
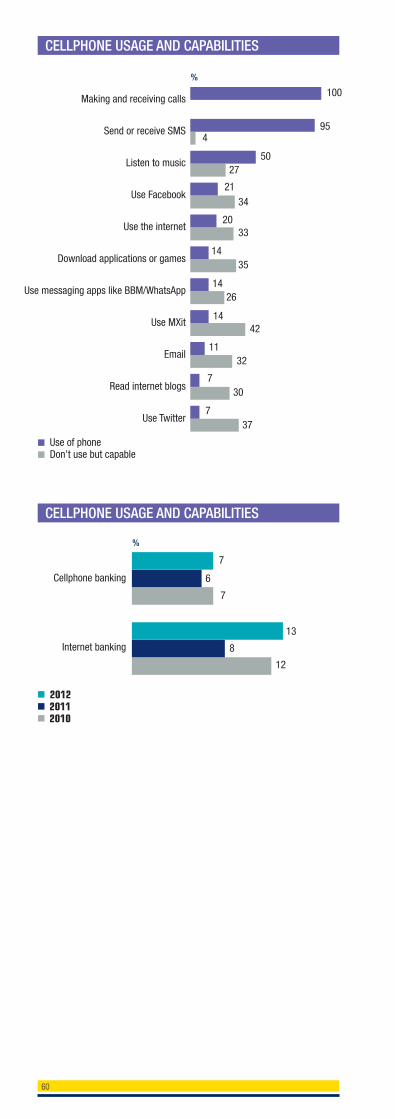
Making and receiving calls
Send or receive SMS
Listen to music
Use Facebook
Use the internet
Download applications or games
Use messaging apps like BBM/WhatsApp
Use MXit
Read internet blogs
Use Twitter
100
%
■ Use of phone■ Don’t use but capable
954
5027
2134
2033
14
1426
1442
1132
730
737
35
CELLPHONE USAGE AND CAPABILITIES
■ 2012■ 2011■ 2010
Cellphone banking
Internet banking
%
7
7
6
13
8
12
CELLPHONE USAGE AND CAPABILITIES
60
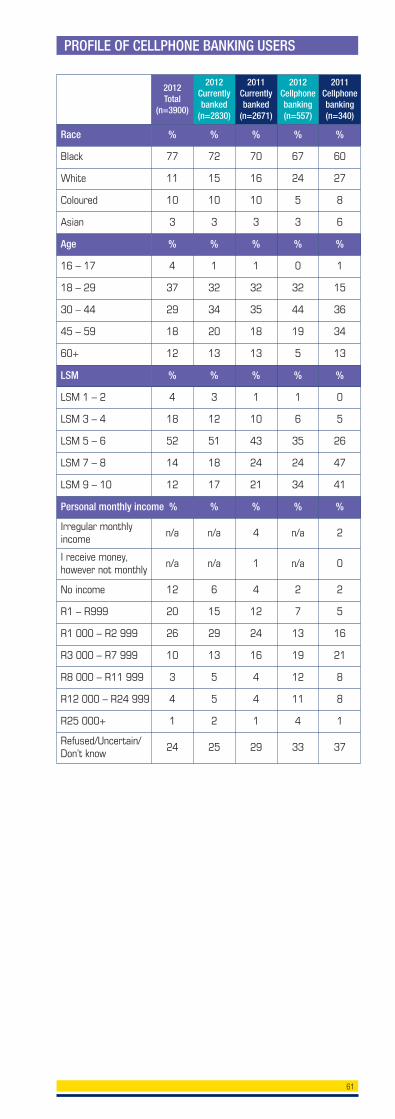
PROFILE OF CELLPHONE BANKING USERS
2012 Total
(n=3900)
2012Currentlybanked
(n=2830)
2011Currentlybanked
(n=2671)
2012Cellphonebanking(n=557)
2011Cellphonebanking(n=340)
Race % % % % %
Black 77 72 70 67 60
White 11 15 16 24 27
Coloured 10 10 10 5 8
Asian 3 3 3 3 6
Age % % % % %
16 – 17 4 1 1 0 1
18 – 29 37 32 32 32 15
30 – 44 29 34 35 44 36
45 – 59 18 20 18 19 34
60+ 12 13 13 5 13
LSM % % % % %
LSM 1 – 2 4 3 1 1 0
LSM 3 – 4 18 12 10 6 5
LSM 5 – 6 52 51 43 35 26
LSM 7 – 8 14 18 24 24 47
LSM 9 – 10 12 17 21 34 41
Personal monthly income % % % % %
Irregular monthlyincome
n/a n/a 4 n/a 2
I receive money,however not monthly
n/a n/a 1 n/a 0
No income 12 6 4 2 2
R1 – R999 20 15 12 7 5
R1 000 – R2 999 26 29 24 13 16
R3 000 – R7 999 10 13 16 19 21
R8 000 – R11 999 3 5 4 12 8
R12 000 – R24 999 4 5 4 11 8
R25 000+ 1 2 1 4 1
Refused/Uncertain/Don’t know
24 25 29 33 37
61
62
Banked in2012
CellphoneBanking in 2012
CellphoneBankingin 2011
InternetBanking in 2012
InternetBanking in 2011
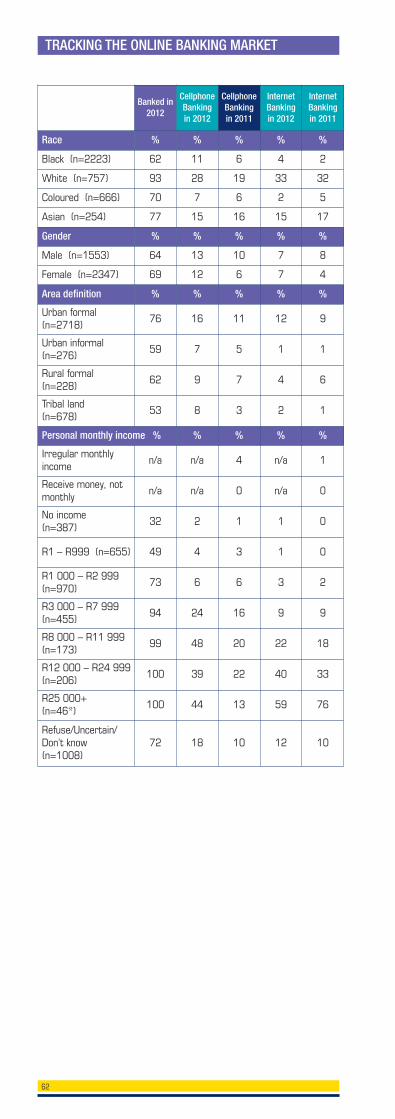
Race % % % % %
Black (n=2223) 62 11 6 4 2
White (n=757) 93 28 19 33 32
Coloured (n=666) 70 7 6 2 5
Asian (n=254) 77 15 16 15 17
Gender % % % % %
Male (n=1553) 64 13 10 7 8
Female (n=2347) 69 12 6 7 4
Area definition % % % % %
Urban formal(n=2718)
76 16 11 12 9
Urban informal(n=276)
59 7 5 1 1
Rural formal(n=228)
62 9 7 4 6
Tribal land (n=678)
53 8 3 2 1
Personal monthly income % % % % %
Irregular monthlyincome
n/a n/a 4 n/a 1
Receive money, notmonthly
n/a n/a 0 n/a 0
No income (n=387)
32 2 1 1 0
R1 – R999 (n=655) 49 4 3 1 0
R1 000 – R2 999(n=970)
73 6 6 3 2
R3 000 – R7 999(n=455)
94 24 16 9 9
R8 000 – R11 999(n=173)
99 48 20 22 18
R12 000 – R24 999(n=206)
100 39 22 40 33
R25 000+ (n=46*)
100 44 13 59 76
Refuse/Uncertain/Don’t know(n=1008)
72 18 10 12 10
TRACKING THE ONLINE BANKING MARKET
63
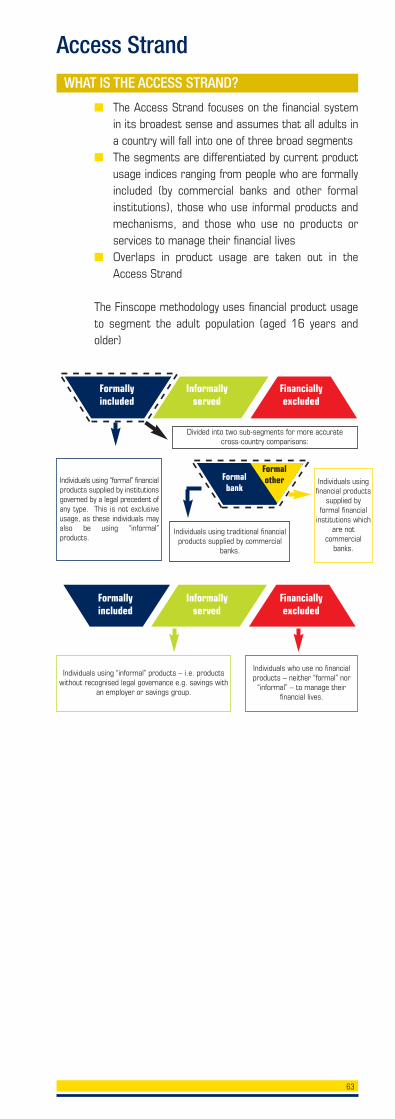
Access StrandWHAT IS THE ACCESS STRAND?
■ The Access Strand focuses on the financial systemin its broadest sense and assumes that all adults ina country will fall into one of three broad segments
■ The segments are differentiated by current productusage indices ranging from people who are formallyincluded (by commercial banks and other formalinstitutions), those who use informal products andmechanisms, and those who use no products orservices to manage their financial lives
■ Overlaps in product usage are taken out in theAccess Strand
The Finscope methodology uses financial product usageto segment the adult population (aged 16 years andolder)
Individuals using “formal” financialproducts supplied by institutionsgoverned by a legal precedent ofany type. This is not exclusiveusage, as these individuals mayalso be using “informal”products.
Individuals using “informal” products – i.e. productswithout recognised legal governance e.g. savings with
an employer or savings group.
Individuals who use no financialproducts – neither “formal” nor
“informal” – to manage theirfinancial lives.
Individuals using traditional financialproducts supplied by commercial
banks.
Individuals usingfinancial products
supplied byformal financial
institutions whichare not
commercialbanks.
Divided into two sub-segments for more accuratecross-country comparisons:
Formally included
Formalbank
Formalother
Informally served
Financiallyexcluded
Formally included
Informally served
Financiallyexcluded
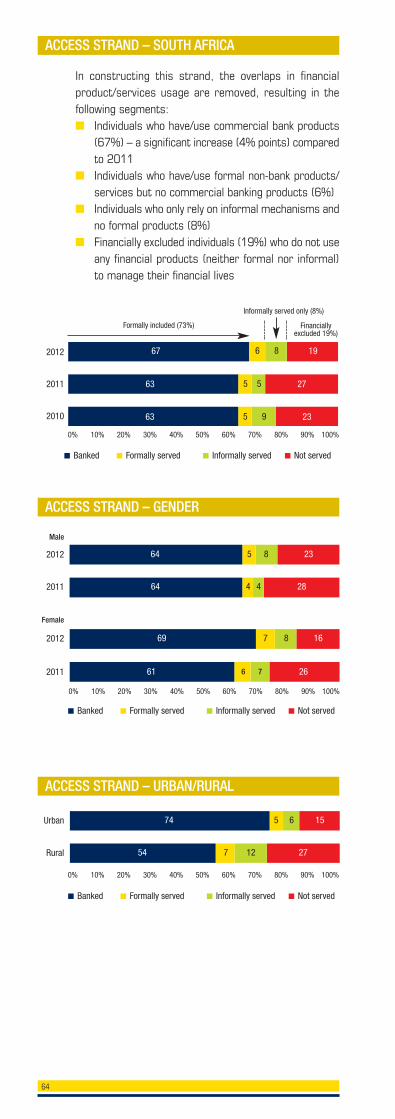
64
2012
Male
64 5 8 23
2011 64 4 4 28
2012 69 7 8 16
2011 61 6 7 26
Female
■ Banked ■ Formally served ■ Informally served ■ Not served
ACCESS STRAND – SOUTH AFRICA
In constructing this strand, the overlaps in financialproduct/services usage are removed, resulting in thefollowing segments:■ Individuals who have/use commercial bank products
(67%) – a significant increase (4% points) comparedto 2011
■ Individuals who have/use formal non-bank products/ services but no commercial banking products (6%)■ Individuals who only rely on informal mechanisms and
no formal products (8%) ■ Financially excluded individuals (19%) who do not use
any financial products (neither formal nor informal)to manage their financial lives
67 1986
63 2755
63 2395
2012
2011
2010
Informally served only (8%)
Financiallyexcluded 19%)
Formally included (73%)
ACCESS STRAND – GENDER
■ Banked ■ Formally served ■ Informally served ■ Not served
0% 10% 20% 30% 40% 50% 60% 70% 80% 90% 100%
0% 10% 20% 30% 40% 50% 60% 70% 80% 90% 100%
Urban 74 5 6 15
Rural 54 7 12 27
ACCESS STRAND – URBAN/RURAL
■ Banked ■ Formally served ■ Informally served ■ Not served
0% 10% 20% 30% 40% 50% 60% 70% 80% 90% 100%
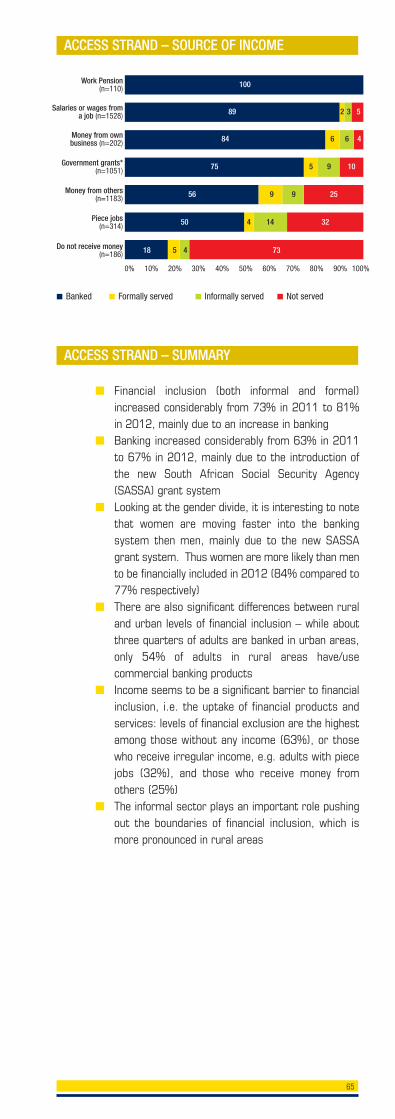
■ Financial inclusion (both informal and formal)increased considerably from 73% in 2011 to 81%in 2012, mainly due to an increase in banking
■ Banking increased considerably from 63% in 2011to 67% in 2012, mainly due to the introduction ofthe new South African Social Security Agency(SASSA) grant system
■ Looking at the gender divide, it is interesting to notethat women are moving faster into the bankingsystem then men, mainly due to the new SASSAgrant system. Thus women are more likely than mento be financially included in 2012 (84% compared to77% respectively)
■ There are also significant differences between ruraland urban levels of financial inclusion – while aboutthree quarters of adults are banked in urban areas,only 54% of adults in rural areas have/usecommercial banking products
■ Income seems to be a significant barrier to financialinclusion, i.e. the uptake of financial products andservices: levels of financial exclusion are the highestamong those without any income (63%), or thosewho receive irregular income, e.g. adults with piecejobs (32%), and those who receive money fromothers (25%)
■ The informal sector plays an important role pushingout the boundaries of financial inclusion, which ismore pronounced in rural areas
65
Work Pension (n=110) 100
Salaries or wages from a job (n=1528) 89 32 5
Money from own business (n=202) 84 66 4
Government grants* (n=1051) 75 95 10
Money from others(n=1183) 56 99 25
Piece jobs (n=314) 50 144 32
Do not receive money(n=186) 18 45 73
ACCESS STRAND – SUMMARY
■ Banked ■ Formally served ■ Informally served ■ Not served
0% 10% 20% 30% 40% 50% 60% 70% 80% 90% 100%
ACCESS STRAND – SOURCE OF INCOME
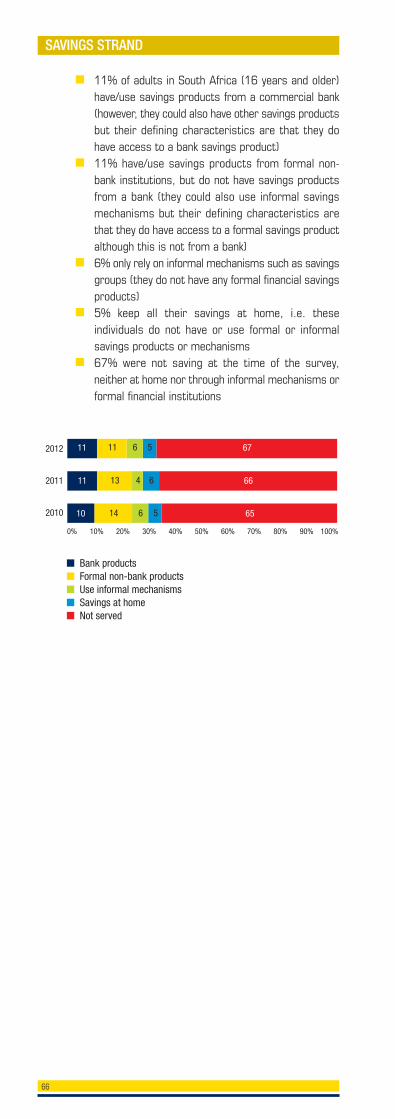
■ 11% of adults in South Africa (16 years and older)have/use savings products from a commercial bank(however, they could also have other savings productsbut their defining characteristics are that they dohave access to a bank savings product)
■ 11% have/use savings products from formal non-bank institutions, but do not have savings productsfrom a bank (they could also use informal savingsmechanisms but their defining characteristics arethat they do have access to a formal savings productalthough this is not from a bank)
■ 6% only rely on informal mechanisms such as savingsgroups (they do not have any formal financial savingsproducts)
■ 5% keep all their savings at home, i.e. theseindividuals do not have or use formal or informalsavings products or mechanisms
■ 67% were not saving at the time of the survey,neither at home nor through informal mechanisms orformal financial institutions
66
■ Bank products ■ Formal non-bank products■ Use informal mechanisms■ Savings at home■ Not served
SAVINGS STRAND
11 676 511
11 664 613
10 656 514
2012
2011
2010
0% 10% 20% 30% 40% 50% 60% 70% 80% 90% 100%
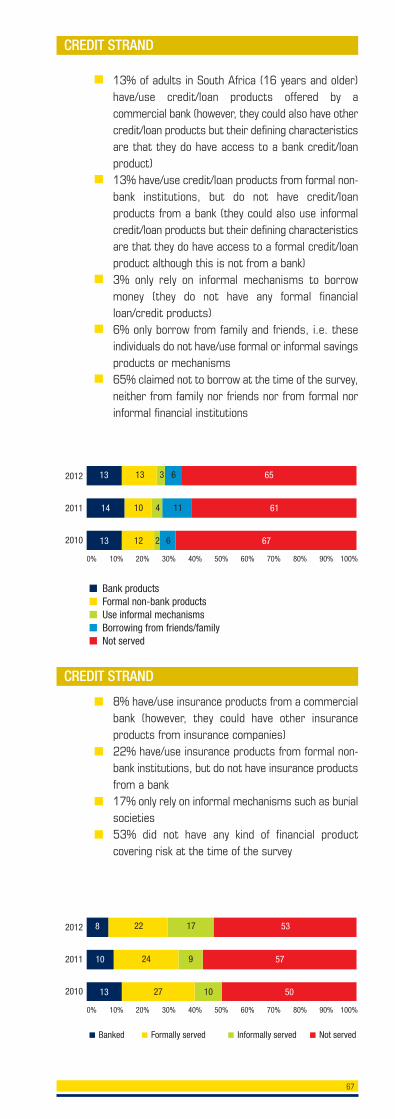
■ 8% have/use insurance products from a commercialbank (however, they could have other insuranceproducts from insurance companies)
■ 22% have/use insurance products from formal non-bank institutions, but do not have insurance productsfrom a bank
■ 17% only rely on informal mechanisms such as burialsocieties
■ 53% did not have any kind of financial productcovering risk at the time of the survey
■ 13% of adults in South Africa (16 years and older)have/use credit/loan products offered by acommercial bank (however, they could also have othercredit/loan products but their defining characteristicsare that they do have access to a bank credit/loanproduct)
■ 13% have/use credit/loan products from formal non-bank institutions, but do not have credit/loanproducts from a bank (they could also use informalcredit/loan products but their defining characteristicsare that they do have access to a formal credit/loanproduct although this is not from a bank)
■ 3% only rely on informal mechanisms to borrowmoney (they do not have any formal financialloan/credit products)
■ 6% only borrow from family and friends, i.e. theseindividuals do not have/use formal or informal savingsproducts or mechanisms
■ 65% claimed not to borrow at the time of the survey,neither from family nor friends nor from formal norinformal financial institutions
67
■ Bank products ■ Formal non-bank products■ Use informal mechanisms■ Borrowing from friends/family■ Not served
CREDIT STRAND
13 653 613
14 614 1110
13 672 612
2012
2011
2010
0% 10% 20% 30% 40% 50% 60% 70% 80% 90% 100%
CREDIT STRAND
8 531722
10 57924
13 501027
2012
2011
2010
0% 10% 20% 30% 40% 50% 60% 70% 80% 90% 100%
■ Banked ■ Formally served ■ Informally served ■ Not served
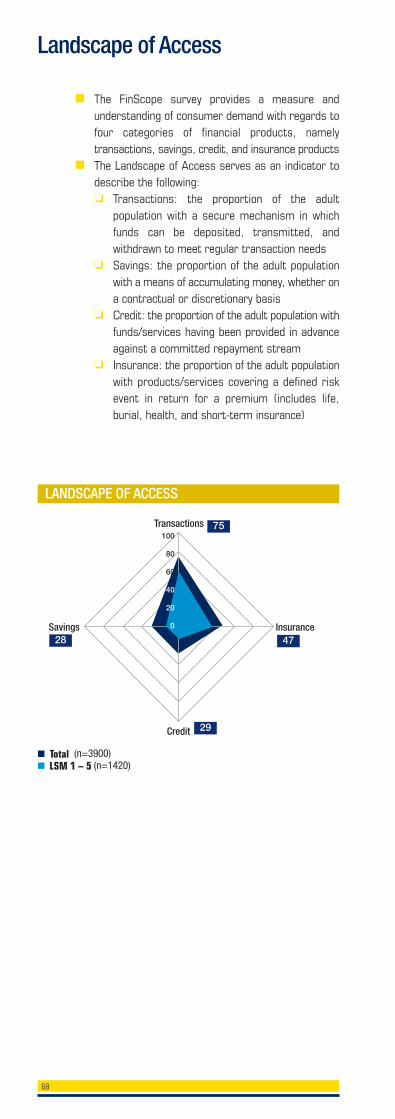
■ The FinScope survey provides a measure andunderstanding of consumer demand with regards tofour categories of financial products, namelytransactions, savings, credit, and insurance products
■ The Landscape of Access serves as an indicator todescribe the following:
❏ Transactions: the proportion of the adultpopulation with a secure mechanism in whichfunds can be deposited, transmitted, andwithdrawn to meet regular transaction needs
❏ Savings: the proportion of the adult populationwith a means of accumulating money, whether ona contractual or discretionary basis
❏ Credit: the proportion of the adult population withfunds/services having been provided in advanceagainst a committed repayment stream
❏ Insurance: the proportion of the adult populationwith products/services covering a defined riskevent in return for a premium (includes life,burial, health, and short-term insurance)
Landscape of Access
75
47
29
100
80
60
40
20
0
28
LANDSCAPE OF ACCESS
68
■ Total (n=3900) ■ LSM 1 – 5 (n=1420)

Tel +27 11 315 9197 Fax +27 86 518 3579www.finmarktrust.org.za
www.finscope.co.za
![[XLS] · Web viewTHE JR TIDBURY FAMILY TRUST WHITING TRUST WEBBER 1950 TRUST TIM JACKSON FAMILY TRUST YOLISWA INVESTMENT TRUST VIC & ANTON FAMILY TRUST VISGAT BOERDERY TRUST WEXFORD](https://img.pdfslide.net/doc/110x75/5ad4ab6f7f8b9a5d058c24ac/xls-viewthe-jr-tidbury-family-trust-whiting-trust-webber-1950-trust-tim-jackson.jpg)