Embed Size (px)
Citation preview
Separate Remains Unequal: Contemporary Segregation and Racial Disparities in School District Revenue
Resource exposure is believed to be a key mechanism linking patterns of racial segregation
and student outcomes during the Brown v. Board of Education era. Decades later, literature
suggests that past progress on school desegregation may have stalled, raising concerns
about resource equity and associated student outcomes. Are recent trends in segregation
associated with racial disparities in school resources? Drawing on national data from the
School Funding Fairness Data System and the Common Core of Data, this study examines the
partial association between contemporary patterns of segregation between districts within a
state and racial disparities in school district revenue over time. We find that increases in racial
segregation, net of racial socioeconomic segregation and other racial differences between
districts, are associated with racial disparities in revenue. These findings suggest that
purportedly race neutral funding formulas and policies may not be completely race neutral
and could be reproducing social inequality.
ABSTRACTAUTHORS
VERSION
March 2019
Suggested citation: Weathers, E.S., & Sosina, V.E. (2019). Separate Remains Unequal: Contemporary Segregation and Racial Disparities in School District Revenue (CEPA Working Paper No.19-02). Retrieved from Stanford Center for Education Policy Analysis: http://cepa.stanford.edu/wp19-02
CEPA Working Paper No. 19-02
Ericka S. WeathersPennsylvania State University
Victoria E. SosinaStanford University
1
Separate Remains Unequal: Contemporary Segregation and Racial Disparities in School District
Revenue
Ericka S. Weathers1
The Pennsylvania State University
Victoria E. Sosina
Stanford University
Acknowledgements: The authors thank sean reardon, prudence carter, Thomas Dee, and Bill
Koski for helpful feedback on previous iterations of this article.
1 Ericka Weathers, Assistant Professor. Email: [email protected]. Telephone: 814-863-3769
2
Abstract
Resource exposure is believed to be a key mechanism linking patterns of racial segregation and
student outcomes during the Brown v. Board of Education era. Decades later, literature suggests
that past progress on school desegregation may have stalled, raising concerns about resource
equity and associated student outcomes. Are recent trends in segregation associated with racial
disparities in school resources? Drawing on national data from the School Funding Fairness Data
System and the Common Core of Data, this study examines the partial association between
contemporary patterns of segregation between districts within a state and racial disparities in
school district revenue over time. We find that increases in racial segregation, net of racial
socioeconomic segregation and other racial differences between districts, are associated with
racial disparities in revenue. These findings suggest that purportedly race neutral funding
formulas and policies may not be completely race neutral and could be reproducing social
inequality.
3
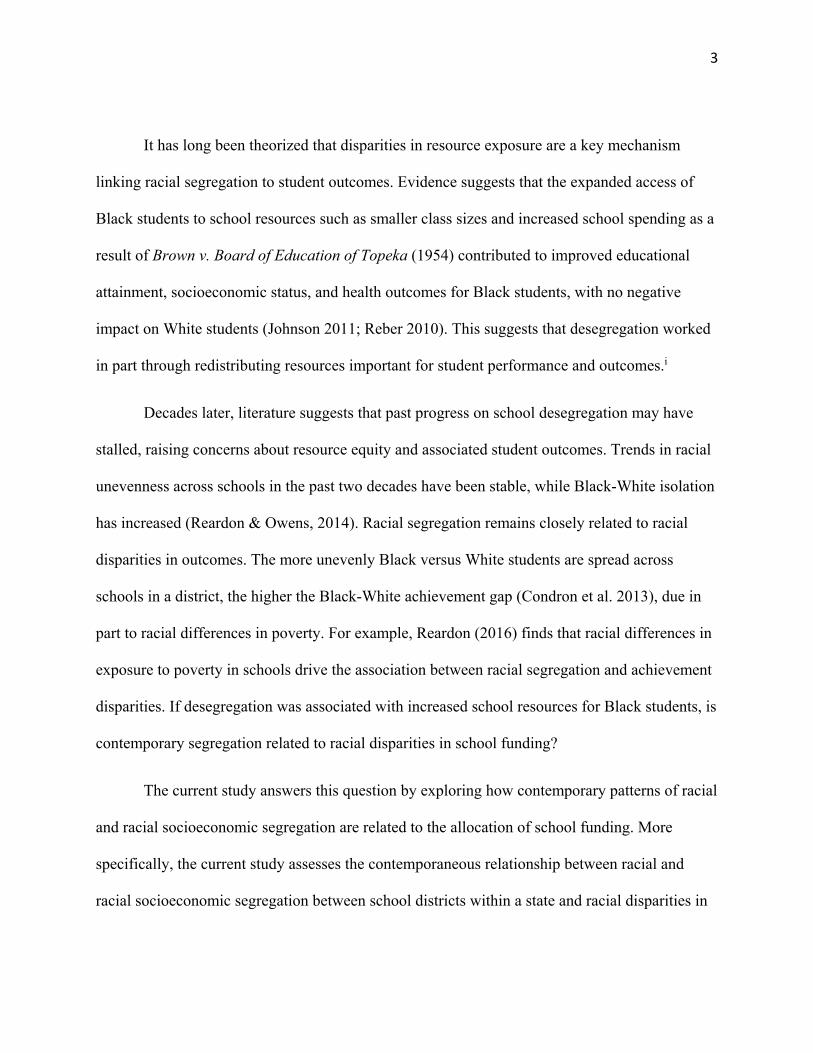
It has long been theorized that disparities in resource exposure are a key mechanism
linking racial segregation to student outcomes. Evidence suggests that the expanded access of
Black students to school resources such as smaller class sizes and increased school spending as a
result of Brown v. Board of Education of Topeka (1954) contributed to improved educational
attainment, socioeconomic status, and health outcomes for Black students, with no negative
impact on White students (Johnson 2011; Reber 2010). This suggests that desegregation worked
in part through redistributing resources important for student performance and outcomes.i
Decades later, literature suggests that past progress on school desegregation may have
stalled, raising concerns about resource equity and associated student outcomes. Trends in racial
unevenness across schools in the past two decades have been stable, while Black-White isolation
has increased (Reardon & Owens, 2014). Racial segregation remains closely related to racial
disparities in outcomes. The more unevenly Black versus White students are spread across
schools in a district, the higher the Black-White achievement gap (Condron et al. 2013), due in
part to racial differences in poverty. For example, Reardon (2016) finds that racial differences in
exposure to poverty in schools drive the association between racial segregation and achievement
disparities. If desegregation was associated with increased school resources for Black students, is
contemporary segregation related to racial disparities in school funding?
The current study answers this question by exploring how contemporary patterns of racial
and racial socioeconomic segregation are related to the allocation of school funding. More
specifically, the current study assesses the contemporaneous relationship between racial and
racial socioeconomic segregation between school districts within a state and racial disparities in
4
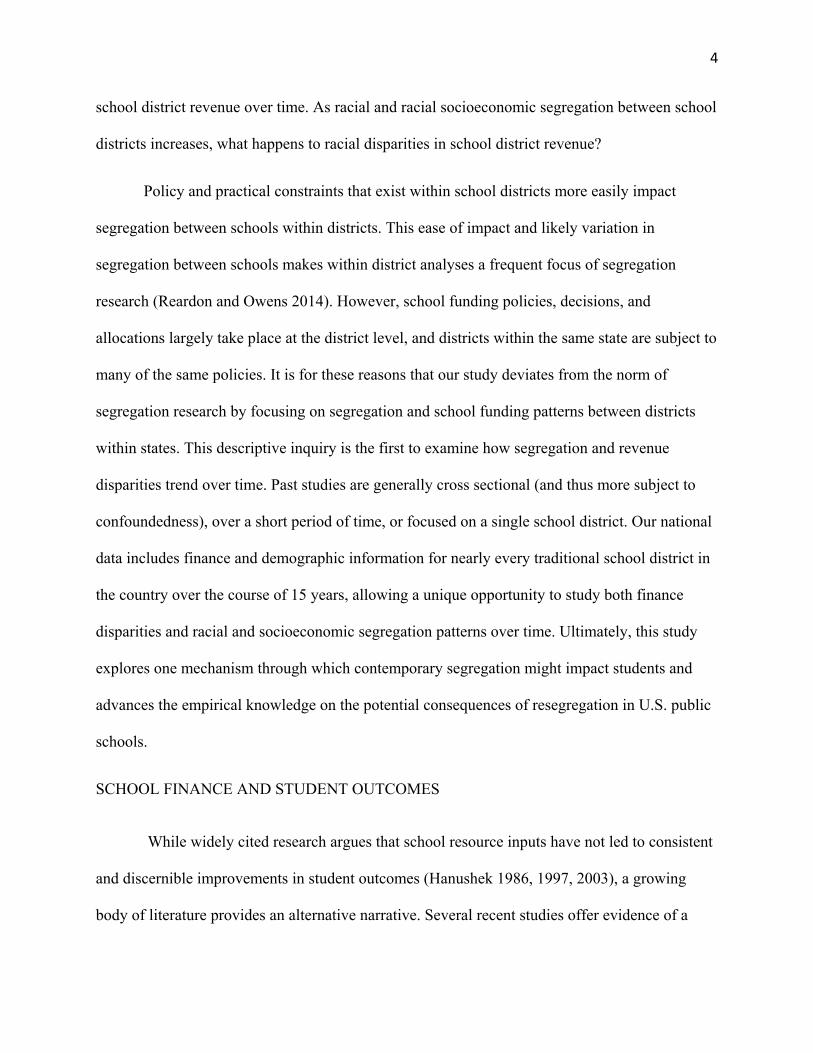
school district revenue over time. As racial and racial socioeconomic segregation between school
districts increases, what happens to racial disparities in school district revenue?
Policy and practical constraints that exist within school districts more easily impact
segregation between schools within districts. This ease of impact and likely variation in
segregation between schools makes within district analyses a frequent focus of segregation
research (Reardon and Owens 2014). However, school funding policies, decisions, and
allocations largely take place at the district level, and districts within the same state are subject to
many of the same policies. It is for these reasons that our study deviates from the norm of
segregation research by focusing on segregation and school funding patterns between districts
within states. This descriptive inquiry is the first to examine how segregation and revenue
disparities trend over time. Past studies are generally cross sectional (and thus more subject to
confoundedness), over a short period of time, or focused on a single school district. Our national
data includes finance and demographic information for nearly every traditional school district in
the country over the course of 15 years, allowing a unique opportunity to study both finance
disparities and racial and socioeconomic segregation patterns over time. Ultimately, this study
explores one mechanism through which contemporary segregation might impact students and
advances the empirical knowledge on the potential consequences of resegregation in U.S. public
schools.
SCHOOL FINANCE AND STUDENT OUTCOMES
While widely cited research argues that school resource inputs have not led to consistent
and discernible improvements in student outcomes (Hanushek 1986, 1997, 2003), a growing
body of literature provides an alternative narrative. Several recent studies offer evidence of a
5
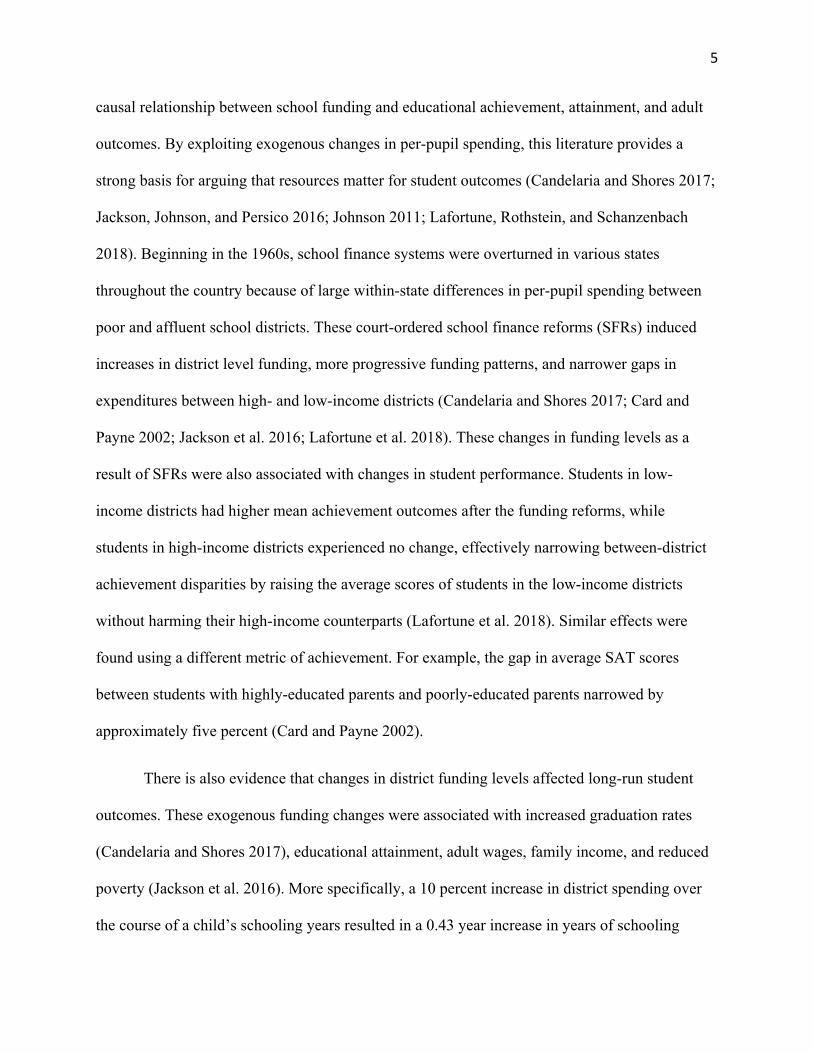
causal relationship between school funding and educational achievement, attainment, and adult
outcomes. By exploiting exogenous changes in per-pupil spending, this literature provides a
strong basis for arguing that resources matter for student outcomes (Candelaria and Shores 2017;
Jackson, Johnson, and Persico 2016; Johnson 2011; Lafortune, Rothstein, and Schanzenbach
2018). Beginning in the 1960s, school finance systems were overturned in various states
throughout the country because of large within-state differences in per-pupil spending between
poor and affluent school districts. These court-ordered school finance reforms (SFRs) induced
increases in district level funding, more progressive funding patterns, and narrower gaps in
expenditures between high- and low-income districts (Candelaria and Shores 2017; Card and
Payne 2002; Jackson et al. 2016; Lafortune et al. 2018). These changes in funding levels as a
result of SFRs were also associated with changes in student performance. Students in low-
income districts had higher mean achievement outcomes after the funding reforms, while
students in high-income districts experienced no change, effectively narrowing between-district
achievement disparities by raising the average scores of students in the low-income districts
without harming their high-income counterparts (Lafortune et al. 2018). Similar effects were
found using a different metric of achievement. For example, the gap in average SAT scores
between students with highly-educated parents and poorly-educated parents narrowed by
approximately five percent (Card and Payne 2002).
There is also evidence that changes in district funding levels affected long-run student
outcomes. These exogenous funding changes were associated with increased graduation rates
(Candelaria and Shores 2017), educational attainment, adult wages, family income, and reduced
poverty (Jackson et al. 2016). More specifically, a 10 percent increase in district spending over
the course of a child’s schooling years resulted in a 0.43 year increase in years of schooling
6
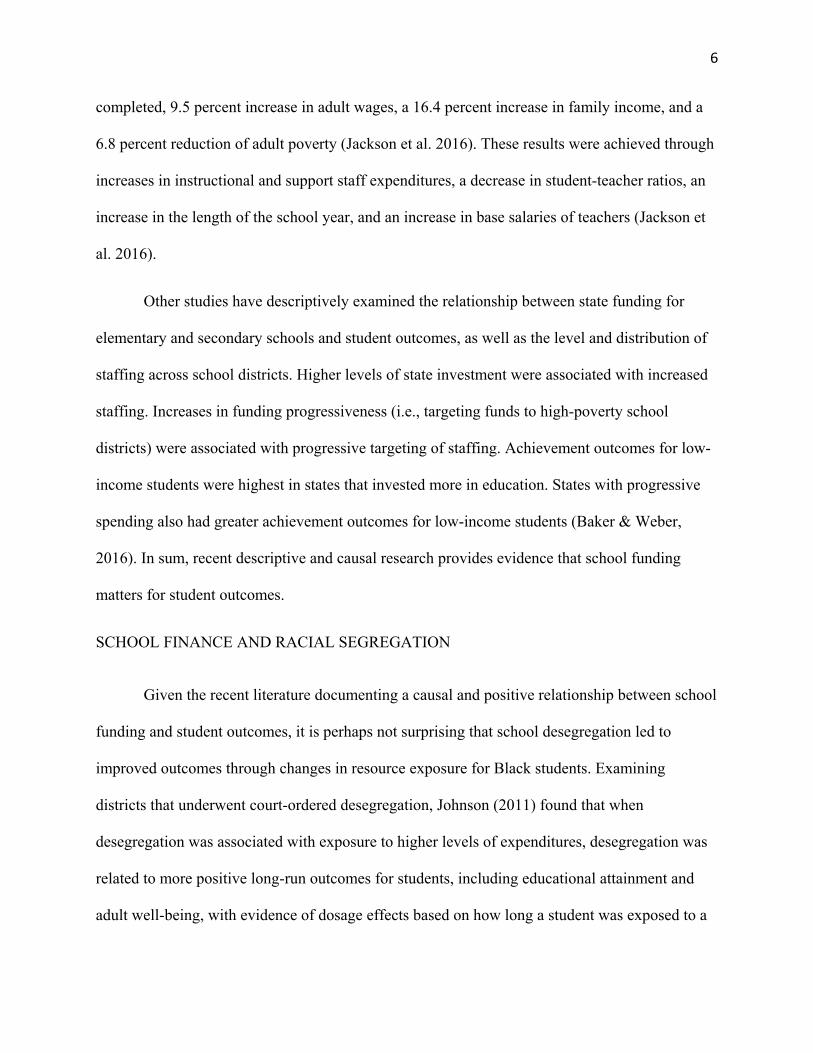
completed, 9.5 percent increase in adult wages, a 16.4 percent increase in family income, and a
6.8 percent reduction of adult poverty (Jackson et al. 2016). These results were achieved through
increases in instructional and support staff expenditures, a decrease in student-teacher ratios, an
increase in the length of the school year, and an increase in base salaries of teachers (Jackson et
al. 2016).
Other studies have descriptively examined the relationship between state funding for
elementary and secondary schools and student outcomes, as well as the level and distribution of
staffing across school districts. Higher levels of state investment were associated with increased
staffing. Increases in funding progressiveness (i.e., targeting funds to high-poverty school
districts) were associated with progressive targeting of staffing. Achievement outcomes for low-
income students were highest in states that invested more in education. States with progressive
spending also had greater achievement outcomes for low-income students (Baker & Weber,
2016). In sum, recent descriptive and causal research provides evidence that school funding
matters for student outcomes.
SCHOOL FINANCE AND RACIAL SEGREGATION
Given the recent literature documenting a causal and positive relationship between school
funding and student outcomes, it is perhaps not surprising that school desegregation led to
improved outcomes through changes in resource exposure for Black students. Examining
districts that underwent court-ordered desegregation, Johnson (2011) found that when
desegregation was associated with exposure to higher levels of expenditures, desegregation was
related to more positive long-run outcomes for students, including educational attainment and
adult well-being, with evidence of dosage effects based on how long a student was exposed to a
7
desegregated higher resource context (Johnson 2011). Whereas schools that desegregated
without these higher levels of expenditures were not associated with the same positive changes in
long-term impacts (Johnson 2011), providing evidence that past desegregation improved
outcomes through changing the resource context of Black students. Reber (2010) reached similar
conclusions in a study of the change in resource levels and peer exposure that occurred as a
result of desegregation in Louisiana. Reber (2010) found evidence that exposure to an increased
level of resources was associated with larger reductions in student dropout rates than peer
exposure. In other words, desegregation improved outcomes by narrowing resource disparities,
suggesting that segregation was associated with high resource disparities that in part lead to
disparities in outcomes.
Further, studies of Nashville public schools’ transition to unitary status and subsequent
resegregation suggest that, with deliberate policy action, resegregation need not be accompanied
by widening resource disparities. In anticipation of resegregation patterns after being released
from their court-ordered desegregation program in 1999, Metropolitan Nashville Public Schools
(MNPS) created high resource schools as a compensatory resource allocation strategy (Houck
2010). Where it was truly compensatory resource allocation, there were positive effects on
achievement. In particular, schools that were granted reduced class sizes, an extension in the
length of the school year, and a mix of additional supports such as before school programming,
after-school tutoring, and social and health services saw more achievement gains (Gamoran and
An 2016). This suggests a causal pathway between segregation, school resources, and student
outcomes, and underscores how intervention in that pathway may mitigate segregation’s negative
consequences on educational outcomes.
8
Altogether, recent literature provides evidence that resources are important for student
outcomes, both for short-run educational attainment and outcomes and for long-term adult well-
being. Past desegregation produced positive outcomes largely through increased resource
exposure. Are contemporary patterns of segregation accompanied by racial disparities in school
funding? Or has the contemporary funding structure eliminated the relationship between racial
segregation and school funding?
OVERVIEW OF SCHOOL DISTRICT FUNDING FORMULAS AND POLICIES
We argue that the mechanisms through which segregation is associated with disparities in
school district revenue are directly related to school district funding formulas and policies.
Therefore, any discussion of mechanisms first requires a brief overview of school funding
processes. In the United States, school districts operate with funding from federal, state, and
local sources. While most districts receive the majority of their funding from state and local
sources, the actual share from respective municipalities, states, and the federal government,
varies between and within states. For example, in fiscal year 2015, school districts in Illinois
received eight percent of their revenue from federal sources, 25% from state sources, and 67%
from local sources. ii Whereas school districts in Vermont received six percent of their revenue
from federal sources, 90% from state sources, and only four percent from local sources
(McFarland et al. 2018).
Local funding for school districts is largely generated through local tax revenue, most
often from property taxes. The reliance on property taxes as the primary source of local
education funding has long been a source of contention. Because tax rates and property values
vary between districts, there are large disparities in local revenue for school districts in the U.S.
9
(McGuire, Papke, and Reschovsky 2015; Verstegen and Knoeppel 2012). School districts rely on
their respective states to compensate for these shortfalls.
States supply direct aid to elementary and secondary schools to fulfill their constitutional
mandate of providing at least a basic education. State aid is largely generated from income and
sales tax. States provide revenue to districts to cover costs such as general formula assistance,
special education, bilingual education, gifted and talented programs, employee benefits, capital
outlay, vocational education programs, and staff improvement programs. Each state uses a
formula to distribute state funds to districts. These formulas generally try to account for
anticipated differences in the funding capacity between districts. The most common type of
funding formula used across states is the foundation program. Foundation formulas set a base
funding level that is deemed necessary for a basic or adequate education, determines the required
amount of local effort that has to be put towards raising the funds, and uses state funds to cover
the shortfall (Verstegen 2011, 2016; Verstegen and Jordan 2009). Foundation programs account
for student and district factors such as poverty, disability, English language status, and district
size (Verstegen and Knoeppel 2012). Each formula factor is given a funding weight or multiplier
(and therefore more dollars).
States also play a role in shaping funding conditions for districts in ways that are
indirectly related to the provisioning of financial support. For example, states implement policies
that affect local taxes, education spending, and decisions regarding school district funding. In
many states across the country, there are limits on government tax revenues and expenditures.
These tax and expenditure limits often impact school district budgets and are the most
constraining in districts serving economically disadvantaged populations (Mullins 2004). States
also make decisions regarding the fiscal independence and dependence of its school districts. In
10
the majority of states, school districts have the authority to levy their taxes to support school
operations, making them fiscally independent. In other states, school districts are fiscally
dependent and must present a budget to a municipal, county, or state government which approves
or modifies the budget and levies the necessary taxes. The entity that approves tax levies and
school district budgets varies across districts and states. In some places, elected officials must
grant approval, in other places, local citizens vote on the approval (Center for Public Education
2008; McGuire et al. 2015; Verstegen 2015).
Federal funding for school districts comes from the Department of Education as well as
other federal agencies such as the Department of Agriculture. The federal government’s role in
public education finance is primarily compensatory. The largest shares of federal funding for
school districts comes from Title I of the Elementary and Secondary Education Act (ESEA) and
the Individuals with Disabilities Education Act (IDEA) (Camera 2016; U.S. Department of
Education 2014). The goal of Title I is to increase the resources for school districts with high
concentrations of economically disadvantaged students by funding programs that are intended to
improve learning for students at risk of educational failure. The federal government provides
funding in accordance with IDEA to help ensure that all students with disabilities receive a free
and appropriate education. Other major federal programs include, but are not limited to,
Improving Teacher Quality, 21st Century Community Learning Centers, Title III Language
Instruction for Limited English Proficient and Immigrant Students, and Impact Aid (U.S.
Department of Education 2014). The federal government allocates revenue to states (and
sometimes districts) based on specific eligibility criteria and/or formulas (Cornman 2015). This
generally includes counts of eligible students in states or within districts (National Center for
Education Statistics 2016; Sonnenberg 2016). These counts are sometimes multiplied by base
11
factors (Sonnenberg 2016). States then sub allocate these federal funds to districts based on
specific formulas and/or eligibility criteria.
Of the three sources of school district revenue, local funding is the most variable across
school districts as it is largely reliant on local wealth. States directly and indirectly shape the
funding conditions of their inhabiting school districts through the provisioning of compensatory
and general aid, funding policies, and state governance. The federal government determines
processes and policies through which states can receive compensatory federal funding to
suballocate to school districts. Taking into consideration these structures of school finance,
segregation will be differentially associated with federal, state, and local revenue.
WHY AND HOW MIGHT SEGREGATION BE RELATED TO DISPARITIES IN SCHOOL
REVENUE?
Racial segregation may be related to racial disparities in district revenue indirectly
through its relationship to poverty or directly through the role of race in local political
contestation. The exact relationship should differ for federal, state, and local revenue as a result
of the variation in the structure of these three sources of school district funding. It is for these
reasons, that we focus our attention on not just total revenue, but also federal, state, and local
revenue. While there are differences in funding structures across states, federal and state revenue
is generally allocated in accordance with specific funding formulas that often give extra weight
(and thus more money) to student and district factors such as poverty, disability, and English
Language Learner (ELL) enrollments. Because nothing in federal and state funding formulas
explicitly allocates funding based on race, there should be no independent association between
racial segregation and racial disparities in federal and state revenue, after accounting for poverty
12
and other formula factors. Given the compensatory role of federal and state funding, particularly
as it relates to funding weights for poverty, we suspect that increases in racial socioeconomic
segregation will be related to more federal and state revenue for Black and Latinx districts with
higher rates of socioeconomic disadvantage.
In contrast to federal and state funding, funding to school districts from local sources
generally does not provide compensatory aid and instead is highly dependent on local economic
conditions and sociodemographic characteristics (e.g., property tax rates, property values, and
poverty rates). The level of local poverty and resources in Black, Latinx, and White
neighborhoods should therefore drive local funding disparities. Blacks and Latinos/as experience
concentrated neighborhood poverty (Quillian 2012). Poverty and property taxes are negatively
correlated (Baker and Corcoran 2012), resulting in a weaker tax base in poorer, less White
neighborhoods. Even though low property wealth districts may tax at a higher rate than high
property wealth counterparts, the increased effort may be insufficient to make up for lower
property values in high poverty districts and result in less local revenue (Baker and Corcoran
2012). Black and Latinx students concentrated in higher poverty districts and neighborhoods will
likely have less local revenue as a result. In contrast, White students concentrated in more
affluent districts have access to a stronger tax base, allowing them to raise more local dollars
with less effort. In addition, wealthier, whiter districts may also have experiences, institutional
knowledge, and networks that can be leveraged to secure higher levels of local funding in ways
that high minority and high poverty districts may not. For example, relatively affluent districts
tend to have more access to other sources of local revenue such as private donations through
school-supporting non-profits (Nelson and Gazley 2014). Thus, we would expect racial
13
socioeconomic segregation would be related to racial disparities in local revenue, but not racial
segregation.
In sum, if the relationship between race and poverty is driving the relationship between
race and funding disparities, we would expect significant relationships between racial
socioeconomic segregation and funding disparities, but no relationships between racial
segregation and funding disparities, after accounting for poverty. Specifically, increases in racial
socioeconomic segregation would be associated with larger racial disparities in local revenue.
However, the compensatory nature of federal and state revenue (e.g., weights for poverty) should
make up for local revenue shortfalls. Thus, increases in racial socioeconomic segregation would
not be related to racial disparities in total revenue.
A second competing pathway connecting racial segregation to disparities in district
revenue may be a more direct link between race and the willingness to fund public education.
Evidence from ethnic fragmentation literature suggests that people are less willing to fund public
spending when there is a perception that the public goods will be shared with out-group members
(Alesina, Baqir, and Easterly 1999). Recent evidence also suggests that Whites are less likely to
support increased taxation and progressive taxation when new residents are not White (O’Brien
2017). Under this pathway, we would expect that racial segregation is related to racial disparities
in revenue even after accounting for poverty and other formula factors. This relationship should
be strongest at the local level, where stakeholders can more easily intervene to change funding
systems (e.g., through school board elections or votes on tax levies). Therefore, the more local
the funding source, the more we would expect it to decrease for Black and Latinx districts as
racial segregation increases. Since federal and state funding formulas target disadvantage and not
race per se, they are not designed to compensate for disparities at the local level driven by racial
14
segregation. Thus, if a direct relationship between race and the willingness to fund public
education drives funding disparities, we would expect that increases in racial segregation will not
only be related to racial disparities in local revenue, but will also be related to less total revenue
for Black and Latinx districts relative to White districts.
METHODOLOGY
Data
For this study, we utilize national, public-use data collected at the district level. The
School Funding Fairness Data System’s (SFFDS) Local Education Agency (LEA) Fiscal
Database (version 1.0) provides longitudinal data on school district finance and demographics.
This dataset includes district-level measures from several longstanding federal collections,
including the Annual Survey of School System Finances, or F33, collected by the U.S. Census
Bureau; the National Center of Education Statistics (NCES) Common Core of Data (CCD) Local
Education Agency (School District) Universe Survey Data; Extended Comparable Wage Index
(CWI) from The Busch School of Government and Public Service; and Small Area Income and
Poverty Estimates (SAIPE) from the U.S. Census Bureau.
We use the SFFDS LEA Fiscal Database to observe several different categories of school
district revenue, demographic characteristics of school districts, estimates of child poverty, and
geographic cost adjustments. To adjust for geographic differences in the cost of education within
states, we link the SFFDS LEA Fiscal Database to state-level cost adjustments from the CWI. To
further account for differences in revenue due to geographic concentration beyond the scope of
the CWI, we construct a measure of urbanicity using data from the CCD Local Education
Universe Survey. For example, average per-pupil revenue may be different in rural school
15
districts than in urban school districts because of economies of scale. Finally, to address
missingness on student demographics in early years of data collection, we linked the SFFDS
LEA Fiscal Database to school-level imputations of student demographic data aggregated to the
district (including enrollment, racial composition, and Free Lunch (FL) composition) from the
CCD.
We restrict our analyses to traditional school districts in states with more than one
district. As such, the District of Columbia and Hawaii are excluded since it is not possible to
construct between-district measures in states with a single district. We further exclude districts
that are non-operational in a given fiscal year, provide only vocational education or special
education, serve a juvenile justice population, are charter districts, or do not actually enroll
students (i.e., federal, regional, or other education service agencies). iii Lastly, district-year
observations with outlier values for total per pupil revenue or expenditures, missing revenue or
expenditures data, or no 5 to 17-year-olds according to SAIPE estimates are also excluded. See
Appendix Table A1 for the number of district-years excluded for each of the aforementioned
conditions.
The resulting dataset spans 15 years, including fiscal years 1999 through 2013. The
sample includes an average of about 13,417 school districts per year for a total of 201,257
district-year observations. Since we are measuring average revenue disparities between districts
within a state, our measures are properties of a given state and year combination. In other words,
we have one measure of the between-district disparities for each state and year in our data, for a
total of 735 observations (49 states, 15 years). Because there are state-year combinations missing
key control variables, we further restrict our analysis to state-years with non-missing data. This
16
results in an analytical sample of 641 state-year observations. See Appendix Table A2 for more
information about missingness.
Measures
Our dependent variables are Black-White and Latinx-White total, federal, state, and local
revenue disparities between districts within a state. These racial disparities in revenue are
measured in two ways, dollar differences and revenue ratios. For both measures, we first account
for geographic differences in labor market costs between districts within a state. Total, federal,
state, and local per pupil revenue are cost adjusted by multiplying the base amount by the
following,
, ( 1 )
where 𝐶𝑊𝐼 is the comparable wage index for the state in a given year and 𝐶𝑊𝐼 is the index
for the district (Taylor et al. 2007). Using the cost adjusted per pupil revenue variables, we then
create variables for average per pupil revenues in the average Black, Latinx, and White students’
districts. To create the average per pupil revenue in the average Black student’s district, we
compute the weighted average per pupil revenue among districts within a state and year,
weighting by the number of Black students in each district. We follow similar steps to compute
the average per pupil revenue in the average Latinx student’s district and in the average White
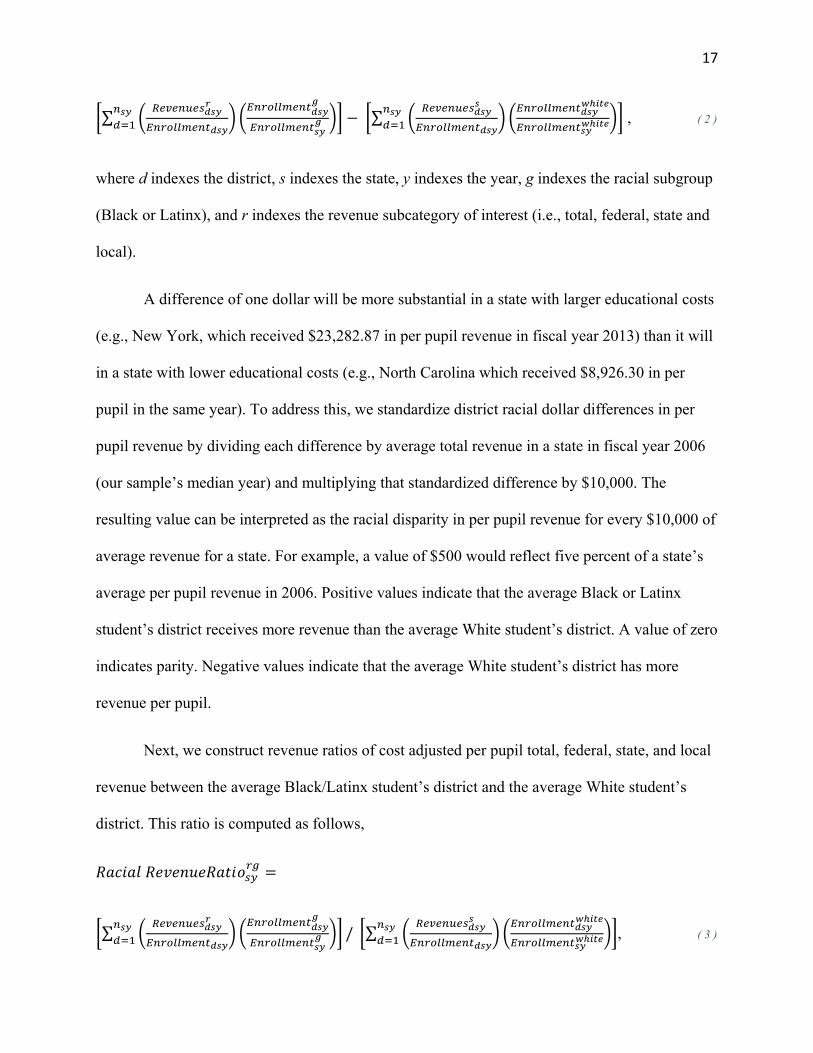
student’s district. We then compute the dollar difference in cost-adjusted per pupil total, federal,
state, and local revenue between the average Black/Latinx student’s district and the average
White student’s district. This difference is computed as follows, 𝑅𝑎𝑐𝑖𝑎𝑙 𝐷𝑜𝑙𝑙𝑎𝑟 𝐷𝑖𝑓𝑓𝑒𝑟𝑒𝑛𝑐𝑒 𝑖𝑛 𝑅𝑒𝑣𝑒𝑛𝑢𝑒 =
17
∑ − ∑ , ( 2 )
where d indexes the district, s indexes the state, y indexes the year, g indexes the racial subgroup
(Black or Latinx), and r indexes the revenue subcategory of interest (i.e., total, federal, state and
local).
A difference of one dollar will be more substantial in a state with larger educational costs
(e.g., New York, which received $23,282.87 in per pupil revenue in fiscal year 2013) than it will
in a state with lower educational costs (e.g., North Carolina which received $8,926.30 in per
pupil in the same year). To address this, we standardize district racial dollar differences in per
pupil revenue by dividing each difference by average total revenue in a state in fiscal year 2006
(our sample’s median year) and multiplying that standardized difference by $10,000. The
resulting value can be interpreted as the racial disparity in per pupil revenue for every $10,000 of
average revenue for a state. For example, a value of $500 would reflect five percent of a state’s
average per pupil revenue in 2006. Positive values indicate that the average Black or Latinx
student’s district receives more revenue than the average White student’s district. A value of zero
indicates parity. Negative values indicate that the average White student’s district has more
revenue per pupil.
Next, we construct revenue ratios of cost adjusted per pupil total, federal, state, and local
revenue between the average Black/Latinx student’s district and the average White student’s
district. This ratio is computed as follows,
𝑅𝑎𝑐𝑖𝑎𝑙 𝑅𝑒𝑣𝑒𝑛𝑢𝑒𝑅𝑎𝑡𝑖𝑜 =
∑ / ∑ , ( 3 )
18
Values over one indicate that the average Black or Latinx student’s district receives more
revenue than the average White student’s district. A value of one indicates parity. Values less
than one indicate that the average White student’s district has more revenue. Ratios are useful
measures because they account for baseline differences in revenue between racial groups.
Furthermore, using revenue ratios gets rid of secular trends by putting each value relative to its
own state in the same year.
Ratios also capture a different aspect of inequality than dollar differences. While dollar
differences most directly capture inequality in the resources at a district’s disposal, revenue ratios
capture inequality in terms of how race groups fare relative to each other. Dollar differences can
be large and growing even if ratios are close to one and unchanging if initial (i.e., beginning of
sample period) per pupil revenues are large and unequal. Furthermore, ratios can grow without
any corresponding change in dollar differences if initial per pupil revenues are unequal and
growing at unequal rates. Thus, ratios best capture the extent to which race groups are gaining or
losing ground relative to each other while dollar differences best capture the changing resource
contexts.
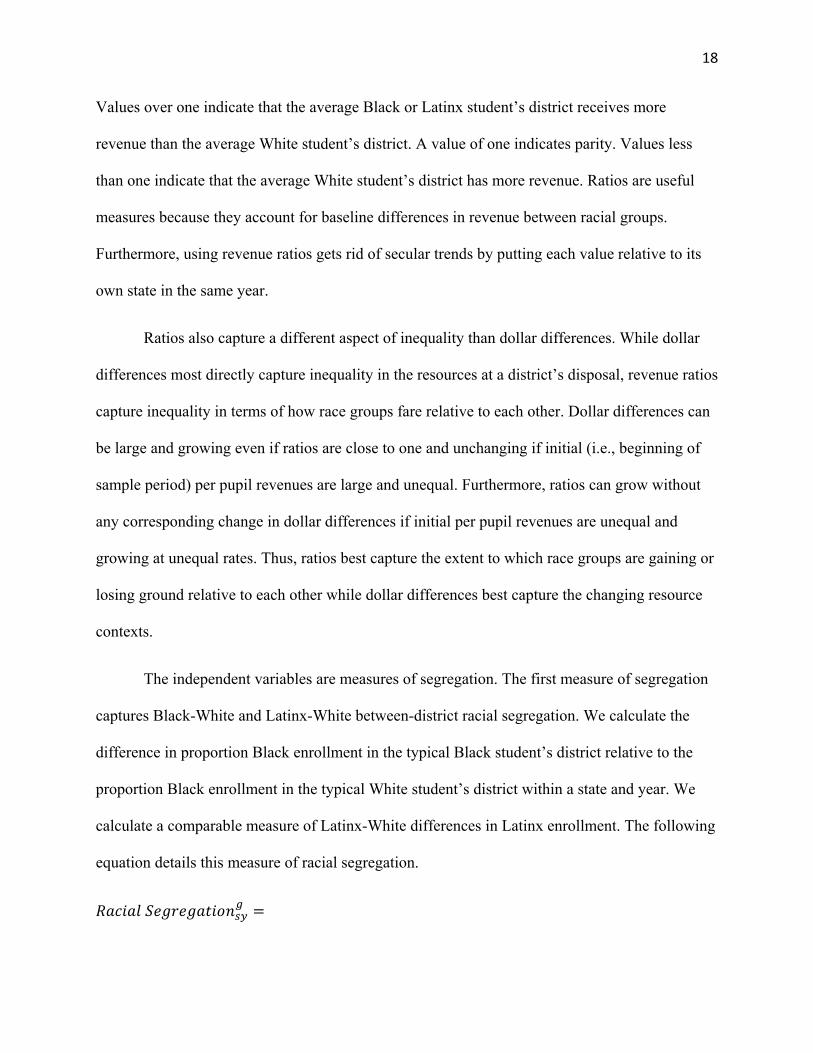
The independent variables are measures of segregation. The first measure of segregation
captures Black-White and Latinx-White between-district racial segregation. We calculate the
difference in proportion Black enrollment in the typical Black student’s district relative to the
proportion Black enrollment in the typical White student’s district within a state and year. We
calculate a comparable measure of Latinx-White differences in Latinx enrollment. The following
equation details this measure of racial segregation.
𝑅𝑎𝑐𝑖𝑎𝑙 𝑆𝑒𝑔𝑟𝑒𝑔𝑎𝑡𝑖𝑜𝑛 =
19
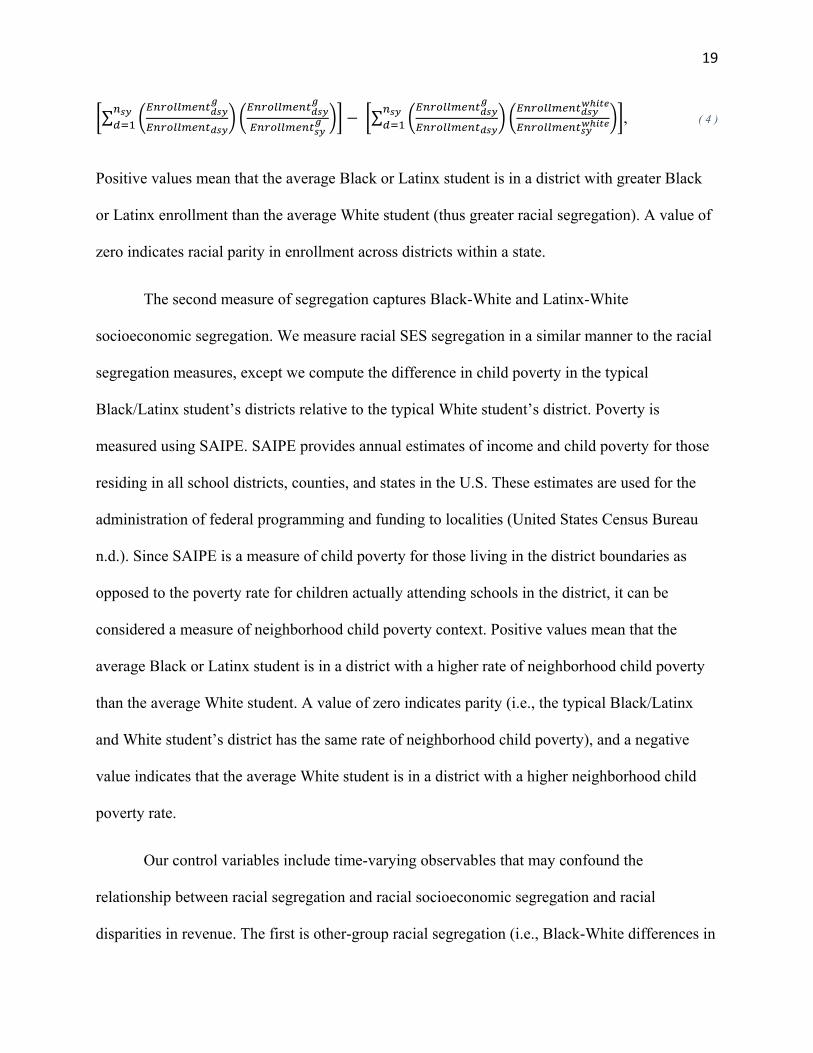
∑ − ∑ , ( 4 )
Positive values mean that the average Black or Latinx student is in a district with greater Black
or Latinx enrollment than the average White student (thus greater racial segregation). A value of
zero indicates racial parity in enrollment across districts within a state.
The second measure of segregation captures Black-White and Latinx-White
socioeconomic segregation. We measure racial SES segregation in a similar manner to the racial
segregation measures, except we compute the difference in child poverty in the typical
Black/Latinx student’s districts relative to the typical White student’s district. Poverty is
measured using SAIPE. SAIPE provides annual estimates of income and child poverty for those
residing in all school districts, counties, and states in the U.S. These estimates are used for the
administration of federal programming and funding to localities (United States Census Bureau
n.d.). Since SAIPE is a measure of child poverty for those living in the district boundaries as
opposed to the poverty rate for children actually attending schools in the district, it can be
considered a measure of neighborhood child poverty context. Positive values mean that the
average Black or Latinx student is in a district with a higher rate of neighborhood child poverty
than the average White student. A value of zero indicates parity (i.e., the typical Black/Latinx
and White student’s district has the same rate of neighborhood child poverty), and a negative
value indicates that the average White student is in a district with a higher neighborhood child
poverty rate.
Our control variables include time-varying observables that may confound the
relationship between racial segregation and racial socioeconomic segregation and racial
disparities in revenue. The first is other-group racial segregation (i.e., Black-White differences in
20
Latinx enrollment and Latinx-White differences in Black enrollment). We include other-group
racial segregation as a control because Black-White or Latinx-White racial segregation may be
changing because of increased or decreased enrollment of other minorities. For example, we
want to measure changes in Black-White racial segregation due to changes in Black and White
student enrollment, but not the presence of Latinx students. Second, to address differences in
operating costs based on district size, we account for racial disparities in the number of schools
per every 1,000 students in a district. Districts with more schools per students likely have higher
average operation and maintenance costs. Next, we control for racial disparities in English
language learner (ELL) enrollment because of federal and state funding formula weights for
English language learners. We also control for racial disparities in special education enrollment
to account for higher expenses associated with providing services for students with disabilities.
To account for differences in revenue due to geographic concentrations, but not addressed with
our cost adjustment, we control for racial disparities in urbanicity (see Appendix Table A3 for
details on the construction of our measure of urbanicity). Lastly, we control for average racial
composition and neighborhood child poverty within states. By including these state level
variables as controls, we account for the potential impact of overall changes in student
demographics.
Analysis
In this descriptive analysis, we examine the contemporaneous association between
segregation and racial disparities in school district revenue (i.e., dollar differences and ratios).
We regress racial disparities in total, federal, state, and local revenue on racial segregation, racial
SES segregation, and our control variables. A general specification is as follows:
𝑅𝑎𝑐𝑖𝑎𝑙 𝑅𝑒𝑣𝑒𝑛𝑢𝑒 𝐷𝑖𝑠𝑝𝑎𝑟𝑖𝑡𝑦 =
21
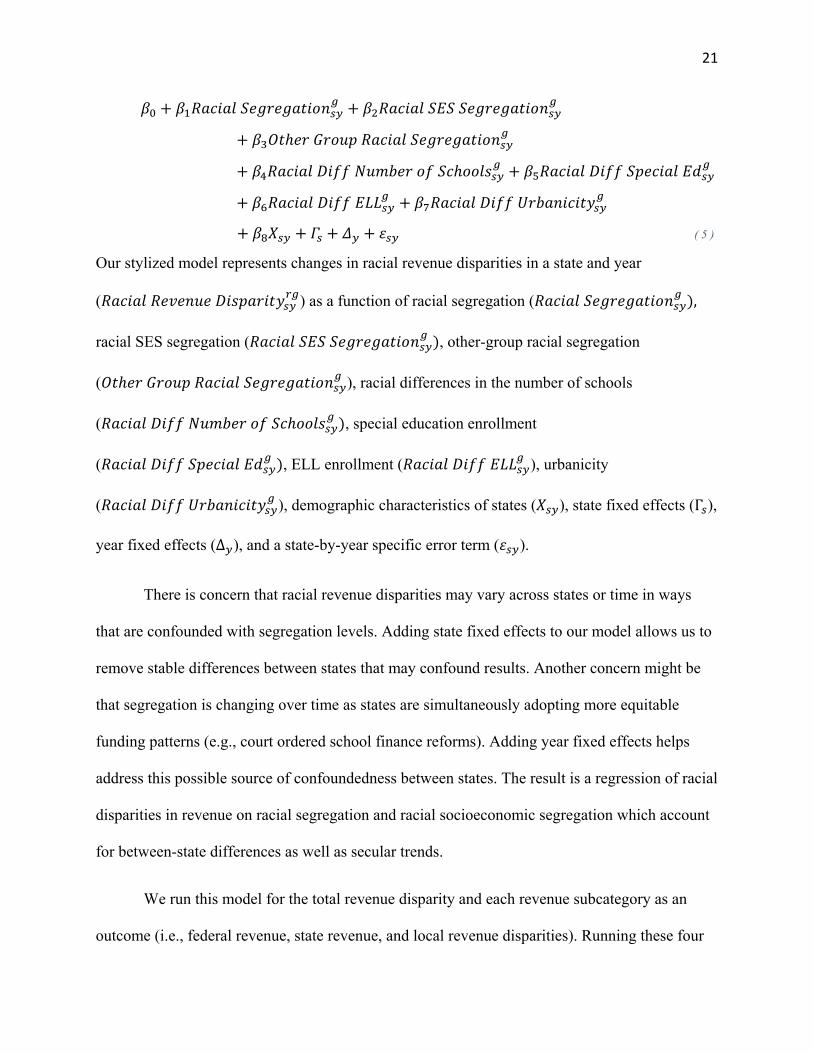
𝛽 + 𝛽 𝑅𝑎𝑐𝑖𝑎𝑙 𝑆𝑒𝑔𝑟𝑒𝑔𝑎𝑡𝑖𝑜𝑛 + 𝛽 𝑅𝑎𝑐𝑖𝑎𝑙 𝑆𝐸𝑆 𝑆𝑒𝑔𝑟𝑒𝑔𝑎𝑡𝑖𝑜𝑛+ 𝛽 𝑂𝑡ℎ𝑒𝑟 𝐺𝑟𝑜𝑢𝑝 𝑅𝑎𝑐𝑖𝑎𝑙 𝑆𝑒𝑔𝑟𝑒𝑔𝑎𝑡𝑖𝑜𝑛+ 𝛽 𝑅𝑎𝑐𝑖𝑎𝑙 𝐷𝑖𝑓𝑓 𝑁𝑢𝑚𝑏𝑒𝑟 𝑜𝑓 𝑆𝑐ℎ𝑜𝑜𝑙𝑠 + 𝛽 𝑅𝑎𝑐𝑖𝑎𝑙 𝐷𝑖𝑓𝑓 𝑆𝑝𝑒𝑐𝑖𝑎𝑙 𝐸𝑑+ 𝛽 𝑅𝑎𝑐𝑖𝑎𝑙 𝐷𝑖𝑓𝑓 𝐸𝐿𝐿 + 𝛽 𝑅𝑎𝑐𝑖𝑎𝑙 𝐷𝑖𝑓𝑓 𝑈𝑟𝑏𝑎𝑛𝑖𝑐𝑖𝑡𝑦 + 𝛽 𝑋 + 𝛤 + 𝛥 + 𝜀 ( 5 )
Our stylized model represents changes in racial revenue disparities in a state and year
(𝑅𝑎𝑐𝑖𝑎𝑙 𝑅𝑒𝑣𝑒𝑛𝑢𝑒 𝐷𝑖𝑠𝑝𝑎𝑟𝑖𝑡𝑦 ) as a function of racial segregation (𝑅𝑎𝑐𝑖𝑎𝑙 𝑆𝑒𝑔𝑟𝑒𝑔𝑎𝑡𝑖𝑜𝑛 ), racial SES segregation (𝑅𝑎𝑐𝑖𝑎𝑙 𝑆𝐸𝑆 𝑆𝑒𝑔𝑟𝑒𝑔𝑎𝑡𝑖𝑜𝑛 ), other-group racial segregation
(𝑂𝑡ℎ𝑒𝑟 𝐺𝑟𝑜𝑢𝑝 𝑅𝑎𝑐𝑖𝑎𝑙 𝑆𝑒𝑔𝑟𝑒𝑔𝑎𝑡𝑖𝑜𝑛 ), racial differences in the number of schools
(𝑅𝑎𝑐𝑖𝑎𝑙 𝐷𝑖𝑓𝑓 𝑁𝑢𝑚𝑏𝑒𝑟 𝑜𝑓 𝑆𝑐ℎ𝑜𝑜𝑙𝑠 ), special education enrollment
(𝑅𝑎𝑐𝑖𝑎𝑙 𝐷𝑖𝑓𝑓 𝑆𝑝𝑒𝑐𝑖𝑎𝑙 𝐸𝑑 ), ELL enrollment (𝑅𝑎𝑐𝑖𝑎𝑙 𝐷𝑖𝑓𝑓 𝐸𝐿𝐿 ), urbanicity
(𝑅𝑎𝑐𝑖𝑎𝑙 𝐷𝑖𝑓𝑓 𝑈𝑟𝑏𝑎𝑛𝑖𝑐𝑖𝑡𝑦 ), demographic characteristics of states (𝑋 ), state fixed effects (Γ ),
year fixed effects (Δ ), and a state-by-year specific error term (𝜀 ).
There is concern that racial revenue disparities may vary across states or time in ways
that are confounded with segregation levels. Adding state fixed effects to our model allows us to
remove stable differences between states that may confound results. Another concern might be
that segregation is changing over time as states are simultaneously adopting more equitable
funding patterns (e.g., court ordered school finance reforms). Adding year fixed effects helps
address this possible source of confoundedness between states. The result is a regression of racial
disparities in revenue on racial segregation and racial socioeconomic segregation which account
for between-state differences as well as secular trends.
We run this model for the total revenue disparity and each revenue subcategory as an
outcome (i.e., federal revenue, state revenue, and local revenue disparities). Running these four
22
versions of the model allows us to decompose the regressions to determine the relative
contribution of each subcategory of revenue as well as allow for the coefficients to have different
signs for each revenue subcategory.iv The coefficients on the racial segregation variables can be
interpreted as the change in the Black-White or Latinx-White revenue disparities associated with
increases in racial segregation. The coefficients on the racial socioeconomic segregation
variables can be interpreted as the change in the Black-White or Latinx-White revenue
disparities associated with increases in racial socioeconomic segregation.
RESULTS
Levels and Trends in Segregation and Revenue Disparities
Figure 1 depicts the change in Black-White and Latinx-White racial segregation levels
between the first and last year of our panel. The horizontal axis shows racial segregation levels
for each state in the first year it appears in the analytical sample (for most states, this is fiscal
year 1999). The vertical axis shows the change in racial segregation by the end of our panel in
2013. Each point on the Black-White segregation graph is weighted by the size of the Black
student population in 2013, while each point on the Latinx-White segregation graph is weighted
by the size of the Latinx student population in the same year (smaller points correspond to
smaller Black or Latinx populations). Several patterns emerge from these figures. First, in most
states, Black-White racial segregation was decreased over our sample years. Second, only a
small number of states with small Black student populations had increases in Black-White
segregation. Third, Latinx-White segregation, in contrast, tends to be smaller in magnitude than
Black-White segregation, and increasing slightly in more states during this time. However, the
states with the largest Latinx populations (which also tended to have the highest levels of racial
23
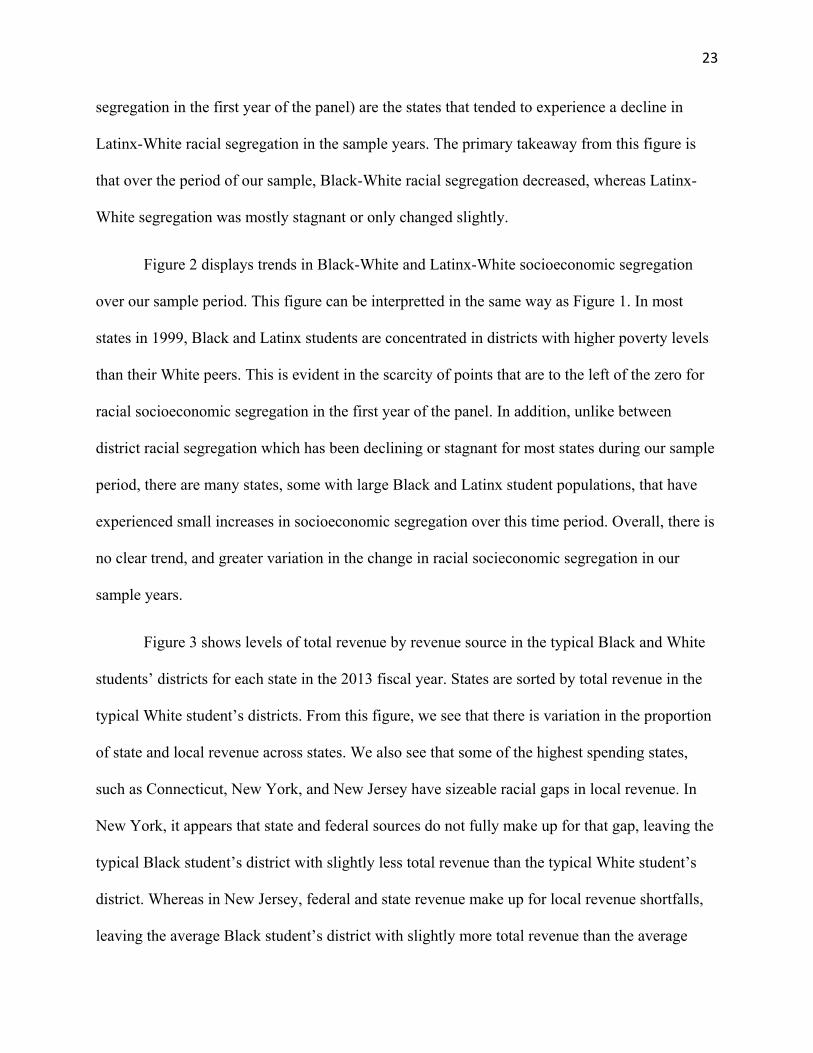
segregation in the first year of the panel) are the states that tended to experience a decline in
Latinx-White racial segregation in the sample years. The primary takeaway from this figure is
that over the period of our sample, Black-White racial segregation decreased, whereas Latinx-
White segregation was mostly stagnant or only changed slightly.
Figure 2 displays trends in Black-White and Latinx-White socioeconomic segregation
over our sample period. This figure can be interpretted in the same way as Figure 1. In most
states in 1999, Black and Latinx students are concentrated in districts with higher poverty levels
than their White peers. This is evident in the scarcity of points that are to the left of the zero for
racial socioeconomic segregation in the first year of the panel. In addition, unlike between
district racial segregation which has been declining or stagnant for most states during our sample
period, there are many states, some with large Black and Latinx student populations, that have
experienced small increases in socioeconomic segregation over this time period. Overall, there is
no clear trend, and greater variation in the change in racial socieconomic segregation in our
sample years.
Figure 3 shows levels of total revenue by revenue source in the typical Black and White
students’ districts for each state in the 2013 fiscal year. States are sorted by total revenue in the
typical White student’s districts. From this figure, we see that there is variation in the proportion
of state and local revenue across states. We also see that some of the highest spending states,
such as Connecticut, New York, and New Jersey have sizeable racial gaps in local revenue. In
New York, it appears that state and federal sources do not fully make up for that gap, leaving the
typical Black student’s district with slightly less total revenue than the typical White student’s
district. Whereas in New Jersey, federal and state revenue make up for local revenue shortfalls,
leaving the average Black student’s district with slightly more total revenue than the average
24
White student’s district. Similar patterns are evident for revenue in the typical Latinx and White
students’ districts (Figure 4).
Across all states and years in the sample, the average Black and Latinx student’s district
has less local revenue and more state and federal revenue than the average White student’s
district. These patterns are to be expected if Black and Latinx students tend to be enrolled in
districts with higher rates of poverty, lower local capacity for school funding, and greater need
for compensatory funding from state and federal funding sources. Furthermore, Black and Latinx
students tend to be in districts with greater proportions of free lunch eligible students and higher
rates of neighborhood child poverty, and more Black and Latinx students, relative to White
students. Table 1 details these unadjusted trends.
To examine typical trends across years within a state, we regress our outcomes and key
predictor variables on fiscal year in separate regressions for each state. The slope of the fiscal
year variable gives an indication for how each variable has changed across the years in our
sample for each state. We then computed the mean of this slope across all states in our sample.
Table 2 presents the mean and other descriptive statistics for the trends in outcome variables and
key predictors. For example, the mean of the trend in Black-White total revenue dollar
differences is $16.16, meaning that, on average, across states, the Black-White difference in total
revenue has been growing by $16.16 each year. In contrast, the Black-White difference in local
revenue has been getting smaller, on average, shrinking $11.62 each year.
Segregation and Revenue Disparities
Figure 5 shows the bivariate correlation between racial segregation and socioecnomic
segregation net of state and year fixed effects. Once accounting for stable differences between
25
states and years, Black-White racial segregation is positively, but weakly correlated with Black-
White socioeconomic segregation. A similar relationship exists between Latinx-White racial
segregation and Latinx-White socioeconomic segregation. These findings provide assurance that
our coefficients will not be unstable due to collinearity between racial and socioeconomic
segregation.
Black-White revenue disparities
Table 3 presents results from our main models regressing racial revenue disparities on
racial segregation, racial socioeconomic segregation, and other controls. In Panel 1, the outcome
is Black-White dollar differences. In Panel 2, the outcome is Black-White revenue ratios. In both
sets of models, we regress our measures of Black-White revenue disparities (dollar differences or
revenue ratios) on Black-White racial segregation, Black-White socioeconomic segregation,
Black-White other group racial segregation, Black-White differences (i.e., number of schools,
special education enrollment, ELL enrollment, and urbanicity), state-level student demographics,
state invariant differences, and time-invariant differences. Recall that negative coefficients
indicate that revenue is shifting away from the average Black student’s district (and thus shifting
towards the average White student’s district) while positive coefficients mean that revenue is
shifting towards the average White student’s district (and therefore away from the average Black
student’s district). If the average Black student’s district starts out with more per pupil revenue
than the average White student’s district and there is a relative shift away from the average Black
student’s district, this could be seen as a reduction in the Black-White funding disparity that
favors the average White student’s district. However, if the average Black student’s district starts
out with less or equal amounts of per pupil revenue as compared to the average White student’s
district, a relative shift away from the average Black student’s district could be seen as an
26
increase in the Black-White funding disparity that disfavors the average Black student’s district.
While our analyses cannot distinguish between these nuances, examining whether revenue shifts
in any direction in the context of increasing segregation still has important policy implications.
Black-White racial segregation is a significant predictor of Black-White total, federal,
and local dollar differences even after controlling for Black-White socioeconomic segregation.
As Black-White racial segregation increases, the Black-White total, federal, and local dollar
difference decreases in a way that shifts funding away from the average Black student’s district
relative to the average White student’s district. More specifically, a one-unit increase in Black-
White racial segregation is associated with a $6,473.03 decrease in total per pupil revenue, a
$1,250.27 decrease in federal per pupil revenue, and a $4,983.62 decrease in local per pupil
revenue (for every $10,000 of total revenue) in the typical Black student’s district relative to the
typical White student’s district.
Since a one-unit change in segregation, or going from no segregation to complete
segregation, is large in magnitude and unlikely in practice, our results can be contextualized by
thinking of segregation in smaller units of change. For example, we consider the difference
between states with the smallest changes in segregation over time and states with the largest
changes in segregation over time. Returning to Table 2, the 25th percentile of state trends in
Black-White racial segregation is roughly -0.005 while the 75th percentile is about 0. Thus,
moving from the 25th to 75th percentiles in Black-White racial segregation trends would therefore
represent an increase in Black-White racial segregation of roughly 0.005 every year, or 0.07 over
14 years, the number of year-to-year changes in our panel. Therefore, the typical Black student’s
district in a state that shifted from the 25th to 75th percentiles of the trend in Black-White racial
segregation would experience a $453.11 relative decrease (i.e., -$6,473.03 X 0.07) in total per
27
pupil revenue, a $87.52 relative decrease in federal per pupil revenue, and a $348.85 relative
decrease in per pupil local revenue for every $10,000 of average total per pupil revenue. The
magnitude of these changes represents about four, one, and three percent of a state’s average
total revenue in 2006, respectively.
Not only did Black-White dollar differences in total and local revenue grow with racial
segregation, but Blacks also appear to be losing relative ground for total and local revenue. As
with standardized dollar differences, increases in Black-White racial segregation are significantly
and negatively associated with Black-White total and local revenue ratios (Panel 2). In contrast,
unlike the standardized dollar difference models, Black-White racial segregation is positively
associated with the Black-White federal revenue ratio. The typical Black student’s district in a
state that shifted from the 25th to 75th percentiles of the trend in Black-White racial segregation
would experience a 0.13 relative increase (i.e., 1.788 X 0.07) in the Black-White per pupil
federal revenue ratio. The magnitude of this change is roughly nine percent of the average Black-
White federal revenue ratio (see Table 1). This suggests that while the average Black student’s
district receives fewer federal dollars relative to the average White student’s district in the
presence of increasing levels of Black-White racial segregation, federal revenue is directed in a
way in which the typical Black students’ district is gaining relative ground. This could happen if,
for example, Black and White districts started off unequal and experienced declines in funding,
but at differing rates.
In contrast to the findings for Black-White racial segregation, Black-White
socioeconomic segregation is only a significant predictor of the Black-White federal revenue
ratio. More specifically, an increase in Black-White SES segregation is negatively associated
with the Black-White federal revenue ratio. A 0.04 unit increase in Black-White SES segregation
28
(see Table 2 and previous calculations) is associated with a 0.9 decrease in the federal revenue
ratio. These findings are contrary to our predictions that Black-White local revenue disparities
would decrease (i.e., shift money away from the average Black student’s district) and Black-
White total, federal, and state revenue disparities would increase (i.e., shift money towards the
average Black student’s district) as Black-White socioeconomic segregation increased.
Latinx-White revenue disparities
Panels 3 and 4 of Table 3 present results from our models regressing Latinx-White
revenue disparities on Latinx-White racial segregation, Latinx-White socioeconomic segregation,
Latinx-White other group racial segregation, Latinx-White differences (i.e., number of schools,
special education enrollment, ELL enrollment, and urbanicity), state-level student demographics,
state invariant differences, and time-invariant differences. In Panel 3, the outcomes are Latinx-
White dollar differences in revenue. In Panel 4, the outcomes are Latinx-White revenue ratios.
Contrary to our findings for Black-White revenue disparities, there is no significant
relationship between Latinx-White racial segregation and Latinx-White dollar differences. The
findings presented in Panel 4 of Table 3 suggest that, despite a lack of significant relationships
for dollar differences, there is evidence that Latinx-White racial segregation is related to the type
of inequality captured by revenue ratios. An increase in Latinx-White racial segregation is
associated with a decrease in the Latinx-White local revenue ratio. Returning to Table 2, the 25th
percentile of state trends in Latinx-White racial segregation is roughly zero while the 75th
percentile is about 0.003. Thus, moving from the 25th to 75th percentiles in Latinx-White racial
segregation trends would therefore represent an increase in Latinx-White racial segregation of
roughly 0.003 every year, or 0.04 over 14 years. For a 0.04 unit increase in Latinx-White racial
segregation, this would mean a 0.01 decrease (i.e., 0.247 X 0.04) in the Latinx-White local
29
revenue ratio. The magnitude of this change is approximately one percent of the average Latinx-
White local revenue ratio (see Table 1), a small effect.
Similar to Black-White socioeconomic segregation, Latinx-White socioeconomic
segregation is not a strong predictor of Latinx-White revenue disparities. Latinx-White
socioeconomic segregation is only associated with the Latinx-White local revenue ratio. A 0.05
(see Table 2 and previous calculations) unit increase in Latinx-White SES segregation would be
associated with a 0.05 decrease in the local revenue ratio. The magnitude of this change is about
five percent of the average Latinx-White local revenue ratio (see Table 1).
There are several marginal associations that are worth noting. Latinx-White racial
segregation is marginally and positively related to the Latinx-White state dollar difference and
state revenue ratio. There is a marginal and negative association between Latinx-White
socioeconomic segregation and the Latinx-White total revenue ratio. While we cannot rule out
null effects at conventional levels, these findings are suggestive of a relationship between Latinx-
White segregation and Latinx-White revenue disparities.
Alternative Measure of Poverty
While our primary measure of poverty, SAIPE, is used for the allocation of federal, state,
and local revenue to school districts, alternative measures of poverty such as free and reduced-
price lunch (FRPL) eligibility are also used to target federal and state resources and other
interventions to “high need” schools (Domina et al. 2018). Therefore, we run models with racial
differences in free lunch (FL) eligibility enrollment as the measure of poverty for our racial
socioeconomic segregation variables to see if our findings vary with a different conceptualization
of socioeconomic disadvantage.
30
The results using FL eligibility as the measure of poverty depict a different pattern (see
Table 4). In models for which racial socioeconomic segregation is constructed using the
enrollment of FL eligible students, racial segregation matters less and racial socioeconomic
segregation matters more. Black-White racial segregation is only marginally associated with the
Black-White total revenue ratio and total, federal, and local dollar differences (unlike the models
using SAIPE as the measure of poverty). While most of the coefficients remain negative, they
are smaller in magnitude. Black-White racial segregation continues to be significantly and
positively associated with the Black-White federal revenue ratio and negatively associated with
the Black-White local revenue ratio. The magnitude of the associations also remains the same.
Black-White socioeconomic segregation using FL eligibility as the measure of poverty has more
of an association with Black-White revenue disparities than neighborhood child poverty. For
example, Black-White socioeconomic segregation is negatively associated with Black-White
total and local dollar differences and the Black-White total revenue ratio. The coefficients for
these associations are substantially larger in size.
Latinx-White socioeconomic segregation using FL eligibility is also a stronger predictor
of Latinx-White revenue disparities than socioeconomic segregation measured using
neighborhood child poverty. More specifically, Latinx-White socioeconomic segregation is
negatively associated with Latinx-White total and local dollar differences and total and state
revenue ratios. The magnitude of these coefficients varies across models with different
configurations of poverty. There is a marginal and positive association between Latinx-White
socioeconomic segregation and the Latinx-White federal dollar difference and a marginal and
negative association between Latinx-White socioeconomic segregation and the Latinx-White
local revenue ratio. Latinx-White racial segregation remains negatively associated with the
31
Latinx-White local revenue ratio and is marginally and positively associated with the Latinx-
White state dollar difference and the state revenue ratio.
DISCUSSION
Using longitudinal data for the population of school districts in the United States, we
estimate the contemporaneous association between several measures of racial and socioeconomic
segregation and multiple forms of racial disparities in school district revenue. We construct
standardized dollar differences and revenue ratios that capture the funding disparity in average
per pupil total, federal, state, and local revenue between the typical Black/Latinx student’s school
district and the typical White student’s school district.
We expected to find that Black-White and Latinx-White socioeconomic segregation
(measured using neighborhood child poverty) would be related to revenue disparities because of
federal and state funding allocations that are linked to school district poverty rates and because
of the relationship between poverty and local property tax revenue. Yet, there are no significant
relationships for Black-White or Latinx-White socioeconomic segregation and standardized
dollar differences in revenue of any kind. However, Black/Latinx to White revenue ratios, yields
significant findings. Black-White socioeconomic segregation is negatively associated with the
Black-White federal revenue ratio and Latinx-White socioeconomic segregation is negatively
associated with the Latinx-White local revenue ratio. The significant results for revenue ratios,
but not dollar differences suggest that total revenue/local revenue disparities between the typical
Black/Latinx student’s district and the typical White student’s district may have started from a
place of inequality, but over our sample period, these districts are likely experiencing similar
dollar increases in revenue as segregation changes, thus sustaining baseline inequality.
32
Furthermore, the negative association between Black-White socioeconomic segregation and the
Black-White federal revenue ratio suggests that federal revenue is not compensatory enough for
increasingly segregated Black school districts with greater rates of neighborhood child poverty.
We also predicted that Black-White and Latinx-White racial segregation might be related
to racial disparities in revenue after controlling for Black-White and Latinx-White
socioeconomic segregation because of a link between race and willingness to fund public
education. Furthermore, we expected this relationship to be strongest at the local level. This
prediction partially held. As Black-White racial segregation increases, total and local revenue
decreases in the average Black student’s district relative to the average White student’s district
(i.e., Black-White total and local dollar differences). These findings also persist in models with
Black-White revenue ratios as the outcome. The significant and negative association between
Black-White racial segregation and Black-White total and local revenue ratios/standardized
dollar differences suggests that in the context of increasing Black-White racial segregation,
funding inequality between Blacks and Whites is widening. In addition, Black-White racial
segregation is positively associated with the Black-White federal revenue ratio, but negatively
associated with the federal dollar difference. This suggests that Black and White districts started
off unequal and experienced disproportionate changes over time. Latinx-White racial segregation
is negatively associated with the Latinx-White local revenue ratio. Again, the significant results
for revenue ratios, but not dollar differences suggest that funding disparities between the typical
Black/Latinx student’s district and the typical White student’s district may have started from a
place of inequality, but Black/Latinx and White districts likely receive similar dollar increases in
revenue as segregation changes over the sample period, thus sustaining baseline disparities.
33
Taken together, there are several primary conclusions that can be drawn from our
findings. First, purportedly race neutral state and federal funding formulas and local funding
policies may not be completely race neutral after all and could be reproducing social inequality.
At the local level, Black-White racial segregation is related to funding even after accounting for
racial disparities in neighborhood child poverty contexts. This pattern might be a result of
funding structures such as caps on property tax rates, a reliance on property values, variation in
school district fiscal independence between and within states, and private donations to school
districts that could be correlated with race in ways above and beyond poverty. For example,
while poverty is negatively correlated with property wealth (Baker and Corcoran 2012), for
reasons of historical and continuing discrimination, race and property wealth likely remained
linked even after accounting for poverty. Historical discrimination in financing and home sales
limited Black access to property ownership and higher income neighborhoods (Rothstein 2017).
Racial segregation for both Black and Latinx residents is associated with depressed appreciation
of home values (Flippen 2004). More recent evidence suggests that racial stereotypes continue to
play a role in assessing the value of homes (Korver-Glenn 2018). Therefore, property wealth
and, as a result, local capacity for school funding, may be related to race above and beyond a
relationship with poverty. The relationship between Black-White segregation and local funding
is also consistent with a direct relationship between race and the local willingness to fund public
education. As segregation increases, Whites may be less willing to increase local funding or
support redistributive funding structures because the perceived beneficiaries are Black students.
White families might instead opt for private resources targeted toward their own children to
satisfy their taste for education. While we cannot adjudicate between these mechanisms, the
34
evidence presented here does suggest that the relationship between racial segregation and local
funding cannot be entirely explained by racial disparities in neighborhood child poverty contexts.
Second, federal and state funding formulas that are designed to be compensatory amidst
concentrated poverty, may not be compensatory enough. At the state level, this could result from
the design of funding programs. Features such as hold harmless or minimum aid provisions,
additional aid not adjusted for property tax capacity, discretionary grants, using average daily
attendance for student counts, flat grants, and property tax relief for higher income districts can
all result in regressive, or at least not progressive, funding systems (Baker and Corcoran 2012).
For example, aid outside states’ main equalization formulas that does not adjust for variation in
local capacity can end up directing funds towards districts that already have the capacity to raise
enough funds locally (Baker and Corcoran 2012). If the purpose of state aid is to assist districts
struggling to raise money locally and to provide additional funding for the educational services
in disadvantaged contexts, these results suggest that states, on average, are falling short.
Lastly, the results vary based on the measure of poverty used. There are several possible
interpretations of this different pattern of results. It may be the case that FL better captures
school and district disadvantage while SAIPE best captures neighborhood disadvantage. This
suggests that racial differences in neighborhood disadvantage are less related to funding
disparities than racial differences in school district disadvantage. This is somewhat surprising
since property wealth and the taxes derived from it are a characteristic of the neighborhood, not
the students attending schools within the district. On the other hand, funding formulas often
make use of student enrollments and school district demographic characteristics to determine
funding levels. Yet the negative relationships between Black-White and Latinx-White FL
eligibility disparities and local and total funding disparities support the same general relationship
35
implied by the SAIPE results: federal and state funding appears to not be compensatory enough
to make up for local revenue shortfalls.
An alternative interpretation of these differences in results is that FL is a poor measure of
family resources. Recent work by Domina and colleagues (2018) examined FRPL designations
and annual household income from the IRS as predictors of student test scores. The authors
found that FRPL inadequately and inconsistently captured student’s socioeconomic status, but
was more strongly correlated with student test scores than annual household income. The authors
further suggest that FRPL captures “important aspects of educational disadvantage. However, the
nature of the disadvantage that FRPL captures is amorphous and may not be a simple function of
family resources” (p. 12). The findings in our study call into question the aspects of
socioeconomic disadvantage that SAIPE and FL may be capturing and raise concerns about the
inconsistency and variation in the measure of poverty used in school funding decisions.
Overall, the findings of our study have important implications for education policy and
research. Racial differences in revenue that change with increasing segregation are concerning
given evidence of a causal relationship between school funding and academic achievement.
Along with evidence that segregation is related to student outcomes, this suggest that school
funding policies may be exacerbating racial inequality in education. Our descriptive findings
warrant further inspection into school funding formulas and education finance policies,
particularly at the local level, to be sure that poverty and not race is a factor in school finance
decisions. Furthermore, because we find that increases in Black-White racial segregation (net of
Black-White socioeconomic segregation) are negatively associated with the Black-White total
revenue dollar difference and ratio, this may have implications for racial inequality in school
spending. More specifically, if the average Black student’s district receives less total revenue
36
relative to the average White student’s district in the context of increasing segregation, total
expenditures in the average Black student’s district should also decrease relative to the average
White student’s district because districts can only expend what they have at their disposal. If the
average Black student’s district relative to the average White student’s district is receiving less
total revenue and thus spending less overall, how do districts prioritize what categories of
spending to cut and what spending categories to preserve? Therefore, future research should
examine the relationship between segregation and racial disparities in subcategories of per pupil
expenditures as this could be another source of educational inequality.
37
NOTES
i While Brown v. Board of Education of Topeka (1954) increased access to school resources that
ultimately improved educational outcomes for Black students, we would be remiss not to
acknowledge the negative consequences of Brown such as the displacement of Black teachers
that could arguably be related to educational inequality today.
ii Fiscal year is the spring of the school year.
iii Roughly 90% of district-year observations for charter districts are missing revenue and
expenditure data.
iv Note that in a limited number of cases, federal, state, and local revenue do not sum exactly to
the total revenue reported, though all values are within 0.1 % of the total revenue reported.
38
REFERENCES
Alesina, Alberto, Reza Baqir, and William Easterly. 1999. “Public Goods and Ethnic Divisions.”
The Quarterly Journal of Economics 114(4):1243–84.
Baker, Bruce D. and Sean P. Corcoran. 2012. The Stealth Inequities of School Funding: How
State and Local School Finance Systems Perpetuate Inequitable Student Spending.
Washington, D.C.
Baker, Bruce and Mark Weber. 2016. “Beyond the Echo-Chamber: State Investments and
Student Outcomes in U.S. Elementary and Secondary Education.” Journal of Education
Finance 42(1):1–27.
Brown v. Board of Education, 347 U.S. 483 (1954).
Camera, Lauren. 2016. “Federal Education Funding: Where Does the Money Go?” U.S. News,
January.
Candelaria, Christopher A. and K. Shores. 2017. “Court-Ordered Finance Reforms in the
Adequacy Era: Heterogeneous Causal Effects and Sensitivity.” Education Finance and
Policy.
Card, David and A. Abigail Payne. 2002. “School Finance Reform, the Distribution of School
Spending, and the Distribution of Student Test Scores.” Journal of Public Economics
83(1):49–82.
Center for Public Education. 2008. “Money Matters: At a Glance.” Retrieved October 1, 2017
(http://www.centerforpubliceducation.org/Main-Menu/Policies/Money-matters-At-a-
glance).
39
Condron, Dennis J., Daniel Tope, Christina R. Steidl, and Kendralin J. Freeman. 2013. “Racial
Segregation and the Black/White Achievement Gap, 1992 to 2009.” The Sociological
Quarterly 54:130–57.
Cornman, Stephen Q. 2015. Revenues and Expenditures for Public Elementary and Secondary
Education: School Year 2011–12 (Fiscal Year 2012). Washington, D.C.
Domina, Thurston, Nikolas Pharris-Ciurej, Andrew M. Penner, Emily K. Penner, Quentin
Brummet, Sonya R. Porter, and Tanya Sanabria. 2018. “Is Free and Reduced-Price Lunch a
Valid Measure of Educational Disadvantage?” Educational Researcher 0013189X1879760.
Flippen, Chenoa. 2004. “Unequal Returns to Housing Investments? A Study of Real Housing
Appreciation among Black, White, and Hispanic Households.” Social Forces 82(4):1523–
51.
Gamoran, Adam and Brian P. An. 2016. “Effects of School Segregation and School Resources in
a Changing Policy Context.” Educational Evaluation and Policy Analysis 38(1):43–64.
Hanushek, Eric A. 1986. “The Economics of Schooling: Production and Efficiency in Public
Schools.” Journal of Economic Literature 24(3):1141–77.
Hanushek, Eric A. 1997. “Assessing the Effects of School Resources on Student Performance:
An Update.” Educational Evaluation and Policy Analysis 19(2):141–64.
Hanushek, Eric A. 2003. “The Failure of Input-Based Schooling Policies.” The Economic
Journal 113(485):64–98.
Houck, Eric A. 2010. “Teacher Quality and School Resegregation: A Resource Allocation Case
Study.” Leadership and Policy in Schools 9(1):49–77.
40
Jackson, C. Kirabo, Rucker C. Johnson, and Claudia Persico. 2016. “The Effects of School
Spending on Educational and Economic Outcomes: Evidence from School Finance
Reforms.” Quarterly Journal of Economics 131(1):157–218.
Johnson, Rucker C. 2011. Long-Run Impacts of School Desegregation and School Quality on
Adult Attainment. 16664. Cambridge, MA.
Korver-Glenn, Elizabeth. 2018. “Brokering Ties and Inequality: How White Real Estate Agents
Recreate Advantage and Exclusion in Urban Housing Markets.” Social Currents 5(4):350–
68.
Lafortune, Julien, Jesse Rothstein, and Diane W. Schanzenbach. 2018. “School Finance Reform
and the Distribution of Student Achievement.” American Economic Journal: Applied
Economics 10(2):1–26.
McFarland, Joel, Bill Hussar, Xiaolei Wang, Jijun Zhang, Ke Wang, Amy Rathbun, Amy
Barmer, Emily F. Catalaldi, and Farrah B. Mann. 2018. The Condition of Education 2018.
Washington, D.C.
McGuire, Therese J., Leslie E. Papke, and Andrew Reschovsky. 2015. “Local Funding of
Schools: The Property Tax and Its Alternatives.” Pp. 376–91 in Handbook of Research in
Education Finance and Policy, edited by H. F. Ladd and M. E. Goertz. New York:
Routledge.
Mullins, Daniel R. 2004. “Tax and Expenditure Limitations and the Fiscal Response of Local
Government: Asymmetric Intra-Local Fiscal Effects.” Public Budgeting & Finance
24(4):111–47.
41
National Center for Education Statistics. 2016. The Allocation Process for the Individuals with
Disabilities Education Act Grants.
Nelson, Ashlyn Aiko and Beth Gazley. 2014. “The Rise of School-Supporting Nonprofits.”
Education Finance and Policy 9(4):541–66.
O’Brien, Rourke L. 2017. “Redistribution and the New Fiscal Sociology: Race and the
Progressivity of State and Local Taxes.” American Journal of Sociology 122(4):1015–49.
Office of Secondary and Elementary Education. 2017. “About Impact Aid.”
Quillian, Lincoln. 2012. “Segregation and Poverty Concentration: The Role of Three
Segregations.” American Sociological Review 77(3):354–79.
Reardon, Sean F. 2016. “School Segregation and Racial Academic Achievement Gaps.” The
Russell Sage Foundation Journal of the Social Sciences 2(5):34–57.
Reardon, Sean F. and Ann Owens. 2014. “60 Years After Brown : Trends and Consequences of
School Segregation.” Annual Review of Sociology 40:199–218.
Reber, Sarah J. 2010. “Educational Attainment for Blacks.” The Journal of Human Resources
45(4):893–914.
Rothstein, Richard. 2017. The Color of Law: A Forgotten History of How Our Government
Segregated America. New York: Liveright Publishing Corporation.
Sable, Jennifer. 2009. “Documentation to the NCES Common Core of Data Local Education
Agency Universe Survey: School Year 2006–07 (NCES 2009-301).”
Sonnenberg, William. 2016. Allocating Grants for Title I. Washington, D.C.
42
Taylor, Lori L., Mark C. Glander, William J. Fowler Jr., and Frank Johnson. 2007.
Documentation for the NCES Comparable Wage Index Data Files, 2005. Washington, DC.
U.S. Department of Education. 2001a. “Documentation to the NCES Common Core of Data
Local Education Agency Universe Survey: School Year 1998-1999 (Revised) July 2001.”
U.S. Department of Education. 2001b. “Documentation to the NCES Common Core of Data
Local Education Agency Universe Survey: School Year 1999-2000 (Revised September
2001).”
U.S. Department of Education. 2014. “10 Facts About K-12 Education Funding.” Retrieved June
1, 2018 (https://www2.ed.gov/about/overview/fed/10facts/index.html).
United States Census Bureau. n.d. “Small Area Income and Poverty Estimates (SAIPE)
Program.” Retrieved May 1, 2017 (https://www.census.gov/programs-
surveys/saipe/about.html).
Verstegen, Deborah A. 2011. “Public Education Finance Systems in the United States and
Funding Policies for Populations with Special Educational Needs.” Education Policy
Analysis Archives 19:30.
Verstegen, Deborah A. 2015. A Quick Glance at School Finance: Volume I: State-By-State
Descriptions.
Verstegen, Deborah A. 2016. “Policy Perspectives on State Elementary and Secondary Public
Education Finance Systems in the United States.” Educational Considerations 43(2):25–32.
Verstegen, Deborah A. and Teresa S. Jordan. 2009. “A Fifty-State Survey of School Finance
Policies and Programs: An Overview.” Journal of Education Finance 34(3):213–30.

43
Verstegen, Deborah A. and Robert C. Knoeppel. 2012. “From Statehouse to Schoolhouse:
Education Finance Apportionment Systems in the United States.” Journal of Education
Finance 38(2):145–66.
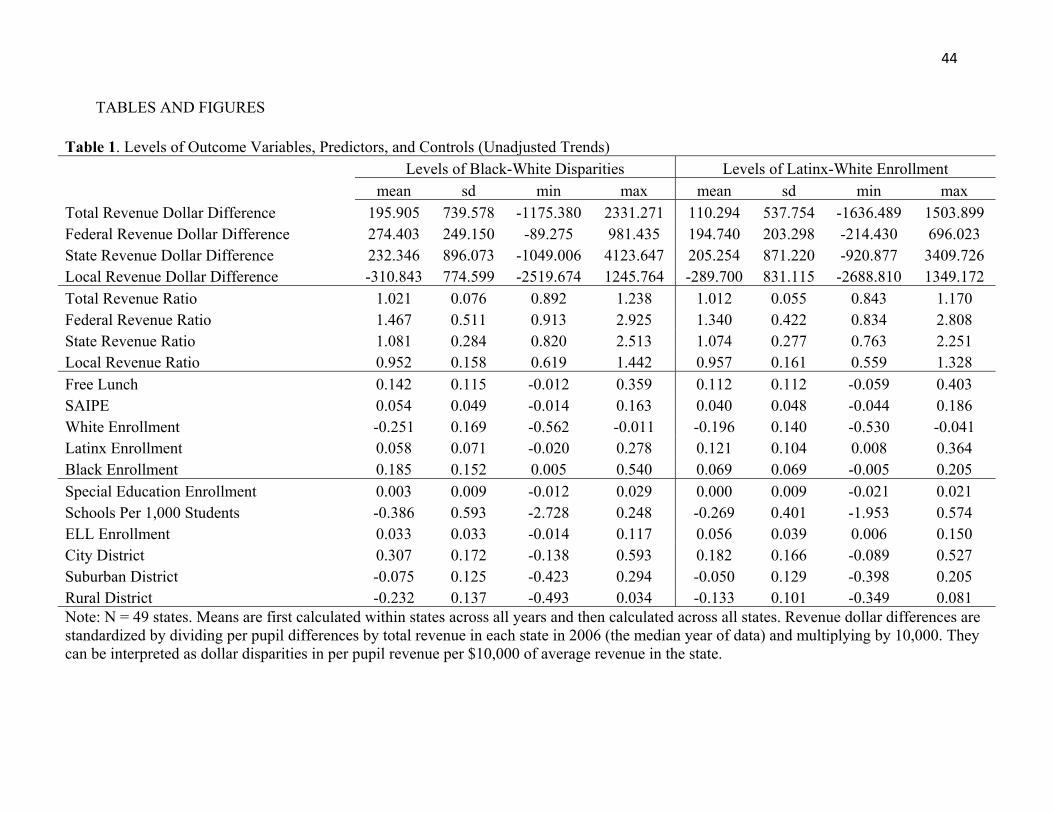
44
TABLES AND FIGURES
Table 1. Levels of Outcome Variables, Predictors, and Controls (Unadjusted Trends) Levels of Black-White Disparities Levels of Latinx-White Enrollment
mean sd min max mean sd min max Total Revenue Dollar Difference 195.905 739.578 -1175.380 2331.271 110.294 537.754 -1636.489 1503.899 Federal Revenue Dollar Difference 274.403 249.150 -89.275 981.435 194.740 203.298 -214.430 696.023 State Revenue Dollar Difference 232.346 896.073 -1049.006 4123.647 205.254 871.220 -920.877 3409.726 Local Revenue Dollar Difference -310.843 774.599 -2519.674 1245.764 -289.700 831.115 -2688.810 1349.172 Total Revenue Ratio 1.021 0.076 0.892 1.238 1.012 0.055 0.843 1.170 Federal Revenue Ratio 1.467 0.511 0.913 2.925 1.340 0.422 0.834 2.808 State Revenue Ratio 1.081 0.284 0.820 2.513 1.074 0.277 0.763 2.251 Local Revenue Ratio 0.952 0.158 0.619 1.442 0.957 0.161 0.559 1.328 Free Lunch 0.142 0.115 -0.012 0.359 0.112 0.112 -0.059 0.403 SAIPE 0.054 0.049 -0.014 0.163 0.040 0.048 -0.044 0.186 White Enrollment -0.251 0.169 -0.562 -0.011 -0.196 0.140 -0.530 -0.041 Latinx Enrollment 0.058 0.071 -0.020 0.278 0.121 0.104 0.008 0.364 Black Enrollment 0.185 0.152 0.005 0.540 0.069 0.069 -0.005 0.205 Special Education Enrollment 0.003 0.009 -0.012 0.029 0.000 0.009 -0.021 0.021 Schools Per 1,000 Students -0.386 0.593 -2.728 0.248 -0.269 0.401 -1.953 0.574 ELL Enrollment 0.033 0.033 -0.014 0.117 0.056 0.039 0.006 0.150 City District 0.307 0.172 -0.138 0.593 0.182 0.166 -0.089 0.527 Suburban District -0.075 0.125 -0.423 0.294 -0.050 0.129 -0.398 0.205 Rural District -0.232 0.137 -0.493 0.034 -0.133 0.101 -0.349 0.081 Note: N = 49 states. Means are first calculated within states across all years and then calculated across all states. Revenue dollar differences are standardized by dividing per pupil differences by total revenue in each state in 2006 (the median year of data) and multiplying by 10,000. They can be interpreted as dollar disparities in per pupil revenue per $10,000 of average revenue in the state.
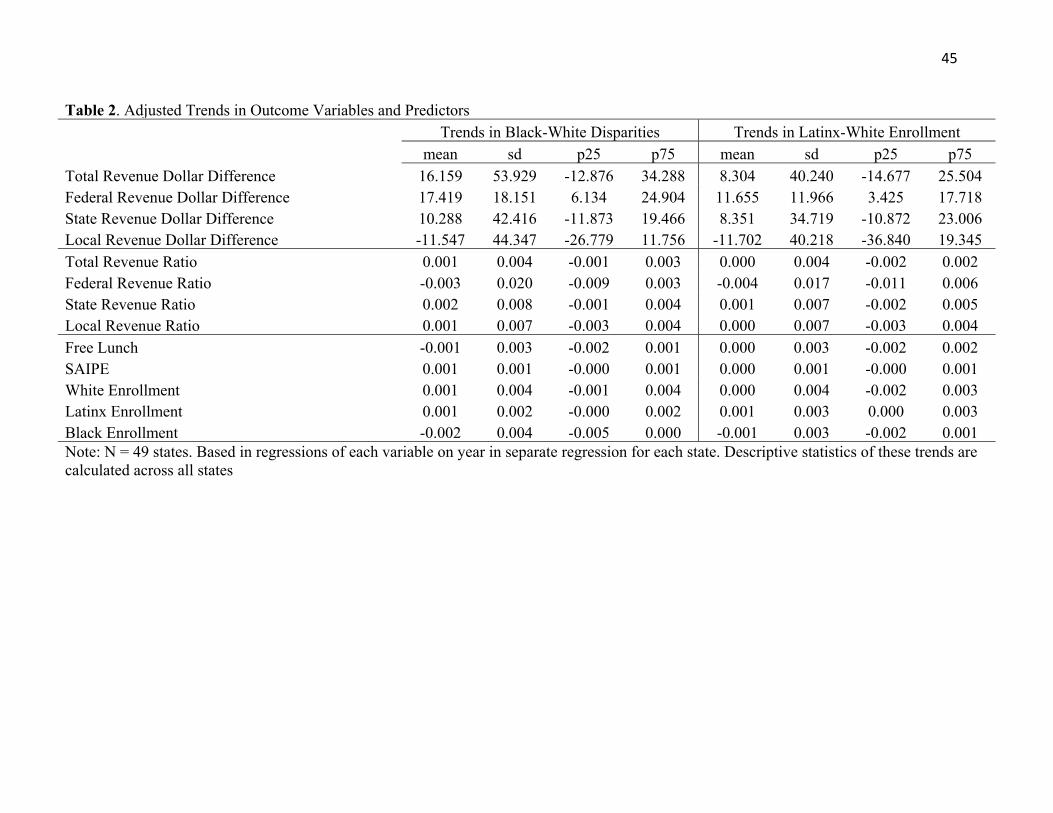
45
Table 2. Adjusted Trends in Outcome Variables and Predictors Trends in Black-White Disparities Trends in Latinx-White Enrollment
mean sd p25 p75 mean sd p25 p75 Total Revenue Dollar Difference 16.159 53.929 -12.876 34.288 8.304 40.240 -14.677 25.504 Federal Revenue Dollar Difference 17.419 18.151 6.134 24.904 11.655 11.966 3.425 17.718 State Revenue Dollar Difference 10.288 42.416 -11.873 19.466 8.351 34.719 -10.872 23.006 Local Revenue Dollar Difference -11.547 44.347 -26.779 11.756 -11.702 40.218 -36.840 19.345 Total Revenue Ratio 0.001 0.004 -0.001 0.003 0.000 0.004 -0.002 0.002 Federal Revenue Ratio -0.003 0.020 -0.009 0.003 -0.004 0.017 -0.011 0.006 State Revenue Ratio 0.002 0.008 -0.001 0.004 0.001 0.007 -0.002 0.005 Local Revenue Ratio 0.001 0.007 -0.003 0.004 0.000 0.007 -0.003 0.004 Free Lunch -0.001 0.003 -0.002 0.001 0.000 0.003 -0.002 0.002 SAIPE 0.001 0.001 -0.000 0.001 0.000 0.001 -0.000 0.001 White Enrollment 0.001 0.004 -0.001 0.004 0.000 0.004 -0.002 0.003 Latinx Enrollment 0.001 0.002 -0.000 0.002 0.001 0.003 0.000 0.003 Black Enrollment -0.002 0.004 -0.005 0.000 -0.001 0.003 -0.002 0.001 Note: N = 49 states. Based in regressions of each variable on year in separate regression for each state. Descriptive statistics of these trends are calculated across all states
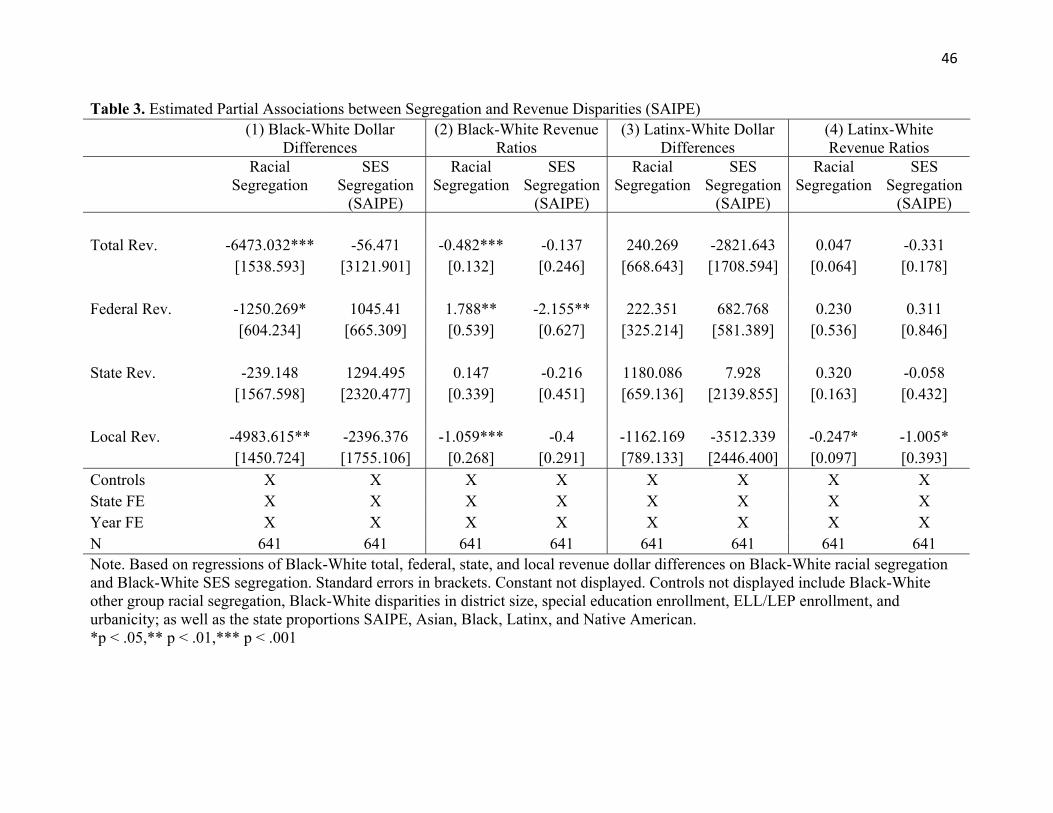
46
Table 3. Estimated Partial Associations between Segregation and Revenue Disparities (SAIPE) (1) Black-White Dollar
Differences (2) Black-White Revenue
Ratios (3) Latinx-White Dollar
Differences (4) Latinx-White Revenue Ratios
Racial Segregation
SES Segregation
(SAIPE)
Racial Segregation
SES Segregation
(SAIPE)
Racial Segregation
SES Segregation
(SAIPE)
Racial Segregation
SES Segregation
(SAIPE)
Total Rev. -6473.032*** -56.471 -0.482*** -0.137 240.269 -2821.643 0.047 -0.331 [1538.593] [3121.901] [0.132] [0.246] [668.643] [1708.594] [0.064] [0.178]
Federal Rev. -1250.269* 1045.41 1.788** -2.155** 222.351 682.768 0.230 0.311 [604.234] [665.309] [0.539] [0.627] [325.214] [581.389] [0.536] [0.846]
State Rev. -239.148 1294.495 0.147 -0.216 1180.086 7.928 0.320 -0.058 [1567.598] [2320.477] [0.339] [0.451] [659.136] [2139.855] [0.163] [0.432]
Local Rev. -4983.615** -2396.376 -1.059*** -0.4 -1162.169 -3512.339 -0.247* -1.005* [1450.724] [1755.106] [0.268] [0.291] [789.133] [2446.400] [0.097] [0.393] Controls X X X X X X X X State FE X X X X X X X X Year FE X X X X X X X X N 641 641 641 641 641 641 641 641 Note. Based on regressions of Black-White total, federal, state, and local revenue dollar differences on Black-White racial segregation and Black-White SES segregation. Standard errors in brackets. Constant not displayed. Controls not displayed include Black-White other group racial segregation, Black-White disparities in district size, special education enrollment, ELL/LEP enrollment, and urbanicity; as well as the state proportions SAIPE, Asian, Black, Latinx, and Native American. *p < .05,** p < .01,*** p < .001
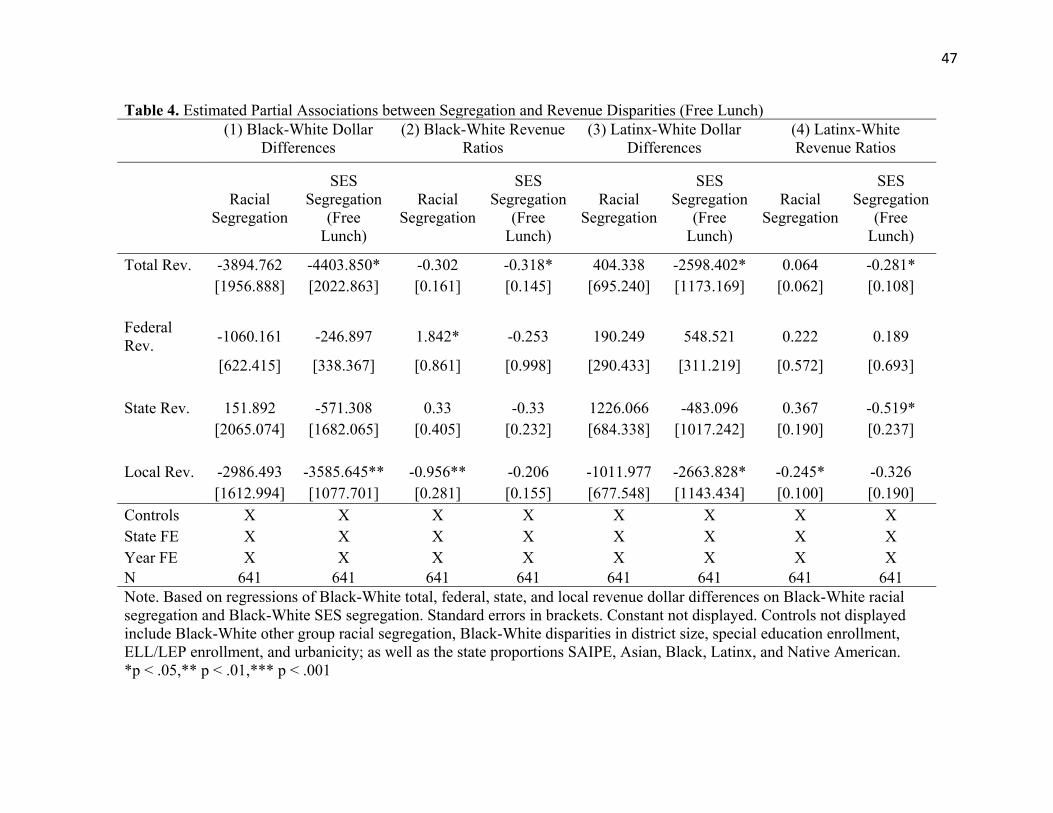
47
Table 4. Estimated Partial Associations between Segregation and Revenue Disparities (Free Lunch)
(1) Black-White Dollar
Differences (2) Black-White Revenue
Ratios (3) Latinx-White Dollar
Differences (4) Latinx-White Revenue Ratios
Racial Segregation
SES Segregation
(Free Lunch)
Racial Segregation
SES Segregation
(Free Lunch)
Racial Segregation
SES Segregation
(Free Lunch)
Racial Segregation
SES Segregation
(Free Lunch)
Total Rev. -3894.762 -4403.850* -0.302 -0.318* 404.338 -2598.402* 0.064 -0.281* [1956.888] [2022.863] [0.161] [0.145] [695.240] [1173.169] [0.062] [0.108]
Federal Rev. -1060.161 -246.897 1.842* -0.253 190.249 548.521 0.222 0.189
[622.415] [338.367] [0.861] [0.998] [290.433] [311.219] [0.572] [0.693]
State Rev. 151.892 -571.308 0.33 -0.33 1226.066 -483.096 0.367 -0.519* [2065.074] [1682.065] [0.405] [0.232] [684.338] [1017.242] [0.190] [0.237]
Local Rev. -2986.493 -3585.645** -0.956** -0.206 -1011.977 -2663.828* -0.245* -0.326 [1612.994] [1077.701] [0.281] [0.155] [677.548] [1143.434] [0.100] [0.190] Controls X X X X X X X X State FE X X X X X X X X Year FE X X X X X X X X N 641 641 641 641 641 641 641 641 Note. Based on regressions of Black-White total, federal, state, and local revenue dollar differences on Black-White racial segregation and Black-White SES segregation. Standard errors in brackets. Constant not displayed. Controls not displayed include Black-White other group racial segregation, Black-White disparities in district size, special education enrollment, ELL/LEP enrollment, and urbanicity; as well as the state proportions SAIPE, Asian, Black, Latinx, and Native American. *p < .05,** p < .01,*** p < .001
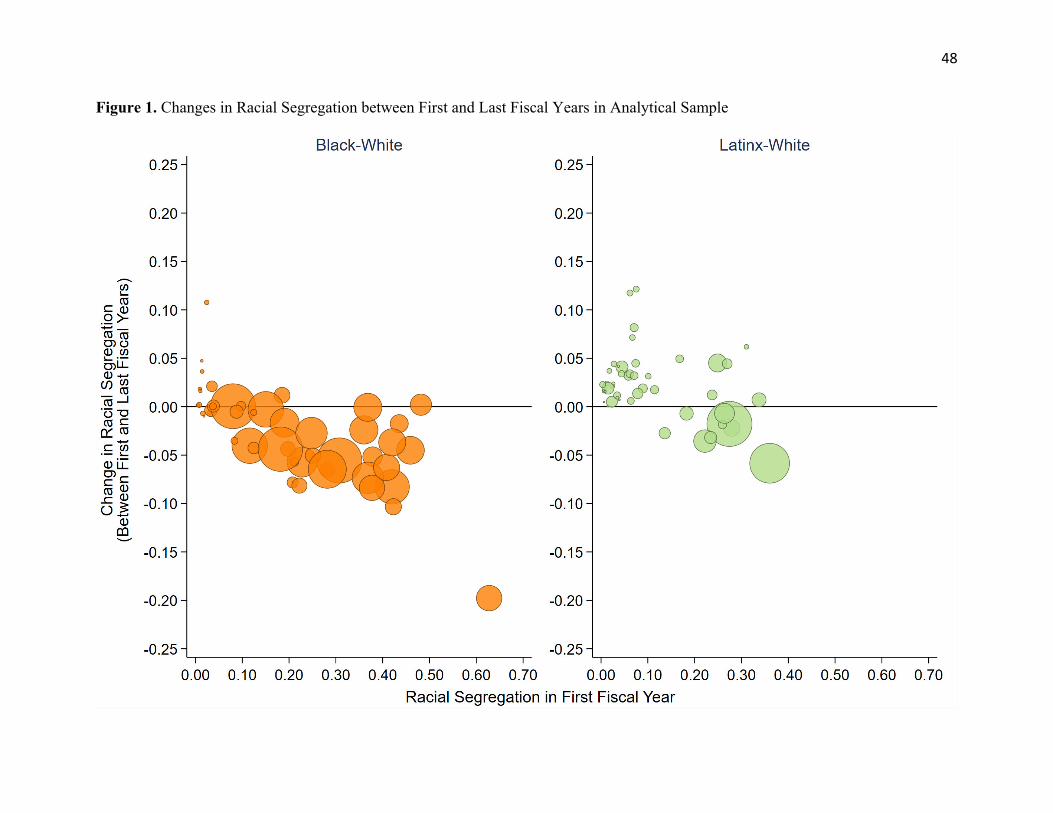
48
Figure 1. Changes in Racial Segregation between First and Last Fiscal Years in Analytical Sample
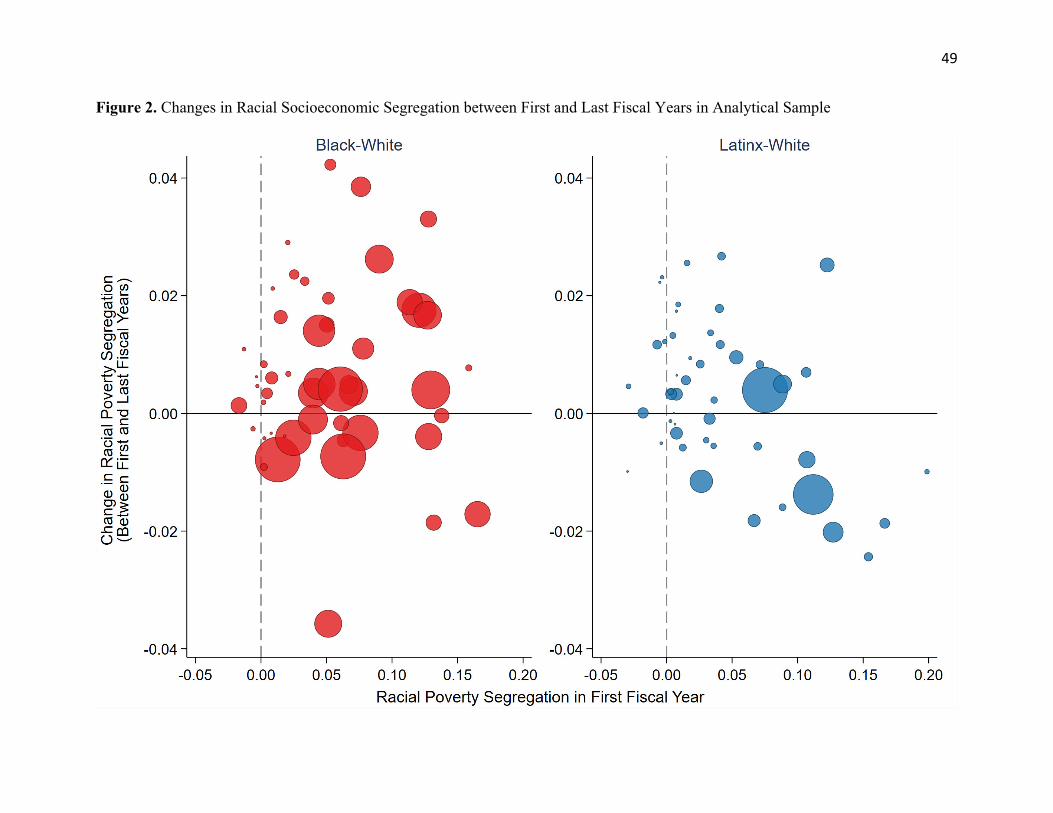
49
Figure 2. Changes in Racial Socioeconomic Segregation between First and Last Fiscal Years in Analytical Sample
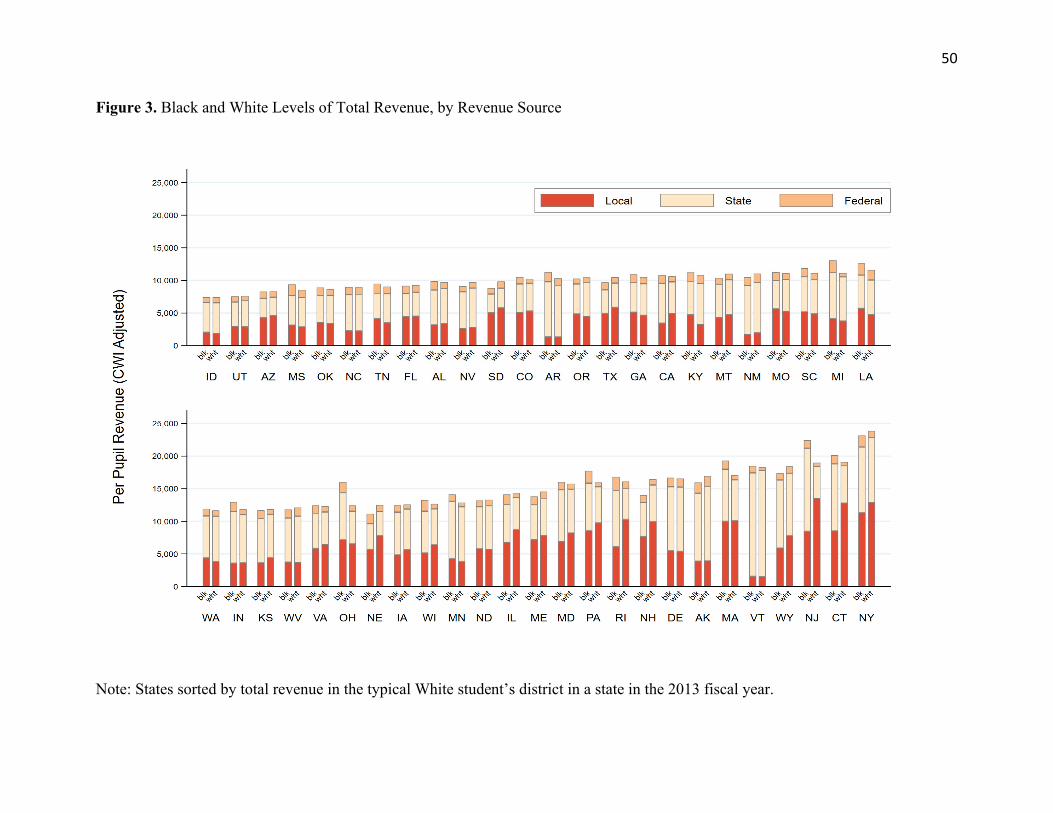
50
Figure 3. Black and White Levels of Total Revenue, by Revenue Source
Note: States sorted by total revenue in the typical White student’s district in a state in the 2013 fiscal year.
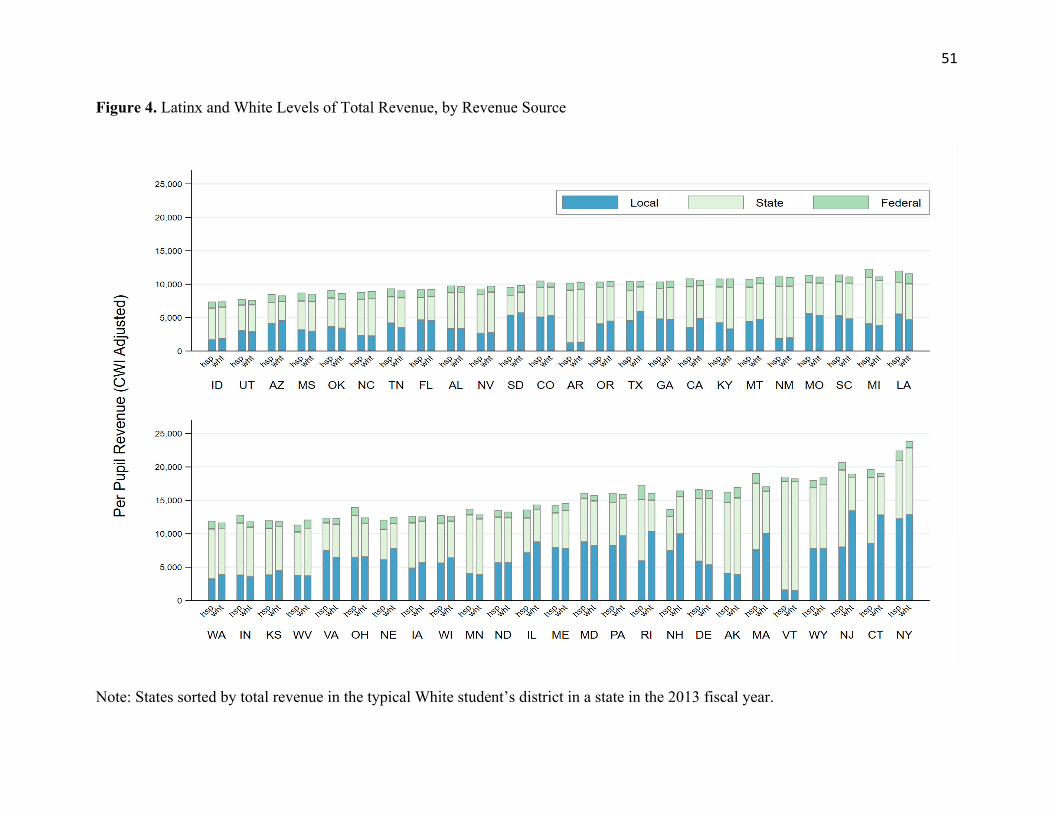
51
Figure 4. Latinx and White Levels of Total Revenue, by Revenue Source
Note: States sorted by total revenue in the typical White student’s district in a state in the 2013 fiscal year.
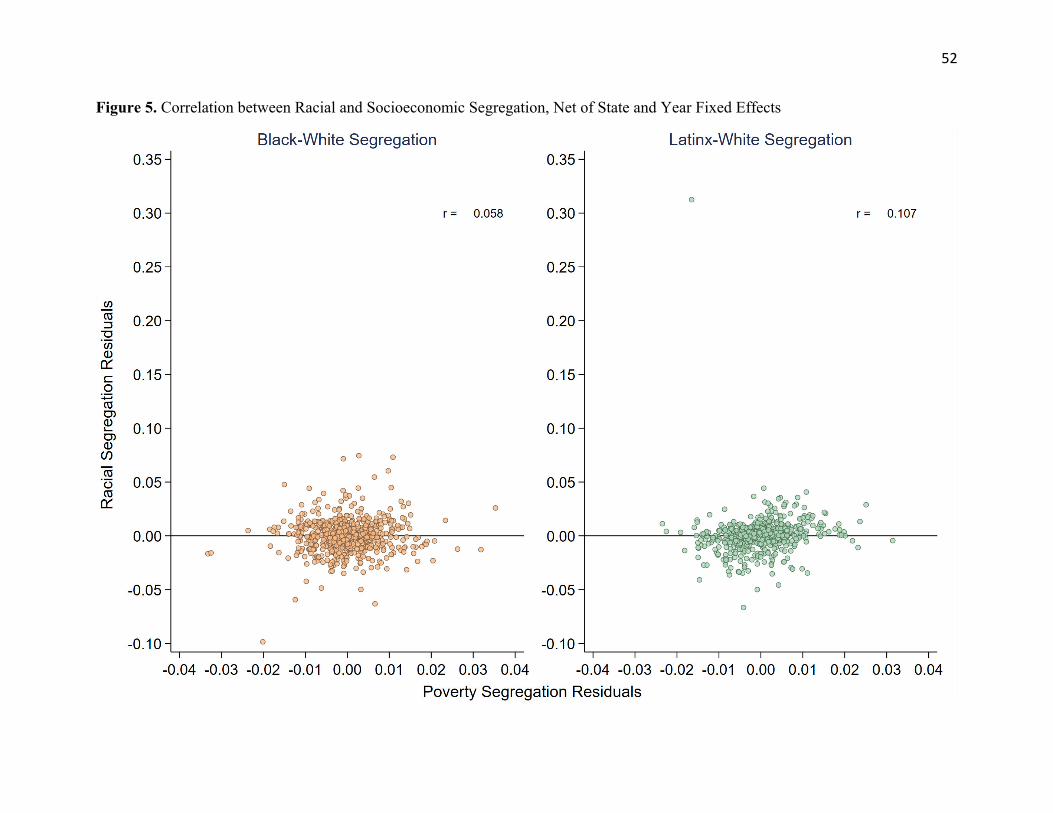
52
Figure 5. Correlation between Racial and Socioeconomic Segregation, Net of State and Year Fixed Effects
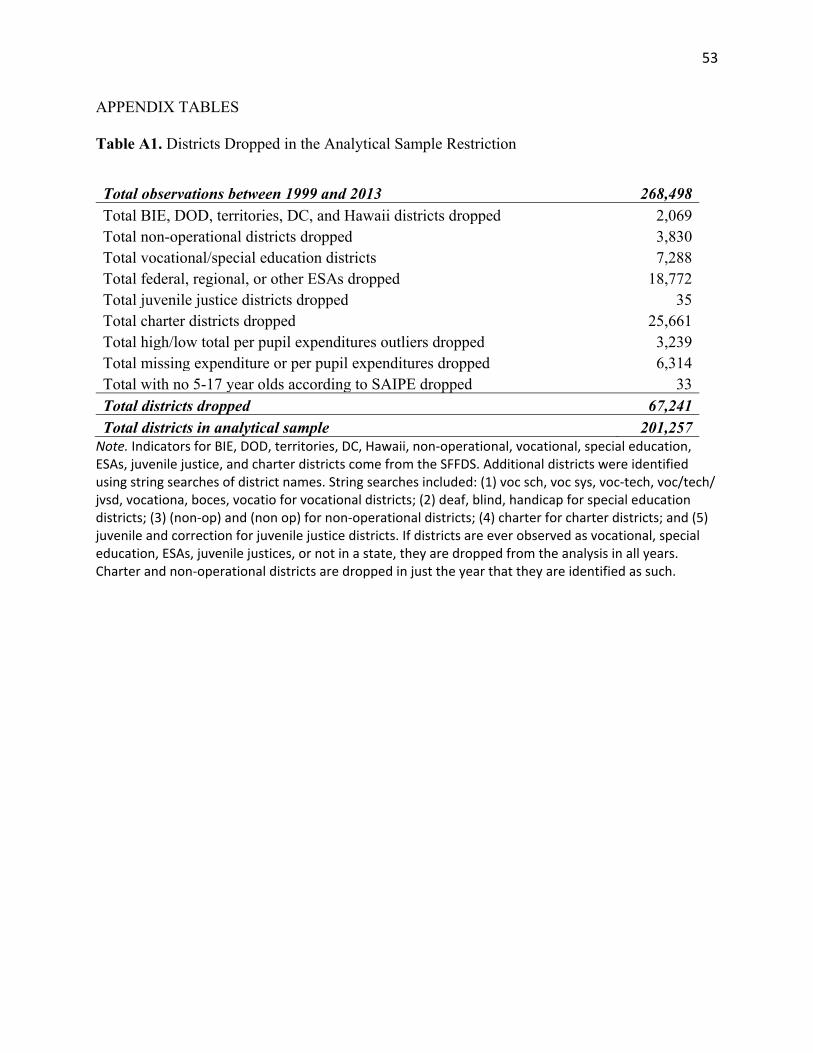
53
APPENDIX TABLES
Table A1. Districts Dropped in the Analytical Sample Restriction
Total observations between 1999 and 2013 268,498 Total BIE, DOD, territories, DC, and Hawaii districts dropped 2,069 Total non-operational districts dropped 3,830 Total vocational/special education districts 7,288 Total federal, regional, or other ESAs dropped 18,772 Total juvenile justice districts dropped 35 Total charter districts dropped 25,661 Total high/low total per pupil expenditures outliers dropped 3,239 Total missing expenditure or per pupil expenditures dropped 6,314 Total with no 5-17 year olds according to SAIPE dropped 33 Total districts dropped 67,241 Total districts in analytical sample 201,257
Note. Indicators for BIE, DOD, territories, DC, Hawaii, non-operational, vocational, special education, ESAs, juvenile justice, and charter districts come from the SFFDS. Additional districts were identified using string searches of district names. String searches included: (1) voc sch, voc sys, voc-tech, voc/tech/ jvsd, vocationa, boces, vocatio for vocational districts; (2) deaf, blind, handicap for special education districts; (3) (non-op) and (non op) for non-operational districts; (4) charter for charter districts; and (5) juvenile and correction for juvenile justice districts. If districts are ever observed as vocational, special education, ESAs, juvenile justices, or not in a state, they are dropped from the analysis in all years. Charter and non-operational districts are dropped in just the year that they are identified as such.
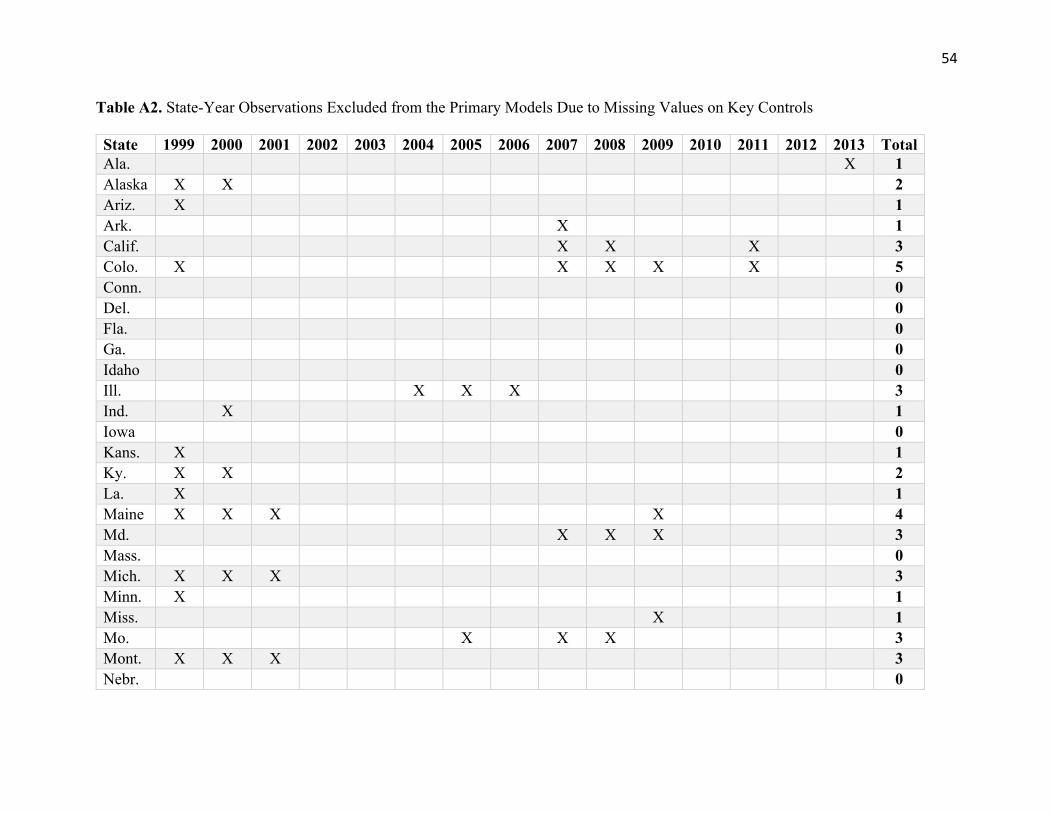
54
Table A2. State-Year Observations Excluded from the Primary Models Due to Missing Values on Key Controls
State 1999 2000 2001 2002 2003 2004 2005 2006 2007 2008 2009 2010 2011 2012 2013 Total Ala.
X 1
Alaska X X
2 Ariz. X
1
Ark.
X
1 Calif.
X X
X
3
Colo. X
X X X
X
5 Conn.
0
Del.
0 Fla.
0
Ga.
0 Idaho
0
Ill.
X X X
3 Ind.
X
1
Iowa
0 Kans. X
1
Ky. X X
2 La. X
1
Maine X X X
X
4 Md.
X X X
3
Mass.
0 Mich. X X X
3
Minn. X
1 Miss.
X
1
Mo.
X
X X
3 Mont. X X X
3
Nebr.
0
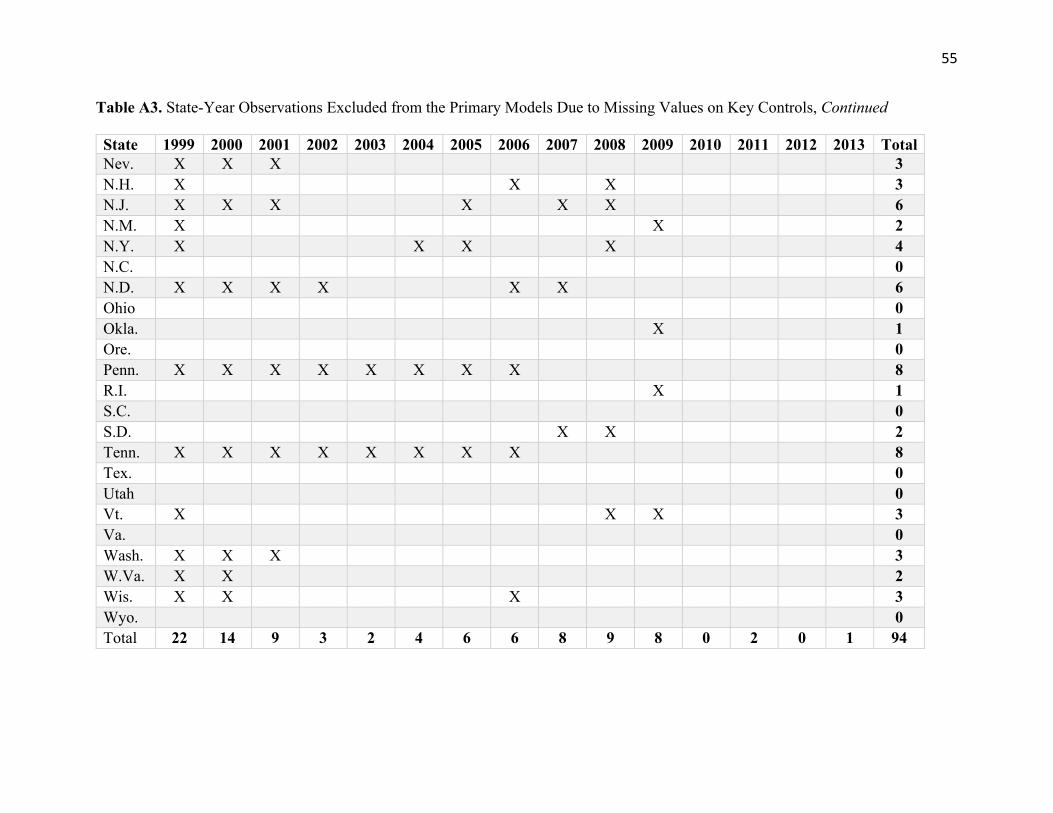
55
Table A3. State-Year Observations Excluded from the Primary Models Due to Missing Values on Key Controls, Continued
State 1999 2000 2001 2002 2003 2004 2005 2006 2007 2008 2009 2010 2011 2012 2013 Total Nev. X X X
3
N.H. X
X
X
3 N.J. X X X
X
X X
6
N.M. X
X
2 N.Y. X
X X
X
4
N.C.
0 N.D. X X X X
X X
6
Ohio
0 Okla.
X
1
Ore.
0 Penn. X X X X X X X X
8
R.I.
X
1 S.C.
0
S.D.
X X
2 Tenn. X X X X X X X X
8
Tex.
0 Utah
0
Vt. X
X X
3 Va.
0
Wash. X X X
3 W.Va. X X
2
Wis. X X
X
3 Wyo. 0 Total 22 14 9 3 2 4 6 6 8 9 8 0 2 0 1 94
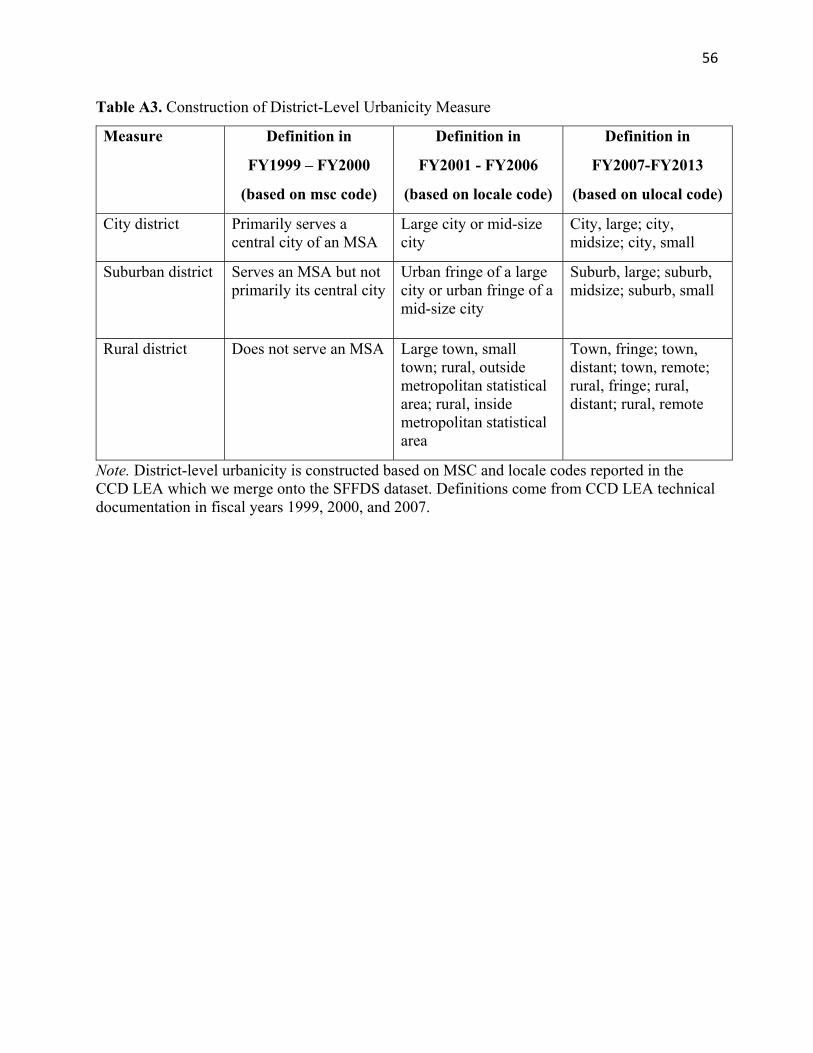
56
Table A3. Construction of District-Level Urbanicity Measure
Note. District-level urbanicity is constructed based on MSC and locale codes reported in the CCD LEA which we merge onto the SFFDS dataset. Definitions come from CCD LEA technical documentation in fiscal years 1999, 2000, and 2007.
Measure Definition in
FY1999 – FY2000
(based on msc code)
Definition in
FY2001 - FY2006
(based on locale code)
Definition in
FY2007-FY2013
(based on ulocal code)
City district Primarily serves a central city of an MSA
Large city or mid-size city
City, large; city, midsize; city, small
Suburban district Serves an MSA but not primarily its central city
Urban fringe of a large city or urban fringe of a mid-size city
Suburb, large; suburb, midsize; suburb, small
Rural district Does not serve an MSA Large town, small town; rural, outside metropolitan statistical area; rural, inside metropolitan statistical area
Town, fringe; town, distant; town, remote; rural, fringe; rural, distant; rural, remote