Embed Size (px)
Citation preview
Separation and Purification Technology 141 (2015) 197–206
Contents lists available at ScienceDirect
Separation and Purification Technology
journal homepage: www.elsevier .com/ locate /seppur
Optimization of Panax notoginseng extraction process using a designspace approach
http://dx.doi.org/10.1016/j.seppur.2014.11.0201383-5866/� 2014 Elsevier B.V. All rights reserved.
Abbreviations: AEA, amount of ethanol added (mL/g); ANOVA, analysis ofvariance; ARD, average relative deviation (%); C, saponin concentration; Cal,calculated values; CPP, critical process parameter; CQA, critical quality attribute;DM, the dry matter content of an extract (g/g); EC, ethanol content (v/v, %); EF,extraction frequency; ET, extraction time (h); Exp, experimental values ; EXT,extract; FMEA, Failure Mode and Effects Analysis; M, the mass; NED, the number ofexperimental data; PN, Panax notoginseng; QbD, Quality by Design; RPN, riskpriority number; RSD, relative standard deviation; SC, saponin content in drymatter (mg/g); YDM, the yield of dry matter; YR, the yield of saponins.⇑ Corresponding author. Tel./fax: +86 571 88208428.
E-mail address: [email protected] (H. Qu).
Xingchu Gong, Huali Chen, Jianyang Pan, Haibin Qu ⇑Pharmaceutical Informatics Institute, College of Pharmaceutical Sciences, Zhejiang University, Hangzhou 310058, China
a r t i c l e i n f o
Article history:Received 24 August 2014Received in revised form 16 November 2014Accepted 18 November 2014Available online 2 December 2014
Keywords:Quality by designReflux extractionDesign spaceBatch-to-batch consistency
a b s t r a c t
Health foods containing Panax notoginseng extract are developed in recent years. In this work, refluxextraction process was optimized using a design space approach to improve batch-to-batch consistencyof P. notoginseng extract. Saponin yields and dry matter yield were identified as the process critical qual-ity attributes (CQAs) of the extraction process. A risk assessment was applied to determine critical pro-cess parameters (CPPs), which were ethanol content (EC), amount of ethanol added (AEA), extraction time(ET) and extraction frequency (EF). Box-Behnken designed experiments were carried out to develop mod-els between CPPs and process CQAs. Determination coefficients were higher than 0.90 for all the models.Higher ET, EF, and AEA all result in higher saponin yields and dry matter yield. Dry matter yield decreaseas EC increases. Design space was calculated using a Monte-Carlo simulation method with the acceptableprobability of 0.85. Normal operation ranges to attain process CQA criteria with a probability more than94% are recommended as follows: EC of 84.0–86.0%, AEA of 5.0–7.0 mL/g, ET of 7.0–8.0 h, and EF of 2. Ver-ification experiment results showed that operating EC, AEA, EF and ET within design space can attain CQAcriteria. Most of the verification experiment results agreed well with prediction results, which means thatthe developed models are accurate and applicable in a larger scale extraction process.
� 2014 Elsevier B.V. All rights reserved.
1. Introduction
Panax notoginseng, the root of P. notoginseng (Burk.) F.H. Chen, isa medicinal and edible plant in China. In 1994, it was included as adietary supplement by the US Dietary Supplement Health andEducation Act in the USA [1]. P. notoginseng can remove bloodstasis, stop bleeding, relieve swelling, alleviate pain, treat hyperli-pemia and chronic infectious hepatitis [2]. Dammarane-type triter-pene saponins are the main bioactive components in P. notoginseng[2]. The saponins contribute to many pharmacological activities,such as antithrombotic, anti-atherosclerotic, fibrinolytic, antioxi-dant and cardioprotective effects [3,4]. Therefore the saponins
are frequently used as the main indices for P. notoginseng productevaluation [5,6].
Compared with directly eating P. notoginseng, taking its extractis more convenient. During the extraction and the following puri-fication process, heavy metals and pesticides can be removed,which will improve the safety of products made from P. notogin-seng. Many different methods are applied to extract saponins inP. notoginseng [7–13], such as heat reflux extraction, ultrasonicextraction, microwave-assisted extraction, cold percolation extrac-tion, accelerated solvent extraction, and pressurized liquid extrac-tion. The extraction conditions were optimized with orthogonalarray design or uniform design by maximizing the extracted sapo-nin amounts [9,10]. However, the batch-to-batch consistency ofextracts is not considered in extraction condition optimizations.
For food suppliers, the batch-to-batch consistency is the key tomaintaining brand equity. Because of the variability of materialsand complex transformation of components in the manufacturingprocess, it is a challenging task to keep food batch-to-batch consis-tency. Recently, Quality by Design (QbD) has become a paradigm tooptimize manufacturing processes [14,15]. Based on knowledgemanagement and risk management, QbD concept is usually imple-mented with several steps, which are critical quality attribute(CQA) definition, risk assessment, critical process parameter
Table 1Coded and uncoded values for the factors.
Parameters Symbols Coded values
�1 0 1
EC (V/V%) X1 70 80 90AEA (mL/g) X2 3 5 7ET (h) X3 2 5 8EF X4 2 3 4
198 X. Gong et al. / Separation and Purification Technology 141 (2015) 197–206
(CPP) determination, design space development, control strategydesign, and continual improvement in product lifecycle [16,17].In these steps, the development of design space is very importantbecause it provides guidance on the setting of critical processparameters [18].
Recently, Rozet et al. suggested that design space is ‘‘a multivar-iate domain of input factors ensuring that critically chosenresponses are included within predefined limits with an acceptablelevel of probability’’ [18]. According to ICH Q8 (R2), parametervariations within design space are not considered to affect productquality [16]. To develop the design space of a process, the knowl-edge on this process is highly required to obtain quantitativemathematical models between CPPs and process CQAs. Experimen-tal design is often applied to establish the models [19]. To calculatethe probability to meet the limits of process CQAs, the Monte-Carlosimulations and Bayesian modeling are commonly applied[20–22].
In this work, the extraction process of P. notoginseng was opti-mized using a design space approach [23], which contains thesteps of CQA definition, CPP identification, design space develop-ment and verification. The mixed solvent of ethanol and waterwas applied to extract saponins from P. notoginseng. In this work,the process CQAs of reflux extraction were discussed. CPPs wereobtained using a risk assessment. Models between CQAs and CPPswere developed. Design space was calculated based on the
Table 2Box-Behnken designed experiments and results.
Run EC (X1, V/V%) AEA (X2, mL/g) ET (X3, h) EF (X4) Saponin yiel
R1
1 70.0 3.0 5.0 3 14.52 80.0 3.0 5.0 2 13.83 80.0 5.0 2.0 2 13.24 70.0 5.0 5.0 4 14.85 90.0 5.0 8.0 3 15.16 80.0 7.0 2.0 3 14.47 80.0 5.0 5.0 3 15.68 70.0 5.0 8.0 3 15.99 80.0 5.0 5.0 3 15.6
10 80.0 7.0 8.0 3 15.911 80.0 3.0 8.0 3 16.112 90.0 5.0 2.0 3 12.413 80.0 3.0 5.0 4 15.914 90.0 3.0 5.0 3 14.815 70.0 5.0 5.0 2 14.316 80.0 5.0 5.0 3 15.817 80.0 5.0 8.0 2 15.818 80.0 3.0 2.0 3 13.419 90.0 5.0 5.0 4 15.020 90.0 5.0 5.0 2 13.021 70.0 5.0 2.0 3 14.922 70.0 7.0 5.0 3 16.023 90.0 7.0 5.0 3 13.824 80.0 5.0 8.0 4 16.225 80.0 5.0 5.0 3 16.326 80.0 7.0 5.0 2 14.527 80.0 5.0 5.0 3 15.328 80.0 5.0 2.0 4 15.429 80.0 7.0 5.0 4 15.3
Box-Behnken designed experimental results with a Monte-Carlosimulation. Finally, design space was verified.
2. Experimental
2.1. Materials and chemicals
P. notoginseng was collected from Wenshan of Yunnan Province(China). Standard substances of notoginsenoside R1, ginsenosideRg1, ginsenoside Re, ginsenoside Rb1, and ginsenoside Rd werepurchased from Shanghai Winherb Pharmaceutical TechnologyDevelopment. Co., Ltd. (Shanghai, China). Ethanol was purchasedfrom Shanghai Ling Feng Chemical Reagent Co., Ltd. (Shanghai,China). Acetonitrile (HPLC grade) and methanol (HPLC grade) wereobtained from Merck (Darmstadt, Germany). The formic acid (HPLCgrade) was purchased from Tedia (Darmstadt, Germany). Deion-ized water was produced using a Milli-Q academic water purifica-tion system (Milford, MA, USA).
2.2. Procedures
A reflux extraction was used to extract P. notoginseng using themixed solvent of ethanol and water as the extractant. A water bath(W501, Shanghai Shen Sheng Biotechnology Co., Ltd) operated at95 �C was used to boil the mixed solvent. A condenser tube wasapplied to condense vaporized solvent. The amount of P. notogin-seng was 50 g in each experiment. Four parameters were investi-gated in experiments, which were ethanol content in the mixedsolvent (EC, V/V%) , amount of ethanol added (AEA, mL/g) , extrac-tion time (ET, h) and extraction frequency (EF). In the first extrac-tion, more solvent was added with a volume of 50 mL in all theexperiments. The obtained extracts were mixed, filtered withgauze and weighed. Saponin contents and dry matter content ofthe extracts then were determined.
d (mg/g Panax notoginseng) Dry matter yield (mg/g Panax notoginseng)
Rg1 Rb1 Rd
46.2 46.7 9.99 388.444.7 43.4 9.48 352.143.7 41.8 9.15 362.750.2 50.3 10.7 431.251.2 50.4 11.0 395.549.6 47.1 10.3 406.850.8 51.7 11.2 425.252.8 53.0 11.5 433.651.1 53.4 11.6 428.954.6 53.2 11.7 437.852.0 51.4 11.4 408.144.1 38.2 8.49 342.752.1 51.5 11.4 414.548.7 44.6 10.1 358.247.5 47.1 9.87 378.253.0 52.5 11.1 425.253.4 52.6 11.5 398.445.3 43.8 9.70 374.150.4 49.4 10.8 394.743.7 41.3 8.95 338.850.3 47.5 10.5 419.052.9 53.3 11.7 452.850.6 46.3 9.96 381.555.8 55.9 12.1 441.552.1 50.6 10.6 421.648.0 47.3 10.0 389.452.0 50.0 10.5 426.751.0 50.4 10.9 409.250.5 51.0 11.0 409.9
Table 3Verification experimental conditions and results (n = 3).
No. V1 V2 V3 V4
Material amount (g) 50.0 50.0 200.0 500.0EC (V/V%) 70 86 86 86AEA (mL/g) 3 5.4 5.4 5.4ET (h) 2 8 8 8EF 2 2 2 2Probability 0 0.9994 0.9994 0.9994Within design space No Yes Yes YesNotoginsenoside R1 yield (mg/g) Experimental value 11.6 ± 0.4 13.8 ± 0.5 14.1 ± 0.1 14.2 ± 0.3
Predicted value 11.8 15.0 15.0 15.0Ginsenoside Rg1 yield (mg/g) Experimental value 41.0 ± 0.6 50.9 ± 1.2 51.2 ± 0.4 51.4 ± 0.7
Predicted value 39.5 51.1 51.1 51.1Ginsenoside Rb1 yield (mg/g) Experimental value 36.1 ± 0.7 46.5 ± 0.8 46.2 ± 0.1 47.2 ± 0.5
Predicted value 37.6 49.8 49.8 49.8Ginsenoside Rd yield (mg/g) Experimental value 7.8 ± 0.3 9.8 ± 0.2 9.6 ± 0.0 9.9 ± 0.2
Predicted value 8.2 10.9 10.9 10.9DM yield (mg/g) Experimental value 344.0 ± 0.5 382.6 ± 6.5 381.5 ± 9.1 390.6 ± 3.2
Predicted value 324.5 381.3 381.3 381.3
X. Gong et al. / Separation and Purification Technology 141 (2015) 197–206 199
2.3. Experimental design
Box-Behnken designed experiments were applied to obtain thequantitative models between CQAs and CPPs. The coded anduncoded values of EC, ET, EF, and AEA are listed in Table 1. Therun order is listed in Table 2. After the design space was developed,verification experiments with conditions listed in Table 3 were car-ried out. Verification experiments were repeated three times.
2.4. Analytical methods
The quantitative analysis of saponins was performed using anHPLC method. An Agilent 1260 HPLC system (Agilent Technologies,USA) coupled with a Waters Acquity CSH C18 column (2.1 mm �50 mm, 1.7 lm) was used. The mobile phase consisted of 0.01%(V/V) formic acid in water (FA) and 0.01% (V/V) formic acid inacetonitrile (FB). The separation was achieved using a gradientelution program as follows: 18–20% FB at 0–6 min, 20–30% FB at6–6.8 min, 30–35% FB at 6.8–11 min, 35–90% FB at 11–17 min,and 90–90% FB at 17–25 min. The solvent flow rate was 0.35 mL/min, and the column temperature was kept at 40 �C. The detectionwavelength was 203 nm. Dry matter content was determinedgravimetrically using a precision electronic balance (AB204-N,Mettler Toledo Shanghai Co., Ltd). Before weighed, samples weredried at 105 �C in an oven (DZF-6050, Shanghai Jing Hong Labora-tory Instrument Co., Ltd.) for 3 h and then kept in a desiccator for0.5 h.
2.5. Data processing
The yields of saponins (YR) are defined as Eq. (1).
YRi ¼MEXT � Ci;EXT
MPNð1Þ
where M and C refer to the mass and concentration, respectively;subscript EXT and PN are extract and P. notoginseng, respectively;
Table 4Criteria of process CQAs.
CQAs Lower control limit (mg/g) Upper control limit(mg/g)
Notoginsenoside R1 yield 13 18Ginsenoside Rg1 yield 44 60Ginsenoside Rb1 yield 46 65Ginsenoside Rd yield 9 15DM yield 200 400
subscript i (i = 1–4) represents notoginsenoside R1, ginsenosideRg1, ginsenoside Rb1, or ginsenoside Rd, respectively. The yield ofdry matter (YDM) was calculated using Eq. (2).
YDM ¼ DM �MEXT
MPNð2Þ
where DM is the dry matter content of an extract. Saponin contentin dry matter (SC) is calculated using Eq. (3).
SC ¼ Ci
DM� 100% ð3Þ
Design Expert V8.0.6.1 (State-Ease Inc., MN) was used to analyzethe results of Box-Behnken design. Eq. (4) was used to model theresults of experiments.
Y ¼ a0 þ a1X1 þ a2X2 þ a3X3 þ a4X4 þ a5X1X2 þ a6X1X3
þ a7X1X4 þ a8X2X3 þ a9X2X4 þ a10X3X4 þ a11X21 þ a12X2
2
þ a13X23 þ a14X2
4 ð4Þ
where Y is the response; X1, X2, X3, and X4 represent parameters; a0
is a constant; a1 to a14 are regression coefficients. Stepwise regres-sion was applied to remove non-significant terms. The significancelevels for adding terms and removing terms were both set to 0.15.All the parameters were coded before modeling.
The design space was calculated using a Monte-Carlo methodwith a self-written program of Matlab (R2010b, Version 7.11,MathWorks, USA) [24,25]. The calculation step lengths for EC,AEA and ET were 0.02, 0.02, and 0.02, respectively. For all theexperimental results, the relative standard deviations (RSD) ofsaponin concentrations and dry matter concentration in theextracts were considered to be the same with the RSD values ofthe center point in the Monte-Carlo simulation. Random data fol-lowing normal distribution were created in each simulation. Sim-ulation was repeated 50,000 times to calculate the probability.The acceptable level of probability for design space was set as0.85.
3. Results and discussions
3.1. Process CQA determination
Many criteria can be used as process CQAs for the extraction ofP. notoginseng, including saponin yields, dry matter yield, saponincontents in dry matter, and so on. Saponin content in dry matteris a function of saponin yield and dry matter yield [26], whichcan be derived from Eqs. (1)–(3).
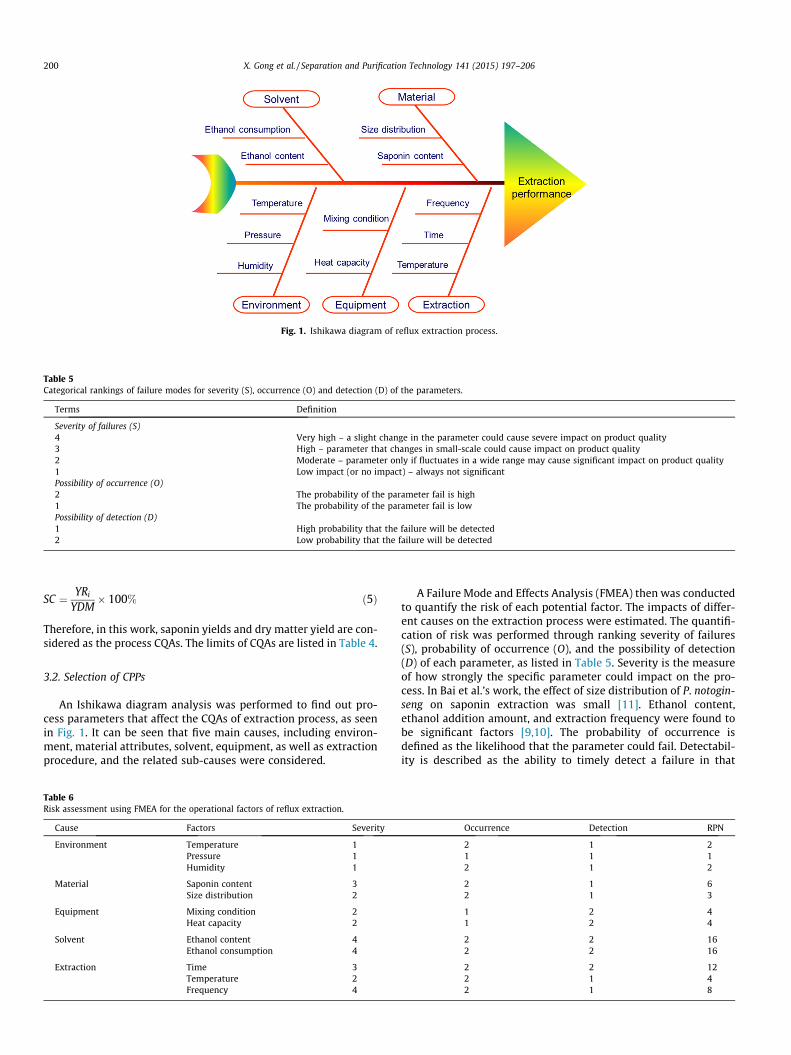
Fig. 1. Ishikawa diagram of reflux extraction process.
Table 5Categorical rankings of failure modes for severity (S), occurrence (O) and detection (D) of the parameters.
Terms Definition
Severity of failures (S)4 Very high – a slight change in the parameter could cause severe impact on product quality3 High – parameter that changes in small-scale could cause impact on product quality2 Moderate – parameter only if fluctuates in a wide range may cause significant impact on product quality1 Low impact (or no impact) – always not significantPossibility of occurrence (O)2 The probability of the parameter fail is high1 The probability of the parameter fail is lowPossibility of detection (D)1 High probability that the failure will be detected2 Low probability that the failure will be detected
200 X. Gong et al. / Separation and Purification Technology 141 (2015) 197–206
SC ¼ YRi
YDM� 100% ð5Þ
Therefore, in this work, saponin yields and dry matter yield are con-sidered as the process CQAs. The limits of CQAs are listed in Table 4.
3.2. Selection of CPPs
An Ishikawa diagram analysis was performed to find out pro-cess parameters that affect the CQAs of extraction process, as seenin Fig. 1. It can be seen that five main causes, including environ-ment, material attributes, solvent, equipment, as well as extractionprocedure, and the related sub-causes were considered.
Table 6Risk assessment using FMEA for the operational factors of reflux extraction.
Cause Factors Severity
Environment Temperature 1Pressure 1Humidity 1
Material Saponin content 3Size distribution 2
Equipment Mixing condition 2Heat capacity 2
Solvent Ethanol content 4Ethanol consumption 4
Extraction Time 3Temperature 2Frequency 4
A Failure Mode and Effects Analysis (FMEA) then was conductedto quantify the risk of each potential factor. The impacts of differ-ent causes on the extraction process were estimated. The quantifi-cation of risk was performed through ranking severity of failures(S), probability of occurrence (O), and the possibility of detection(D) of each parameter, as listed in Table 5. Severity is the measureof how strongly the specific parameter could impact on the pro-cess. In Bai et al.’s work, the effect of size distribution of P. notogin-seng on saponin extraction was small [11]. Ethanol content,ethanol addition amount, and extraction frequency were found tobe significant factors [9,10]. The probability of occurrence isdefined as the likelihood that the parameter could fail. Detectabil-ity is described as the ability to timely detect a failure in that
Occurrence Detection RPN
2 1 21 1 12 1 2
2 1 62 1 3
1 2 41 2 4
2 2 162 2 16
2 2 122 1 42 1 8
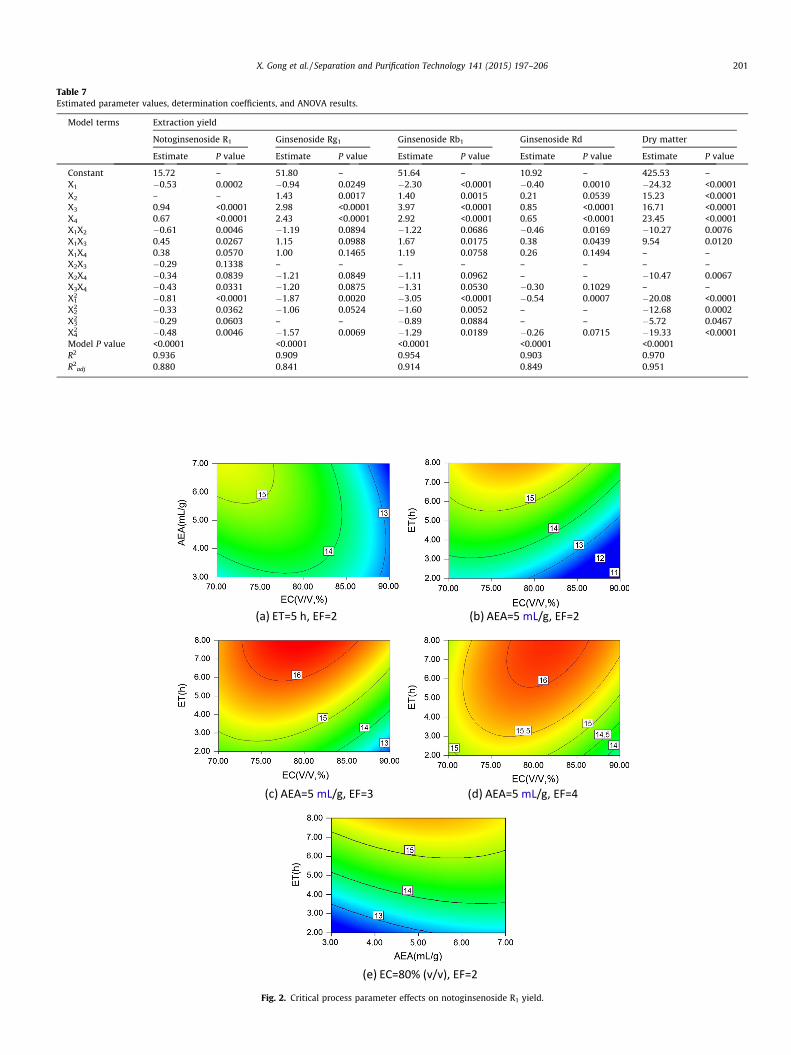
Table 7Estimated parameter values, determination coefficients, and ANOVA results.
Model terms Extraction yield
Notoginsenoside R1 Ginsenoside Rg1 Ginsenoside Rb1 Ginsenoside Rd Dry matter
Estimate P value Estimate P value Estimate P value Estimate P value Estimate P value
Constant 15.72 – 51.80 – 51.64 – 10.92 – 425.53 –X1 �0.53 0.0002 �0.94 0.0249 �2.30 <0.0001 �0.40 0.0010 �24.32 <0.0001X2 – – 1.43 0.0017 1.40 0.0015 0.21 0.0539 15.23 <0.0001X3 0.94 <0.0001 2.98 <0.0001 3.97 <0.0001 0.85 <0.0001 16.71 <0.0001X4 0.67 <0.0001 2.43 <0.0001 2.92 <0.0001 0.65 <0.0001 23.45 <0.0001X1X2 �0.61 0.0046 �1.19 0.0894 �1.22 0.0686 �0.46 0.0169 �10.27 0.0076X1X3 0.45 0.0267 1.15 0.0988 1.67 0.0175 0.38 0.0439 9.54 0.0120X1X4 0.38 0.0570 1.00 0.1465 1.19 0.0758 0.26 0.1494 – –X2X3 �0.29 0.1338 – – – – – – – –X2X4 �0.34 0.0839 �1.21 0.0849 �1.11 0.0962 – – �10.47 0.0067X3X4 �0.43 0.0331 �1.20 0.0875 �1.31 0.0530 �0.30 0.1029 – –X1
2 �0.81 <0.0001 �1.87 0.0020 �3.05 <0.0001 �0.54 0.0007 �20.08 <0.0001X2
2 �0.33 0.0362 �1.06 0.0524 �1.60 0.0052 – – �12.68 0.0002X3
2 �0.29 0.0603 – – �0.89 0.0884 – – �5.72 0.0467X4
2 �0.48 0.0046 �1.57 0.0069 �1.29 0.0189 �0.26 0.0715 �19.33 <0.0001Model P value <0.0001 <0.0001 <0.0001 <0.0001 <0.0001R2 0.936 0.909 0.954 0.903 0.970R2
adj 0.880 0.841 0.914 0.849 0.951
(a) ET=5 h, EF=2 (b) AEA=5 mL/g, EF=2
(c) AEA=5 mL/g, EF=3 (d) AEA=5 mL/g, EF=4
(e) EC=80% (v/v), EF=2
Fig. 2. Critical process parameter effects on notoginsenoside R1 yield.
X. Gong et al. / Separation and Purification Technology 141 (2015) 197–206 201
(a) ET=5 h, EF=2 (b) AEA=5 mL/g, EF=2
(c) AEA=5 mL/g, EF=3 (d) AEA=5 mL/g, EF=4
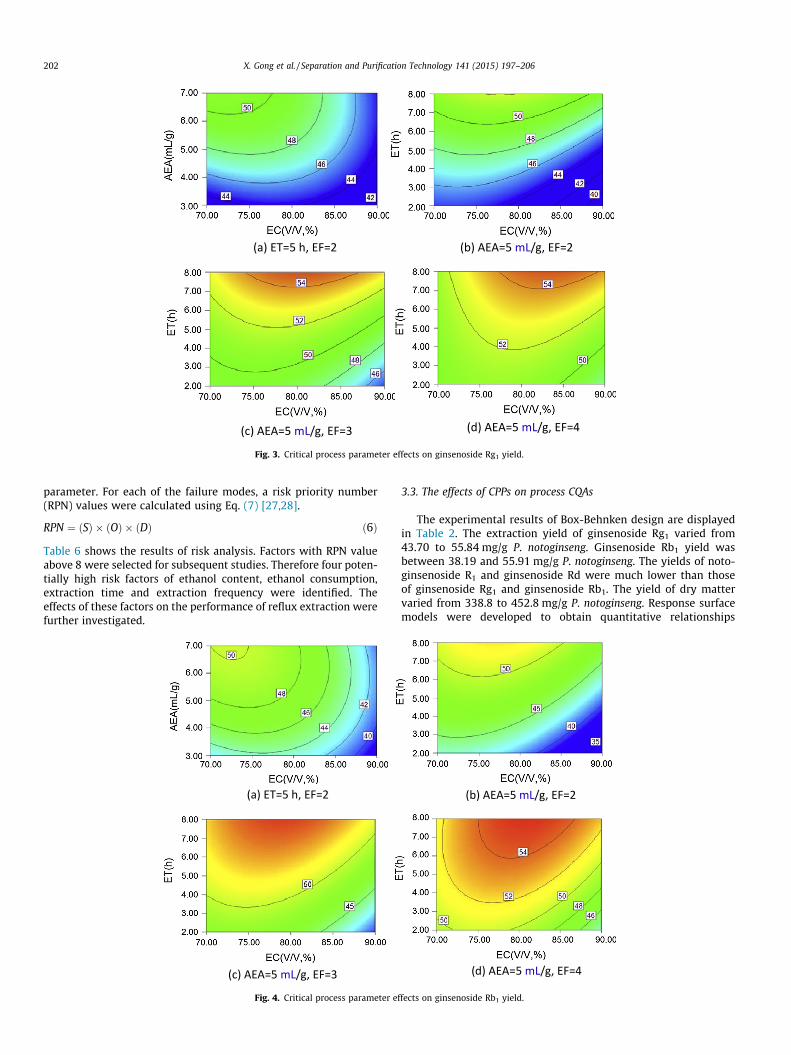
Fig. 3. Critical process parameter effects on ginsenoside Rg1 yield.
202 X. Gong et al. / Separation and Purification Technology 141 (2015) 197–206
parameter. For each of the failure modes, a risk priority number(RPN) values were calculated using Eq. (7) [27,28].
RPN ¼ ðSÞ � ðOÞ � ðDÞ ð6Þ
Table 6 shows the results of risk analysis. Factors with RPN valueabove 8 were selected for subsequent studies. Therefore four poten-tially high risk factors of ethanol content, ethanol consumption,extraction time and extraction frequency were identified. Theeffects of these factors on the performance of reflux extraction werefurther investigated.
(a) ET=5 h, EF=2
(c) AEA=5 mL/g, EF=3
Fig. 4. Critical process parameter ef
3.3. The effects of CPPs on process CQAs
The experimental results of Box-Behnken design are displayedin Table 2. The extraction yield of ginsenoside Rg1 varied from43.70 to 55.84 mg/g P. notoginseng. Ginsenoside Rb1 yield wasbetween 38.19 and 55.91 mg/g P. notoginseng. The yields of noto-ginsenoside R1 and ginsenoside Rd were much lower than thoseof ginsenoside Rg1 and ginsenoside Rb1. The yield of dry mattervaried from 338.8 to 452.8 mg/g P. notoginseng. Response surfacemodels were developed to obtain quantitative relationships
(b) AEA=5 mL/g, EF=2
(d) AEA=5 mL/g, EF=4
fects on ginsenoside Rb1 yield.
(a) ET=5 h, EF=2 (b) AEA=5 mL/g, EF=2
(c) AEA=5 mL/g, EF=3 (d ) AEA=5 mL/g, EF=4
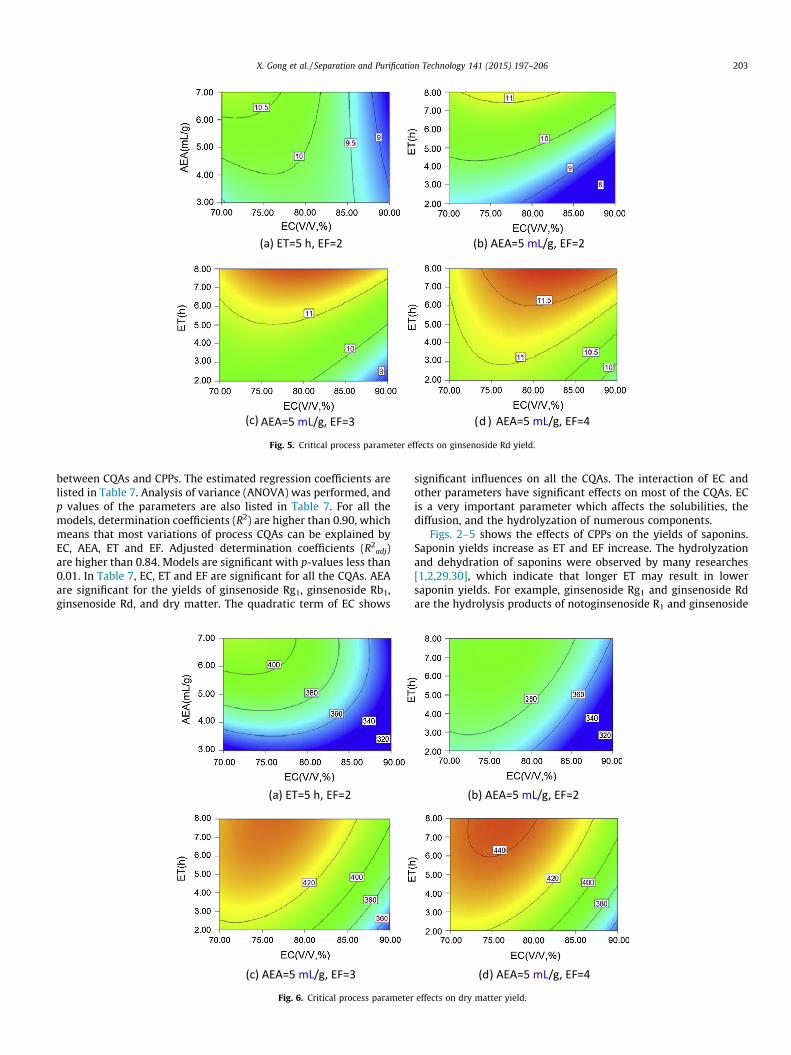
Fig. 5. Critical process parameter effects on ginsenoside Rd yield.
X. Gong et al. / Separation and Purification Technology 141 (2015) 197–206 203
between CQAs and CPPs. The estimated regression coefficients arelisted in Table 7. Analysis of variance (ANOVA) was performed, andp values of the parameters are also listed in Table 7. For all themodels, determination coefficients (R2) are higher than 0.90, whichmeans that most variations of process CQAs can be explained byEC, AEA, ET and EF. Adjusted determination coefficients (R2
adj)are higher than 0.84. Models are significant with p-values less than0.01. In Table 7, EC, ET and EF are significant for all the CQAs. AEAare significant for the yields of ginsenoside Rg1, ginsenoside Rb1,ginsenoside Rd, and dry matter. The quadratic term of EC shows
(a) ET=5 h, EF=2
(c) AEA=5 mL/g, EF=3
Fig. 6. Critical process parameter
significant influences on all the CQAs. The interaction of EC andother parameters have significant effects on most of the CQAs. ECis a very important parameter which affects the solubilities, thediffusion, and the hydrolyzation of numerous components.
Figs. 2–5 shows the effects of CPPs on the yields of saponins.Saponin yields increase as ET and EF increase. The hydrolyzationand dehydration of saponins were observed by many researches[1,2,29,30], which indicate that longer ET may result in lowersaponin yields. For example, ginsenoside Rg1 and ginsenoside Rdare the hydrolysis products of notoginsenoside R1 and ginsenoside
(b) AEA=5 mL/g, EF=2
(d) AEA=5 mL/g, EF=4
effects on dry matter yield.
2 3 4 11 12 13 142
3
4
11
12
13
14 Notoginsenoside R1
Ginsenoside Rg1
Ginsenoside Rb1
Ginsenoside Rd
SC
Cal
SCExp
Fig. 7. Experimental and calculated saponin contents in dry matter.
204 X. Gong et al. / Separation and Purification Technology 141 (2015) 197–206
Rb1, respectively [1]. The hydrolyzation of ginsenoside Rg1 and gin-senoside Rd will form ginsenoside Rh1 and ginsenoside Rg3, respec-tively [1]. However, saponin loss was not significant when ETincreased in our experiments. A possible explanation is that thetemperature in our experiments was lower than that reported inliterature because of the usage of mixed ethanol–water solvent[1,2,29,30]. As EC increases, saponin yields first increase and thendecreases. Water in the mixed solvent can result in the swellingof material, which helps to extract saponins in a shorter time.However, more saponins will hydrolyze when water content inmixed solvent is high because of higher boiling point. Thereforethe decrease of EC may increase saponin loss caused by chemicalreactions. Higher AEA and EF both increase the saponin concentra-tion difference between material and extract, accordingly resultingin higher saponin yields.
The effects of CPPs on the yield of dry matter in extracts areshown in Fig. 6. Dry matter yield increases when AEA increases,ET increases, EF increases, or EC decreases. The mass ratio of
(a) ET=5 h, EF=2
(c) AEA=5 mL/g, EF=3
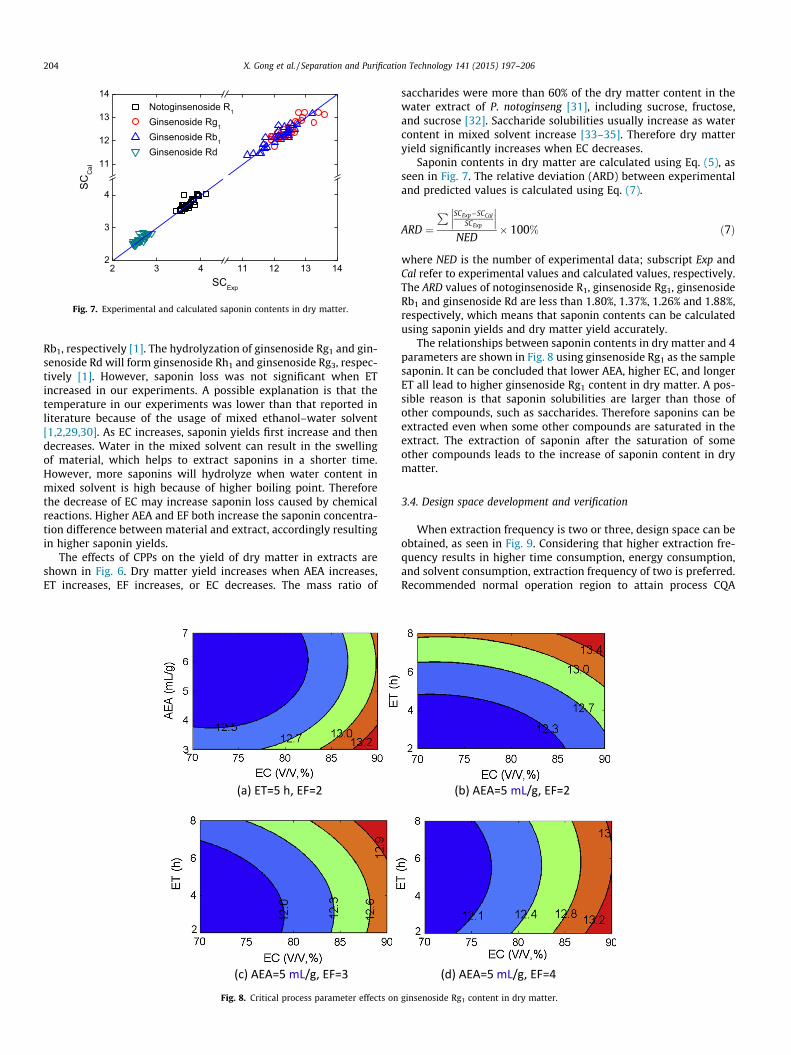
Fig. 8. Critical process parameter effects on
saccharides were more than 60% of the dry matter content in thewater extract of P. notoginseng [31], including sucrose, fructose,and sucrose [32]. Saccharide solubilities usually increase as watercontent in mixed solvent increase [33–35]. Therefore dry matteryield significantly increases when EC decreases.
Saponin contents in dry matter are calculated using Eq. (5), asseen in Fig. 7. The relative deviation (ARD) between experimentaland predicted values is calculated using Eq. (7).
ARD ¼P SCExp�SCCal
SCExp
���
���
NED� 100% ð7Þ
where NED is the number of experimental data; subscript Exp andCal refer to experimental values and calculated values, respectively.The ARD values of notoginsenoside R1, ginsenoside Rg1, ginsenosideRb1 and ginsenoside Rd are less than 1.80%, 1.37%, 1.26% and 1.88%,respectively, which means that saponin contents can be calculatedusing saponin yields and dry matter yield accurately.
The relationships between saponin contents in dry matter and 4parameters are shown in Fig. 8 using ginsenoside Rg1 as the samplesaponin. It can be concluded that lower AEA, higher EC, and longerET all lead to higher ginsenoside Rg1 content in dry matter. A pos-sible reason is that saponin solubilities are larger than those ofother compounds, such as saccharides. Therefore saponins can beextracted even when some other compounds are saturated in theextract. The extraction of saponin after the saturation of someother compounds leads to the increase of saponin content in drymatter.
3.4. Design space development and verification
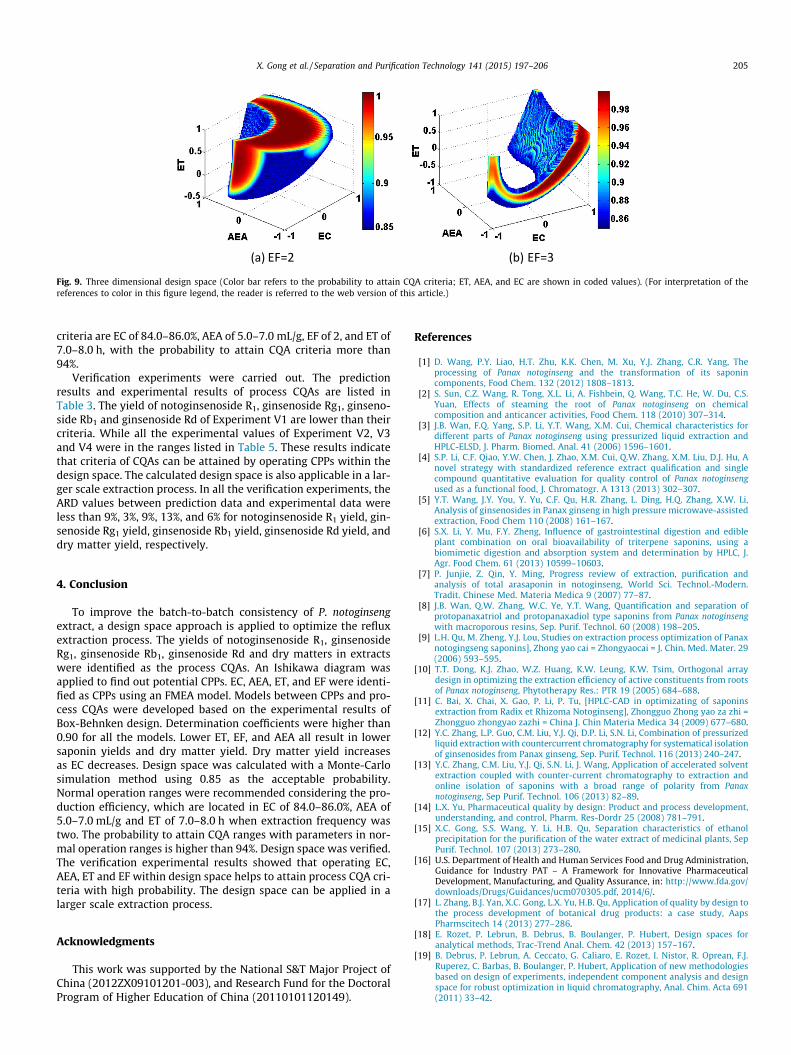
When extraction frequency is two or three, design space can beobtained, as seen in Fig. 9. Considering that higher extraction fre-quency results in higher time consumption, energy consumption,and solvent consumption, extraction frequency of two is preferred.Recommended normal operation region to attain process CQA
(b) AEA=5 mL/g, EF=2
(d) AEA=5 mL/g, EF=4
ginsenoside Rg1 content in dry matter.
(a) EF=2 (b) EF=3
Fig. 9. Three dimensional design space (Color bar refers to the probability to attain CQA criteria; ET, AEA, and EC are shown in coded values). (For interpretation of thereferences to color in this figure legend, the reader is referred to the web version of this article.)
X. Gong et al. / Separation and Purification Technology 141 (2015) 197–206 205
criteria are EC of 84.0–86.0%, AEA of 5.0–7.0 mL/g, EF of 2, and ET of7.0–8.0 h, with the probability to attain CQA criteria more than94%.
Verification experiments were carried out. The predictionresults and experimental results of process CQAs are listed inTable 3. The yield of notoginsenoside R1, ginsenoside Rg1, ginseno-side Rb1 and ginsenoside Rd of Experiment V1 are lower than theircriteria. While all the experimental values of Experiment V2, V3and V4 were in the ranges listed in Table 5. These results indicatethat criteria of CQAs can be attained by operating CPPs within thedesign space. The calculated design space is also applicable in a lar-ger scale extraction process. In all the verification experiments, theARD values between prediction data and experimental data wereless than 9%, 3%, 9%, 13%, and 6% for notoginsenoside R1 yield, gin-senoside Rg1 yield, ginsenoside Rb1 yield, ginsenoside Rd yield, anddry matter yield, respectively.
4. Conclusion
To improve the batch-to-batch consistency of P. notoginsengextract, a design space approach is applied to optimize the refluxextraction process. The yields of notoginsenoside R1, ginsenosideRg1, ginsenoside Rb1, ginsenoside Rd and dry matters in extractswere identified as the process CQAs. An Ishikawa diagram wasapplied to find out potential CPPs. EC, AEA, ET, and EF were identi-fied as CPPs using an FMEA model. Models between CPPs and pro-cess CQAs were developed based on the experimental results ofBox-Behnken design. Determination coefficients were higher than0.90 for all the models. Lower ET, EF, and AEA all result in lowersaponin yields and dry matter yield. Dry matter yield increasesas EC decreases. Design space was calculated with a Monte-Carlosimulation method using 0.85 as the acceptable probability.Normal operation ranges were recommended considering the pro-duction efficiency, which are located in EC of 84.0–86.0%, AEA of5.0–7.0 mL/g and ET of 7.0–8.0 h when extraction frequency wastwo. The probability to attain CQA ranges with parameters in nor-mal operation ranges is higher than 94%. Design space was verified.The verification experimental results showed that operating EC,AEA, ET and EF within design space helps to attain process CQA cri-teria with high probability. The design space can be applied in alarger scale extraction process.
Acknowledgments
This work was supported by the National S&T Major Project ofChina (2012ZX09101201-003), and Research Fund for the DoctoralProgram of Higher Education of China (20110101120149).
References
[1] D. Wang, P.Y. Liao, H.T. Zhu, K.K. Chen, M. Xu, Y.J. Zhang, C.R. Yang, Theprocessing of Panax notoginseng and the transformation of its saponincomponents, Food Chem. 132 (2012) 1808–1813.
[2] S. Sun, C.Z. Wang, R. Tong, X.L. Li, A. Fishbein, Q. Wang, T.C. He, W. Du, C.S.Yuan, Effects of steaming the root of Panax notoginseng on chemicalcomposition and anticancer activities, Food Chem. 118 (2010) 307–314.
[3] J.B. Wan, F.Q. Yang, S.P. Li, Y.T. Wang, X.M. Cui, Chemical characteristics fordifferent parts of Panax notoginseng using pressurized liquid extraction andHPLC-ELSD, J. Pharm. Biomed. Anal. 41 (2006) 1596–1601.
[4] S.P. Li, C.F. Qiao, Y.W. Chen, J. Zhao, X.M. Cui, Q.W. Zhang, X.M. Liu, D.J. Hu, Anovel strategy with standardized reference extract qualification and singlecompound quantitative evaluation for quality control of Panax notoginsengused as a functional food, J. Chromatogr. A 1313 (2013) 302–307.
[5] Y.T. Wang, J.Y. You, Y. Yu, C.F. Qu, H.R. Zhang, L. Ding, H.Q. Zhang, X.W. Li,Analysis of ginsenosides in Panax ginseng in high pressure microwave-assistedextraction, Food Chem 110 (2008) 161–167.
[6] S.X. Li, Y. Mu, F.Y. Zheng, Influence of gastrointestinal digestion and edibleplant combination on oral bioavailability of triterpene saponins, using abiomimetic digestion and absorption system and determination by HPLC, J.Agr. Food Chem. 61 (2013) 10599–10603.
[7] P. Junjie, Z. Qin, Y. Ming, Progress review of extraction, purification andanalysis of total arasaponin in notoginseng, World Sci. Technol.-Modern.Tradit. Chinese Med. Materia Medica 9 (2007) 77–87.
[8] J.B. Wan, Q.W. Zhang, W.C. Ye, Y.T. Wang, Quantification and separation ofprotopanaxatriol and protopanaxadiol type saponins from Panax notoginsengwith macroporous resins, Sep. Purif. Technol. 60 (2008) 198–205.
[9] L.H. Qu, M. Zheng, Y.J. Lou, Studies on extraction process optimization of Panaxnotogingseng saponins], Zhong yao cai = Zhongyaocai = J. Chin. Med. Mater. 29(2006) 593–595.
[10] T.T. Dong, K.J. Zhao, W.Z. Huang, K.W. Leung, K.W. Tsim, Orthogonal arraydesign in optimizing the extraction efficiency of active constituents from rootsof Panax notoginseng, Phytotherapy Res.: PTR 19 (2005) 684–688.
[11] C. Bai, X. Chai, X. Gao, P. Li, P. Tu, [HPLC-CAD in optimizating of saponinsextraction from Radix et Rhizoma Notoginseng], Zhongguo Zhong yao za zhi =Zhongguo zhongyao zazhi = China J. Chin Materia Medica 34 (2009) 677–680.
[12] Y.C. Zhang, L.P. Guo, C.M. Liu, Y.J. Qi, D.P. Li, S.N. Li, Combination of pressurizedliquid extraction with countercurrent chromatography for systematical isolationof ginsenosides from Panax ginseng, Sep. Purif. Technol. 116 (2013) 240–247.
[13] Y.C. Zhang, C.M. Liu, Y.J. Qi, S.N. Li, J. Wang, Application of accelerated solventextraction coupled with counter-current chromatography to extraction andonline isolation of saponins with a broad range of polarity from Panaxnotoginseng, Sep Purif. Technol. 106 (2013) 82–89.
[14] L.X. Yu, Pharmaceutical quality by design: Product and process development,understanding, and control, Pharm. Res-Dordr 25 (2008) 781–791.
[15] X.C. Gong, S.S. Wang, Y. Li, H.B. Qu, Separation characteristics of ethanolprecipitation for the purification of the water extract of medicinal plants, SepPurif. Technol. 107 (2013) 273–280.
[16] U.S. Department of Health and Human Services Food and Drug Administration,Guidance for Industry PAT – A Framework for Innovative PharmaceuticalDevelopment, Manufacturing, and Quality Assurance, in: http://www.fda.gov/downloads/Drugs/Guidances/ucm070305.pdf, 2014/6/.
[17] L. Zhang, B.J. Yan, X.C. Gong, L.X. Yu, H.B. Qu, Application of quality by design tothe process development of botanical drug products: a case study, AapsPharmscitech 14 (2013) 277–286.
[18] E. Rozet, P. Lebrun, B. Debrus, B. Boulanger, P. Hubert, Design spaces foranalytical methods, Trac-Trend Anal. Chem. 42 (2013) 157–167.
[19] B. Debrus, P. Lebrun, A. Ceccato, G. Caliaro, E. Rozet, I. Nistor, R. Oprean, F.J.Ruperez, C. Barbas, B. Boulanger, P. Hubert, Application of new methodologiesbased on design of experiments, independent component analysis and designspace for robust optimization in liquid chromatography, Anal. Chim. Acta 691(2011) 33–42.
206 X. Gong et al. / Separation and Purification Technology 141 (2015) 197–206
[20] J.J. Peterson, A Bayesian approach to the ICH Q8 definition of design space, J.Biopharm. Stat. 18 (2008) 959–975.
[21] I. Nistor, P. Lebrun, A. Ceccato, F. Lecomte, I. Slama, R. Oprean, E. Badarau, F.Dufour, K.S.S. Dossou, M. Fillet, J.F. Liegeois, P. Hubert, E. Rozet,Implementation of a design space approach for enantiomeric separations inpolar organic solvent chromatography, J. Pharm. Biomed. 74 (2013) 273–283.
[22] E. Rozet, P. Lebrun, B. Debrus, P. Hubert, New methodology for thedevelopment of chromatographic methods with bioanalytical application,Bioanalysis 4 (2012) 755–758.
[23] P. Lebrun, F. Krier, J. Mantanus, H. Grohganz, M.S. Yang, E. Rozet, B. Boulanger,B. Evrard, J. Rantanen, P. Hubert, Design space approach in the optimization ofthe spray-drying process, Eur. J. Pharm. Biopharm. 80 (2012) 226–234.
[24] X. Gong, Y. Li, Z. Guo, H. Qu, Control the effects caused by noise parameterfluctuations to improve pharmaceutical process robustness: a case study ofdesign space development for an ethanol precipitation process, Sep. Purif.Technol. 132 (2014) 126–137.
[25] X. Gong, H. Chen, T. Chen, H. Qu, Unit operation optimization for themanufacturing of botanical injections using a design space approach: a casestudy of water precipitation, PLoS ONE 9 (2014) e104493.
[26] X.C. Gong, A.Y. Yan, H.B. Qu, Optimization for the ethanol precipitation processof botanical injection: indicator selection and factor influences, Sep. Sci.Technol. 49 (2014) 619–626.
[27] D.M. Barends, M.T. Oldenhof, M.J. Vredenbregt, M.J. Nauta, Risk analysis ofanalytical validations by probabilistic modification of FMEA, J. Pharm. Biomed.Anal. 64–65 (2012) 82–86.
[28] H.R. Feili, N. Akar, H. Lotfizadeh, M. Bairampour, S. Nasiri, Risk analysis ofgeothermal power plants using Failure Modes and Effects Analysis (FMEA)technique, Energy Convers. Manage. 72 (2013) 69–76.
[29] S. Sun, L.W. Qi, G.J. Du, S.R. Mehendale, C.Z. Wang, C.S. Yuan, Red notoginseng:higher ginsenoside content and stronger anticancer potential than Asian andAmerican ginseng, Food Chem. 125 (2011) 1299–1305.
[30] W. Wu, Q. Qin, Y. Guo, J. Sun, S. Liu, Studies on the chemical transformation of20(S)-protopanaxatriol (PPT)-type ginsenosides R(e), R(g2), and R(f) usingrapid resolution liquid chromatography coupled with quadruple-time-of-flight mass spectrometry (RRLC-Q-TOF-MS), J. Agric. Food Chem. 60 (2012)10007–10014.
[31] G. Liu, Y. Liu, J. Ban, C. Zhang, Analysed the contents of sugar constituents inPanax notoginseng (Burk) F.H. Chen and rhizoma of Panax notoginseng (Burk)F.H. Chen, RENSHEN YANJ IU, 2005, pp. 34–36.
[32] G. Yang, N. Tao, C. Hong, X. Bo, K. Ling-yi, Determination of Monosaccharideand Disaccharide in Panax notoginseng by HPLC with SPE and ELSD, Chin. Med.J. Res. Prac. 26 (2012) 29–31.
[33] A. Bouchard, G.W. Hofland, G.J. Witkamp, Properties of sugar, polyol, andpolysaccharide water-ethanol solutions, J. Chem. Eng. Data 52 (2007) 1838–1842.
[34] X.C. Gong, C. Wang, L. Zhang, H.B. Qu, Solubility of xylose, mannose, maltosemonohydrate, and trehalose dihydrate in ethanol–water solutions, J. Chem.Eng. Data 57 (2012) 3264–3269.
[35] E.A. Macedo, A.M. Peres, Thermodynamics of ternary mixtures containingsugars. SLE of D-fructose in pure and mixed solvents. Comparison betweenmodified UNIQUAC and modified UNIFAC, Ind. Eng. Chem. Res. 40 (2001)4633–4640.
本文献由“学霸图书馆-文献云下载”收集自网络,仅供学习交流使用。
学霸图书馆(www.xuebalib.com)是一个“整合众多图书馆数据库资源,
提供一站式文献检索和下载服务”的24 小时在线不限IP
图书馆。
图书馆致力于便利、促进学习与科研,提供最强文献下载服务。
图书馆导航:
图书馆首页 文献云下载 图书馆入口 外文数据库大全 疑难文献辅助工具