Embed Size (px)
Citation preview

Application Note
Separation of 16 Cannabinoids in Cannabis Flower and Extracts Using a Reversed Phase Isocratic HPLC Method
Andrew J. Aubin, Catharine Layton, Shawn Helmueller
Waters Corporation
Abstract
This application note presents a simple isocratic separation of 16 cannabinoids that can be used for the
analysis of both plant material and concentrates to ensure the quality and safety of cannabis products.
Benefits
The Alliance HPLC System is a highly reliable and robust instrument that can be used for routine analysis of
cannabis and cannabis extracts.
Introduction
As the legalization of cannabis for both medicinal and recreational use continues to advance, the need for
simple and reliable analytical methods for the analysis of these products is desired by many industry
stakeholders (producers, regulators, and consumers). The cannabis plant (Cannabis sativa) is a complex
natural product that is known to produce at least 100 different cannabinoids.1 Traditionally, laboratories have
focused their analysis on five primary compounds: delta-9-tetrahydrocannabinol (d9-THC), delta-9-
tetrahydrocannabinolic acid (THC-A), cannabidiolic acid (CBD-A), cannabidiol (CBD), and cannabinol (CBN).
Recently, more attention has been paid to some of the other minor cannabinoids, particularly in the medicinal
market, which requires methods that are capable of higher resolution separations. Many of the minor
cannabinoids have shown some medicinal effects so it is important to have the ability to separate and
identify them. It is also desirable to have methods that minimize peak co-elutions of minor and major
cannabinoids and provide accurate quantitative results. Several industry standardization bodies are currently
developing harmonized methods for cannabinoid profiling to minimize the inherent variability in sampling,
extraction, and instrumental analysis with an aim to improve potency result accuracy. High Performance
Liquid Chromatography (HPLC) is the preferred methodology for potency determination (Total THC, Total
CBD, or THC/CBD ratio) as it can identify and measure the structurally similar cannabinoids and their
different forms (e.g. free form and corresponding acid forms of THC and CBD) in a single analysis. This
application note presents a simple isocratic separation of 16 cannabinoids that can be used for the analysis
of both plant material and concentrates to ensure the quality and safety of cannabis products.
Experimental
LC conditions
LC system: Alliance HPLC
Column: CORTECS Shield RP18 2.7 μm, 4.6 mm × 150 mm
(p/n: 186008685)
Analytical flow rate: 2.0 mL/min
Mobile phase A: Water with 0.1% TFA
Mobile phase B: Acetonitrile
Isocratic: 41:59 mobile phase A/mobile phase B
Oven temp.: 35 °C

Detector: 2998 PDA
Detection wavelength: 228 nm at 4.8 nm resolution
Injection volume: 5 μL
Software: Empower 3 CDS
Standard description
US DEA exempt reference standard solutions were obtained from Cerilliant Corporation, Round Rock, TX.
These pre-dissolved solutions have been previously shown to be suitable for the generation of calibration
curves2 when handled in an appropriate manner.3 Table 1 lists the cannabinoid standards used in this
application note.
Table 1. Cannabinoids used in the separation.
Standard preparation
Linearity of major cannabinoids d9-THC, THC-A, CBD, CBD-A, and CBN was determined for 10
concentrations between 0.004 mg/mL and 1.000 mg/mL, prepared via serial dilution in methanol using DEA
exempt standards.
Sample preparation
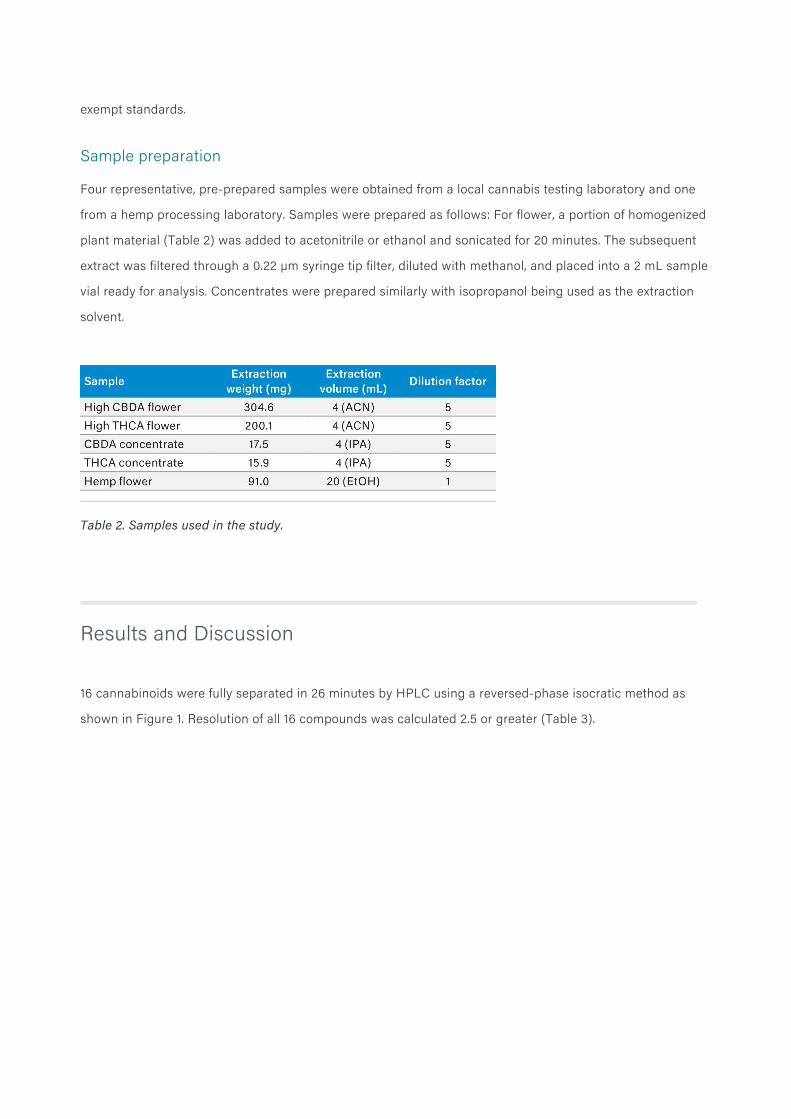
Four representative, pre-prepared samples were obtained from a local cannabis testing laboratory and one
from a hemp processing laboratory. Samples were prepared as follows: For flower, a portion of homogenized
plant material (Table 2) was added to acetonitrile or ethanol and sonicated for 20 minutes. The subsequent
extract was filtered through a 0.22 µm syringe tip filter, diluted with methanol, and placed into a 2 mL sample
vial ready for analysis. Concentrates were prepared similarly with isopropanol being used as the extraction
solvent.
Table 2. Samples used in the study.
Results and Discussion
16 cannabinoids were fully separated in 26 minutes by HPLC using a reversed-phase isocratic method as
shown in Figure 1. Resolution of all 16 compounds was calculated 2.5 or greater (Table 3).
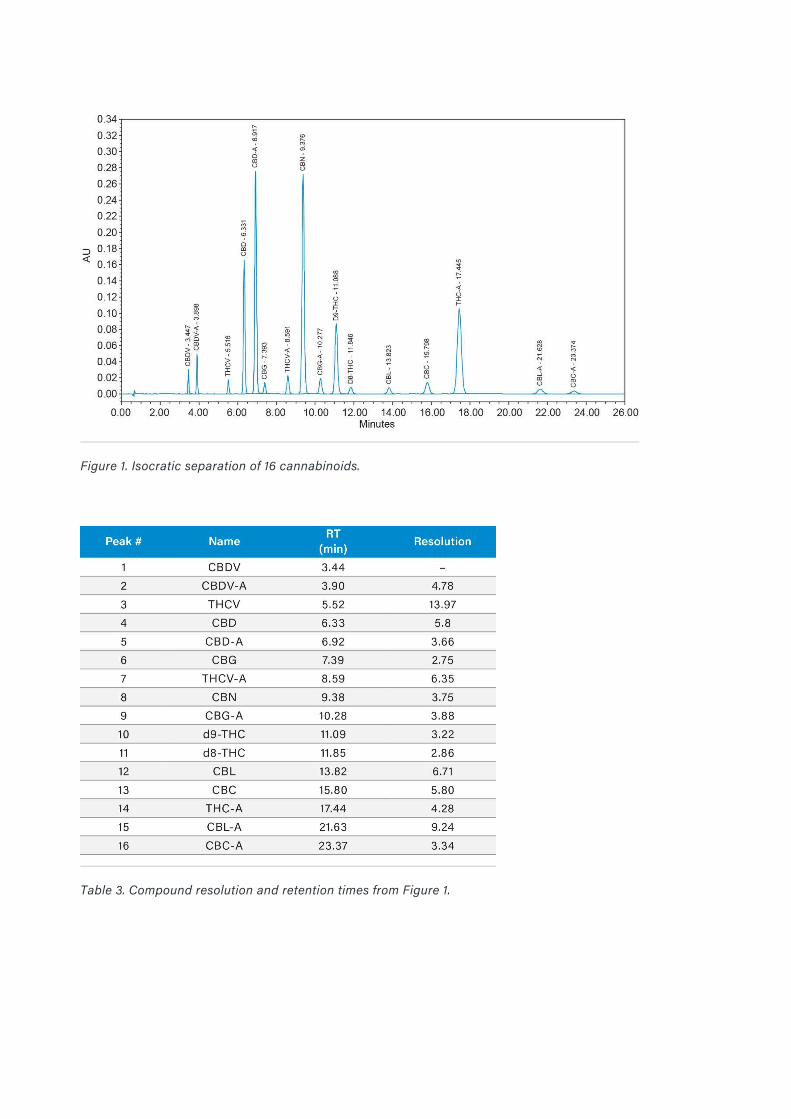
Figure 1. Isocratic separation of 16 cannabinoids.
Table 3. Compound resolution and retention times from Figure 1.

Table 4. Linear regression of five major cannabinoids (CBD, d9-THC,
CBD-A, THC-A, and CBN).
Figure 2. High CBD-A flower sample.

Figure 3. High THC-A flower sample.
Figure 4. High CBD-A concentrate sample.

Figure 5. High THC-A concentrate sample.
Figure 6. Hemp flower sample.
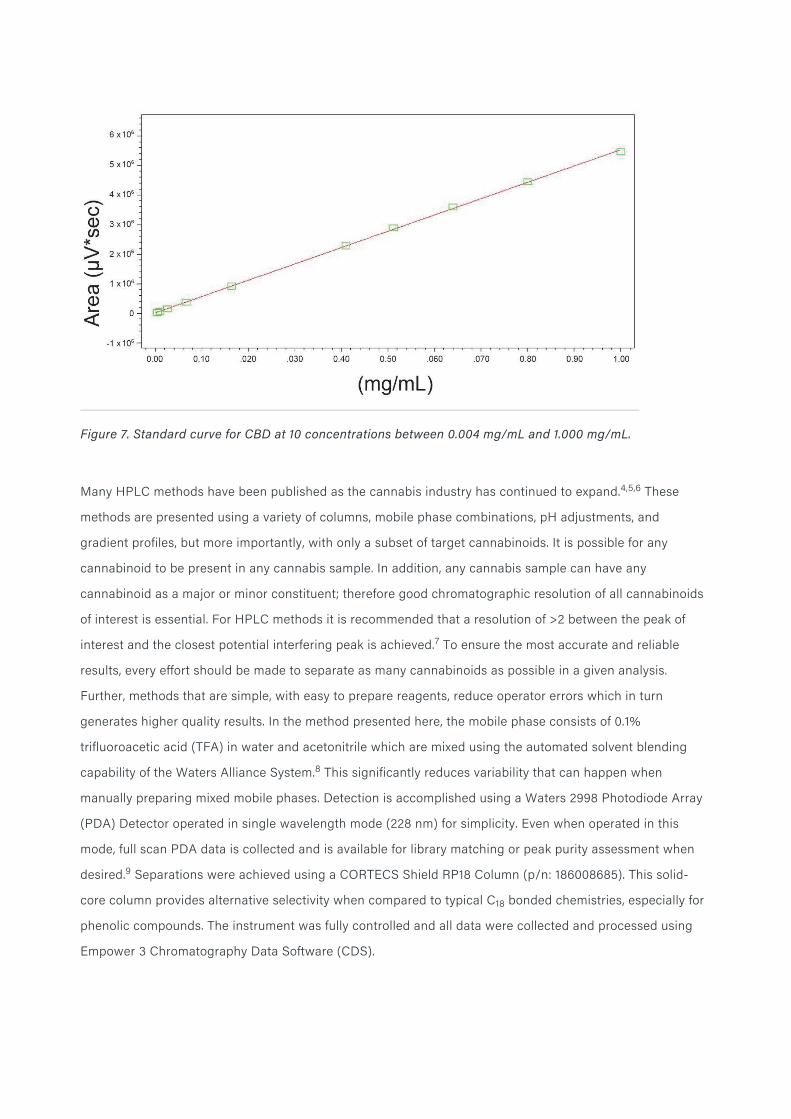
Figure 7. Standard curve for CBD at 10 concentrations between 0.004 mg/mL and 1.000 mg/mL.
Many HPLC methods have been published as the cannabis industry has continued to expand.4,5,6 These
methods are presented using a variety of columns, mobile phase combinations, pH adjustments, and
gradient profiles, but more importantly, with only a subset of target cannabinoids. It is possible for any
cannabinoid to be present in any cannabis sample. In addition, any cannabis sample can have any
cannabinoid as a major or minor constituent; therefore good chromatographic resolution of all cannabinoids
of interest is essential. For HPLC methods it is recommended that a resolution of >2 between the peak of
interest and the closest potential interfering peak is achieved.7 To ensure the most accurate and reliable
results, every effort should be made to separate as many cannabinoids as possible in a given analysis.
Further, methods that are simple, with easy to prepare reagents, reduce operator errors which in turn
generates higher quality results. In the method presented here, the mobile phase consists of 0.1%
trifluoroacetic acid (TFA) in water and acetonitrile which are mixed using the automated solvent blending
capability of the Waters Alliance System.8 This significantly reduces variability that can happen when
manually preparing mixed mobile phases. Detection is accomplished using a Waters 2998 Photodiode Array
(PDA) Detector operated in single wavelength mode (228 nm) for simplicity. Even when operated in this
mode, full scan PDA data is collected and is available for library matching or peak purity assessment when
desired.9 Separations were achieved using a CORTECS Shield RP18 Column (p/n: 186008685). This solid-
core column provides alternative selectivity when compared to typical C18 bonded chemistries, especially for
phenolic compounds. The instrument was fully controlled and all data were collected and processed using
Empower 3 Chromatography Data Software (CDS).

Table 5. Quantitative analysis results of representative samples presented as %dry
weight.
ND=Not Detected.
Table 6. Qualitative analysis results of representative samples. Green shading indicates found,
grey shading indicates not found.
Conclusion
The Alliance HPLC-UV System combined with the CORTECS Shield RP18 Column provided an isocratic
separation of 16 cannabinoids in less than 26 minutes.
■
All 16 compounds were separated with baseline resolution >2.5. ■
Linearity of the five major cannabinoids was shown at 10 concentration levels with R2 values >0.999. ■
This method was demonstrated on five samples representing the most cannabinoid containing sample
types. Cannabinoid amounts were generated for those samples.
■
References
MM Radwan, A S Wanas, S Chandra, M A ElSohly. Natural Cannabinoids of Cannabis and Methods of
Analysis. In: Chandra S, Lata H, ElSohly M (eds) Cannabis sativa L. Botany and Biotechnology. Springer,
Cham (2017).
1.
C E Layton, A J Aubin. Method Validation for Assay Determination of Cannabidiol Isolates. Journal of
Liquid Chromatography & Related Technologies. 41:3 (2018).
2.
C E Layton, A J Aubin. Considerations When Handling DEA-Exempt Cannabinoid Reference Standard
Preparations Used For Potency Determination. Presented at the 4th Annual Emerald Conference.
February 15–16, 2018 in San Diego, CA.
3.
R Upton. (Eds.) Cannabis inflorescence: Cannabis spp.; Standards of Identity, Analysis, and Quality
Control. American Herbal Pharmacopoeia, Scotts Valley CA (2014).
4.
B Patel, D Wene, Z T Fan. Qualitative and Quantitative Measurement of Cannabinoids in Cannabis using a
Modified HPLC/DAD Method. J Pharm Biomed Anal. Nov 30;146:15–23 (2017).
5.
Giese et al. Development and Validation of a Reliable and Robust Method for the Analysis of
Cannabinoids and Terpenes in Cannabis. Journal of AOAC International. 98:6 (2015).
6.
M E Swartz, I S Krull. Handbook of Analytical Validation. Boca Raton, FL: CRC Press (2012).7.
Automated Solvent Blending Enhances HPLC Performance. Waters Performance PerSPECtives no:
720000294EN. (2003).
8.
Waters 996 Photodiode Detector: Peak Purity I: What is Peak Purity Analysis? Waters Performance
PerSPECtives no: wpp16. (1996).
9.
Acknowledgments
The authors thank ProVerde Labs and Cattis LLC for the donation of the prepared samples.
Disclaimer
Waters does not support, encourage or promote the use of its products or services in connection with an
illegal use, cultivation, or trade of cannabis or cannabis products. Waters products are intended to be used
for cannabis related purposes only in compliance with all applicable laws in a manner that promotes public
safety and/or in connection with federally approved research, or state approved medical research.
Featured Products
Alliance HPLC System <https://www.waters.com/534293>
Empower 3 Chromatography Data Software (CDS) <https://www.waters.com/10190669>
2998 Photodiode Array (PDA) Detector <https://www.waters.com/1001362>
720006426, November 2018
©2019 Waters Corporation. All Rights Reserved.