Embed Size (px)
Citation preview

SEPARATION OF SUCCINIC ACID FROM FERMENTATION BROTHS AND
ESTERIFICATION BY A REACTIVE DISTILLATION METHOD
By
Alvaro Orjuela Londono
A DISSERTATION
Submitted to
Michigan State University
in partial fulfillment of the requirements
for the degree of
DOCTOR OF PHILOSOPHY
Chemical Engineering
2010

ABSTRACT
SEPARATION OF SUCCINIC ACID FROM FERMENTATION BROTHS AND
ESTERIFICATION BY A REACTIVE DISTILLATION METHOD
By
Alvaro Orjuela Londoño
Because of the scarcity of fossil resources, high crude oil prices, and the environmental
benefit of using renewable feedstock, fermentation technologies applied to the production of
chemicals have arisen as a feasible alternative to traditional processes. One of the most
promising commodities in the chemical industry is succinic acid, which currently has a market of
over $0.4 billion per year and the potential to increase up to $1.3 billion per year. Petrochemical
derived succinic acid has a lower production price ($1.05 to 1.29 US/Kg) compared with that
derived by fermentation ($1.66 to 2.2 US/Kg, sold at $5-9 US/Kg). Therefore, efforts must be
done to decrease processing costs in bio-based succinic acid production.
Owing to the majority of processing costs in fermentation are accounted for the
separation and purification of the desired product (50 - 80% of the final cost), many attempts to
improve and reduce separation steps have been made, but to date there is not a successful
technology scaled up to industrial production. Despite the fact that several separation processes
have been proposed to overcome this problem (precipitation, ion exchange resins, membranes,
reactive extraction, and liquid-liquid extraction), none addresses the main limiting barriers of
large energy and material requirements as well as waste generation.
One of the most promising alternatives is the direct conversion of succinic acid to esters
using hybrid reactors, mainly reactive distillation. This process has shown remarkable

advantages in similar applications (i.e. acetates production, ethyl lactate, fatty acids, etc.) by
reducing processing costs, and could provide esters as intermediate products for the synthesis of
other chemicals from succinic acid. Although this is a well understood technology, research
focused on the performance of the operation for succinic acid compounds must be conducted, in
order to create the tools required for design and scale up to large scale production.
In this work a recovery process of succinic acid through esterification with ethanol is
studied. Although it is particularly applied for succinic acid, this approach could be used for
other acids and alcohols.
In the first part an experimental study on phase equilibria of esterification mixtures and
reaction kinetics is presented.
In a second stage, succinic salts are recovered by precipitation and esterification using
synthetic and actual culture broth mixtures. Recovery of succinic species higher than 90% was
obtained.
In a next stage, experiments on esterification using a pilot plant reactive distillation
column proved that high conversion of succinic acid (> 98%) and high selectivity to diethyl
succinate (>98%) can be obtained. Simulations of reactive distillation unit using Aspen plus
process design software (Version 7.1, AspenTech) were validated using pilot scale experiments.
Good agreement of the model was observed.
Finally, using the model previously developed, a complete conceptual design of a process
for the recovery of succinic acid from a fermentation broth was developed in Aspen Plus
including a preliminary economic study. Results indicated that the process is feasible under
different conditions. Economic analysis indicates that the process is a feasible alternative to
compete with current technologies for succinic acid recovery.

iv
Dedicated to my beloved Angélica, my family, my dear friends and all the people who supported me in this effort. This work is the product of many hands and thoughts in collective construction.

v
ACKNOWLEDGMENTS
I would like to thank Dr. Dennis J. Miller and Dr. Carl T. Lira for their guidance as my
advisors through my Ph. D. studies. I am especially grateful for their unconditional support, trust
and friendship during all these years, and also for giving me the opportunity to work in their
group. I also wish to thank Dr. Martin Hawley, Dr. Kris Berglund and Dr. Chris Saffron for
serving on my committee. Special thanks to Dr. Lars Peereboom and Dr. Aspi Kolah without
whom this work would not have been possible. Thanks to my sister Andrea who gave me a hand
to reach the last step. I am also grateful with Michigan Biotechnology Institute (MBI) at MSU
and Working Bugs TM for providing fermentation samples.
I want to extent my appreciation for my group colleagues and future doctors Krishna Sai,
Abu Hassan and Xi Hong. Also I thank all undergraduate students for their assistance: Jonathan
Evans, Peter K. Rossman, Nathan Hanna, and especially to my friend Abraham J. Yanez.
I would like to express gratitude for financial and administrative support of my sponsors:
Fulbright Commission, the Colombian Administrative Department of Science, Technology and
Innovation (COLCIENCIAS), the Colombian National Planning Department (DNP), and
specially the National University of Colombia (Universidad Nacional de Colombia, Bogota).
Special thanks to all my family, friends, classmates, and all members of the Latin
American Community at MSU for their help, support, good moments and unconditional love.
Thanks to Cerati, Robi Draco, and Pearl Jam for providing the perfect sound track. Thanks also
to all staff members of the MSU Chemical Engineering Department. And finally, I want to thank
my beloved Angelica for supporting me at every moment, for having me in her thoughts and
prayers, for being my partner in this trip.

vi
PREFACE
Succinic acid (1,4-butanedioic acid), a four-carbon dicarboxylic acid, is recognized as a
potential bio-based substitute for petrochemical-derived maleic anhydride as a major commodity
for the synthesis of many chemicals of commercial interest. However, current prices of succinic
acid obtained by fermentation are higher than those achieved using the maleic anhydride
petrochemical pathway.
Several alternatives have been proposed to recover succinic acid form fermentation
media: extraction with amines and/or solvents, ion exchange, membrane separation, electro-
dialysis, adsorption with solids, precipitation and other techniques. None of them have overcome
major challenges associated with intensive energy and materials consumption and waste
generation.
Taking into account that succinic acid derivatives of commercial interest can also be
produced from succinate esters, this project presents a new recovery process that by-passes
succinic acid purification and produces succinate esters directly as major products. This novel
process comprises reactive extraction of succinate salts obtained from the broth by esterification
with ethanol (or other alcohol) followed by a reactive distillation unit to drive the reaction to
completion.
As outcomes of this study, several contributions have been made to the field of
downstream processing of products obtained by fermentation. Among them we can recognize:
• Development of a new recovery process for recovery of succinic acid by reactive
extraction and reactive distillation.

vii
• Experimental evaluation of vapor-liquid, liquid-liquid and solid-liquid equilibria data for
binary and ternary mixtures including succinate species.
• Generation of thermodynamic models to accurately describe phase equilibria required for
modeling of the recovery process.
• Development of complete activity-based and mole-fraction based kinetic models to
describe esterification of mixed succinic acid and acetic acid with ethanol using an ion
exchange resin as catalyst.
• Experimental evaluation and computational modeling of a pilot-plant scale reactive
distillation unit for esterification of mixed succinic acid and acetic acid with ethanol.
• Conceptual design and modeling of the complete recovery process including preliminary
economic evaluation.
This document is divided in four main sections which follow the path from conception to
economic evalutation. The major steps include measurement of the mixture properties and
reaction kinetics, development of a recovery scheme, preliminary process, evaluation in a pilot-
scale column, validation of the operation using process simulation and then economic
evalutation. Chapters 1 to 4 in Part 1 describe experimental evaluation of phase equilibria in
mixtures containing succinate species, and development of thermodynamic models to describe
non-idealities observed in reactive mixtures studied. Also in Part 1, Chapter 5 describes kinetic
models for esterification of mixed succinic acid and acetic acid with ethanol. All this
fundamental information is used in modeling developed in subsequent chapters.
Chapter 6 of Part 2 describes the novel recovery process developed to retrieve succinic
acid from fermentation broths by reactive extraction with ethanol.

viii
Chapters 7 and 8 of Part 3 describe experiments on a pilot plant scale reactive distillation
unit for esterification of mixed succinic and acetic acid with ethanol. Additionally, computational
models are developed and validated against experimental results using process design software
(Aspen Plus®
).
Finally chapter 9 included in Part 4 depicts the complete conceptual design of the process
including reactive extraction and reactive distillation stages, and a preliminary economic
evaluation of the technology is presented.

ix
TABLE OF CONTENTS
LIST OF TABLES....................................................................................................................... xiii LIST OF FIGURES ..................................................................................................................... xvi PART 1: PHASE EQUILIBRIA AND CHEMICAL KINETICS................................................ 24 1. Phase equilibria for reactive distillation of diethyl succinate. Part I. System diethyl succinate + ethanol + water .......................................................................................................................... 26
1.1 Summary................................................................................................................... 26 1.2 Introduction............................................................................................................... 26 1.3 Materials and methods .............................................................................................. 28 1.3.1 Materials ............................................................................................................... 28 1.4 Experimental procedures .......................................................................................... 28 1.4.1 Experimental procedures for LLE ........................................................................ 28 1.4.2 LLE Tie Lines ....................................................................................................... 28 1.4.3 Binodal Curve ....................................................................................................... 29 1.4.4 Experimental procedures for VLE ........................................................................ 29 1.5 Analysis..................................................................................................................... 30 1.6 Results and discussion .............................................................................................. 31 1.6.1 Experimental Results ............................................................................................ 31 1.6.2 Model Fitting ........................................................................................................ 34 1.7 Conclusions............................................................................................................... 41 1.8 REFERENCES ......................................................................................................... 43
2. Phase equilibria for reactive distillation of diethyl succinate. Part II. Systems diethyl succinate + ethyl acetate + water and diethyl succinate + acetic acid + water ............................. 47
2.1 Summary................................................................................................................... 47 2.2 Introduction............................................................................................................... 47 2.3 Material and methods................................................................................................ 49 2.3.1 Materials ............................................................................................................... 49 2.3.2 Experimental procedures ...................................................................................... 50 2.3.3 LLE Tie Lines ....................................................................................................... 50 2.3.4 LLE Binodal Curve............................................................................................... 51 2.3.5 VLE experiments .................................................................................................. 51 2.3.6 Analysis................................................................................................................. 52 2.4 Results and discussion .............................................................................................. 53 2.5 Conclusions............................................................................................................... 65 2.6 REFERENCES ......................................................................................................... 67
3. Phase equilibria in Binary Mixtures with Monoethyl Succinate .......................................... 71

x
3.1 Summary................................................................................................................... 71 3.2 Introduction............................................................................................................... 71 3.3 Material and methods................................................................................................ 73 3.3.1 Materials ............................................................................................................... 73 3.3.2 Experimental procedures ...................................................................................... 74
3.3.2.1 MES synthesis................................................................................................... 74 3.3.2.2 Vapor pressure measurement............................................................................ 75 3.3.2.3 Vapor-liquid experiment................................................................................... 75
3.3.3 Analysis................................................................................................................. 76 3.4 Results and discussion .............................................................................................. 78 3.5 Conclusions............................................................................................................... 88 3.6 REFERENCES ......................................................................................................... 90
4. Solubility and Phase Equilibria for Mixtures with Succinic Acid........................................ 93
4.1 Summary................................................................................................................... 93 4.2 Introduction............................................................................................................... 93 4.2.1 Model calculations using literature data ............................................................... 96 4.3 Material and methods.............................................................................................. 102 4.3.1 Materials ............................................................................................................. 102 4.3.2 Experimental procedures .................................................................................... 102
4.3.2.1 Solubility......................................................................................................... 102 4.3.2.2 Calorimetric analysis ...................................................................................... 103
4.4 Experimental Results .............................................................................................. 103 4.4.1 Calorimetric analysis .......................................................................................... 103 4.4.2 Solubility data and SLE modeling ...................................................................... 110 4.4.3 Final remarks ...................................................................................................... 116 4.5 Conclusions............................................................................................................. 116 4.6 REFERENCES ....................................................................................................... 119
5. Kinetics of mixed succinic acid/acetic acid esterification with Amberlyst 70 ion exchange resin as catalyst ........................................................................................................................... 123
5.1 Summary................................................................................................................. 123 5.2 Introduction............................................................................................................. 123 5.3 Material and methods.............................................................................................. 126 5.3.1 Materials ............................................................................................................. 126 5.3.2 Experimental procedures .................................................................................... 127
5.3.2.1 Catalyst conditioning ...................................................................................... 127 5.3.2.2 Batch kinetic experiments............................................................................... 128
5.3.3 Analysis............................................................................................................... 128 5.4 Results and discussion ............................................................................................ 129 5.4.1 Mass transfer considerations............................................................................... 132 5.4.2 Reaction equilibrium constants........................................................................... 136 5.4.3 Kinetic model...................................................................................................... 139 5.4.4 Kinetic constants................................................................................................. 143 5.4.5 Mixed acid esterification..................................................................................... 149 5.5 Supplementary material .......................................................................................... 151

xi
5.6 REFERENCES ....................................................................................................... 160 PART 2: RECOVERY OF SUCCINIC ACID FROM FERMENATION BROTHS ................ 164 6. A novel process for recovery of fermentation-derived succinic acid ................................. 165
6.1 Summary................................................................................................................. 165 6.2 Introduction............................................................................................................. 165 6.3 Description of Process ............................................................................................ 167 6.4 Material and methods.............................................................................................. 168 6.4.1 Materials ............................................................................................................. 168 6.4.2 Experimental procedures .................................................................................... 169
6.4.2.1 Solubility measurements................................................................................. 169 6.4.2.2 Conditioning of fermentation products........................................................... 170 6.4.2.3 Succinate recovery experiments ..................................................................... 171
6.4.3 Analysis............................................................................................................... 172 6.5 Results and discussion ............................................................................................ 173 6.5.1 Salts solubility..................................................................................................... 173 6.5.2 Demonstration of recovery method .................................................................... 175 6.5.3 Succinate recovery from fermentation products ................................................. 179 6.5.4 Process for succinate ester production direct from fermentation........................ 183 6.6 Conclusions............................................................................................................. 186 6.7 REFERENCES ....................................................................................................... 188
PART 3: REACTIVE DISTILLATION EXPERIMENTS AND SIMULATION..................... 193 7. Diethyl Succinate Synthesis by Reactive Distillation......................................................... 194
7.1 Summary................................................................................................................. 194 7.2 Introduction............................................................................................................. 194 7.3 Material and methods.............................................................................................. 196 7.3.1 Materials ............................................................................................................. 197 7.3.2 Analysis............................................................................................................... 197 7.3.3 Reactive distillation column description............................................................. 198 7.3.4 Reactive distillation column operation ............................................................... 201 7.4 Results and discussion ............................................................................................ 203 7.4.1 Reactive distillation experiments........................................................................ 203
7.4.1.1 Effect of reboiler power .................................................................................. 208 7.4.1.2 Effect of column pressure ............................................................................... 208 7.4.1.3 Effect of EtOH feed ........................................................................................ 209 7.4.1.4 Effect of reflux ratio........................................................................................ 209 7.4.1.5 Operation with pre-reactor.............................................................................. 209 7.4.1.6 Effect of inlet acid flow rates.......................................................................... 210 7.4.1.7 Effect of water in the feed............................................................................... 210
7.4.2 Simulation of RD experiments............................................................................ 211 7.4.2.1 Effect of reflux ratio in operation without pre-reactor.................................... 220

xii
7.4.2.2 Effect of splitting EtOH inlet flow.................................................................. 221 7.4.2.3 Effect of EtOH inlet flow at bottoms.............................................................. 223 7.4.2.4 Effect of reboiler power and reflux ratio using pre-reactor – column configuration ................................................................................................................... 224
7.5 Conclusions............................................................................................................. 227 7.6 REFERENCES ....................................................................................................... 230
8. Mixed Succinic Acid/Acetic Acid Esterification with Ethanol by Reactive Distillation ... 234
8.1 Summary................................................................................................................. 234 8.2 Introduction............................................................................................................. 234 8.3 Material and methods.............................................................................................. 238 8.3.1 Materials ............................................................................................................. 238 8.3.2 Analysis............................................................................................................... 238 8.3.3 Reactive distillation column description............................................................. 239 8.3.4 Reactive distillation column operation ............................................................... 242 8.4 Results and discussion ............................................................................................ 244 8.4.1 Reactive distillation experiments........................................................................ 244
8.4.1.1 Effect of reflux ratio........................................................................................ 249 8.4.1.2 Effect of column pressure ............................................................................... 250 8.4.1.3 Effect of EtOH feed ........................................................................................ 250 8.4.1.4 Operation with pre-reactor.............................................................................. 250 8.4.1.5 Effect of water in the feed............................................................................... 251
8.4.2 Simulation of RD experiments............................................................................ 251 8.4.2.1 Effect of EtOH feed from bottoms.................................................................. 259 8.4.2.2 Effect of acid feed tray location...................................................................... 261 8.4.2.3 Effect of boil-up rate and reflux ratio ............................................................. 262
8.5 Conclusions............................................................................................................. 264 8.6 REFERENCES ....................................................................................................... 267
PART 4: PROCESS CONCEPT AND PRELIMINARY ECONOMICS .................................. 271 9. A novel process for recovery of fermentation-derived succinic acid: Conceptual design and preliminary economics................................................................................................................ 272
9.1 Summary................................................................................................................. 272 9.2 Introduction............................................................................................................. 272 9.3 Conceptual design of the process............................................................................ 275 9.3.1 Process concept................................................................................................... 275 9.3.2 Process description.............................................................................................. 277 9.3.3 Process simulation .............................................................................................. 283 9.3.4 Preliminary economics of the process ................................................................ 285 9.4 Results and discussion ............................................................................................ 288 9.5 Conclusions............................................................................................................. 294 9.6 REFERENCES ....................................................................................................... 296

xiii
LIST OF TABLES
Table 1-1. Tie lines compositions for H2O + EtOH + DES in weight fractions. ......................... 31
Table 1-2. Binodal curve data for H2O + EtOH + DES in weight fractions. ............................... 32 Table 1-3. P-x data for EtOH + DES at 323.15 K. ....................................................................... 33
Table 1-4. T-x-y data for EtOH + H2O at 101.325 kPa. ............................................................... 34
Table 1-5. Binary parameter for UNIQUAC-HOC and NRTL-HOC models. For UNIQUAC, τij
= exp(aij + bij/T). For NRTL Gij = exp[αij (aij + bij/T)]. ............................................................ 36
Table 1-6. Predicted and reported [36] azeotropes in the system H2O + EtOH + DES at 101.23 kPa................................................................................................................................................. 41
Table 2-1. LLE tie line data for H2O + EtOAc + DES and H2O + AcOH + DES at 298.15 K. Compositions are in weight fraction. ............................................................................................ 53
Table 2-2. LLE binodal data for H2O + EtOAc + DES at 298.15 K. Compositions are in weight fraction. ......................................................................................................................................... 54 Table 2-3. P-x data for the binary systems EtOAc + DES at 313.15 K and AcOH + DES at 323.15 K........................................................................................................................................ 55 Table 2-4. T-x-y data for the system EtOAc + EtOH at 101.3 kPa............................................... 55
Table 2-5. Binary parameter for UNIQUAC-HOC and NRTL-HOC models. For UNIQUAC, τij
= exp(aij + bij/T). For NRTL, Gij = exp[αij (aij + bij/T)]. ............................................................ 57
Table 2-6. Predicted and reported [48] azeotropes in the system H2O + EtOH + DES at 101.23 kPa................................................................................................................................................. 64 Table 3-1. Experimental vapor pressure data for MES................................................................. 82 Table 3-2. P-x data for binary systems with MES. ....................................................................... 84
Table 3-3. Binary parameter for NRTL-HOC models. Gij = exp(-αij τij), τij = (bij/T)................ 87
xiv
Table 4-1. Properties of succinic acid........................................................................................... 98 Table 4-2. Thermophysical properties of SA and SAnh obtained by DSC. ............................... 110 Table 4-3. Solubility of succinic acid in different solvents (g SA/100 g solution). ................... 111 Table 4-4. Binary parameters for the NRTL model.................................................................... 116 Table 5-1. Typical product concentrations in SA fermentation [12]. ......................................... 124
Table 5-2. Physicochemical properties of Amberlyst 70® [17-20]. ........................................... 127
Table 5-3. Experimental conditions of batch reactions. ............................................................. 130 Table 5-4. Evaluation of mass transfer resistances using the Weisz-Prater criterion................. 134 Table 5-5. Parameters for pseudo-homogeneous kinetic models. .............................................. 145
Table 5-6. Binary parameters for NRTL model. Gij = exp(-αij τij), τij = (aij + bij/T). .............. 151 Table 5-7. Evaluation of intraparticle mass transport under experimental conditions and relative deviations of compositions calculated form regressed models and experimental data. Mole fraction (MF) and Activity (Act.) based kinetics........................................................................ 152 Table 6-1. Summary on patented processes for succinic acid recovery. .................................... 166 Table 6-2. Experimental conditions for acidification tests. ........................................................ 175 Table 6-3. Product yields during acidification reactions. ........................................................... 176 Table 6-4. Characterization of culture broth solids. ................................................................... 180 Table 6-5. Experimental conditions for acidification-esterification experiments on solids obtained from fermentation......................................................................................................... 180 Table 6-6. Results of acidification-esterification of solids obtained from fermentation. ........... 181 Table 7-1. Experimental conditions for continuous RD. Corresponding outlet compositions are summarized in Table 7-2 ............................................................................................................ 204 Table 7-2. Summary of outlet streams composition obtained in RD experiments. Corresponding flowrates are in Table 7-1. .......................................................................................................... 205 Table 7-3. Binary parameters for NRTL and HOC equations [38, 39]. ..................................... 212

xv
Table 7-4. Parameters for activity-based kinetics used in simulation of RD experiments. ........ 214 Table 7-5. Parameters used for simulation of RD system. ......................................................... 215 Table 7-6. Summary of results of simulation of RD experiments. ............................................. 217 Table 8-1. Characteristics of reactive distillate unit ................................................................... 240 Table 8-2. Experimental conditions for continuous RD at pilot plant scale............................... 245 Table 8-3. Summary of outlet streams composition obtained in RD experiments ..................... 246 Table 8-4. Parameters for activity-based kinetics used in simulation of RD experiments ......... 252 Table 8-5. Parameters used for simulation of RD system .......................................................... 253 Table 8-6. Summary of results obtained by simulation of RD experiments. Compositions are in Table 8-7 ..................................................................................................................................... 255 Table 8-7. Products concentration obtained by simulation of RD experiments. Conditions are in Table 8-6. .................................................................................................................................... 256 Table 9-1. Parameters in simulation of evaporation system....................................................... 284 Table 9-2. Parameters in simulation of reactive distillation unit ................................................ 285 Table 9-3. Parameters in simulation of distillation columns C-1, C-2 and C-3.......................... 285 Table 9-4. Parameter for economic analysis............................................................................... 286 Table 9-5. Parameters used in the estimation of the total capital investment............................. 287 Table 9-6. Parameters used in the estimation of the total operating costs .................................. 287 Table 9-7. Major units included in equipment cost evaluation................................................... 288 Table 9-8. Simulation results for a processing capacity of ~ 52 million kg/yr SA in a broth
containing 100 kg/m3 SA with and without AcOH. ................................................................... 290

xvi
LIST OF FIGURES
Figure 1-1 Othmer-Tobias plots for the H2O + EtOH + DES ternary system.............................. 33 Figure 1-2. Binary P-x diagram for the binary EtOH + DES at 323.15 K. (○) Experimental data, (–x–) UNIQUAC, (─) NRTL, (-) DAPP, (lines) Fitted models. DAPP are UNIQUAC parameters obtained by regression of UNIFAC predictions in Aspen. (For interpretation of this and all other color images, the reader is referred to the electronic version of this dissertation) ....................... 37
Figure 1-3. LLE data (mass basis) for H2O + EtOH + DES at 303.15 K. (●) Solubility data. (–▲–) Tie lines. (—) UNIQUAC (DAPP) from Aspen. (– ·· –) UNIQUAC-HOC. (---) NRTL-HOC. ............................................................................................................................................. 38
Figure 1-4. LLE data (mass basis) for H2O + EtOH + DES at 313.15 K. (●) Solubility data. (–▲–) Tie lines. (—) UNIQUAC (DAPP) from Aspen. (- ·· -) UNIQUAC-HOC. (---) NRTL-HOC........................................................................................................................................................ 39
Figure 1-5. Temperature dependence of mutual solubility for H2O + DES. (◊) Experimental data from Stephenson [28], (─) UNIQUAC, (--) NRTL. ..................................................................... 40
Figure 1-6. VLE for the binary H2O + EtOH at 101.325 kPa. (□) Jones in [30], (×) Paul [31], (-) Kurihara [32], (○) Arce [33], (∆) Iwakabe [34], (+) This work, (─) UNIQUAC-HOC, (- -) NRTL-HOC. ................................................................................................................................. 40
Figure 2-1. Othmer-Tobias plots for the H2O + EtOAc + DES and H2O + AcOH + DES ternary systems. (○) ternary with EtOAc, (∆) ternary with AcOH. .......................................................... 54 Figure 2-2. P-x diagram for the binary EtOAc + DES at 313.15 K. (●) Experimental data, (—) UNIQUAC – HOC, (- -) NRTL − HOC. ...................................................................................... 58 Figure 2-3. P-x diagram for the binary AcOH + DES at 323.15 K. (●) Experimental data, (—) UNIQUAC – HOC, (- -) NRTL − HOC. ...................................................................................... 58
Figure 2-4. LLE data (mass basis) for H2O + AcOH + DES at 298.15 K. (–∆–) Experimental tie lines, (●) Solubility data from [26], (–●–) Tie lines from [26], (– ·· –) UNIQUAC-HOC. (- -) NRTL-HOC. ................................................................................................................................. 59
Figure 2-5. LLE data (mass basis) for H2O + AcOH + DES at 298.15 K. (●) Experimental solubility data, (–∆–) Experimental tie lines, (– ·· –) UNIQUAC-HOC. (- -) NRTL-HOC. ........ 60

xvii
Figure 2-6. VLE for the binary H2O + EtOAc at 101.325 kPa. (∆) Reichl [39], (○) Lee [41], (×) Ellis data in [44], (●) Kato [47], (—) UNIQUAC-HOC. ............................................................. 61
Figure 2-7. VLLE for the binary H2O + EtOAc at different temperatures. (○) Liquid phase (×) Vapor phase, in Hong [38], (+) Stephenson [42], (∆) Sørensen [43], (—) Liquid phase (- -) Vapor phase, UNIQUAC-HOC. .............................................................................................................. 61
Figure 2-8. VLE for the binary H2O + AcOH. at 101.32 kPa. Data compiled in [44], (∆) Brown, (▲) Conti, (○) Chu, (●) Garner, (+) Garwin, (×) Ocon, (-) Sebastiani, (□) Calvar [37]. (―) UNIQUAC – HOC........................................................................................................................ 62 Figure 2-9. VLE for the binary EtOH + EtOAc. (□) Experimental data, (○) Calvar [37], (∆) Tu [40], (×) Kato [47], Data compiled in [44], (▲) Chu, (●) Griswold, (+) Furnas, (―) UNIQUAC – HOC. .......................................................................................................................................... 63 Figure 2-10. VLE for the binary EtOH + AcOH. (∆) Reichl [39], (×) Ruiz data in [45], (―) UNIQUAC – HOC........................................................................................................................ 64 Figure 3-1. Scheme of reactions in a mixed acid esterification process. ...................................... 72
Figure 3-2. 1H NMR (Upper) and
13C NMR (Lower) spectra for synthesized monoethyl
succinate. (Unlabeled peaks correspond to CDCl3 used as solvent). ........................................... 80
Figure 3-3. Calorimetric curve obtained by DSC of a MES sample measured under N2 atmosphere at 101.3 kPa. .............................................................................................................. 81 Figure 3-4.Vapor pressure data for MES. (○) Reported data [37, 38], (+) This work, (▬ ▬) ASPEN default, (▬) Regression with Antoine equation.............................................................. 83 Figure 3-5. Binary P-x diagram for the binary EtOAc + MES at 323.15 K. (●) Experimental data, (▬ ▬) UNIFAC, (▬) Regressed NRTL - HOC.......................................................................... 84 Figure 3-6. Binary P-x diagram for the binary AcOH + MES at 323.15 K. (●) Experimental data, (▬ ▬) UNIFAC, (▬) Regressed NRTL - HOC.......................................................................... 85
Figure 3-7. Binary P-x diagram for the binary H2O + MES at 323.15 K. (●) Experimental data, (▬ ▬) UNIFAC, (▬) Regressed NRTL - HOC.......................................................................... 85 Figure 3-8.Binary P-x diagram for the binary EtOH + MES at 313.15 K. (●) Experimental data, (▬ ▬) UNIFAC, (▬) Regressed NRTL - HOC.......................................................................... 86 Figure 4-1. Chemical network scheme for mixed acids recovery process by esterification......... 94

xviii
Figure 4-2. Temperature dependence of succinic acid activity in saturated solutions computed
from physicochemical properties. (●) - Equation 4-1, (∆) - Equation 4-1 without λPT term, (□) -
Equation 4-1 without CP integral terms, (×) - Equation 4-1 without λPT and CP integral terms. The inset figure shows the low concentration range................................................................... 100 Figure 4-3. Succinic acid activity coefficient in saturated aqueous solutions from reported
solubility data [8-11, 14]. (●) - Equation 4-1, (∆) - Equation 4-1 without λPT term, (□) - Equation
4-1 without CP integral terms, (×) - Equation 4-1 without λPT and CP integral terms. ............. 101 Figure 4-4. Calorimetric curves obtained by DSC at 10 K/min. Successive measurements at (a) 101.325 kPa and (b) 6892.8 kPa. (▬) - Cycle 1, (▬ ▬) - Cycle 2, (▬) - Cycle 3. The insert in figures shows thermal event at reported solid phase transition temperature in cycle 1.............. 105 Figure 4-5. Calorimetric curves obtained by DSC during heat capacity measurement under N2 atmosphere, temperature range 303.15 K – 493.15 K at 10 K/min. (a) 101.325 kPa; (b) 6892.8 kPa. (▬) - Reference aluminum pan, (▬) - Sapphire standard, (▬ ▬) - Succinic anhydride, (- -) - Succinic acid............................................................................................................................. 107 Figure 4-6. Heat capacity of succinic acid. (a) Solid phase, (▬) - This work at 101.325 kPa, (×) - Reported data [29], (▬) - Literature correlation [39], (▬ ▬) - Fitted correlation of experimental data for solid phase after lambda transition. (b) Liquid phase, (▬) - This work at 101.325 kPa, (○) - This work at 6892.8 kPa. (▬) - Literature correlation [39]. .............................................. 108 Figure 4-7. Heat capacity of succinic anhydride. (a) Solid phase, (b) Liquid phase. (▬) - This work at 101.325 kPa, (▬ ▬) - Fitted correlation of experimental data, (▬) - Literature correlation [39]............................................................................................................................ 109
Figure 4-8. Succinic acid solubility in H2O. (●) - Marshal [8],(×) - Davis [9], (∆) - Apelblat [10], (□) - Lin [11], (○) - Yu [14], (+) - This work, (▬) - NRTL model without integral terms, (▬ ▬) - NRTL model with integral terms............................................................................................. 111 Figure 4-9. Water activity (upper) and activity coefficient (lower) in succinic acid solutions at 298.15 K. (∆) - Na [42], (+) - Mohan [13], (○) - Peng [19], (▬ - ▬) - Electrolyte model [23], (- - -) - UNIFAC, (▬) - NRTL model without integral terms, (▬ ▬) - NRTL model with integral terms............................................................................................................................................ 113 Figure 4-10. Succinic acid solubility in EtOH: (●) - Mohan [13], (×) - Yu [14], (+) - This work, (▬) - NRTL model. Solubility in azeotropic EtOH: (□) - Benedict [15], (▬ ▬) - NRTL model...................................................................................................................................................... 114
Figure 4-11. Succinic acid solubility in H2O – EtOH solutions at 213.15 K (○) - Bancroft [12]. (▬) - NRTL model. .................................................................................................................... 114

xix
Figure 4-12. Succinic acid solubility in AcOH (×) - Yu [14]. (○) - Song [50], (▬) - NRTL model........................................................................................................................................... 115 Figure 4-13. Succinic acid solubility in DEE (∆ Washburn [16], □ This work), EtOAc (×) and DES (○). Lines calculated with NRTL model. ........................................................................... 115 Figure 5-1. Reactions: esterification of succinic acid (SA) to monoethyl succinate (MES) and diethyl succinate (DES); esterification of acetic acid (AcOH) to ethyl acetate (EtOAc); dehydration of EtOH to diethyl ether (DEE). ............................................................................. 125
Figure 5-2. Esterification of SA with EtOH over different particle sizes of Amberlyst 70: (●) - dP
< 150 µm; (□) - 250 µm < dP < 590 µm; (∆) - dP > 590 µm. Catalyst loading = 0.1 eq/kg solution; mole ratio EtOH:SA = 7.5:1; T = 353 K...................................................................... 135 Figure 5-3. Mole fraction (gray) and activity (black) based esterification equilibrium constants
from experimental data. a.) Succinic acid esterification: (●,●) - 1EQK : (+,+) - 2
EQK (Reported
values for mole fraction are 1ln 1.66EQK = and 2ln 0.182EQK = [21]) b.) Acetic acid
esterification: (▲, ▲) -this work; (◊) - Darlington [22]; (∆) - Hangx [26]; (□) - Tang [34]. .... 137 Figure 5-4. Rates of reaction under different catalyst loadings. a) SA esterification at T = 353 K,
EtOH:SA = 23:1. (●) - r1; (∆) - r2. b) (○) - AcOH esterification (r3) at T = 353 K, EtOH:AcOH
= 7.5:1; (▲) - EtOH etherification (r4) at T = 393 K. ................................................................ 140 Figure 5-5. Experimental and predicted mole fraction profiles of DEE formation. (○) - Run 1: T
= 363 K, wCAT = 0.08; (□) - Run 3: T = 388 K, wCAT = 0.081; (∆) - Run 4: T = 403 K, wCAT =
0.08; (●) - Run 5: T = 363 K, wCAT = 0.16; (▲) - Run 7: T = 388 K, wCAT = 0.16. (▬ ▬) Activity based model; (▬) Mole fraction model........................................................................ 144 Figure 5-6. Experimental and predicted mole fraction profiles in SA esterification. (∆) - SA; (○)
- DES; (□) - MES; (▲) - EtOH; (●) - H2O; (+) - DEE; (▬ ▬) - activity based model; (▬) -
mole fraction model. a) Run 33: T = 365 K, wCAT = 0.022, EtOH:SA = 7.49. b) Run 37: T = 343
K, wCAT = 0.011, EtOH:SA = 22.8. ........................................................................................... 146 Figure 5-7. Experimental and predicted mole fraction profiles in AcOH esterification. (▲) -
AcOH; (●) - EtOAc; (▲) - EtOH; (●) - H2O; (+) - DEE; (▬ ▬) - activity based model; (▬) -
mole fraction model. a) Run 61: T = 363 K, wCAT = 0.0208, Mole ratio EtOH:AcOH = 1.98. b)
Run 78: T = 383 K, wCAT = 0.0108, Mole ratio EtOH:AcOH = 4.29. ....................................... 147 Figure 5-8. Experimental and predicted mole fraction profiles in mixed SA/AcOH esterification.
(▲) - AcOH; (●) - EtOAc; (∆) - SA; (○) - DES; (□) - MES; (▲) - EtOH; (●) - H2O; (+) - DEE.

xx
(▬ ▬) - activity based model; (▬) - mole fraction model. a) Run 84: T = 363 K, wCAT = 0.011,
mole ratio EtOH:SA = 11.1 and SA:AcOH = 2.2. b) Run 86: T = 373 K, wCAT = 0.0125, Mole ratio EtOH:SA = 17.3 and SA:AcOH = 0.62.............................................................................. 150 Figure 5-9. Reported phase equilibria in mixtures with DEE and modeling using NRTL-HOC
(solid lines). a) vapor-liquid DEE-H2O at T = 308 K [42]. b) liquid-liquid DEE-H2O [43]. c) vapor-liquid DEE-AcOH at P = 51.9, P = 65 and P = 79.5 kPa [44]......................................... 154 Figure 5-10. a) vapor-liquid DEE-EtOAc at T = 273, T = 283 and T = 303 K [44]. b) vapor-liquid DEE-EtOH at T = 273, T = 283, T = 293, T = 298, T = 303, T = 313 and T = 323 K [45]......... 155
Figure 5-11. a) ternary diagram H2O-AcOH-DEE at T = 298 K (mole fraction basis) [42]. b)
ternary diagram H2O-EtOH-DEE at T = 298 K (mole fraction basis) [46]................................ 156 Figure 5-12. Experimental and predicted mole fraction profiles in SA esterification. (∆) - SA; (○)
- DES; (□) - MES; (▲) - EtOH; (●) - H2O; (+) - DEE; (▬ ▬) - activity based model; (▬) -
mole fraction model. a) Run 48: T = 353K, wCAT = 0.093, mole ratio EtOH/SA = 23.07:1. b)
Run 51: T = 383 K, wCAT = 0.092, mole ratio EtOH:SA = 23.07:1........................................... 157 Figure 5-13. Experimental and predicted mole fraction profiles in AcOH esterification. (▲) -
AcOH; (●) - EtOAc; (▲) - EtOH; (●) - H2O; (+) - DEE; (▬ ▬) - activity based model; (▬) -
mole fraction model. a) Run 65: T = 373 K, wCAT = 0.0199, mole ratio EtOH:AcOH = 1.97:1. b)
Run 69: T = 353 K, wCAT = 0.0408, mole ratio EtOH:AcOH = 1.94:1. .................................... 158 Figure 6-1. Experimental and reported solubilities of sodium salts in ethanol/water mixtures at
different temperatures. (+) - 298 K, (□) - 313 K, (▲) - 333 K. a) Na2Succ, this work; b) NaOAc,
this work; c) Na2SO4, reported by Vener [51]. .......................................................................... 174
Figure 6-2. Recovery of succinic species in liquid phase during acidification of Na2Succ•6H2O in EtOH at 303 K. (+) - SA, (□) - MES, (▲) - DES, (○) - Total succinate species. a)
Stoichiometric H2SO4 (Run 1); b) 20 % molar excess of H2SO4 (Run 2); c) 40 % molar excess
of H2SO4 (Run 3). ...................................................................................................................... 177
Figure 6-3. Recovery of succinic species in liquid phase during acidification of CaSucc•H2O in
EtOH at 303 K C in Run 4. Stoichiometric H2SO4. (+) - SA, (□) - MES, (▲) - DES, (○) - Total succinate species. ........................................................................................................................ 178 Figure 6-4. Recovery of succinate and acetate species in liquid phase during acidification of
solids from fermentation broth W-1 in EtOH at 303.15 K C and Stoichiometric H2SO4 (run 9).

xxi
(+) - SA, (□) - MES, (▲) - DES, (X) - AcOH, (●) – EtOAc, (○) - Total species. a) Succinate species; b) acetate species. .......................................................................................................... 182 Figure 6-5. Recovery of succinate species in liquid phase during acidification of solids from fermentation at bench scale. (+) - SA, (□) - MES, (▲) - DES, (○) - Total succinate species. a) run 21; b) run 22. ........................................................................................................................ 184 Figure 6-6. Proposed recovery process for succinic acid form fermentation broth by esterification with ethanol................................................................................................................................. 185 Figure 7-1. Esterification of succinic acid with ethanol. ............................................................ 195
Figure 7-2. Scheme of pilot plant RD column with internal catalytic packing Katapack-SP-11®
(middle zone) and BX®
structured packing (shaded zones). The brackets on the right indicate the approximate theoretical stages as described in the text. TI – Temperature indicator, S-P – Sampling port, LI – Level indicator, WI – Weight indicator, PI-Pressure indicator. ................. 199 Figure 7-3. Outlet flows and acid value profiles with time during approach to steady state in run 11A (left), 11B (middle) and 11C (right). (□) - Distillate flow, (○) – Bottoms flow, (▲) Acid value at the bottoms. ................................................................................................................... 206 Figure 7-4. Time evolution of composition in distillate and bottom product in run 11B during
approach to steady state. (○) - DES, (□) - MES, (∆) - SA, (●) - H2O, (▲) - EtOH, (+) - DEE. 207 Figure 7-5. Results obtained by simulation of run 11C. a) Global mass and component balance comparison with experimental data. b) Temperature and concentration profiles. Lines in column profiles represent results obtained by simulation. (○, ▬) - DES, (□, - -) - MES, (∆, - - ▬ - -) -
SA, (●, ▬ ▬) - H2O, (▲, ▬ ▬) - EtOH, (Χ, ▬) - DEE.......................................................... 219 Figure 7-6. Effect of reflux ratio under experimental conditions in run 9. (▬ ▬) - SA conversion, (▬) - Selectivity to DES, (Χ) - Power at the reboiler. ............................................ 221 Figure 7-7. Effect of splitting total EtOH inlet flow in run 11A between two inlet streams: pre-reacted acid feed steam at the top and pure EtOH stream at bottom. (▬) - SA conversion, (▬) - Selectivity to DES, (○) – Reboiler temperature.......................................................................... 222 Figure 7-8. Effect of EtOH inlet flow at bottoms operating with pre-reacted acid fed at the solubility limit of SA in EtOH. (▬) - SA conversion, (▬) - Selectivity to DES, (Χ) - Power at the reboiler. ................................................................................................................................. 223 Figure 7-9. Effect of boiling power under different reflux ratios (RR = 0, 1, 2, 4, 8, 12) using pre-reactor and acid feed at the solubility limit of SA in EtOH. a) (▬) - SA conversion, (▬) - Selectivity to DES; b) (▬) - DES composition at bottoms, (- -) - DES composition in distillate, (○) - Reboiler temperature. ......................................................................................................... 225

xxii
Figure 7-10. Effect of boiling power under different reflux ratios (RR = 0, 1, 2, 4, 8, 12) using pre-reactor and acid feed at the solubility limit of SA in EtOH. a) (▬) - SA conversion; b) (▬) - Selectivity to DES....................................................................................................................... 226 Figure 8-1. Reactions in mixed acids esterification process: esterification of succinic acid (SA) to monoethyl succinate (MES) and diethyl succinate (DES); esterification of acetic acid (AcOH) to ethyl acetate (EtOAc); dehydration of EtOH to diethyl ether (DEE). ........................................ 237
Figure 8-2. Scheme of pilot plant RD column with internal catalytic packing Katapack-SP-11®
(middle zone) and BX®
structured packing (doted zone). ......................................................... 241 Figure 8-3. Outlet flows and acid value profiles with time during approach to steady state in runs 14A (up to 1100 min) and 14B (after 1100 min). (□) - Distillate flow, (●) - Bottoms flow, (∆) - Acid value at the bottoms. .......................................................................................................... 244 Figure 8-4. Time evolution of composition in bottom and distillate products in run 14A during
approach to steady state. (○) - DES, (□) - MES, (∆) - SA, (▲) – AcOH, (●) – EtOAc, (●) - H2O, (▲) - EtOH, (+) - DEE. .............................................................................................................. 248 Figure 8-5. Comparison of profiles obtained by simulation (lines) and experimental data in run 13C. a) (○, ▬) - DES, (▲, ▬ ▬) – EtOH. b) (∆, - - ▬ - -) - SA, (□, - -) - MES, (▲, - ▬ -) -
AcOH, (●, - -) - EtOAc, (●, ▬ ▬) - H2O, (Χ, ▬) - DEE. c) Temperature profile. .................. 257 Figure 8-6. Comparison of profiles obtained by simulation (lines) and experimental data in run 14A. a) (○, ▬) - DES, (▲, ▬ ▬) - EtOH. b) (∆, - - ▬ - -) - SA, (▲, - ▬ -) - AcOH. c) (□, - -) -
MES, (●, - -) - EtOAc, (●, ▬ ▬) - H2O, (Χ, ▬) - DEE. d) Temperature profile. ................... 258 Figure 8-7. Effect of EtOH inlet flow at bottoms operating with pre-reacted mixed acids fed at the solubility limit of SA in EtOH. a) (▬) - SA conversion, (▬ ▬)- AcOH conversion, (▬) -
Selectivity to DES, (○) - Reboiler temperature. b) Concentrations at the reboiler, (●) - H2O, (▲) - EtOH......................................................................................................................................... 260 Figure 8-8. Effect of acid feed tray location operating with pre-reacted acid fed at the solubility limit of SA in EtOH. (▬) - SA conversion, (▬ ▬) - AcOH conversion, (▬) - Selectivity to DES, (○) - Reboiler temperature................................................................................................. 262 Figure 8-9. Effect of boil-up rate and reflux ratio using pre-reactor and acid feed at the solubility limit of SA in EtOH. a) SA conversion. b) Selectivity to DES. c) AcOH conversion. .............. 263 Figure 9-1. Reaction chemistry during reactive extraction of SA and AcOH with EtOH directly from sodium salts obtained by fermentation............................................................................... 275 Figure 9-2. Recovery process for succinic acid form fermentation broth by esterification with ethanol......................................................................................................................................... 277

xxiii
Figure 9-3. Process flow diagram for recovery of succinic acid from fermentation broths by esterification with ethanol using reactive extraction and reactive distillation. ........................... 279 Figure 9-4. Process flow diagram for recovery of ethyl acetate. ................................................ 280
Figure 9-5. Ternary diagram for the system EtOH-H2O-EtOAC at 101.3 kPa. ......................... 281
Figure 9-6. Ternary diagram for the system EtOH-H2O-EtOAc at 404.3 kPa........................... 282 Figure 9-7. Operating costs breakdown of in the recovery of SA from fermentation broths by esterification with EtOH. Facility processing ~ 52 million kg/yr SA in a broth containing 100
kg/m3 SA without AcOH............................................................................................................ 289
Figure 9-8. Evaluation of costs in the recovery of SA from fermentation broths by esterification with EtOH. (a) Direct costs. (b) Total capital investment. (c) Operating costs. SA concentration
in the broth: (●) - 50 kg/m3, (▲) - 70 kg/m
3, (□) - 100 kg/m
3. Fermentation broth with
(continuous lines) and without (dashed lines) AcOH. ................................................................ 292 Figure 9-9. Evaluation of selling price of DES at different SA processing capacities with a ROI
of 30 %. SA concentration in the broth: (●) - 50 kg/m3, (▲) - 70 kg/m
3, (□) - 100 kg/m
3.
Fermentation broth with (continuous lines) and without (dashed lines) AcOH. ........................ 293

24
PART 1: PHASE EQUILIBRIA AND CHEMICAL KINETICS

25
Included in this section is a copy of the paper: Phase equilibria for reactive distillation of
diethyl succinate. Part I. System diethyl succinate + ethanol + water, by A. Orjuela, A. J. Yanez,
D. T. Vu, D. Bernard-Brunel, D. J. Miller, C. T. Lira. Published in Fluid Phase Equilibria, 290
(1-2) (2010) 63-67.
The paper is reformatted and figures and tables are enlarged to fulfill edition requirements for
the dissertation document.

26
1. Phase equilibria for reactive distillation of diethyl succinate. Part I.
System diethyl succinate + ethanol + water
1.1 Summary
Liquid-liquid equilibrium data for the ternary system water-ethanol-diethyl succinate
were measured at 303.15 K and 313.15 K and atmospheric pressure. The reliability of the LLE
data was confirmed using the Othmer-Tobias correlation. P-x data for the vapor-liquid
equilibrium for the binary system ethanol-diethyl succinate at 323.15 K and ethanol + water at
101.3 kPa were also measured. Data were fitted using the modified UNIQUAC and NRTL
equations for the liquid phase and the Hayden-O’Connell (HOC) equation for the vapor phase.
The models agree reasonably well with the experimental data and can predict reported azeotropic
conditions. The NRTL-HOC is capable of fitting the LLE data better than the UNIQUAC-HOC.
1.2 Introduction
Processes to recover carboxylic acids from fermentation broths have been studied for
many years in order to reduce separation costs, which in general account for 50 - 80% of the
final cost of commercial chemical processes [1-3]. Amongst carboxylic acids available by
fermentation, succinic acid and its derivatives have enormous potential as commodities in the
chemical market [1-5]. Diethyl succinate (DES) is used as a solvent, as an additive in fragrance
formulation, as chemical intermediate and even as an additive for biodiesel and if produced
economically could be a future route to PBS polymers. Succinates and other dibasic esters can be
used as green solvents to extract carboxylic acids (i.e. acetic) even succinic acid from dilute

27
solutions [9-17]. DES is currently produced by direct esterification of the acid or anhydride with
ethanol. Several alternatives to recover succinic acid from dilute aqueous solutions have been
proposed, primarily solvent-amine extraction, salt precipitation, membrane separation and ion
exchange. Esterification of diluted solutions has gained attention because direct recovery and
production of derivatives is accomplished. However, esterification extend is limited by chemical
equilibrium, and product separation is required to drive the reaction forward.
Reactive distillation is an emerging technology with significant commercial potential for
a wide range of bio-based ester manufacturing [6-8]. Because reactive distillation integrates the
reaction and separation into a common process unit, significant thermodynamic data are needed
for process design, but the resulting process is significantly more economical than a conventional
reactor/separator system. Diethyl succinate exhibits a heteroazeotrope with water and thus
reliable thermodynamic models must be of representing both liquid-liquid equilibrium (LLE) and
vapor-liquid equilibrium (VLE). Published efforts to utilize generalized group contribution
methods are unreliable in predicting experimental data for DES systems [13, 14] justifying the
need for experimental measurements and correlation. The traditional approach of extending
binary measurements to multicomponent VLLE systems remains challenging. Quantitative
models of multicomponent mixtures predicted from fitted binary VLE data must be adjusted to
simultaneously represent multicomponent VLE and LLE [18-20]. In this study experimental LLE
data for the systems diethyl succinate + ethanol + water, and VLE data for the system diethyl
succinate + ethanol were obtained. These data, together with others reported in the open
literature were correlated with a modified UNIQUAC equation [18] and the NRTL equation [21]
using a regression tool included in Aspen Plus®
. A comparison with predictions using UNIFAC
[22, 23] is also shown.

28
1.3 Materials and methods
1.3.1 Materials
Diethyl succinate (DES, 99%, Sigma-Aldrich), ethanol (EtOH, 200 proof, Decon Labs),
water (H2O, HPLC grade, J.T. Baker), n-butanol (99.9%, Mallinckrodt), and acetonitrile (HPLC
grade, EMD). Traces of methyl red (Reagent grade, EM science) were used to enhance
observation of the liquid-liquid interface during LLE measurements. The stated chemical purities
of solvents were confirmed using gas chromatography and Karl-Fischer titration using Hydranal-
coulomat E solution (Riedel-de Haën). The only impurities detected were traces of water. The
chemicals were used without further purification for LLE. For VLE, the ethanol was dried using
CaCl2. For VLE, DES was purified by vacuum distillation. Only 85-90 % of the pre-distilled
volume was used for the experiments, discarding the first overhead fraction (5-10 %) and the
reboiler residue (5 %).
1.4 Experimental procedures
1.4.1 Experimental procedures for LLE
LLE data for ternary mixtures were determined on a mass basis, using glass vials (10
cm3) stirred with magnetic bar. These vials were placed in an isothermal bath equipped with a
circulator pump and temperature control (Isotemp immersion circulator 730, Fisher Scientific, ±
0.1 K). The temperature was measured with an ASTM certified glass thermometer (model 64 C,
± 0.1 K). The total mass for all the experiments was about 10g. Experiments were performed to
measure the tie lines and separate experiments were performed to locate a wider range of binodal
points.
1.4.2 LLE Tie Lines

29
Equilibrium tie lines were obtained by preparing ternary mixtures of known overall
composition within in the two phase region. The liquid mixtures were stirred at constant
temperature for 12 h. After equilibration the vial was centrifuged for 20 minutes at 4000 rpm and
returned to the isothermal bath for 12 more hours without stirring. The bottom phase was
removed with a syringe and the weight of every phase was recorded. After analysis, the
recovered masses were compared to the initial masses and the difference was less than 1%
(mass) for all the experiments. Both phases were analyzed for each experiment. The H2O +
EtOH + DES system was measured at 303.15 K and 313.15 K (± 0.1 K).
1.4.3 Binodal Curve
The binodal envelope was measured at 303.15 K and 313.15 K (± 0.1 K) to confirm the
tie line measurements. Fixed amounts of binary mixtures of H2O + DES and EtOH + H2O were
prepared gravimetrically using an analytical balance (Sartorius R 300 S, ± 0.1 mg). Weighted
amounts of EtOH or DES were added in stages to each binary mixture using a syringe (0.1 cm3).
After every addition the mixture was stirred for 10 minutes and checked for the phase boundary.
In order to enhance visual observation of the two phases, traces of methyl red were added to the
mixture. The organic phase preferentially dissolves methyl red causing the ester-rich phase to
have an orange color and the aqueous phase remained colorless or slightly red. Accuracy of this
method to measure binodal lines within 1% (mass) was reported in a previous work [24].
1.4.4 Experimental procedures for VLE
P-x experiments were carried out using the apparatus and analytical methods described in
detail by Vu et al. [25, 26]. The equilibrium pressure was measured using a Baratron®
model

30
PDR 2000 (MKS instruments). To assure degassing, after the initial pressure stabilized, the
pressure was lowered to approximately half the equilibrium pressure and the vacuum valve was
closed and the equilibrium pressure re-stabilized. Following re-equilibration, variations in
pressure of ± 0.2 kPa in between repetitions were considered acceptable. Reported pressure is an
average of three measurements obtained for every composition. Isothermal VLE of the DES-
EtOH were measured at 323.15 K (± 0.05 K).
T-x-y data for the binary EtOH + H2O were measured in a recirculating apparatus
(Fischer America VLE 100D, Inc.). Temperature measurements were within ± 0.05K and
pressure control was within ± 0.1 kPa. Though data for this system are plentiful, this system was
measured to validate the apparatus and methods which will be used in subsequent studies.
1.5 Analysis
Samples from VLE experiments on the systems DES + EtOH and EtOH + H2O were
analyzed as described in [25]. LLE samples were analyzed using a gas chromatograph (HP 5890
series II), equipped with a thermal conductivity detector, n-butanol was used as internal standard
and acetonitrile as solvent. A 15 m long Alltech EC-WAX column (0.53 mm i.d., 1.20 µm Film
thickness) was used with a temperature programmed analysis: Column initial temperature 313.15
K (3 min), ramp rate 30 K/min, final temperature 523.15 K (0.5 min). The injection port was
maintained at 543.15 K in a splitless mode. Detector temperature was 523.15 K. Helium was
used as carrier (0.25 cm3/s) and volume injections of 5×10
-4 cm
3 were used. Samples of known
composition in the range of interest were used for calibration, and injected by triplicate to obtain
repeatability within 0.5% by mass. Data integration was done using a Peaksimple

31
Chromatography Data System (SRI Model 302) with Peaksimple software version 3.59. Karl-
Fisher analysis (Aquacount coulometric titrator AQ-2100) was used to measure and confirm
water content in reagents and samples.
1.6 Results and discussion
1.6.1 Experimental Results
LLE experimental data for the system H2O + EtOH + DES are listed in Table 1-1 (tie
lines) and Table 1-2 (binodal curve) where wi represents mass fraction of each component. These
data agree well with data trends reported at 297 K [24].
Table 1-1. Tie lines compositions for H2O + EtOH + DES in weight fractions.
Aqueous Phase (Aq.) Organic Phase (Org.)
T (K) w EtOH w H2O w DES w EtOH w H2O w DES
0.145 0.822 0.033 0.051 0.044 0.905
0.202 0.749 0.049 0.089 0.071 0.840
0.236 0.693 0.071 0.144 0.098 0.758
0.260 0.641 0.099 0.161 0.134 0.705
0.281 0.587 0.132 0.197 0.157 0.646
303.15
0.280 0.580 0.140 0.212 0.171 0.617
0.031 0.950 0.019 0.021 0.032 0.947
0.060 0.894 0.046 0.051 0.049 0.900
0.128 0.837 0.035 0.096 0.076 0.828 313.15
0.184 0.758 0.058 0.119 0.104 0.777

32
As expected, the area of phase splitting is reduced as temperature and ethanol
concentration increase. The consistency of LLE data was checked with the Othmer-Tobias
method [27] as shown in Figure 1-1, and a linear relation was obtained at both temperatures. P-x
data for the binary EtOH + DES are listed in Table 1-3. Previously [25] the lab was able to
measure the vapor composition in the static apparatus. However, due to the low volatility of DES
the vapor sampling was not used in this work.
Table 1-2. Binodal curve data for H2O + EtOH + DES in weight fractions.
T = 303.15 K T = 313.15 K
w EtOH w H2O w DES w EtOH w H2O w DES
0.081 0.049 0.870 0.145 0.090 0.765
0.156 0.096 0.748 0.193 0.135 0.672
0.204 0.145 0.651 0.210 0.159 0.631
0.234 0.196 0.570 0.242 0.229 0.529
0.257 0.245 0.498 0.261 0.294 0.445
0.295 0.435 0.270 0.274 0.364 0.362
0.289 0.579 0.132 0.278 0.570 0.152
0.272 0.643 0.085 0.256 0.639 0.105
0.237 0.712 0.051 0.222 0.707 0.071
0.228 0.718 0.054 0.167 0.792 0.041
0.218 0.739 0.043 0.047 0.930 0.023
0.220 0.740 0.040 0.000 0.979 0.021
0.203 0.758 0.039
0.14 0.833 0.027
0.051 0.926 0.023
0.045 0.934 0.021

33
Figure 1-1 Othmer-Tobias plots for the H2O + EtOH + DES ternary system.
The EtOH:DES relative volatility was too large to collect data for this system using the
recirculating Fischer T-x-y apparatus. However, T-x-y data for the binary EtOH + H2O system
collected on the Fischer apparatus listed in Table 1-4 agree with literature [30-34].
Table 1-3. P-x data for EtOH + DES at 323.15 K.
P
(kPa) xEtOH P
(kPa) xEtOH P
(kPa) xEtOH P
(kPa) xEtOH
0.07 0.000 8.19 0.150 17.83 0.423 27.00 0.851 3.04 0.045 9.68 0.192 20.40 0.516 28.06 0.903 4.11 0.065 12.88 0.276 22.93 0.624 28.20 0.911 5.11 0.084 12.97 0.284 24.33 0.704 29.53 1.000 6.84 0.118 15.03 0.331 25.46 0.769
-3.5
-2.5
-1.5
-0.5
-3.5 -2.5 -1.5 -0.5
ln [ (1 - w H2O) / w H2O ] Aq.
ln [
(1
- w
DE
S)
/ w
DE
S ]
O
rg.
303.15 K
313.15 K

34
Table 1-4. T-x-y data for EtOH + H2O at 101.325 kPa.
T (K) xEtOH yEtOH T (K) xEtOH yEtOH
373.15 0.001 0.005 354.65 0.326 0.605
371.75 0.006 0.072 353.35 0.463 0.652
369.65 0.014 0.154 352.65 0.541 0.675
367.35 0.0234 0.230 351.75 0.686 0.745
365.65 0.031 0.285 351.55 0.776 0.801
363.45 0.049 0.356 351.35 0.840 0.846
361.45 0.065 0.418 351.45 0.904 0.901
359.55 0.097 0.453 351.55 0.972 0.972
357.55 0.139 0.531 351.65 0.980 0.977
1.6.2 Model Fitting
In order to develop comprehensive models for the reactive distillation process, the mutual
solubility data of the binary H2O + DES reported by Stephenson [28] were included in the
parameter estimation. The formats of the model equations and parameter arguments correspond
to those implemented in ASPEN PLUS®
(Aspen) [29]. Vapor pressures of the pure components
were evaluated using extended Antoine equation [29] with default Aspen Plus parameters
(DAPP). Calculated data were consistent with vapor pressure and boiling point for the
components reported in literature.
To represent LLE data using the UNIQUAC equation, the modified UNIQUAC equation
is used. For the residual activity coefficient contribution, the molecular surface parameter q’ for

35
H2O and EtOH is implemented as suggested by Anderson [18, 19] and the values were taken
from that work. For DES q’ was not modified. Values for surface area q and the molecular
volume r were taken from the DAPP as calculated by the van der Waals data. Experimental data
to correlate the binary EtOH + H2O were obtained from T-x-y experiment and from literature.
For application of the NRTL equation, only binary parameters for H2O + DES and EtOH + DES
were evaluated. Binary parameters for EtOH + H2O were taken from literature [35].
The Hayden-O’Connell (HOC) equation was used to model the vapor phase and the
association parameters for H2O + EtOH were taken from DAPP. HOC parameters for H2O +
DES, EtOH + DES, DES + DES are not available in the open literature, and they were assumed
equal to those existing for interactions with ethyl acetate from the same database.
The parameter fitting was performed with the regression tool in Aspen by minimization
of the maximum likelihood objective function (a modified least-squares method of the
differences between experimental and estimated data). A list of the UNIQUAC and NRTL
parameters is presented in Table 1-5.
For comparison purposes, VLE and LLE data obtained with UNIQUAC parameters from
Aspen database using the q’ = q default method are also presented in the figures. In this case,
DAPP for H2O-EtOH are available but those for EtOH + DES and H2O + DES are missing and
were predicted using the UNIFAC method.
VLE correlations are presented in Figure 1-2. Both, UNIQUAC and NRTL predictions
agree with the experimental data. The DAPP for UNIQUAC equation and those regressed with
UNIFAC represent the VLE data very well.

36
Table 1-5. Binary parameter for UNIQUAC-HOC and NRTL-HOC models. For
UNIQUAC, ττττij = exp(aij + bij/T). For NRTL Gij = exp[ααααij (aij + bij/T)].
HOC Association Parameters
H2O EtOH DES
H2O 1.7 1.55 1.3 EtOH 1.55 1.4 1.3 DES 1.3 1.3 0.53
UNIQUAC NRTL
H2O H2O EtOH H2O H2O EtOH
EtOH DES DES EtOH DES DES
aij -2.39138 0 0 aij 0.514285 4.384591 0
aji 1.794768 0 0 aji 0.806535 -1.580000 0
bij 447.8363 25.73932 113.6074 bij 444.8857 184.7326 653.8819
bji -573.038 -591.152 -503.063 bji -266.533 1136.555 -158.856 ααααij 0.4 0.36842 0.3 H2O EtOH DES r 0.92 2.10547 6.4733 q 1.4 1.972 5.616
q’ 1 0.92 5.616
In the case of the LLE showed in Figures 1-3 and 1-4, UNIQUAC and NRTL models
agree well with the experimental data at low concentrations of ethanol, but they do not fit the
plait point region. Attempts to further improve the fits were unsuccessful because a simultaneous
good representation of the plait point, the solubility envelope and the VLE data was not possible.
Attempts to fit the plait point better required unrealistic adjustment of the DES + water binary
solubilities and thus are not presented. Nonetheless, experimental tie lines are reasonably well
predicted with regressed models sufficiently to warn during process design if liquid-liquid
immiscibility may occur.

37
Figure 1-2. Binary P-x diagram for the binary EtOH + DES at 323.15 K. (○) Experimental data, (–x–) UNIQUAC, (─) NRTL, (-) DAPP, (lines) Fitted models. DAPP are UNIQUAC parameters obtained by regression of UNIFAC predictions in Aspen. (For interpretation of this and all other color images, the reader is referred to the electronic version of this dissertation)
The αij parameter in the NRTL equation is generally assumed 0.2 for immiscible liquids.
For the systems studied here, it was not possible to obtain satisfactory agreement with the
experimental data using this parameter value for the binary H2O + DES, so it was regressed as
well. The NRTL model with an additional parameter provides a better agreement with
experimental data for higher concentrations of DES (near DES vertex) and so for the mutual
solubility of H2O + DES as shown in Figure 1-5. Regressed UNIQUAC parameters provide an
acceptable representation of the LLE and excellent agreement for VLE for the binary EtOH +
H2O presented in Figure 1-6. Predicted azeotropic conditions and boiling points are listed in
0
10
20
30
0 0.2 0.4 0.6 0.8 1x DES
P
(kP
a)

38
Table 1-6, and those are consistent with reported data [36] for the binaries DES + H2O, and
EtOH + H2O.
.
Figure 1-3. LLE data (mass basis) for H2O + EtOH + DES at 303.15 K. (●) Solubility data. (–▲–) Tie lines. (—) UNIQUAC (DAPP) from Aspen. (– ·· –) UNIQUAC-HOC. (---) NRTL-HOC.

39
Figure 1-4. LLE data (mass basis) for H2O + EtOH + DES at 313.15 K. (●) Solubility data. (–▲–) Tie lines. (—) UNIQUAC (DAPP) from Aspen. (- ·· -) UNIQUAC-HOC. (---) NRTL-HOC.

40
Figure 1-5. Temperature dependence of mutual solubility for H2O + DES. (◊) Experimental data from Stephenson [28], (─) UNIQUAC, (--) NRTL.
Figure 1-6. VLE for the binary H2O + EtOH at 101.325 kPa. (□) Jones in [30], (×) Paul [31], (-) Kurihara [32], (○) Arce [33], (∆) Iwakabe [34], (+) This work, (─) UNIQUAC-HOC, (- -) NRTL-HOC.
350
358
366
374
0 0.2 0.4 0.6 0.8 1
x EtOH
T
(K)
270
295
320
345
370
0 0.2 0.4 0.6 0.8 1w DES
T
(K)

41
Table 1-6. Predicted and reported [36] azeotropes in the system H2O + EtOH + DES at
101.23 kPa.
xH2O xEtOH xDES T (K)
0.0963 0.9037 0 351.32 Reported Azeotropes
0.9899 0 0.0101 373.05
0.1134 0.8866 0 351.26 UNIQUAC - HOC 0.9895 0 0.0105 372.96
0.0984 0.9016 0 351.33
NRTL - HOC 0.9873 0 0.0127 372.88
1.7 Conclusions
The LLE data for the ternary system H2O + EtOH + DES at 303.15 K and 313.15 K are
reported. P-x data for the binary EtOH + DES at 323.15 K are also presented. Binary parameters
for UNIQUAC-HOC and NRTL-HOC equations were obtained by regression. The two models
are able to reproduce reasonably well P-x data and the azeotropic points for the system. NRTL
fits better than UNIQUAC binary and ternary LLE data, but both fail near the plait point.
Nevertheless predictions with regressed models are more accurate than those using predicted
parameters with UNIFAC. The parameters obtained in this work will represent the VLE
reasonably well for reactive distillation design purposes while simultaneously indicating when
two liquid phases may exist. Taking into account the limited solubility of succinic acid in EtOH
(40-45% by weight at 353 K), a reactive distillation system to produce DES will work best with
excess EtOH present. In this condition, the data show that there will be only one liquid phase.

42
REFERENCES

43
1.8 REFERENCES
[1] A. Cukalovic, C. V. Stevens. Biofuels, Bioprod. Biorefin. 2 (2008) 505–529. [2] B. Hermann, M. Patel. Appl. Biochem. Biotechnol. 136 (2007) 361–388. [3] O. Wolf, M. Crank, M. Patel, F. Marscheider-Weidemann, J. Schleich, B. Hüsing, G.
Angerer. Techno-economic feasibility of large-scale production of Bio-based polymers in Europe, European Science and Technology Observatory, EUR 22103 EN. (2005).
[4] T. Werpy, G. Petersen. Top Value Added Chemicals from Biomass. Volume I–Results of
Screening for Potential Candidates from Sugars and Synthesis Gas. PNNL-NREL. (2004) [Online]. Available: http://www1.eere.energy.gov/biomass/p dfs/35523.pdf [2008, April 7].
[5] J. Zeikus, M. Jain, P. Elankovan. Appl. Microbiol Biotechnol. 51 (1999) 545–552. [6] D. Miller, N. Asthana, A. Kolah, D. Vu, C. Lira. Process for reactive esterification
distillation. (2006) US Patent 20060252956. [7] D. Sutton, G. Reed, G. Hiles. Process for the production of esters of mono-, di or
polycarboxylic acids. (2007) US Patent 5599976. [8] A. Kolah, N. Asthana, D. Vu, C. Lira, D. Miller. Ind. Eng. Chem. Res. 47 (2008) 5313–
5317. [9] S. Çehreli, D. Özmen, B. Tatli. J. Chem. Thermodyn. 37 (2005) 1144–115. [10] S. Hung, H. Lin, C. Yu, H. Huang, M. Lee. Fluid Phase Equilib. 248 (2006) 174–180. [11] E. Ince. J. Chem. Thermodyn. 38 (2006) 1669–1674. [12] Ş. Kırbaşlar, E. Ince, S. Şahin, U. Dramur. J. Chem. Thermodyn. 39 (2007) 1493–1499.

44
[13] Ş. Kırbaşlar, S. Şahin, M. Bilgin. J. Chem. Eng. Data. 52 (2007) 1108–1112. [14] Ş. Kırbaşlar, S. Şahin, M. Bilgin. J. Chem. Thermodyn. 39 (2007) 1463–1469. [15] Ş. Kırbaşlar, S. Şahin, M. Bilgin. J. Chem. Thermodyn. 39 (2007) 284–290. [16] D. Özmen. Fluid Phase Equilib. 269 (2008) 12–18. [17] D. Özmen, S. Çehreli, U. Dramur. J. Chem. Thermodyn. 37 (2005) 837–842. [18] T. Anderson, J. Prausnitz. Ind. Eng. Chem. Proc. Des. Dev. 17(4) (1978) 552–561. [19] T. Anderson, J. Prausnitz. Ind. Eng. Chem. Proc. Des. Dev. 17(4) (1978) 561–567. [20] T. Magnussen, P. Rasmussen, P. Fredenslund. Ind. Eng. Chem. Proc. Des. Dev. 20 (1981)
331–339. [21] H. Renon, J. Prausnitz. AIChE J. 14 (1968) 135-144. [22] U. Weidlich, J. Gmehling. Ind. Eng. Chem. Res. 26 (1987) 1372–1381. [23] J. Gmehling, J. Li, M. Schiller. Ind. Eng. Chem. Res. 32 (1993) 178–193. [24] M. Uusi-Penttila, R. Richards, P. Blowers, B. Torgerson, K. Berglund. J. Chem. Eng. Data,
41 (1996) 235–238. [25] D Vu, C. Lira, N. Asthana, A. Kolah, D. Miller.J. Chem. Eng. Data, 51 (2006) 1220–1225. [26] D. Vu. Properties and separations of plant-derived chemicals. Thesis (Ph. D.) -Michigan
State University. Dept. of Chemical Engineering and Materials Science. Michigan, USA. (2007).

45
[27] D. Othmer, P. Tobias. Ind. Eng. Chem. 34 (1942) 693–696. [28] R. Stephenson. J. Stuart. J. Chem. Eng. Data 31 (1986) 56–70. [29] Aspentech, Aspen Physical Property System, physical property models/methods,
Burlington, 2007. [30] J. Gmehling, U. Onken. Vapor Liquid Equilibrium Data Collection. DECHEMA Chemical
Data Series, VOL I., Part 1, DECHEMA. Frankfurt, Germany. (1977) [31] R. N. Paul. J. Chem. Eng. Data. 21 (2) (1976) 165–169. [32] K. Kurihara, M. Nakamichi, K. Kojima. J. Chem. Eng. Data. 38 (1993) 446–449. [33] A. Arce, J.M. Ageitos, A. Soto. Fluid Phase Equilib. 122 (1996) 117–129. [34] K. Iwakabe, H. Kosuge. Fluid Phase Equilib. 192 (2001) 171–186. [35] Y. T. Tang, H. Huang, I. Chein. J. Chem. Eng. Jpn. 36 (11) (2003) 1352–1363. [36] L.H. Horsley. Azeotropic Data III. Advances in Chemistry Series 116, American Chemical
Society. Washington D.C., USA. (1973).

46
Included in this section is a copy of the paper: Phase equilibria for reactive distillation of
diethyl succinate. Part II. Systems diethyl succinate + ethyl acetate + water and diethyl succinate
+ acetic acid + water, by A. Orjuela, A. J. Yanez, P. K. Rossman, D. T. Vu, D. Bernard-Brunel,
D. J. Miller, C. T. Lira. Published in Fluid Phase Equilibria, 290 (1-2) (2010) 68-74.
The paper is reformatted and figures and tables are enlarged to fulfill edition requirements for
the dissertation document.
47
2. Phase equilibria for reactive distillation of diethyl succinate. Part II.
Systems diethyl succinate + ethyl acetate + water and diethyl succinate +
acetic acid + water
2.1 Summary
Liquid-Liquid equilibrium data were measured for the ternary systems water + ethyl
acetate + diethyl succinate and water + acetic acid + diethyl succinate at 298.15 K and
atmospheric pressure. The reliability of the experimental data was confirmed using the Othmer-
Tobias correlation. Vapor-Liquid equilibrium data were also measured for the binary systems
ethyl acetate + diethyl succinate at 313.15 K, acetic acid + diethyl succinate at 323.15 K and
ethyl acetate + ethanol at 101.325 kPa. Binary parameters for the modified UNIQUAC and
NRTL equations were obtained by fitting experimental and reported data using the regression
tool in Aspen Plus®
. The Hayden-O’Connell equation was used to represent interactions in the
vapor phase. The models agree reasonably well with the experimental data and can predict
reported azeotropic.
2.2 Introduction
Dilute aqueous solutions of organic acids are generated in various processes as a valuable
product (fermentation broths), or as a waste stream (acetylation of cellulose, maleic and
terephthalic anhydride production, adipic acid processing). Several alternatives have been used
to treat those solutions. Among others, reactive distillation (RD) has proved success in the
recovery of different acids through esterification with a variety of alcohols. Also, RD provides

48
advantages over traditional processes to upgrade fermentation products as recognized since early
1900s [1]. This method has been successfully applied for esterification of solutions with acetic
acid [2-13], lactic acid [14, 15], and citric acid [16, 17].
Succinic acid derivatives have enormous economic potential in the chemical market [18-
22]. Derivatives can be produced not only from the acid form but also from the esters [23].
Considering that the fermentation product is a diluted mixture of succinic acid with other acids in
lesser concentrations (primarily with acetic acid - AcOH) [22], an esterification process by RD
can be used to recover them simultaneously. Using RD, succinates can be separated from other
esters and water (H2O) by distillation, while chemical equilibrium is overcome by product
separation [24]. Specifically, esterification with ethanol (EtOH) will produce diethyl succinate
(DES), and ethyl acetate (EtOAc), both well known solvents and additives in fragrances
formulation.
Reactive distillation provides process intensification by integrating the reactor and the
major separation unit, but requires accurate thermodynamic modeling for process design. In the
case of a mixed acid esterification, multicomponent phase equilibrium in the reactive mixture
must be represented. In particular, for succinic acid or succinic derivatives, there is lack of
information on phase equilibria in multicomponent systems. Simulations in ASPEN PLUS®
for
methyl succinate production by RD [25], showed that only qualitative trends can be obtained
using available thermodynamic parameters. In the case of DES, generalized group contribution
methods have been used to calculate activity coefficients in mixtures, but predictions did not
agree with experimental data [26, 27].
In general, quantitative predictions of phase equilibrium in VLLE multicomponent
mixtures based only on binary vapor-liquid equilibrium (VLE) data are not accurate [28-30].

49
Liquid-liquid equilibrium (LLE) data must be also considered in parameter regression for
accurate representation. Therefore, in this work experimental LLE and VLE data were measured
for mixtures with DES and other components of the mixed acid esterification. LLE data were
obtained for the ternaries H2O + EtOAc + DES and H2O + AcOH + DES. VLE data were
measured for the binaries EtOAc + DES, AcOH + DES, and EtOAc + EtOH. These data,
together with others reported in the open literature were correlated with a modified UNIQUAC
equation [28] and the NRTL equation [31] using the regression tool included in Aspen Plus®
.
2.3 Material and methods
2.3.1 Materials
Diethyl succinate (DES, 99%, Sigma-Aldrich), ethanol (EtOH, 200 proof, Decon Labs),
water (H2O, HPLC grade, J.T. Baker), ethyl acetate (EtOAc, 99.99%, EMD), acetic acid (AcOH,
99.9%, Aristar), n-butanol (99.9%, Mallinckrodt), and acetonitrile (HPLC grade, EMD) were
used in the present experiments. Purity was confirmed by gas chromatography and Karl-Fisher
analysis (Hydranal-coulomat E solution (Riedel-de Haën)) for water impurities. Traces of water
were the only impurities detected. Methyl red (Reagent grade, EM science) was used to reveal
liquid-liquid interface for LLE measurements. Phenolphthalein (Sigma) and sodium hydroxide
(A.C.S., J.T. Baker) were used during titrations.
DES and EtOAc were purified by vacuum distillation. Only 85-90 % of the pre-distilled
volume was used for the experiments, discarding the first overhead fraction (5-10 %) and the
reboiler residue (5 %). Ethanol was dried using molecular sieve to a water content less than 800

50
ppm, and it was stored under dry atmosphere without further purification. Ethyl acetate was dried
with CaCl2 prior to VLE experiments.
2.3.2 Experimental procedures
LLE data for ternary mixtures were determined on a mass basis, using glass vials (10
cm3) stirred with magnetic bar. These vials were placed in an isothermal bath equipped with a
circulator pump and temperature control (Isotherm immersion circulator 730, Fisher Scientific).
The temperature was measured with an ASTM certified glass thermometer (model 64 C, ± 0.1
K). The total mass for all the experiments was about 10 g.
2.3.3 LLE Tie Lines
Equilibrium lines were obtained by preparing ternary mixtures of known overall
composition within the two phase region. Traces of methyl red were added to improve interface
visualization. The organic phase preferentially dissolves methyl red causing the ester rich phase
to have an orange color and the aqueous phase remained colorless or slightly red. The liquid
mixtures were stirred at constant temperature for 12 h. After equilibration the vial was
centrifuged for 20 minutes at 4000 rpm and returned to the isothermal bath for 12 more hours.
The bottom phase was removed with a syringe and the weight of every phase was recorded.
Difference from total initial mass to that of the two phases was checked and it was less than 1%
(mass) for all the experiments. A sample of every layer was taken for analysis. H2O + EtOAc +
DES and H2O + AcOH + DES systems were measured at 298.15 K (± 0.5 K). In the ternary
system H2O + EtOAc + DES at high concentrations of DES, the organic liquid phase was denser
than the aqueous phase. For high concentrations of EtOAc the aqueous phase was dense.

51
2.3.4 LLE Binodal Curve
The solubility envelope was obtained to confirm that obtained from tie lines for the
ternary H2O + EtOAc + DES. Fixed amounts of binary mixtures of H2O + DES and EtOAc +
H2O were prepared gravimetrically using an analytical balance (Sartorius R 300 S, ± 0.1 mg).
Additions of weighted amounts of EtOAc or DES to each binary mixture were done in stages
using a syringe (0.1 cm3). After every addition the mixture was stirred for 10 minutes and
checked for single phase region. Experiments were done at 298.15 K (± 0.5 K). In order to
enhance visual determination of the two phases, traces of methyl red were added to the mixture.
Accuracy of this method around 1% (mass) was reported in a previous work [32]. For the ternary
system H2O + AcOH + DES, solubility data are available at 298.15 K [26], and the binodal
curve was not measured.
2.3.5 VLE experiments
P-x experiments were carried out using the apparatus and analytical methods described in
detail by Vu et al [33] and Vu [34]. Isothermal VLE of the binaries EtOAc + DES and AcOH +
DES were measured at 313.15 K and 323.15 (± 0.05 K) respectively. For the AcOH + DES
system, the previously described apparatus was improved by using a jacketed vessel with a
thermowell. Water from an isothermal bath was circulated in the jacket to maintain constant
temperature. The stem between the chamber and the pressure gauge (Baratron®
model PDR
2000, MKS Instruments) was traced with heating tape to prevent condensation. The new vessel
provided a more direct measurement of liquid temperature and was easier to disassemble. The
predetermined mixture composition was stirred with a magnetic bar and the vessel was degassed

52
at under vacuum at the desired temperature. To assure degassing, after the initial pressure
stabilized, the pressure was lowered to approximately half the equilibrium pressure and the
vacuum valve was closed and the equilibrium pressure restabilized. Following re-equilibration,
variations in pressure of ± 0.2 kPa in between repetitions were considered acceptable. Reported
pressure is an average of three measurements obtained for every composition.
Using a vapour-liquid equilibrium apparatus VLE 100D (Fischer America, Inc.), T-x-y
data at 101.3 kPa for the binary EtOAc + EtOH were obtained. Temperature measurements were
within ± 0.05K and pressure control was within ± 0.1 kPa. These data were used to validate
reliability of sampling and quantification procedures, and also for parameter regression.
2.3.6 Analysis
Samples from VLE were analyzed as described in [33]. For the binary AcOH + DES,
titration with 0.1 M ethanolic solution of sodium hydroxide was used. A weighed aliquot of the
original sample from the P-x apparatus was titrated at 293.15 K until final point with
phenolphthalein. It was found that this method was more simple, rapid, and reproducible than
gas chromatography for this system. LLE samples were analyzed using a gas chromatograph (HP
5890 series II), equipped with a thermal conductivity detector. n-butanol was used as internal
standard and acetonitrile as solvent. A 15 m long Alltech EC-WAX column (0.53 mm i.d., 1.20
µm Film thickness) was used with a temperature programmed analysis: The initial column
temperature was 313.15 K (3 min), ramped at 30 K/min to a final temperature 523.15 K (and
held for 0.5 min). The injection port was maintained at 543.15 K in a splitless mode. The
detector temperature was 523.15 K. Helium was used as carrier (0.25 cm3/s) and injections of
5×10⁻⁴
cm3 were used. Samples of known composition in the range of interest were used for

53
calibration, and injected by triplicate to obtain repeatability within 0.5% by mass. Data
integration was done using a Peaksimple Chromatography Data System (SRI Model 302) with
Peaksimple software version 3.59. Karl-Fisher analysis (Aquacount coulometric titrator AQ-
2100) was used to measure and confirm water content in reagents and samples.
2.4 Results and discussion
Experimental tie lines data for the system H2O + EtOAc + DES and H2O + AcOH + DES
are listed in Table 2-1 where wi represents mass fraction of each component. The consistency of
LLE data was checked with the Othmer-Tobias method [35] as shown in Figure 2-1, and a linear
relation was obtained for both systems. Tie lines extremes for the system H2O + AcOH + DES
agree reasonably well with reported immiscible boundaries [26]. Binodal data for the system
H2O + EtOAc + DES are listed in Table 2-2.
Table 2-1. LLE tie line data for H2O + EtOAc + DES and H2O + AcOH + DES at 298.15 K.
Compositions are in weight fraction.
Aqueous Phase (Aq.) Organic Phase (Org.)
w H2O w EtOAc w DES w H2O w EtOAc w DES
0.960 0.021 0.019 0.037 0.185 0.778 0.950 0.033 0.017 0.033 0.327 0.640 0.944 0.044 0.012 0.044 0.463 0.493 0.937 0.054 0.009 0.050 0.557 0.393
w H2O w AcOH w DES w H2O w AcOH w DES
0.893 0.066 0.041 0.073 0.029 0.898 0.824 0.133 0.043 0.084 0.064 0.852 0.690 0.230 0.080 0.141 0.147 0.712 0.442 0.293 0.265 0.275 0.268 0.457

54
Table 2-2. LLE binodal data for H2O + EtOAc + DES at 298.15 K. Compositions are in
weight fraction.
w H2O w EtOAc w DES w H2O w EtOAc w DES
0.030 0.817 0.153 0.962 0.021 0.017 0.027 0.678 0.295 0.970 0.012 0.018 0.028 0.536 0.436 0.970 0.008 0.022 0.029 0.385 0.586 0.978 0.000 0.022 0.025 0.243 0.732 0.018 0.000 0.982 0.023 0.100 0.877 0.919 0.0810 0.000 0.943 0.048 0.009 0.040 0.960 0.000 0.953 0.033 0.014
Figure 2-1. Othmer-Tobias plots for the H2O + EtOAc + DES and H2O + AcOH + DES ternary systems. (○) ternary with EtOAc, (∆) ternary with AcOH.
P-x data for the binaries EtOAc + DES and AcOH + DES are listed in Table 2-3. Only
few points were taken for EtOAc + DES mixture because the equilibrium data showed minimal
-2.4
-1.6
-0.8
0
0.8
-3.5 -2.5 -1.5 -0.5 0.5
ln [ (1-w H2O)/w H2O ] Aq.
ln [
(1 -
wD
ES)/
wD
ES
] O
rg.

55
deviation from ideal behavior and from UNIFAC predictions. T-x-y data for the binary EtOAc +
EtOH are presented in Table 2-4.
Table 2-3. P-x data for the binary systems EtOAc + DES at 313.15 K and AcOH + DES at
323.15 K.
P (kPa) xEtOAc P (kPa) xAcOH P (kPa) xAcOH
0.4132 0.021 0.07 0 3.84 0.590 6.825 0.286 0.31 0.048 4.40 0.658
12.197 0.483 0.81 0.164 4.40 0.682 15.849 0.625 1.40 0.235 4.76 0.757 19.275 0.773 1.97 0.321 5.32 0.807 24.82 1.000 2.36 0.406 5.89 0.814
2.73 0.439 6.57 0.899 3.11 0.507 7.35 0.980 3.41 0.572 7.52 1.000
Table 2-4. T-x-y data for the system EtOAc + EtOH at 101.3 kPa.
T (K) xEtOAc yEtOAc T (K) xEtOAc yEtOAc
351.55 0 0 345.35 0.690 0.656 351.35 0.001 0.008 346.75 0.868 0.796 350.85 0.016 0.049 348.25 0.937 0.879 350.35 0.024 0.073 350.25 0.991 - 349.75 0.044 0.120 349.35 0.978 0.959 349.25 0.061 0.164 348.25 0.922 0.883 348.65 0.082 0.206 347.45 0.879 0.836 348.05 0.137 0.260 346.65 0.849 0.799 346.25 0.266 0.398 345.85 0.777 0.731 345.55 0.357 0.460 345.35 0.631 0.629
The UNIQUAC and NRTL equations are implemented as provided in ASPEN PLUS®
(Aspen) [36]. To improve the agreement with LLE data using UNIQUAC equation, the modified
UNIQUAC equation is used. For the residual activity coefficient contribution, the molecular
surface parameter q’ for H2O and EtOH is implemented as suggested by Anderson [28, 29] and

56
the values are taken from that work. For all other components q’ was not modified. Values for q
and the relative volume r were taken from the Aspen database. Due to the modification of q’ for
H2O and EtOH, interaction parameters for the binaries H2O + AcOH, H2O + EtOAc, EtOH +
AcOH, and EtOH + EtOAc were regressed using VLE and LLE data reported in literature [37-
46]. Interaction parameters for the binaries H2O + EtOH, H2O + DES, and EtOH + DES were
obtained before for the UNIQUAC equation. Specifically, H2O + DES parameters were used to
calculate LLE for H2O + EtOAc + DES and H2O + AcOH + DES ternary mixtures, and were
fixed during other binary parameter estimation. In the case of the NRTL equation, only binary
parameters for AcOH + DES and EtOAc + DES were evaluated. Binary parameters for EtOH +
H2O, H2O + AcOH, H2O + EtOAc, EtOH + AcOH, and EtOH + EtOAc were taken from
literature [47]. The Hayden-O’Connell (HOC) equation was used to model the vapor phase and
the association parameters were taken from Aspen database. HOC association parameters for
species with DES are not available in the open literature, and they were assumed equal to those
existing interaction parameters for the specie with ethyl acetate.
The parameter fitting was performed with the regression tool in Aspen by minimization
of the maximum likelihood objective function (a modified least-squares method of the
differences between experimental and estimated data). A list of the UNIQUAC and NRTL
parameters is presented in Table 2-5.
VLE correlations for the binaries EtOAc + DES and AcOH + DES are presented in
Figures 2-2 and 2-3. Both, UNIQUAC and NRTL predictions agree with the experimental data.
LLE data and correlation for the ternary H2O + AcOH + DES are presented in Figure 2-4. The

57
slope of the experimental tie lines is slightly different from those reported previously [26]. Even
though the immiscibility region obtained by regression is consistent with reported data, tie lines
produced with NRTL or UNIQUAC do not fit experimental data perfectly. Nonetheless both
UNIQUAC and NRTL offer good predictions of LLE together with a good VLE representation.
Table 2-5. Binary parameter for UNIQUAC-HOC and NRTL-HOC models. For
UNIQUAC, ττττij = exp(aij + bij/T). For NRTL, Gij = exp[ααααij (aij + bij/T)].
HOC Association Parameters
H2O EtOH EtOAc AcOH DES
H2O 1.7 1.55 1.3 2.5 1.3 EtOH 1.55 1.4 1.3 2.5 1.3 EtOAc 1.3 1.3 0.53 2 0.53 AcOH 2.5 2.5 2 4.5 2 DES 1.3 1.3 0.53 2 0.53
UNIQUAC
H2O H2O EtOH EtOH EtOAc AcOH
EtOAc AcOH EtOAc AcOH DES DES
aij -0.5064399 0.0462 0.38212429 0 0 0
aji 4.0628407 0.59198978 1.8108 0 0 0
bij 154.99112 148.623424 30.6229951 -258.87313 -334.34066 145.839644
bji -2029.8721 -492.96872 -1168.8663 254.278619 212.401927 -354.5179 H2O EtOH EtOAc AcOH DES
r 0.92 2.10547 3.47858 2.19512 6.4733 q 1.4 1.972 3.116 2.072 5.616 q’ 1 0.92 3.116 2.072 5.616
NRTL
EtOAc AcOH
DES DES
aij 0 -3.3257404
aji 0 18.5048574
bij 236.073904 1067.92091
bji -211.38844 -5736.0599
ααααij 0.3 0.3

58
Figure 2-2. P-x diagram for the binary EtOAc + DES at 313.15 K. (●) Experimental data, (—) UNIQUAC – HOC, (- -) NRTL − HOC.
Figure 2-3. P-x diagram for the binary AcOH + DES at 323.15 K. (●) Experimental data, (—) UNIQUAC – HOC, (- -) NRTL − HOC.
0
7
14
21
28
0 0.2 0.4 0.6 0.8 1x DES
P (
kP
a)
0
2
4
6
8
0 0.2 0.4 0.6 0.8 1x DES
P
(k
Pa
)
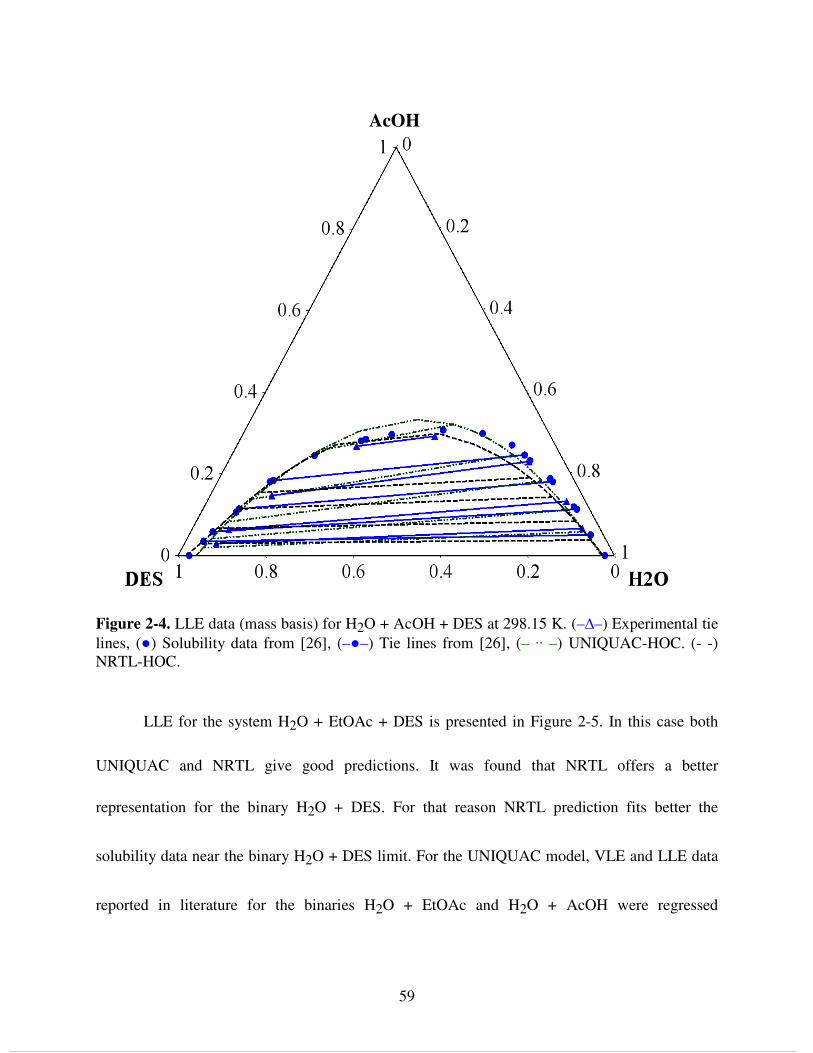
59
Figure 2-4. LLE data (mass basis) for H2O + AcOH + DES at 298.15 K. (–∆–) Experimental tie lines, (●) Solubility data from [26], (–●–) Tie lines from [26], (– ·· –) UNIQUAC-HOC. (- -) NRTL-HOC.
LLE for the system H2O + EtOAc + DES is presented in Figure 2-5. In this case both
UNIQUAC and NRTL give good predictions. It was found that NRTL offers a better
representation for the binary H2O + DES. For that reason NRTL prediction fits better the
solubility data near the binary H2O + DES limit. For the UNIQUAC model, VLE and LLE data
reported in literature for the binaries H2O + EtOAc and H2O + AcOH were regressed
AcOH

60
simultaneously. Those provided a reasonably good representation of the ternary systems
mentioned before, and also for the binaries as shown in figures 2-6 to 2-8.
Figure 2-5. LLE data (mass basis) for H2O + AcOH + DES at 298.15 K. (●) Experimental solubility data, (–∆–) Experimental tie lines, (– ·· –) UNIQUAC-HOC. (- -) NRTL-HOC.
EtOAc

61
Figure 2-6. VLE for the binary H2O + EtOAc at 101.325 kPa. (∆) Reichl [39], (○) Lee [41], (×) Ellis data in [44], (●) Kato [47], (—) UNIQUAC-HOC.
Figure 2-7. VLLE for the binary H2O + EtOAc at different temperatures. (○) Liquid phase (×) Vapor phase, in Hong [38], (+) Stephenson [42], (∆) Sørensen [43], (—) Liquid phase (- -) Vapor phase, UNIQUAC-HOC.
340
349
358
367
376
0 0.2 0.4 0.6 0.8 1x EtOAc
T (
K)
270
290
310
330
350
0 0.2 0.4 0.6 0.8 1x , y EtOAc
T (
K)

62
Figure 2-8. VLE for the binary H2O + AcOH. at 101.32 kPa. Data compiled in [44], (∆) Brown, (▲) Conti, (○) Chu, (●) Garner, (+) Garwin, (×) Ocon, (-) Sebastiani, (□) Calvar [37]. (―) UNIQUAC – HOC.
VLE Experimental data for the system EtOH + EtOAc agree with those reported before
as shown in Figure 2-9. Pursuing a complete set of parameters for the mixed acid process, a
regression of VLE reported data for the binary EtOH + AcOH with UNIQUAC equation is
presented in Figure 2-10. A good fitting was obtained.
Predicted azeotropic conditions, and those calculated with UNIQUAC and NRTL
equations, are listed in Table 2-6. Predictions are consistent with reported data [48].
372
377
382
387
392
0 0.2 0.4 0.6 0.8 1
x H2O
T (
K)

63
Figure 2-9. VLE for the binary EtOH + EtOAc. (□) Experimental data, (○) Calvar [37], (∆) Tu [40], (×) Kato [47], Data compiled in [44], (▲) Chu, (●) Griswold, (+) Furnas, (―) UNIQUAC – HOC.
Taking into account the limited solubility of succinic acid in EtOH (40-45% by weight at
353 K), a reactive distillation system to produce DES will work best with excess EtOH present.
In this condition, the data show that there will be only one liquid phase. This is also the case for
mixtures with AcOH or EtOAc. The parameters obtained in this work will represent the VLE
reasonably well for design purposes while simultaneously indicating when two liquid phases
may exist.
344
346
348
350
352
0 0.2 0.4 0.6 0.8 1x EtOAc
T (
K)

64
Figure 2-10. VLE for the binary EtOH + AcOH. (∆) Reichl [39], (×) Ruiz data in [45], (―) UNIQUAC – HOC.
Table 2-6. Predicted and reported [48] azeotropes in the system H2O + EtOH + DES at
101.23 kPa.
xH2O xEtOH xEtOAc xDES T (K)
0.3085 0.1126 0.5789 0 343.38 0.3115 0 0.6885 0 343.53
0 0.4619 0.5381 0 344.96 0.0963 0.9037 0 0 351.324
Reported Azeotropes
0.9899 0 0 0.0101 373.05 0.2694 0.1709 0.5597 0 343.34
0.3522 0 0.6478 0 343.77 0 0.4647 0.5353 0 345.04
0.1134 0.8866 0 0 351.26 UNIQUAC - HOC
0.9895 0 0 0.0105 372.96 0.2858 0.1069 0.6073 0 343.24
0.3131 0 0.6869 0 343.52 0 0.4572 0.5428 0 344.96
0.0984 0.9016 0 0 351.33 NRTL - HOC
0.9873 0 0 0.0127 372.88
320
340
360
380
400
0 0.2 0.4 0.6 0.8 1x EtOH
T (
K)

65
2.5 Conclusions
The LLE data for the ternary system H2O + EtOAc + DES and H2O + AcOH + DES at
298.15 K are reported. P-x data for the binary EtOAc + DES at 313.15 K and AcOH + DES at
323.15 K are also presented. Interaction parameters for the binaries EtOAc + DES, AcOH +
DES, were obtained for the models UNIQUAC-HOC and NRTL-HOC. VLE data were also
collected for the system EtOAc + EtOH. Together with VLE reported data for different binaries,
some interaction parameters for a mixed acid esterification process were obtained by regression
with the UNIQUAC-HOC model. The two models are able to reproduce well experimental and
reported VLE data and the azeotropic points for the system. The parameters obtained in this
work are useful for modeling and design of a RD process.

66
REFERENCES

67
2.6 REFERENCES
[1] A. A. Backhaus. Esters from fermented distillery waste. US Patent 1400852. (1921) [2] R. Neumann, Y. Sasoon. Ind. Eng. Chem. Proc. Des. Dev. 23, 4 (1983) 654−659. [3] E. M. Jones. Process for the recovery of an organic acid from the manufacture of a cellulose
ester. (1997) US Patent 5648529. [4] M. Scates. Recovery of acetic acid from dilute aqueous streams formed during a
carbonylation process. (1997) US Patent 5599976. [5] Z. Xu, A. Afacan, K. Chuang. Can. J. Chem. Eng. 77 (1999) 676–681. [6] Z. Xu, A. Afacan, K. Chuang. Can. J. Chem. Eng. 77 (1999) 682-687. [7] B. Saha, S. P. Chopade, S. M. Mahajani. Catal. Today, 60, 1-2 (2000) 147-157. [8] C. Bianchi. Appl. Catal., B. 40 (2003) 93-99. [9] A. Singh, A. A. Tiwari, S. M. Mahajani, R. D. Gudi. Ind. Eng. Chem. Res. 45, 6 (2006)
2017−2025. [10] W. Hung, I. Lai, Y.W. Chen, S. B. Hung, H. B. Huang, M. J. Lee, C. C. Yu. Ind. Eng.
Chem. Res. 45 (2005) 1722-1733. [11] V. Ragaini, C.L. Bianci, C. Pirola and G. Carvoli. Appl. Catal. B: Environ. 64 (2006) 66-71. [12] Singh, A. Tiwari, V. Bansal, R. D. Gudi, S. M. Mahajani. Ind. Eng. Chem. Res. 46, 26
(2007) 9196-9204.

68
[13] A. Arpornwichanop, K. Koomsup, S. Assabumrungrat. J. Ind. Eng. Chem. 14 (2008) 796–
803. [14] R. Kumar, H. Nanavati, S.B. Noronha, S. M. Mahajani. J. Chem. Technol. Biotech. 81, 11
(2006) 1767-1777. [15] H.G. Joglekar, I. Rahman, S. Babu, B.D. Kulkarni, A. Joshi. Sep. Purif. Technol. 52 (2006)
1–17. [16] A. Kolah, N. Asthana, D. Vu, C. T. Lira, D. J. Miller. Eng. Chem. Res. 47, 4 (2008) 1017-
1025. [17] D. Miller, N. Asthana, A. Kolah, D. Vu, C. Lira. Process for reactive esterification
distillation. (2006) US Patent 20060252956. [18] C. Delhomme,D. Weuster-Botza, F. E. Kühn. Green Chem. 11 (2009) 13–26. [19] A. Cukalovic, C. V. Stevens. Biofuels, Bioprod. Biorefin. 2 (2008) 505–529. [20] B. Hermann, M. Patel. Appl. Biochem. Biotechnol. 136 (2007) 361 – 388. [21] O. Wolf, M. Crank, M. Patel, F. Marscheider-Weidemann, J. Schleich, B. Hüsing, G.
Angerer. Techno-economic feasibility of large-scale production of Bio-based polymers in Europe, European Science and Technology Observatory, EUR 22103 EN. (2005).
[22] J. Zeikus, M. Jain, P. Elankovan. Appl. Microbiol Biotechnol. 51 (1999) 545-552. [23] S. Varadarajan, D. J. Miller. Biotechnol. Prog. 15 (1999) 845-854. [24] D. Sutton, G. Reed, G. Hiles. Process for the production of esters of mono-, di or
polycarboxylic acids. (2007) US Patent 5599976. [25] H. Bart, J. Reidetschlager. Sep. Sci. Technol. 30 (1995) 1849-1865.

69
[26] Ş. Kırbaşlar, S. Şahin, M. Bilgin. J. Chem. Eng. Data. 52 (2007) 1108–1112. [27] Ş. Kırbaşlar, S. Şahin, M. Bilgin. J. Chem. Thermodyn. 39 (2007) 1463–1469. [28] T. Anderson, J. Prausnitz. Ind. Eng. Chem. Proc. Des. Dev. 17(4) (1978) 552-561. [29] T. Anderson, J. Prausnitz. Ind. Eng. Chem. Proc. Des. Dev. 17(4) (1978) 561-567. [30] T. Magnussen, P. Rasmussen, P. Fredenslund. Ind. Eng. Chem. Proc. Des. Dev. 20 (1981)
331-339. [31] H. Renon, J. Prausnitz. AIChE J. 14 (1968) 135-144. [32] M. Uusi-Penttila, R. Richards, P. Blowers, B. Torgerson, K. Berglund. J. Chem. Eng. Data,
41 (1996) 235-238. [33] D Vu, C. Lira, N. Asthana, A. Kolah, D. Miller.J. Chem. Eng. Data, 51 (2006) 1220-1225. [34] D. Vu. Properties and separations of plant-derived chemicals. Thesis (Ph. D.) -Michigan
State University. Dept. of Chemical Engineering and Materials Science. Michigan, USA. (2007).
[35] D. Othmer, P. Tobias. Ind. Eng. Chem. 34 (1942) 693–696. [36] Aspentech, Aspen Physical Property System, physical property models/methods,
Burlington, 2007. [37] N. Calvar, A. Domínguez, J. Tojo. Fluid Phase Equilibr. 235 (2005) 215-222. [38] G. B. Hong, M. J. Lee, H. Lin. Fluid Phase Equilibr. 203 (2002) 227–245.

70
[39] A. Reichl, U. Daiminger, A. Schmidt, M. Davies, U. Hoffmann, C. Brinkmeier, C. Reder, W. Marquardt. Fluid Phase Equilibr. 153 (1998) 113–134.
[40] C. H. Tu, Y. S. Wu, F. C. Ou. Fluid Phase Equilibr. 130 (1997) 243-252. [41] L. Lee, W. Chen, J. Huang. J. Chem. Eng. Jpn. 29 (1996) 427-438. [42] R. Stephenson, J. Stuart. J. Chem. Eng. Data. 31, 1 (1986) 56–70. [43] J. M. Sørensen, W. Arlt Liquid-Liquid Equilibrium Data Collection. Binary Systems.
DECHEMA. Chemistry Data Series, Vol V, Part 1. (1980). [44] J. Gmenhling, U. Onken, W. Arlt. Vapor-Liquid Equilibrium Data Collection. Aqueous-
Organic Systems. DECHEMA. Chemistry Data Series, Vol I, Part 1. (1978). [45] J. Gmenhling, U. Onken, W. Arlt. Vapor-Liquid Equilibrium Data Collection. Organic
Hydroxy Compounds: Alcohols. DECHEMA. Chemistry Data Series, Vol I, Part 2a. (1978). [46] M. Kato, H. Konishi, M. Hirata. J Chem. Eng. Data 15, 3 (1970) 435-439. [47] Y. T. Tang, H. Huang, I. Chein. J. Chem. Eng. Jpn. 36 (11) (2003) 1352-1363. [48] L. H. Horsley. Azeotropic Data III. Advances in Chemistry Series 116, American Chemical
Society. Washington D.C., USA. (1973).

71
3. Phase equilibria in Binary Mixtures with Monoethyl Succinate
3.1 Summary
Monoethyl succinate was produced by partial esterification of succinic anhydride with
ethanol using Amberlyst 15 as catalyst. After separation and purification, the purity of
monoethyl sucinate was confirmed by nuclear magnetic resonance (NMR). Vapor pressure of
monoethyl succinate was measured and correlated with Antoine equation. Vapor-liquid
equilibria at constant temperature were measured for the binary systems ethyl acetate +
monoethyl succinate, acetic acid + monoethyl succinate, and water + monoethyl succinate at
323.15 K, and ethanol + monoethyl succinate at 313.15 K. Binary parameters for the NRTL
equations were obtained by fitting experimental data using the regression tool in Aspen Plus®
using the Hayden-O’Connell method for vapor phase fugacities. The model agrees reasonably
well with the experimental data.
3.2 Introduction
Esterification of succinic acid (SA) present in diluted solutions is considered a viable
recovery and separation alternative from complex mixtures produced during fermentation [1-5].
Owing that extent of esterification is limited by chemical equilibrium, removal of reaction
products is necessary to obtain high conversions. As recognized by some researchers [2, 3] this
can be accomplished using reactive distillation units in which water (H2O) and succinate are
selectively removed by distillation as top and bottom streams respectively, while SA is

72
completely esterified at intermediate stages. In general the fermentation broth generated during
succinic acid production also contains other carboxylic acids, mainly acetic acid (AcOH) [6-8].
Hence esterification of mixed acids occurs providing acetates and succinates are the major
products.
In the specific case of esterification with ethanol (EtOH), the reaction proceeds
sequentially through a series – parallel reaction scheme (Figure 3-1) with monoethyl succinate
(MES) as intermediate product and diethyl succinate (DES) as the final product. Ethyl acetate
(EtOAc) is also produce when AcOH is present in the mixture. In addition to the several
applications reported for the major product (DES) [1], the intermediate MES can be used in the
treatment of diabetes and starvation [9-13]. MES can also be used as raw material for
asymmetric succinic esters and other derivatives [14].
Figure 3-1. Scheme of reactions in a mixed acid esterification process.
Succinic Acid Monoethyl Succinate Ethanol
Diethyl Succinate Monoethyl Succinate Ethanol
Acetic Acid Ethyl Acetate Ethanol
H2OOH
O
O
OH O
O
O
OHOH+ + H2OOH
O
O
OH O
O
O
OHOH+ +
H2OH2O
H2OH2O
73
In order to exploit a reactive distillation technology to recover SA though esterification
with EtOH, computational modeling of the VLE in the reactive column is required including the
behavior of the MES. Specifically, for SA or succinic derivatives there is lack of information on
phase equilibria in multicomponent systems. Generalized group contribution methods have been
used to predict activity coefficients in mixtures with succinic species, but predictions do not
agree with experimental data [15, 16]. In previous work from our group, phase equilibria of
binary and ternary mixtures with DES where studied [17-18]. Binary interaction parameters for
NRTL equation [19] were obtained.
In this study experimental vapor-liquid equilibrium (VLE) data for the systems MES +
EtOH, MES + EtOAc, MES + H2O, and MES + AcOH are presented. These data literature were
correlated with the NRTL equation using a regression tool included in Aspen Plus® [20]. We
also present a comparison with predictions using a group contribution method (UNIFAC) [21,
22].
3.3 Material and methods
3.3.1 Materials
Succinic anhydride (99.3%, Sigma-Aldrich), succinic acid (100 %, Sigma-Aldrich),
monoethyl succinate (89.1%, Sigma-Aldrich), diethyl succinate (99.8%, Sigma-Aldrich), ethanol
(200 proof, Decon Labs), water (HPLC grade, J.T. Baker), ethyl acetate (99.99%, EMD), acetic
acid (99.9%, Aristar), n-butanol (99.9%, Mallinckrodt), and acetonitrile (HPLC grade, EMD)
were used for experiments and calibration. Purity of all compounds except MES was confirmed
by gas chromatography and Karl-Fisher and the only impurity was water. In the case of MES, the

74
purchased MES contains H2O, EtOH, SA, and DES, and was used only for calibration purposes.
Sodium carbonate (Jade Scientific, 99.5%), hydrochloric acid (EM science, 36.5%) and diethyl
ether (EMD chemicals, 99.9%) were used during MES synthesis and purification. Hydranal-
coulomat E solution (Riedel-de Haën) was used in Karl-Fisher analysis for water measurement.
3.3.2 Experimental procedures
3.3.2.1 MES synthesis
Among several routes and catalyst to produce succinic acid esters [11, 14, 23-30] and to
avoid excessive contamination with other esterification products (water and DES), MES was
prepared by partial esterification of succinic anhydride (SAnh) [11, 27] using Amberlyst 15®
[31] as catalyst. A mixture of EtOH and SAnh (3:1 molar ratio) was placed in a glass stirred
reactor at total reflux during 3 hours. The amount of dry catalyst employed was 2% with respect
to SAnh weight, and it was washed with ethanol and dried under vacuum prior use. Once the
reaction was completed the catalyst was removed by filtration and the liquid was evaporated at
343.15 K under vacuum in a rotary evaporator. After evaporation, the liquid was cooled down
and titrated with a saturated aqueous solution of sodium carbonate until it reached a pH ~ 8
measured with paper test strips. This converted any acid to the sodium salts. To extract DES, the
solution was washed twice with equal volumes of diethyl ether in a separatory funnel discarding
the organic layer. The aqueous phase was then treated with hydrochloric acid (36.5 % by weight)
until pH ~ 2 was reached (as indicated by pH paper). This solution was washed again twice with
equal volumes of diethyl ether discarding the aqueous phase. The final organic phase was
transferred to a flask and it was placed on a temperature controlled pot containing silicone oil.
The pot was located over a magnetic stirring plate to maintain liquid in the flask under agitation.

75
Then, the organic liquid phase was evaporated under vacuum (~ 0.1 kPa) using an Edwards
RV8®
high vacuum pump monitoring total pressure by coupling the flash with a pressure control
system borrowed from a wiped-film evaporator (Pope Scientific Inc.). Evaporation proceeded by
increasing temperature up to 373.15 K until no further vaporization for 8 hours. After cooling at
room temperature a cloudy liquid was obtained. Finally a white solid was removed by filtration
to obtain a clear viscous liquid.
3.3.2.2 Vapor pressure measurement
Vapor pressure was obtained using the ebulliometer and method described in detail by
Hoover et al [32]. In brief the ebulliometer consisted of a Thiele-tube-type glass pot with a small
tungsten wire passing trough the bottom used as heating element. The pot was located over an
asbestos shield and heat was supplied with a gas burner.
MES was added to the bottom of the ebulliometer with a syringe. The system was
connected to a vacuum line, and a thermocouple previously calibrated (+/- 0.1 K) was inserted
just below the liquid level. The pressure of the system (+/- 1.5 Pa) was measured and regulated
using the control system borrowed from a vapor liquid equilibrium apparatus (Fisher VLE 100).
The performance of the apparatus was verified measuring vapor pressure for different
components (H2O, EtOH, DES) assuring less than 1 % of difference with reported data.
3.3.2.3 Vapor-liquid experiment
P-x experiments were carried out using the apparatus presented in detail by Vu et al [33]
and Vu [34] with modification described in a previous study [17]. The initial mixture of
predetermined composition was stirred with a magnetic bar and the vessel was degassed under
vacuum at the desired temperature. To assure degassing, after the initial pressure stabilized, the
76
pressure was lowered to approximately half the equilibrium pressure and the vacuum valve was
closed and the equilibrium pressure re-stabilized. Following re-equilibration, variations in
pressure of ± 0.2 kPa in between repetitions were considered acceptable. Reported pressure is an
average of three measurements obtained for every composition. A liquid sample was taken for
analysis after pressure equilibration.
Subsequent equilibrium points were obtained by successive addition of one component to
the binary mixture. In the case of binary mixtures with EtOH or H2O only one or two successive
additions were allowed, and the entire range of compositions was covered in several experiments
starting with different initial compositions. This approach was followed because MES + EtOH
and MES + H2O are reactive mixtures, and esterification to DES or hydrolysis to SA might
occur at prolonged contact times. In the case of mixtures with AcOH and EtOAc
transesterification (acidolysis) did not occur.
Isothermal VLE of the binaries EtOAc + MES, AcOH + MES and H2O + MES were
measured at 323.15 K and the binary EtOH + MES at 313.15 (± 0.05 K). The modest
temperatures were used to reduce reactions during experiments. GC and HPLC analysis
indicated negligible reaction during the time required for equilibration and measurement.
3.3.3 Analysis
Samples were analyzed using both HPLC and GC. Samples were dissolved in water
(~2% w/w) for HPLC analysis. In the case of GC samples were dissolved in acetonitrile (~5 %
w/w) using butanol as internal standard (5% w/w).

77
A HP 5890®
GC equipped with a flame ionization detector and a thermal conductivity
detector was used. The injection port was maintained at 523.15 K in splitless mode, and detector
temperature was 573.15 K. Helium was used as carrier (0.25 cm3/s) and volume injections of
1×10⁻⁴
cm3 were used. Samples were introduced in a single port with a CTC A200 S automatic
injector, using n-butanol as internal standard and acetonitrile as solvent. A 30 m long Alltech
Aquawax-DA column (0.53 mm i.d., 1.0 µm film thickness) coupled to a flow splitter to conduct
the sample to both detectors in parallel. The temperature program was: column initial
temperature 313.15 K (4 min), ramp rate 20 K/min, final temperature 523.15 K (1 min). Data
integration was done using a Peaksimple chromatography data system (SRI Model 302) with
Peaksimple software version 3.59.
A HPLC system with a Waters®
717 autosampler, a Waters®
410 refractive index
detector and a Perkin Elmer LC90 UV detector was used for succinic species analysis and
confirmation. A 100 x 7.6 mm fast acid analysis column (Bio-rad®
) was used for the separation.
1 ml/min of 5 mM aqueous solution of H2SO4 was used as mobile phase. Because retention time
of EtOH and MES was similar, only UV detection was used to evaluate MES.
Samples of known composition in the range of interest were used for calibration of GC
and HPLC, and injected by triplicate to obtain repeatability within 0.5% by mass.
Karl-Fisher analysis (Aquacount coulometric titrator AQ-2100) was used to measure
water content in reagents and samples.

78
NMR spectra to confirm structure and purity of the MES was measured with a Varian
UnityPlus - 500 spectrometer, using deuterated chloroform (CDCl3) as solvent referenced at 7.24
ppm for 1H and 77 ppm for
13C.
Tests to confirm reported melting point and to verify thermal stability of MES were
conducted using differential scanning calorimetry (DSC) at atmospheric pressure (Mettler-
Toledo DSC1). A 10 mg sample of frozen MES (253 K) was weighted (Mettler-Toledo AB265-
S, ± 0.01mg) and heated in a hermetically sealed aluminum crucible at 10 K/min under nitrogen
flow (20ml/min) over a range of temperature of 223.15 to 523.15 K. An equilibration time at the
initial and final temperature of 4 minutes was used.
3.4 Results and discussion
After the synthesis and separation 97.5 % (w/w) MES cloudy liquid was obtained. The
only impurities observed by GC and HPLC analysis corresponded to SA (2%) and DES (0.5%).
This liquid was filtered and the majority of SA was removed and the clear liquid product
obtained (> 99 %) was stored at 278 K. Purity of the product was confirmed several times and it
remained constant during the usage period. Low temperature storage turned the liquid cloudy,
but at room temperature it became clear again. This behavior is similar to that observed in the
standard used for calibration (Sigma-Aldrich, 89.1%).
Because of the difficulties of removing the small amount of SA and DES in the final
product, and considering instability of MES in water (the solvent recommended as mobile phase
for chromatographic separation of acids), all the experiments were performed with this product
without further purification. An NMR spectrum of the product presented in Figure 3-2 agrees
with previous reports [35-37]. 1H NMR (500 MHz, CDCl3) δ 4.13 (q, J = 7 Hz, 2 H), 2.66 (m, 2
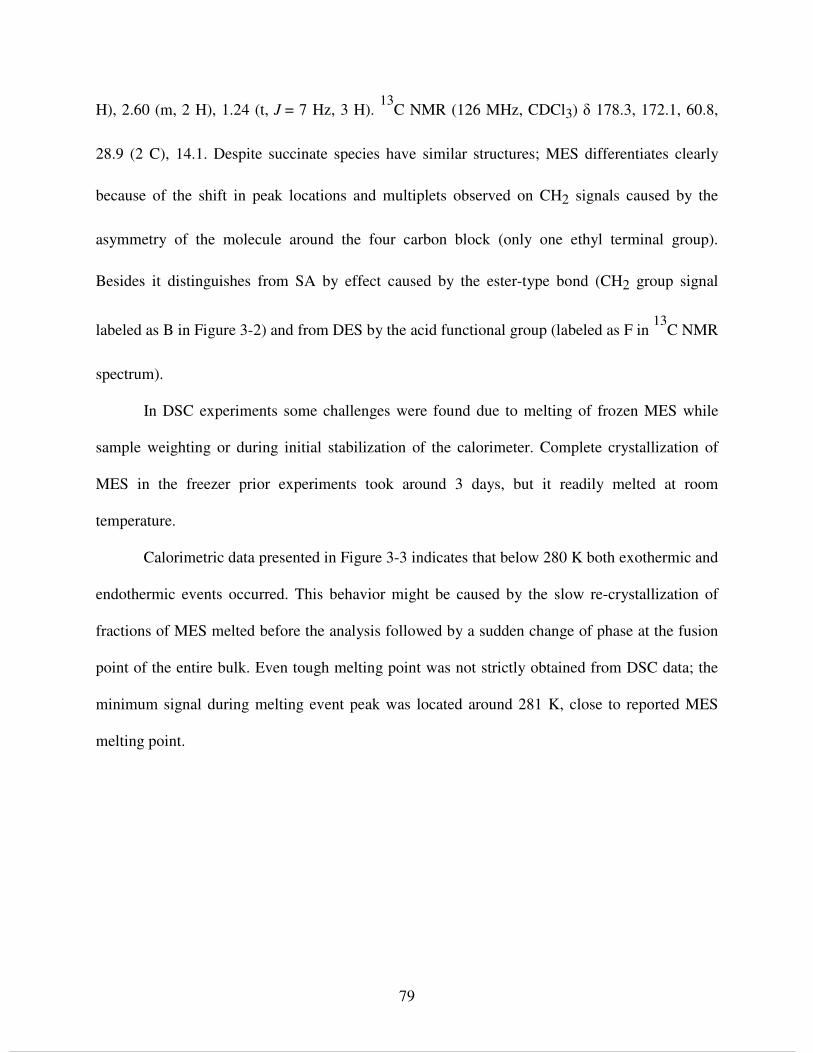
79
H), 2.60 (m, 2 H), 1.24 (t, J = 7 Hz, 3 H). 13
C NMR (126 MHz, CDCl3) δ 178.3, 172.1, 60.8,
28.9 (2 C), 14.1. Despite succinate species have similar structures; MES differentiates clearly
because of the shift in peak locations and multiplets observed on CH2 signals caused by the
asymmetry of the molecule around the four carbon block (only one ethyl terminal group).
Besides it distinguishes from SA by effect caused by the ester-type bond (CH2 group signal
labeled as B in Figure 3-2) and from DES by the acid functional group (labeled as F in 13
C NMR
spectrum).
In DSC experiments some challenges were found due to melting of frozen MES while
sample weighting or during initial stabilization of the calorimeter. Complete crystallization of
MES in the freezer prior experiments took around 3 days, but it readily melted at room
temperature.
Calorimetric data presented in Figure 3-3 indicates that below 280 K both exothermic and
endothermic events occurred. This behavior might be caused by the slow re-crystallization of
fractions of MES melted before the analysis followed by a sudden change of phase at the fusion
point of the entire bulk. Even tough melting point was not strictly obtained from DSC data; the
minimum signal during melting event peak was located around 281 K, close to reported MES
melting point.

80
Figure 3-2. 1H NMR (Upper) and
13C NMR (Lower) spectra for synthesized monoethyl
succinate. (Unlabeled peaks correspond to CDCl3 used as solvent).
A
B
C+D
E F
C+D
B
A
A
B
C
D
A
B
C
D F
E
1 2 3 4 5 6 7 ppm
180 160 140 120 100 80 60 40 20 ppm

81
Figure 3-3. Calorimetric curve obtained by DSC of a MES sample measured under N2 atmosphere at 101.3 kPa.
Another thermal event was observed above 460 K but it was not reproduced in successive
heating cycles ran on the same sample. Crucible was weighted after each cycle and changes in
weight higher than 10% between runs were observed. This indicates that MES can be affected by
thermal decomposition at high temperatures and this can limit maximum working temperatures
during phase equilibria experiments.
Taking into account the low volatility and the non-polar character of succinic species
compared with other components, it is expected that the low content of SA and DES do not
affect vapor pressure measurements or vapor-liquid equilibria significantly. Thus filtrated MES
was used without further refining during experiments. Measured vapor pressure data for MES are
presented in Table 3-1.
-30
-20
-10
0
10
220 320 420 520
T (K)
Hea
t Flo
w (
mW
)

82
Table 3-1. Experimental vapor pressure data for MES.
T
(K)
P
(Pa)
T
(K)
P
(Pa)
T
(K)
P
(Pa)
T
(K)
P
(Pa)
417.7 1586.6 449.1 8116.8 460.3 14144.6 468.3 20172.4
421.2 2088.9 450.5 8619.1 461.1 14646.9 468.8 20674.7
425.1 2591.3 452.1 9121.4 462 15149.2 469.5 21177.0
428.5 3093.6 453.2 9623.7 463.3 15651.5 469.7 21679.4
433 3595.9 454.7 10126.0 463.8 16153.9 469.8 22181.7
435.6 4098.2 455.7 10628.4 464.2 16656.2 470.1 22684.0
436.7 4600.5 456.5 11130.7 464.5 17158.5 470.3 23186.3
439.8 5102.8 457.2 11633.0 465.2 17660.8 470.4 23688.6
440.3 5605.2 458.2 12135.3 465.8 18163.1 470.5 24191.0
443 6107.5 458.4 12637.6 466.7 18665.5 471.1 24693.3
444.3 6609.8 459.8 13139.9 467.3 19167.8 471.4 25195.6
445.9 7112.1 460.1 13642.3 467.8 19670.1 471.9 25697.9
447.6 7614.4
Below 460 K one liquid sample was used to evaluate several different equilibration
temperatures. As expected from DSC results, above 460 K a change in color (liquid turned
yellowish) and the formation of a solid was observed when MES was heated for several hours
during measurement. So for high temperature experiments only 3 or 4 points were evaluated with
each sample of MES. Between experiments, the ebulliometer was cleaned and air dried to
remove decomposition products of a previous run. Experimental data agree with the trend of
literature reports [37-38]. Regression of the Antoine equation parameters was performed in
Aspen Plus®
obtaining good fitting as observed in Figure 3-4. Final parameters of Antoine
model are presented in Equation 3-1.

83
(3-1)
VLE experimental data at constant temperature for binary mixtures EtOAc + MES,
AcOH + MES, H2O + MES and EtOH + MES are listed in Table 3-2 and plotted in Figures 3-4
to 3-7. In most cases mixtures were homogeneous but in the case of H2O a slightly cloudy and
stable solution was observed with high MES concentration.
Figure 3-4.Vapor pressure data for MES. (○) Reported data [37, 38], (+) This work, (▬ ▬) ASPEN default, (▬) Regression with Antoine equation.
( )( )
3182.4685ln 20.8887180.2349
P PaT K
= −−
0
2
4
6
0.0018 0.0022 0.0026 0.003
1/T (K-1)
Log
P (
Pa)

84
Table 3-2. P-x data for binary systems with MES.
T = 323.15 K T = 313.15 K
XEtOAc P (Pa) XAcOH P (Pa) XH2O P (Pa) XEtOH P (Pa)
0.000 133.3 0.000 133.3 0.000 133.3 0.000 26.7 0.029 1506.5 0.191 706.6 0.109 2639.8 0.015 426.6 0.152 7439.4 0.269 866.6 0.206 4239.7 0.030 813.3 0.232 11065.8 0.284 1079.9 0.265 5146.2 0.032 746.6 0.294 13958.9 0.364 1546.5 0.323 6532.8 0.170 3039.8 0.299 14318.8 0.399 1626.5 0.325 6799.4 0.192 3119.7 0.396 17825.2 0.472 2039.8 0.592 10185.8 0.279 4772.9 0.413 18411.8 0.443 2173.2 0.625 10185.8 0.363 5772.9 0.524 22771.5 0.603 3159.7 0.769 11319.1 0.387 6652.8 0.539 23104.8 0.624 3239.7 0.890 11745.7 0.515 8745.9 0.763 30637.5 0.630 3493.0 1.000 12225.7 0.603 10345.8 0.765 31344.1 0.655 3639.7 0.617 10279.2 0.776 31650.7 0.733 4493.0 0.729 12998.9 0.919 35117.1 0.853 6026.2 0.751 13158.9 1.000 37690.2 1.000 7492.7 0.880 15678.7
0.971 17265.2 1.000 17638.6
Figure 3-5. Binary P-x diagram for the binary EtOAc + MES at 323.15 K. (●) Experimental data, (▬ ▬) UNIFAC, (▬) Regressed NRTL - HOC.
0
10000
20000
30000
40000
0 0.2 0.4 0.6 0.8 1XEtOAc
P (P
a)

85
Figure 3-6. Binary P-x diagram for the binary AcOH + MES at 323.15 K. (●) Experimental data, (▬ ▬) UNIFAC, (▬) Regressed NRTL - HOC.
Figure 3-7. Binary P-x diagram for the binary H2O + MES at 323.15 K. (●) Experimental data, (▬ ▬) UNIFAC, (▬) Regressed NRTL - HOC.
0
2000
4000
6000
8000
0 0.2 0.4 0.6 0.8 1
XAcOH
P (P
a)
0
3000
6000
9000
12000
15000
0 0.2 0.4 0.6 0.8 1
XH2O
P (P
a)

86
Figure 3-8.Binary P-x diagram for the binary EtOH + MES at 313.15 K. (●) Experimental data, (▬ ▬) UNIFAC, (▬) Regressed NRTL - HOC.
Binary VLE were fitted to NRTL equation (Equation 2) using Hayden-O’Connell (HOC)
equation to model the vapor phase. HOC association parameters were obtained from ASPEN
database for H2O + EtOAc and H2O + EtOH and EtOH + EtOAc. For the binaries EtOAc +
MES, AcOH + MES, H2O + MES, EtOH + MES, MES + MES the HOC parameters are not
available, and they were assumed equal to those existing for interactions with ethyl acetate from
the same database summarized in Table 3-3.
(3-2)
0
5000
10000
15000
20000
0 0.2 0.4 0.6 0.8 1
XEtOH
P (P
a)
j ji ji m mi mij j ij m
i ijk ki k kj k kjj
k k k
x G x Gx G
lnx G x G x G
τ τ
γ = + τ −
∑ ∑∑
∑ ∑ ∑

87
The parameter adjust was performed with the regression tool in ASPEN by minimization
of the maximum likelihood objective function. A list of the NRTL parameters is presented in
Table 3-3. VLE model fits experimental data and improved predictions obtained by generalized
group contribution methods. Figures 3-4 to 3-7 present experimental P-x data compared with
NRTL-HOC and UNIFAC predictions.
Table 3-3. Binary parameter for NRTL-HOC models. Gij = exp(-ααααij ττττij), ττττij = (bij/T).
HOC Association Parameters
H2O EtOH EtOAc AcOH MES
H2O 1.7 1.55 1.3 2.5 1.3
EtOH 1.55 1.4 1.3 2.5 1.3
EtOAc 1.3 1.3 0.53 2 0.53
AcOH 2.5 2.5 2 4.5 2
MES 1.3 1.3 0.53 2 0.53
NRTL
EtOAc AcOH H2O EtOH
MES MES MES MES
bij 191.701 -176.711 880.7603 -292.308
bji -142.115 302.7477 -200.977 400.6306
ααααij 0.3 0.3 0.3 0.3
For the case of H2O + MES, the experimental data do not exhibit the liquid-liquid phase
splitting predicted by UNIFAC. In mixtures with EtOAc and AcOH (less polarity, less hydrogen
bonding) UNIFAC predictions are quite good. This behavior has been recognized before in
systems with succinic acid derivatives [18]. This indicates that UNIFAC can be used with
reasonable confidence to predict phase equilibria in mixtures of MES with low polarity

88
components such as diethyl succinate, diethyl ether. Binary interaction parameters for those
mixtures are also required for the complete modeling of the esterification system.
3.5 Conclusions
MES was produced at by partial esterification of SAnh with EtOH using Amberlyst 15 as
catalyst. After separation and refining high purity MES (> 99 %) was obtained as confirmed by
NMR analysis. MES vapor pressure was measured from 417-471 K and results agreed with
previous reports. Parameters for Antoine equation were obtained by fitting using regression in
ASPEN. VLE experiments at constant temperature were evaluated in binary mixtures of EtOAc
+ MES, AcOH + MES and H2O + MES at 323.15 K and the binary EtOH + MES at 313.15.
Finally experimental data were fitted with the NRTL equation to obtain binary interaction
parameters for phase equilibria calculation. VLE modeling using NRTL and HOC equation for
the vapor phase agrees with experimental observations. Reasonably good predictions of VLE
using UNIFAC method were also obtained in binary mixtures of MES with components of low
polarity. The parameters obtained in this work will represent the VLE reasonably well for
reactive distillation design purposes and can be used to develop activity-based kinetics.

89
REFERENCES

90
3.6 REFERENCES
[1] S. Varadarajan, D. J. Miller. Biotechnol. Prog. 15 (1999) 845-854. [2] D. J. Miller, N. Asthana, A. Kolah, D. Vu, C. T. Lira. Process for reactive esterification
distillation. (2006) US Patent application 20060252956. [3] D. Sutton, G. Reed, G. Hiles. Process for the production of esters of mono-, di or
polycarboxylic acids. (2007) US Patent 5599976. [4] S. V. Budarin, R. Luque, D. Macquarrie, J. Clark. Chem. Eur. J. 13 (2007) 6914-6919. [5] C. Delhomme, D. Weuster-Botza, F. E. Kühn. Green Chem. 11 (2009) 13–26. [6] J. Zeikus, M. Jain, P. Elankovan. Appl. Microbiol Biotechnol. 51 (1999) 545-552. [7] P. Rogers, J. Chen, M. Zidwick. Organic Acid and Solvent Production, Part I: Acetic, Lactic,
Gluconic, Succinic and Polyhydroxyalkanoic Acids. Chapter 3.1. Prokaryotes 1 (2006) 511–755.
[8] A. Cukalovic, C. V. Stevens. Biofuels, Bioprod. Biorefin. 2 (2008) 505–529. [9] M. J. MacDonald, L. A. Fahien, R. J. Mertz, R. S. Rana. Arch. Biochem. Biophys. 269
(1989) 400-6. [10] L. Ladrière, W. J. Malaisse. Ann. Nutr. Metab. 41, 2 (1997) 118-125. [11] M. M. Kadiata, W. J. Malaisse. Diabetes Research 33, 6 (1998) 237-243. [12] L. Pari, R. Saravanan. Chem. Biol. Interact. 169, 1 (2007) 15-24.

91
[13] R. Saravanan, L. Pari. Mol. Cell. Biochem. 296, 1-2 (2007) 165-76. [14] G. Sabitha, R. Srividya, J. S. Yadav. Tetrahedron 55, 13 (1999) 4015-4018. [15] Ş. Kırbaşlar, S. Şahin, M. Bilgin. J. Chem. Eng. Data. 52 (2007) 1108–1112. [16] Ş. Kırbaşlar, S. Şahin, M. Bilgin. J. Chem. Thermodyn. 39 (2007) 1463–1469. [17] A. Orjuela, A. Yanez, D. Vu, D. Bernard-Brunel, D. J. Miller, C. T. Lira. Fluid Phase
Equilibr. 290, 1-2 (2010) 63-67. [18] A. Orjuela, A. Yanez, P. Rossman, D. Vu, D. Bernard-Brunel, D. J. Miller, C. T. Lira. Fluid
Phase Equilibr. 290, 1-2 (2010) 68-74. [19] H. Renon, J. M. Prausnitz. AIChE J. 14 (1968) 135-144. [20] Aspentech, ASPEN Physical Property System, physical property models/methods,
Burlington, 2007. [21] U. Weidlich, J. Gmehling. Ind. Eng. Chem. Res. 26 (1987) 1372-1381. [22] J. Gmehling, J. Li, M. Schiller. Ind. Eng. Chem. Res. 32 (1993) 178-193. [23] J. Walker. J. Chem. Soc. Trans. 61 (1892) 696-717. [24] E. Fourneau, S. Sabetay. Bulletin de la Societe Chimique de France. 43 (1928) 859-61. [25] M. Dana, M. Campagnole, M. J. Bourgeois, E. Montaudon, S. Laugier. Recent Res. Devel.
Org. Chem. 5, 1 (2001) 1-7. [26] R. Reddy, P. Lyengar, G. Nagendrappa, B. Prakash. Catal. Letters 101, 1–2, (2005) 87-91.

92
[27] F. H. Wang, P. F. Zou, W. Lei, M. Z. Xia, F. Y. Wang. Jiangsu Huagong. 33, Suppl. (2005)
170-172. [28] C. R. Reddy, G. Nagendrappa, B.S. Jai Prakash. Catal. Commun. 8 (2007) 241–246. [29] J. H. Clark, V. Budarin, T. Dugmore, R. Luque, D. J. Macquarrie, V. Strelko. Catal
Commun. 9 (2008) 1709–1714. [30] A. Kolah, N. Asthana, D. Vu, C. T. Lira, D. J. Miller. Ind. Eng. Chem. Res., 2008, 47, 15
(2008) 5313–5317. [31] Amberlyst 15 dry. Industrial grade strongly acidic catalyst. Technical data sheet. Rohm and
Haas, Philadelphia, USA. 2006. [32] S. R. Hoover, J. Harry, E. F. Mellon. Anal. Chem. 25, 12 (1953) 1940-1941. [33] D. Vu, C. T. Lira, N. Asthana, A. Kolah, D. J. Miller. Chem. Eng. Data, 51 (2006) 1220-
1225. [34] D. Vu. Properties and separations of plant-derived chemicals. Thesis (Ph. D.) Michigan
State University. Dept. of Chemical Engineering and Materials Science. Michigan, USA. (2007).
[35] J. Regourd, A. A. Ali, A. Thompson. J. Med. Chem. 50, 7 (2007) 1528-1536. [36] L. N. Monsalve, M. Y. Machado, A. A. Ghini, A. Baldessari. Tetrahedron. 64, 8 (2008)
1721-1730. [37] Scifinder (2010) CAS-1070-34-4, Chemical Abstracts Service: Columbus, OH. [Online].
Available: https://scifinder.cas.org. Accessed May, 2010. [38] Beilstein Database – Abstracts. Beilstein Institute zur Foerderung der Chemischen
Wissenschaften. CAS-1070-34-4. Accessed May, 2010.

93
4. Solubility and Phase Equilibria for Mixtures with Succinic Acid
4.1 Summary
Solubility of succinic acid in binary mixtures with ethyl acetate, diethyl succinate, diethyl
ether, ethanol and water was measured at temperatures from 278 K to 313 K. Using experimental
and reported data together with a solid-liquid equilibrium model, activity coefficients for
succinic acid in solution were obtained. In order to ensure thermodynamic consistency of the
model, thermal properties for succinic acid were reviewed and studied experimentally using
differential scanning calorimetry (DSC) at atmospheric pressure and high pressure (ca. 7 MPa).
Heat capacities for solid and liquid phases as well as enthalpy of fusion were obtained from
calorimetric measurements. Binary parameters for the NRTL equations were obtained by fitting
experimental and reported solubility data. The model agrees reasonably well for binary and
ternary mixtures.
4.2 Introduction
Succinic acid (SA) obtained by fermentation is considered a major building block for the
chemical bio-refinery. It can be used as feedstock and intermediate in production of solvents,
surfactants, biodegradable polymers, specialty chemicals and commodities. Commonly, SA
produced by fermentation is obtained in diluted aqueous solutions. These solutions might contain
other carboxylic acids mainly acetic acid (AcOH), and also small amounts of pyruvic, lactic,
and/or formic acid [1, 2], making difficult to isolate SA as pure crystals. Among the different

94
alternatives to retrieve carboxylic acids from fermentation broths, esterification has proven
success [3-6]. In the case of SA, a complex mixture of acids and esters are obtained during the
recovery process.
When esterification is carried out with EtOH using acid catalysts, diethyl succinate
(DES) is produced. This ester is used as solvent, as additive in fragrance formulation, and
potentially in the near future as an economical feedstock for butanediol or PBS biodegradable
polymers (polybutilene succinate). Together with DES, ethyl acetate (EtOAc) is the major
byproduct, and dehydration of EtOH to diethyl ether (DEE) has been observed [7]. A scheme of
the process reaction network is presented in Figure 4-1.
Figure 4-1. Chemical network scheme for mixed acids recovery process by esterification.
Succinic Acid Monoethyl Succinate Ethanol
Diethyl Succinate Monoethyl Succinate Ethanol
Acetic Acid Ethyl Acetate Ethanol
H2OOH
O
O
OH O
O
O
OHOH+ + H2OOH
O
O
OH O
O
O
OHOH+ +
H2OH2O
H2OH2O
2H2O2H2O
Ethanol Diethyl ether

95
In these complex mixtures of polar and non-polar components (generally recognized as
highly non-ideal) SA may dissolve, precipitate or react depending on the phase equilibria and
kinetic of reactions.
In order to evaluate feasibility of a recovery method by esterification and to compare it
with traditional recovery methods, computational modeling based upon reliable phase equilibria
and chemical kinetics is required. In the open literature there are many studies describing
physicochemical properties of pure solid SA, but only few on SA in mixtures. Equilibrium data
in binary mixtures with water (H2O) have been extensively reported [8-13], but only few in other
solvents [13-17]. In previous studies, only the binary SA + H2O phase equilibria have been
modeled and in this case generalized group contribution and local composition methods have
been used. In all cases only one of these: solubility data [11, 18], vapor pressure [18], or H2O
activity [19-23], have been used to regress or compare agreement with the models. In some cases
predictions do not agree with experimental data or present inconsistency when both solubility of
SA and water activity are considered simultaneously [11, 17].
In previous work [24, 25], phase equilibria of DES in binary and ternary mixtures were
studied and local composition models were used to predict reasonably well non-idealities for this
kind of mixtures. In this work experimental and literature SA solid-liquid equilibria (SLE) data
were used to fit binary parameters for the NRTL equation [26]. Solubility data for the binaries
SA+DES, SA+DEE, SA+EtOAc, SA+H2O and SA+EtOH were measured in the range of
283.15K to 313.15 K at 101.325 kPa. Thermal analyses on solid SA and succinic anhydride
(SAnh) were performed to confirm reports on physical properties (melting point, lambda
transition and heat capacities) used on SLE calculation.
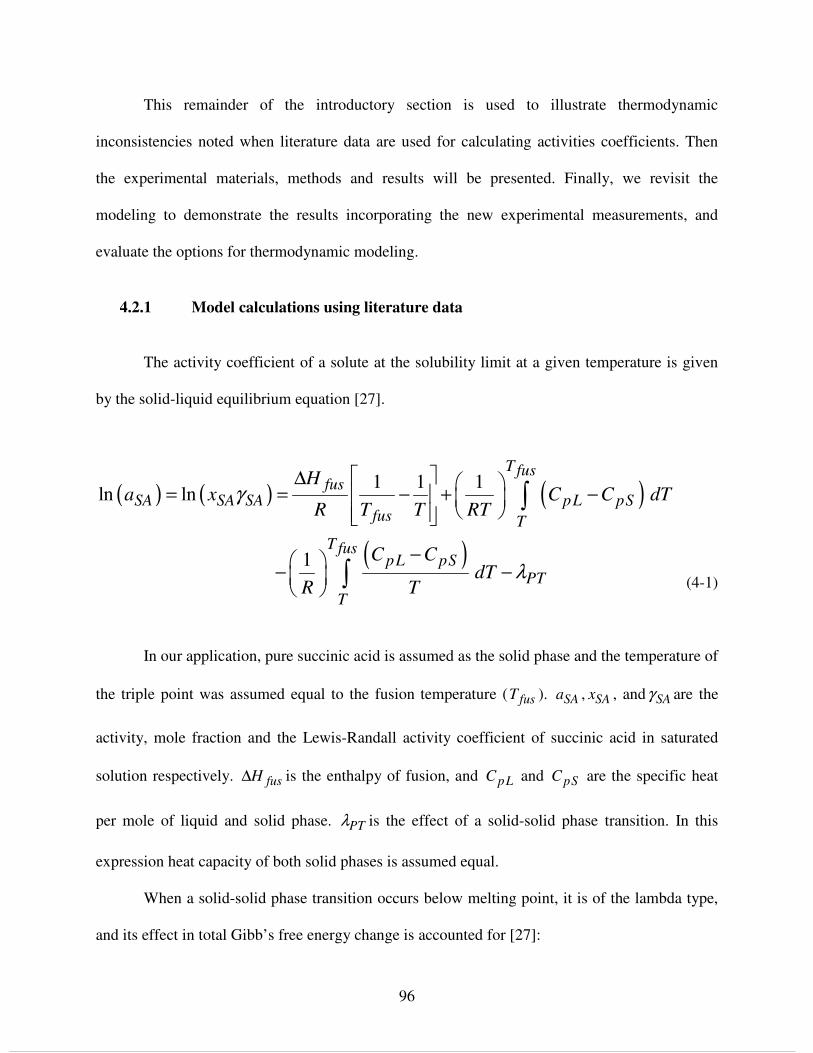
96
This remainder of the introductory section is used to illustrate thermodynamic
inconsistencies noted when literature data are used for calculating activities coefficients. Then
the experimental materials, methods and results will be presented. Finally, we revisit the
modeling to demonstrate the results incorporating the new experimental measurements, and
evaluate the options for thermodynamic modeling.
4.2.1 Model calculations using literature data
The activity coefficient of a solute at the solubility limit at a given temperature is given
by the solid-liquid equilibrium equation [27].
(4-1)
In our application, pure succinic acid is assumed as the solid phase and the temperature of
the triple point was assumed equal to the fusion temperature ( fusT ). SAa , SAx , and SAγ are the
activity, mole fraction and the Lewis-Randall activity coefficient of succinic acid in saturated
solution respectively. fusH∆ is the enthalpy of fusion, and pLC and pSC are the specific heat
per mole of liquid and solid phase. PTλ is the effect of a solid-solid phase transition. In this
expression heat capacity of both solid phases is assumed equal.
When a solid-solid phase transition occurs below melting point, it is of the lambda type,
and its effect in total Gibb’s free energy change is accounted for [27]:
( ) ( ) ( )
( )
1 1 1ln ln
1
T fusfus
SA SA SA pL pSfus T
T fuspL pS
PT
T
Ha x C C dT
R T T RT
C CdT
R T
γ
λ
∆ = = − + −
− − −
∫
∫

97
(4-2)
where PTT and PTH∆ are the temperature and enthalpy of phase transition. It is known
that succinic acid has a lambda transition from a monoclinic crystal (β-form) to a triclinic crystal
(α-form). Reported conditions indicate that such transition [28-34] occurs in a broad range of
temperatures (up to 50-60 K near the equilibrium temperature). In addition to this there are some
challenges to obtain accurate measurements by calorimetric studies due to hygroscopic nature of
the acid (melting of the water content may look like a phase transition as mistakenly reported by
Parks and Huffman [29, 35], and currently included in NIST reports [36]). Water may also
interfere with sublimation [37] and dehydration to form succinic anhydride may interfere near
the melting temperature [38]. For these reasons, the solid-solid transition enthalpy for succinic
acid has not been reported. For similar aliphatic dicarboxylic acids, reported phase transition
enthalpies are all on the same order of magnitude [32, 33] (Oxalic 1.3 kJ/mol, malonic 1.6
kJ/mol, glutaric 2.4 kJ/mol, pimelic 1 kJ/mol), so for succinic acid it is assumed the average
between C3 and C5 dicarboxylic acids. Table 4-1 list reported data used for preliminary solid-
liquid equilibrium calculation.
Using the solid-liquid equilibrium model (Equation 4-1) together with experimental
solubility data in different solvents, binary parameters for NRTL equation are regressed. The
format of the equation corresponds to that used in Aspen Plus®
[40] and is presented in
Equations 4-3 and 4-4.
1 1PTPT
PT
H
R T Tλ
∆= −

98
Table 4-1. Properties of succinic acid.
Property Value Reference
fusT (K) 459
fusH∆ (kJ/mol) 32.945
PTT (K) 389.7
[36]
PTH∆ (kJ/mol) 2.0 ‡
LA -152.587
LB 2.2939
LC -4.35730E-03
pLC (J/mol K)
2 3( )pL L L L LC A B T K C T D T= + + +
(471-699 K)
LD 3.19590E-06
SA 26.2
SB 0.4252
pSC (J/mol K)
2( )pS S S SC A B T K C T= + +
(90-323 K) SC 0
[39]
‡ Assumed as average from reported data for C3-C5 dicarboxylic acids
(4-3)
(4-4)
Parameters adjustment was performed by minimization of the differences between
experimental and estimated activity coefficients over the entire range of compositions and
temperatures using a minimum squares method as described in the following objective function:
j ji ji m mi mij j ij m
i ijk ki k kj k kjj
k k k
x G x Gx G
lnx G x G x G
τ τ
γ = + τ −
∑ ∑∑
∑ ∑ ∑
( )ij ij ijG exp= −α τij
ij ijb
aT
τ = +

99
(4-5)
where n is the number of data points, SA Expγ − is the activity coefficient of succinic acid
computed from Equation (4-1) using experimental solubility data, and .SA Calcγ − is the activity
coefficient of succinic acid computed from NRTL model. For the specific case of the binary SA-
H2O there are also reports on water activity at 298.15 K [12, 19, 20, 41, 42]. In this case the
objective function also included differences of the activity coefficient of water.
According to Equation 4-1, the activity of SA in a liquid phase saturated with crystalline
SA depends on only temperature, regardless of the solvent, and it can be computed using
thermophysical properties from Table 4-1. In general, when temperature is close to the melting
point the first term in right hand side of Equation 4-1 is dominant, and integral terms tend to
cancel each other [43]. Figure 4-2 shows a comparison of: SA activity calculated using all terms
in Equation 4-1; calculated ignoring the integral terms; and calculations also neglecting lambda
transition.
Despite activities look similar in Figure 4-2, slight differences observed at temperatures far from
the melting point produce significant changes in the activity coefficient of SA in solution when
solubility data are used to convert the activities to activity coefficients. For instance, considering
solubility data reported for the binary system SA-H2O [8-11, 14], Figure 4-3 shows the effect on
the activity coefficient of SA.
( ) ( )2
. .1
1,
n
SA SA Exp SA Calc
k
f x Tn
γ γ− −=
= −∑

100
Figure 4-2. Temperature dependence of succinic acid activity in saturated solutions computed
from physicochemical properties. (●) - Equation 4-1, (∆) - Equation 4-1 without λPT term, (□) -
Equation 4-1 without CP integral terms, (×) - Equation 4-1 without λPT and CP integral terms. The inset figure shows the low concentration range.
It is clear that neglecting lambda transition effect does not change activity coefficients
significantly. In the other hand, including integral terms associated with the sensible part of the
enthalpy change from the solid state to a subcooled liquid phase creates significant difference
mainly at low concentrations of SA (low temperature). From the thermodynamic point of view
one of these models (including or neglecting integral terms) is not consistent with water activity
data because the slopes of the curves in Figure 4-3 have opposite signs.The activity data for
water cited above result in a water activity coefficient with a negative slope plotted vs. xw at low
0
0.2
0.4
0.6
0.8
1
270 320 370 420 470
T (K)
Act
ivity
of
SA
0
0.05
0.1
0.15
270 290 310 330 350 370

101
concentrations of SA, thus the succinic acid activity coefficient should have a positive slope
plotted vs. xw in the same concentration range, according to Gibbs-Duhem equation. The
calculations including the integrals in equation (4-1) are inconsistent with the activity
coefficients of water. Because solubility data from different sources agree, inconsistency found
computing SLE might be explained by the physical properties reported for SA. While NIST
reports [36] for fusT and fusH∆ are similar to those measured in recent works [37, 44],
experimental values for heat capacities are only available for the solid phase. Values obtained
with equation for solid heat capacity in Table 4-1 agrees in the lower part of its applicability
range with reported data [29, 35] but there is no data available to validate at higher temperatures.
In the case of liquid heat capacity there are no experimental data to validate calculations.
.
Figure 4-3. Succinic acid activity coefficient in saturated aqueous solutions from reported
solubility data [8-11, 14]. (●) - Equation 4-1, (∆) - Equation 4-1 without λPT term, (□) - Equation
4-1 without CP integral terms, (×) - Equation 4-1 without λPT and CP integral terms.
-0.7
-0.35
0
0.35
0.7
1.05
0 0.2 0.4 0.6 0.8x SA
ln γ
SA

102
Using contribution methods [45-47] to estimate the difference of liquid to solid heat
capacities ( p pL pSC C C∆ = − ) at 298.15 K, widely varying values of the difference are
obtained, 69.6 J/mol K [44] compared to 1.3 J/mol K [47]. Using equations from Table 4-1
results in a value of 75.7 J/mol K. This large variation in heat capacities has been overlooked by
several authors leading to contradictory predictions of the activity coefficient for SA as reported
for water solubility [11, 17].
4.3 Material and methods
4.3.1 Materials
Succinic acid and succinic anhydride (>99.5 %, Sigma-Aldrich), diethyl succinate
(99.92%, Sigma-Aldrich), ethanol (200 proof, Decon Labs), water (HPLC grade, J.T. Baker),
ethyl acetate (99.99%, EMD), and diethyl ether (EMD chemicals, 99.9%) were used for
experiments and calibration without further purification. Purity was confirmed by gas
chromatography and it water was the only appreciable impurity.
4.3.2 Experimental procedures
4.3.2.1 Solubility
Solubility data were determined on a mass basis. Solid SA and the solvent were placed in
a closed glass vial (20 cm3) and stirred with magnetic bar. The amount of SA in every vial was
higher than the solubility limit at the experiment temperature to ensure saturation of the liquid
phase. These vials were placed in an isothermal bath equipped with a circulator pump and
temperature control (Isotemp immersion circulator 730, Fisher Scientific, ± 0.1 K). For low
temperature experiments a stainless steel coil connected to a recirculation chiller was submerged

103
in the bath. The temperature was measured with an ASTM certified glass thermometer (model 64
C, ± 0.1 K). After the equilibration period (around 2 h) the stirring was stopped and two liquid
samples were removed from the solution on every vial. The samples were centrifuged at 8000
rpm for 2 min to remove suspended crystals. An aliquot (around 1 g) from the supernatant liquid
was weighted (Sartorius R 300 S, ± 0.1 mg) and titrated with a NaOH solution prepared in
EtOH/H2O mixture until final point with phenolphthalein. When a low solubility was expected
(non-polar solvents) a 0.01 M NaOH solution was used for titration, while for higher solubility
the solution was 0.1 M. The procedure was repeated with the second sample obtained from every
vial and the average solubility is reported.
4.3.2.2 Calorimetric analysis
Calorimetric measurements were performed using differential scanning calorimetry at
atmospheric pressure (Mettler-Toledo DSC1) and at high pressure (Mettler-Toledo HPDSC
827e). Samples around 10 mg were weighed (Mettler-Toledo AB265-S, ± 0.01mg) and heated in
hermetically sealed aluminum crucibles at 10 K/min under nitrogen flow (20 cm3/min) over a
range of temperature of 223.15 to 523.15 K. Equilibration time at the initial and final
temperature of 4 minutes was used. The procedure was repeated at least twice to observe changes
in the sample during calorimetric analysis. To avoid decomposition and sublimation, the liquid
phase heat capacity was measured under nitrogen pressure at 6.89 MPa. Calibration using
ASTM-1269 standard method [48] was made using a 23.62 mg sapphire standard disc.
4.4 Experimental Results
4.4.1 Calorimetric analysis

104
Calorimetric scans on succinic acid were performed to evaluate heat capacities for solid
and liquid phase in the interval of interest. A typical calorimetric analysis for SA by DSC is
presented Figure 4-4.
A small peak repeatedly observed around 410 K is consistent with previous observations
of the β → α lambda phase transition in the solid state [28, 31, 34, 37] and it is in the range of
±30 K around the equilibrium temperature (Table 4-1) reported by Petropablov [30]. An enthalpy
change of 0.162 kJ/mol was obtained after analysis of the thermal event, but considering that the
broad range of transition increases uncertainty in the integration, assumed value in Table 4-1 is
used in calculations, though it makes an insignificant contribution to the resulting models. Scans
at atmospheric pressure (Figure 4-4(a)), exhibit a change of weight of the solid sample during
each cycle (7% first cycle, 6.86% second cycle) that is consistent with dehydration reaction to
SAnh at high temperature [38]. This is confirmed by the appearance of a peak in successive
cycles around the melting point of SAnh (392 K) shown by a standard in Figure 4-5.
In the first cycle at atmospheric pressure in Figure 4-4(a) an endothermic event possibly
associated with water evaporation (produced by dehydration) is noticed above the SA melting
temperature. In subsequent cycles after the major part of water is removed a clear peak around
the reported boiling point for SA (508 K) is observed but still accompanied by a large tail. The
shift of SA melting temperature on second and third scanning cycles is suggestive of solid (SA) –
liquid (SAnh) solutions. The thermal decomposition was mostly suppressed by using high
pressure DSC as shown in Figure 4-4(b). Even at higher temperatures, negligible weight change
was recorded at the end of the runs. Even though a small peak around SAnh melting temperature
was observed, peak area is much smaller than that observed operating under atmospheric
pressure.

105
Figure 4-4. Calorimetric curves obtained by DSC at 10 K/min. Successive measurements at (a) 101.325 kPa and (b) 6892.8 kPa. (▬) - Cycle 1, (▬ ▬) - Cycle 2, (▬) - Cycle 3. The insert in figures shows thermal event at reported solid phase transition temperature in cycle 1.
b
-110
-70
-30
10
300 370 440 510 580T (K)
Hea
t Flo
w (
W)
-6.5
-5.5
-4.5
380 420 460
a
-110
-70
-30
10
200 270 340 410 480 550T (K)
Hea
t Flo
w (
W)
-3
-2
-1
380 420 460
106
At high pressure it has been proposed that any water released by dehydration remains in
the system and reacts back to SA as the system cools [49]. Change in peak shape observed in
different curves at high pressure (Figure 4-4b) might be caused by the change of crystalline form
of solid SA during heating and cooling cycles. Also the small amount of SAnh observed might
shift peak location compared with pure SA.
In order to minimize decomposition of the solid during heat capacity measurements,
scanning was carried out up to 493.15 K, and calorimetric curves are presented in Figure 4-5.
Due to the characteristics of the machine, calorimetric data from the high pressure DSC
presented scatter mainly at low temperatures, so it was only used to calculate liquid phase heat
capacity. Figure 4-6 and 4-7 shows heat capacity of SA and SAnh varying with temperature
compared with reported equations (Table 4-1) [39].
In the lower range of temperatures, heat capacity for solid SA agree with those previously
reported [29] and the correlation from Table 4-1 fits data up to the lambda transition temperature.
A change in the solid heat capacity is observed after solid phase transition. However it seems
that experimental heat capacity of the liquid is higher (~ 20%) than predicted and the heat
capacity measurements indicate an unexpected decrease of liquid Cp with temperature. Due to
the scatter on heat capacity for the liquid phase at high temperature data are not correlated or
used further in this study. In the case of SAnh neither of liquid or solid phase heat capacity [39]
from literature agrees with experiments. In this case predicted solid heat capacity is in average 12
% lower than experimental, while for the liquid phase is ~ 15% higher than measured data.

107
Figure 4-5. Calorimetric curves obtained by DSC during heat capacity measurement under N2 atmosphere, temperature range 303.15 K – 493.15 K at 10 K/min. (a) 101.325 kPa; (b) 6892.8 kPa. (▬) - Reference aluminum pan, (▬) - Sapphire standard, (▬ ▬) - Succinic anhydride, (- -) - Succinic acid.
-180
-130
-80
-30
20
300 370 440 510
T (K)
Hea
t Flo
w (
mW
)
a
-120
-85
-50
-15
20
270 320 370 420 470 520T (K)
Hea
t Flo
w (
mW
)
b

108
Figure 4-6. Heat capacity of succinic acid. (a) Solid phase, (▬) - This work at 101.325 kPa, (×) - Reported data [29], (▬) - Literature correlation [39], (▬ ▬) - Fitted correlation of experimental data for solid phase after lambda transition. (b) Liquid phase, (▬) - This work at 101.325 kPa, (○) - This work at 6892.8 kPa. (▬) - Literature correlation [39].
100
200
300
400
200 250 300 350 400 450
T (K)
Cp
(J/m
ol K
)
a
200
400
600
800
465 475 485 495 505
T (K)
Cp
(J/m
ol K
)
b

109
Figure 4-7. Heat capacity of succinic anhydride. (a) Solid phase, (b) Liquid phase. (▬) - This work at 101.325 kPa, (▬ ▬) - Fitted correlation of experimental data, (▬) - Literature correlation [39].
A summary of physicochemical data obtained during calorimetric studies for both SA and
SAnh is presented in Table 4-2.
a
100
140
180
220
270 320 370 420
T (K)
Cp
(J/m
ol K
)
b
160
200
240
280
370 420 470 520
T (K)
Cp
(J/m
ol K
)

110
Table 4-2. Thermophysical properties of SA and SAnh obtained by DSC.
Property SA SAnh
fusT (K) 456.8 ± 1 391.8 ± 1
fusH∆ (kJ/mol) 34.6 ± 1 17.1 ± 0.5
PTT (K) 413 ± 2 -
PTH∆ (kJ/mol) 0.162 -
Range (K) 420-445 310-370
SA 0.5452 26.298 pSC (J/mol K)
( )pS S SC A B T K= +
(410-445 K) SB 2.1834 0.3408
Considering that the heat capacity of SA solid phases are different, every integral term in
Equation 4-1 must be divided into two ranges, one up to PTT and the other up to fusT , including
the correspondent expression for the solid heat capacity.
Taking into account scatter in data for SA liquid heat capacity, and even though literature
correlation seems to underpredict it by around 20%, these equations were used to correlate SLE
when integral terms in Equation 4-1 were evaluated.
4.4.2 Solubility data and SLE modeling
Experimental solubility data obtained in different solvents are listed in Table 4-3 and
agree with previous reports indicating the reliability of the experimental method. These data
together with literature values were correlated with Equation 4-1 using different heat capacities
for the both solid phases and PTT from Table 4-2. Solubility of SA in H2O was studied to check
consistency of experimental data because activity of the solvent was available. NRTL binary

111
parameters were regressed for both, including and neglecting integral terms in SLE equation.
Figure 4-8 shows solubility of SA in H2O and correlation with Equation 4-1.
Table 4-3. Solubility of succinic acid in different solvents (g SA/100 g solution).
Solvents
EtOAc DEE DES EtOH H2O T(K)
(± 0.01) (± 0.05) 278.15 0.27 0.28 0.15 5.46 3.50 283.15 0.33 0.32 0.16 6.18 4.27 288.15 0.37 0.37 0.17 7.17 5.29 293.15 0.43 0.41 0.18 8.07 6.33 298.15 0.50 0.48 0.22 9.15 7.93 303.15 0.59 0.54 0.26 10.28 9.32 308.15 0.73 0.33 11.59 11.24 313.15 0.83 0.38 12.78 12.28
Figure 4-8. Succinic acid solubility in H2O. (●) - Marshal [8],(×) - Davis [9], (∆) - Apelblat [10], (□) - Lin [11], (○) - Yu [14], (+) - This work, (▬) - NRTL model without integral terms, (▬ ▬) - NRTL model with integral terms.
0
0.2
0.4
0.6
0.8
1
260 310 360 410 460T (K)
wSA

112
Despite agreement with solubility data is similar with both models, when activity and
activity coefficient of H2O are considered (Figure 4-9), the model without integral terms predicts
the succinic acid activity coefficient trend consistent with the water activity coefficient data
reported in literature.
Activities calculated by group contribution methods (UNIFAC), an electrolyte model
[21] and Equation 4-1 using NRTL including integral terms, are all over-predicting the activity
coefficient of water. Besides in these models the slope of the curve of activity coefficient has the
opposite sing compared with experimental data. This has also been reported by using other
equations like COSMO-RS [17].
Results of our study indicate that literature reports on activity of H2O are consistent with
a model without integral terms in equation (4-1). This observation may indicate that either
reported activities of water in solution are wrong; integral terms on Equation 4-1 are not correct;
or some other thermodynamic factor not considered in the model is important such as
dissociation. Considering that our measurements confirmed literature data for all properties
except for the liquid heat capacity of SA, further regression of experimental solubility are carried
out using Equation 4-1 without integral terms as previously reported [11]. In addition to this,
although not presented here, regression results using all terms in Equation 4-1 were not able to
model accurately solubility data in other solvents or in ternary mixtures.Figures 4-10 and 4-11
show the correlation obtained for solubility data in EtOH and H2O + EtOH mixtures when heat
capacity integrals are neglected. Experimental and reported SA solubility in AcOH, EtOAc,
DES, and DEE are presented in Figures 4-12 and 4-13. Good agreement with experimental data
is observed and parameters of NRTL equation are listed in Table 4-4.
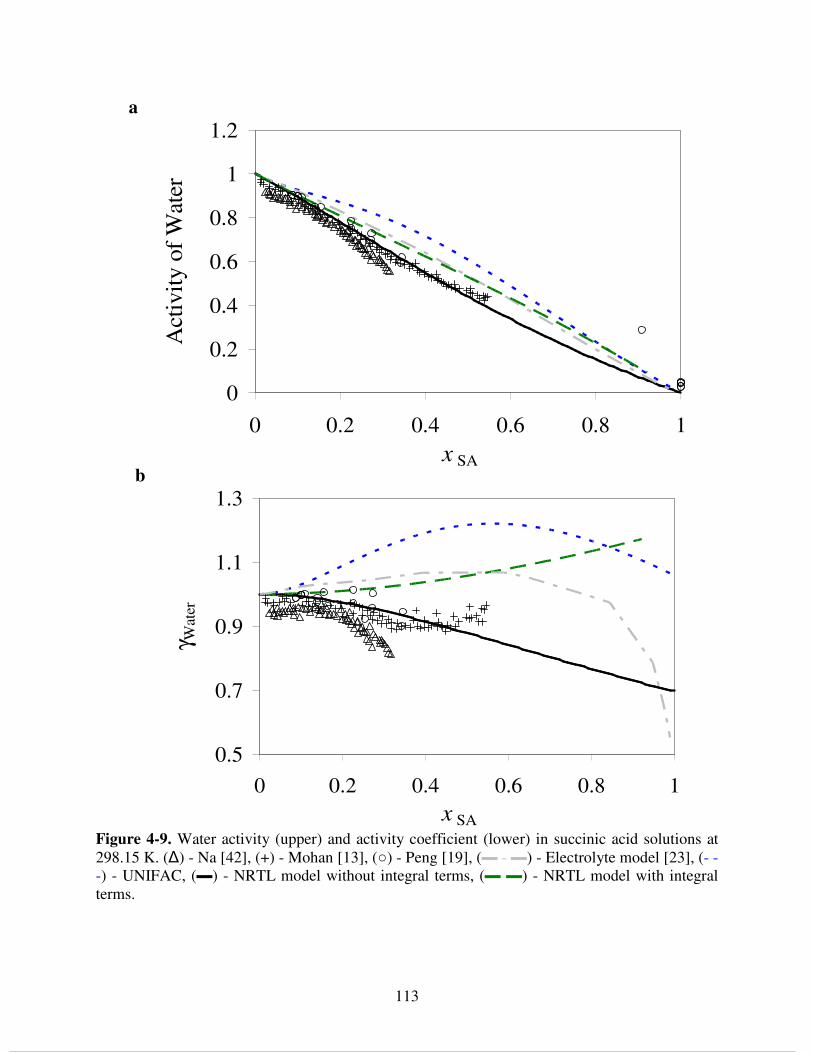
113
Figure 4-9. Water activity (upper) and activity coefficient (lower) in succinic acid solutions at 298.15 K. (∆) - Na [42], (+) - Mohan [13], (○) - Peng [19], (▬ - ▬) - Electrolyte model [23], (- - -) - UNIFAC, (▬) - NRTL model without integral terms, (▬ ▬) - NRTL model with integral terms.
0
0.2
0.4
0.6
0.8
1
1.2
0 0.2 0.4 0.6 0.8 1x SA
Act
ivity
of
Wat
er
a
0.5
0.7
0.9
1.1
1.3
0 0.2 0.4 0.6 0.8 1x SA
γ Wat
er
b

114
Figure 4-10. Succinic acid solubility in EtOH: (●) - Mohan [13], (×) - Yu [14], (+) - This work, (▬) - NRTL model. Solubility in azeotropic EtOH: (□) - Benedict [15], (▬ ▬) - NRTL model.
Figure 4-11. Succinic acid solubility in H2O – EtOH solutions at 213.15 K (○) - Bancroft [12]. (▬) - NRTL model.
0
0.1
0.2
0.3
0.4
0.5
0.6
260 300 340 380T (K)
wSA
0
0.05
0.1
0.15
0.2
0.25
0.3
0 0.2 0.4 0.6 0.8 1w H2O in solvent
wSA

115
Figure 4-12. Succinic acid solubility in AcOH (×) - Yu [14]. (○) - Song [50], (▬) - NRTL model.
Figure 4-13. Succinic acid solubility in DEE (∆ Washburn [16], □ This work), EtOAc (×) and DES (○). Lines calculated with NRTL model.
0
0.05
0.1
0.15
0.2
270 290 310 330 350 370
T (K)
wSA
0
0.004
0.008
0.012
0.016
0.02
270 290 310 330
T (K)
wS
A

116
Table 4-4. Binary parameters for the NRTL model.
NRTL
DEE EtOAc AcOH H2O EtOH DES
SA SA SA SA SA SA
aij 0 0 0 0 0 0
aji 0 0 0 0 0 0
bij 248.411 191.987 -386.393 296.722 -605.634 218.224
bji 1947.928 1976.63 2132.132 -328.506 113.448 1946.876
ααααij 0.3 0.3 0.3 0.3 0.3 0.3
4.4.3 Final remarks
Difficulties in measuring the high temperature liquid heat capacity of SA are not
completely understood. The decrease of SA liquid heat capacity observed in experiments is
consistent with a decomposition of the SA to SAnh, but our experiments give no direct evidence
that this occurred. Another interesting finding is that the remaining measurements generally
confirm the existing literature values and do not resolve the thermodynamic inconsistencies in
the activity coefficients of SA and water when the heat capacity integrals are included in
solubility calculations. Despite these uncertainties, thermodynamic models that completely
disregard the heat capacity integrals provide the best representation of the solubility data in both
pure and mixed systems.
4.5 Conclusions
Experimental and reported data on solubility of SA in binary and ternary mixtures were
correlated using a SLE model and NRTL equation to account for the non-ideality of the
mixtures. Calorimetric studies on SA and SAnh were carried out to obtain and validate

117
thermophysical properties required in the model, and results agreed with literature reports. A
correlation for the solid heat capacity for both SA and SAnh were obtained. Measurements of the
liquid heat capacity of SA were not considered reliable. Accurate thermodynamic modeling that
ignores the heat capacity integrals in the SLE equation gives the best results in this study.
Because the main goal of the study is to obtain a reliable model to calculate activities in
esterification mixtures with SA, the simplified model was acceptable. The model is able to
reproduce solubility data in binary and ternary mixtures as well as activity of the solvent in
aqueous solutions.

118
REFERENCES

119
4.6 REFERENCES
[1] J. Zeikus, M. Jain, P. Elankovan. Appl. Microbiol Biotechnol. 51 (1999) 545-552. [2] A. Cukalovic, C. V. Stevens. Biofuels, Bioprod. Biorefin. 2 (2008) 505–529. [3] R. Datta, S. P. Tsai. Esterification of fermentation derived acids via pervaporation. US
Patent 5723639. (1998). [4] M. C. Cockrem. Process for the production of organic acids and esters thereof. US Patent
6291708 B1. (2001). [5] D. Dunuwila Process for the direct production of esters of carboxylic acids from
fermentation broths. Canadian patent application 02657666. (2009). [6] C. Bauduin, W. Fischer, R. Pinkos, E. Scholten. Method of producing a carboxylic alkyl
ester. US patent application 0137825 A1. (2009). [7] P. K. Kiviranta-Pääkkönen, L. K. Struckmann, J. A. Linnekoski, A. O. Krause. Ind. Eng.
Chem. Res. 37 (1998) 18-24. [8] H. Marshall, D. Bain. Sodium Succinates. J. Chem. Soc, Trans. 97(1910) 1074-1085. [9] M. Davies, D. M. Griffiths. Trans. Faraday Soc. 49 (1953) 1405-1410. [10] A. Apelblat, E. Manzurola. J. Chem. Thermodyn. 19, 3 (1987) 317-320. [11] H. M. Lin, H. Y. Tien Y. T. Hone, M. J. Lee. Fluid Phase Equilibr. 253, 2 (2007) 130-136. [12] W. D. Bancroft, F. J. C. Butler. J. Phys. Chem. 36, 9 (1932) 2515-2520.

120
[13] R. Mohan, A. S. Myerson. J. Crystal Growth 206 (1999) 99-108. [14] Q. Yu, S. Black, H. Wei. J. Chem. Eng. Data. 54 (2009) 2123-2125. [15] D. J. Benedict, S. J. Parulekar, S. Tsai. J. Membr. Sci., 281, 1-2 (2006) 435-445. [16] E. W. Washburn. International Critical Tables of Numerical Data, Physics, Chemistry and
Technology (1st Electronic Edition). (pp: 148, 327, 413). Knovel. (1926 - 1930; 2003). [17] B. Schröeder, L. Santos, I. M. Marrucho, J. A. P. Coutinho. Fluid Phase Equilibr. 289, 2
(2010) 140-147. [18] I. K. Koponen, I. Riipinen, A. Hienola, M. Kulmala, M. Bilde. Environ. Sci. Technol. 41
(2007) 3926-3933. [19] C. Peng, M. M. Chan, C. K. Chan. Environ. Sci. Technol. 35 (2001) 4495-4501. [20] M. C. Maffia, A. Meirelles. J. Chem. Eng. Data. 46 (2001) 582-587. [21] T. Raatikainen, A. Laaksonen. Atmos. Chem. Phys. 5 (2005) 2475-2495. [22] A. I. Gaman, M. Kulmala, H. Vehkamäki, I. Napari. J. Chem. Phys. 120, 1 (2004) 282-291. [23] S. L. Clegg, J. H. Seinfeld. J. Phys. Chem. A. 110 (2006) 5692-5717. [24] A. Orjuela, A. Yanez, D. Vu, D. Bernard-Brunel, D. J. Miller, C. T. Lira. Fluid Phase
Equilibr. 290, 1-2 (2010) 63-67. [25] A. Orjuela, A. Yanez, P. Rossman, D. Vu, D. Bernard-Brunel, D. J. Miller, C. T. Lira. Fluid
Phase Equilibr. 290, 1-2 (2010) 68-74. [26] H. Renon, J. Prausnitz. AIChE J. 14 (1968) 135-144.

121
[27] P. B. Choi, E. McLaughlin. AIChE J. 29, 1 (1983) 150-153. [28] M. F. Dupré la Tour. Ann. de Phys. 10e série, t. XVIII. (1932) 199-284. [29] C. E. Vanderzee, E. F. Westrum. Succinic acid. J. Chem. Thermodynam. 2 (1970) 681-687. [30] N. N. Petropavlov, S. B. Yarantsev. Sov. Phys. Crystallogr. 28, 6 (1983) 666-670. [31] R. Wilhoit, J. Chao, H. Hall. J. Phys. Chem. Ref. data, 14, 1 (1985) 137. [32] A. Cingolani, G. Berchiesi. J. Thermal Analysis. 6 (1974) 87-90. [33] N. N. Petropavlov, I. G. Tsygankova, L. A. Teslenko. Sov. Phys. Crystallogr. 33, 6 (1989)
853-855. [34] S. Ponomarenko, Y. Y. Borovikov, T. E. Sivacheck, D. N. Vovk. Russian J. General Chem.
73, 11 (2003) 1769-1773. [35] G. S. Parks, H. M. Huffman. J. Am. Chem. Soc. 52 (1930) 4381-4391. [36] NIST Chemistry WebBook, NIST Standard Reference Database Number 69, Eds. P.J.
Linstrom and W.G. Mallard, National Institute of Standards and Technology, Gaithersburg MD, 20899, (2010) [Online]. Available: http://webbook.nist.gov/cgi/ cbook.cgi?Name= succinic+acid&Units=SI, [2010, March 22].
[37] V. Chikhalia, R. T. Forbes, R. A. Storey, M. Ticehurst. Eur. J. Pharm. Sci. 27 (2006) 19-26. [38] C. Pan, F. Liu, P. Sutton, R. Vivilecchia. Thermochimica Acta 435 (2005) 11-17. [39] C. L. Yaws. Yaws' Handbook of Thermodynamic and Physical Properties of Chemical
Compounds. Knovel. 2003.
122
[40] Aspentech, Aspen Physical Property System, physical property models/methods, Burlington, 2007.
[41] M. Davies, D. K. Thomas. J. Phys. Chem., 60, 1 (1956) 41–44. [42] H. Na, S. Arnold, A. S. Myerson. J. crystal growth. 149, 3-4 (1995) 229-235. [43] J. M. Prausnitz, R. N. Lichtenthaler, E. Gomes de Azevedo. Molecular Thermodynamics of
Fluid-Phase Equilibria (3rd Edition). Prentice Hall. 1998, p 635-367. [44] M. V. Roux, M. Temprado, J. S. Chickos. J. Chem. Thermodyn. 37, 9 (2005) 941-953. [45] J. S. Chickos, D. G. Hesse, J. F. Liebman. Struct. Chem. 4, 4 (1993) 261-269. [46] J. S. Chickos, S. Hosseini, D. G. Hesse, J. F. Liebman. Struct. Chem. 4, 4 (1993) 271-278. [47] E. S. Domalski, E. D. Hearing. J. phys. Chem. Ref. data, 22, 4 (1993) 805-1159. [48] ASTM Standard E1269-05, (2005) Standard test method for determining specific heat
capacity by differential scanning calorimetry, ASTM International, West Conshohocken, PA, 2005,DOI: 10.1520/E1269-05.
[49] C. Fumagalli, L. Spa. Succinic acid and succinic anhydride, In: Kirk–Othmer Encyclopedia
of Chemical Technology, Vol. 23, John Wiley & Sons, New York, pp. 416-435. 2010. [50] W. W. Song, P. S. Ma, Z. L. Xiang. J. Chem. Eng. of Chinese Universities 21, 2 (2007) 341-
344.

123
5. Kinetics of mixed succinic acid/acetic acid esterification with
Amberlyst 70 ion exchange resin as catalyst
5.1 Summary
Liquid phase esterification of succinic acid, acetic acid and succinic/acetic mixtures with
ethanol was studied using Amberlyst 70 strong cation exchange resin as catalyst. Batch
isothermal reactions were performed at different ethanol:acid molar ratios (1:1 – 27:1),
temperatures (343 – 393 °K) and catalyst loadings (1 – 9.3 wt% of solution). Esterification
kinetics are described using both pseudo-homogeneous mole fraction and NRTL-based activity
based models that take ethanol dehydration to diethyl ether into account. The models accurately
predict the esterification of individual acids, and a simple additive combination of independent
kinetic models provides a good description of mixed acid esterification. The kinetic models can
be used in simulation of reactive distillation processes for mixed acid esterification.
5.2 Introduction
Among several carboxylic acids obtained by fermentation, succinic acid (1,4-butanedioic
acid, herein SA) has been recognized as a renewable building platform for many chemical
derivatives of industrial interest [1-6]. Its potential use as feedstock for 1,4-butanediol,
tetrahydrofuran and γ-butyrolactone production opens the opportunity for a growing and
sustainable market of renewable polymers [7, 8]. Because SA is a common metabolite in many
anaerobic and facultative microorganisms, a number of promising fermentation processes have
been developed using bacteria isolated from gastrointestinal systems in animals, including

124
Anaerobiospirillum succiniciproducens (~50 kg/m3), Actinobacillus succinogenes (94-106
kg/m3), Mannheimia succiniciproducens (~52 kg/m
3), and Escherichia coli (~99 kg/m
3) [9-12].
Because of the complex reaction catabolism, the two major challenges in succinic acid
fermentation are low SA titer (g/liter) and loss of selectivity via byproduct formation. In addition
to cell growth and incomplete conversion, sugar substrate is lost via formation of significant
quantities of acetic, formic, pyruvic, and lactic acids depending on the organism. Typical acid
concentrations found in SA fermentation broths are listed in Table 5-1.
Table 5-1. Typical product concentrations in SA fermentation [12].
Component Concentration (kg/m3)
Succinic acid 40 – 110 Acetic acid 5 – 40
Pyruvic acid 0 – 20 Lactic acid 0 – 14 Formic acid 0 – 5
According to recent studies, recovery of succinic acid from these mixtures can be
accomplished by esterification with ethanol (EtOH) [13]. Esterification of SA proceeds
sequentially through a series reaction scheme in the presence of an acid catalyst, with monoethyl
succinate (MES) as intermediate and diethyl succinate (DES) as final product (Figure 5-1).
Because of chemical equilibrium limitations in esterification and the low solubility of SA in
ethanol (~10% by weight at 298 K), excess EtOH is required in reaction. Further, achieving high
rates and driving the reaction to completion requires continuous water (H2O) removal, thus
making esterification an attractive reaction system for reactive distillation (RD). For
esterification of carboxylic acids, a single continuous RD column can selectively separate either

125
product water or ester from the acid reactant as it is formed. The approach is powerful enough to
directly esterify acids in dilute solutions produced via fermentation [14-16], both enhancing the
overall recovery of acids as esters and making possible novel process approaches to obtain high
purity products.
Figure 5-1. Reactions: esterification of succinic acid (SA) to monoethyl succinate (MES) and diethyl succinate (DES); esterification of acetic acid (AcOH) to ethyl acetate (EtOAc); dehydration of EtOH to diethyl ether (DEE).
In SA esterification, it is not known whether the presence of byproduct acids (Table 5-1)
accelerates or inhibits SA conversion either kinetically or thermodynamically, or whether
formation and recovery of byproduct acid esters overcomplicates the recovery process. As part of
our efforts to develop RD strategies for succinic acid esterification, we thus have carried out this
Succinic Acid Monoethyl Succinate Ethanol
Diethyl Succinate Monoethyl Succinate Ethanol
Acetic Acid Ethyl Acetate Ethanol
H2OOH
O
O
OH O
O
O
OHOH+ + H2OOH
O
O
OH O
O
O
OHOH+ +
H2OH2O
H2OH2O
2H2O2H2O
Ethanol Diethyl ether

126
study of esterifying mixtures of SA and acetic acid (AcOH), the byproduct in greatest
concentration in SA fermentation (Table 5-1), with ethanol (EtOH) for the purpose of
understanding how AcOH affects SA esterification under process-relevant conditions.
In recent papers [17-19] it has been demonstrated that the strong cation exchange resin
Amberlyst 70®
, a low crosslinked styrene-divinylbenzene resin, showed superior performance
(e.g. higher turnover frequency) as an acid catalyst for etherification relative to the more
commonly used macroreticular ion exchange resins (e.g. Amberlyst 15). The high temperature
stability of Amberlyst 70, up to 463 K in some environments [19, 20], also makes it more
attractive from a process standpoint.
While there are reports of SA [21] and AcOH [22-29] esterification with EtOH using ion
exchange resins, none have used Amberlyst 70 as catalyst. We thus have measured and report
here the kinetics of AcOH and SA esterification, both individually and in mixtures, over
Amberlyst 70. In addition to ester formation, dehydration of EtOH to diethyl ether (DEE) occurs
at the elevated temperatures accessible with Amberlyst 70, so we include it as an integral part of
the kinetic model. The kinetics of mixed acid esterification, along with associated physical
property and phase equilibrium data, are useful in designing reactive distillation systems for
fermentation-derived SA esterification.
5.3 Material and methods
5.3.1 Materials
Succinic acid (>99.5 %, Sigma-Aldrich), acetic acid (99.9%, Aristar), diethyl succinate
(99.92%, Sigma-Aldrich), monoethyl succinate (89.3%, Sigma-Aldrich), ethyl acetate (HPLC
grade, J. T. Baker), ethanol (200 proof, Decon Labs), water (HPLC grade, J.T. Baker), diethyl

127
ether (EMD chemicals, 99.9%) n-butanol (99.9%, Mallinckrodt), and acetonitrile (HPLC grade,
EMD) were used without further purification for experiments and calibrations. Species purity
was confirmed by gas chromatography; no impurities, other than small amounts of water, were
detected in appreciable concentrations. Hydranal-coulomat E solution (Riedel-de Haën) was used
in Karl-Fisher analysis for water measurement. Amberlyst 70®
resin was purchased from Dow
Chemical Company; its physical and chemical properties are listed in Table 5-2.
Table 5-2. Physicochemical properties of Amberlyst 70®
[17-20].
Physical form Dark spherical beads
Ionic form H+
Acid equivalents (eq/kg) ≥ 2.55
Surface area (N2 - BET) (m2/g) 31-36
Average pore diameter (Å) 195-220 Effective size – dry solid (mm) 0.5
Pore volume (m3/kg) 1.5-3.3 x 10
-4
Particle porosity 0.19
Uniformity coefficient ≤ 1.5
Skeletal density (kg/m3) 1520
Swollen surface area (water) (m2/g) 176
Swollen particle porosity (water) (ε ) 0.57 Maximum operating temperature (K) 463
5.3.2 Experimental procedures
5.3.2.1 Catalyst conditioning
As-received Amberlyst 70 resin was sieved and the -45+60 mesh fraction (0.25-0.35 mm
diameter) was used in experiments. The resin was rinsed initially with water, followed by several
washing cycles with ethanol. After filtration and removal of excess liquid, the catalyst was dried

128
at 353 K under vacuum (1 kPa) and then stored in a sealed container in a vacuum oven prior to
use.
The ion exchange capacity of dry Amberlyst 70 was measured by titration with a 0.1 M
solution of NaOH in water using phenolphthalein as the indicator. The acid site density, obtained
as the average of three measurements, was 2.35 ± 0.1 eq/kg, a value consistent with the value of
2.55 eq/kg reported by the manufacturer [20].
5.3.2.2 Batch kinetic experiments
Isothermal batch kinetic experiments were performed in a Parr 5000 Multireactor®
system (Parr Instrument Co., Moline, Illinois) that includes six 75 cm3 stainless steel reactors
equipped with magnetic stirrer, temperature control, and sampling system with a stainless steel
frit on the sampling tube to avoid withdrawal of catalyst. Ethanol, AcOH, and SA were placed
into each reactor at room temperature in predetermined molar ratios along with the specified
quantity of catalyst; the total mass of reactants added was typically 0.050 kg. After sealing each
reactor, the stirring rate was set at 900 rpm and heating was initiated. It typically took 15 minutes
to reach the desired reaction temperature; this moment was taken as time zero (t = 0) of reaction.
During reaction, samples were withdrawn at specified time intervals starting at t=0, with a higher
frequency of sampling in the first 2-3 hr. Samples were transferred into hermetically sealed vials
and stored in a refrigerator before analysis.
5.3.3 Analysis
Reaction samples were analyzed both by gas and liquid chromatography. For HPLC,
samples were diluted 50-fold in water and analyzed in a system containing a Waters®
717

129
autosampler, a Waters®
410 refractive index detector, and a Perkin-Elmer LC90 UV detector. A
100 mm x 7.6 mm Fast Acid analysis column (BioRad®
) at 298 K along with a mobile phase of
5 mM H2SO4 in water flowing at 1.0 ml/min was used for the separation. Because the retention
times of EtOH and MES were similar, only UV detection was used to evaluate MES
concentration.
To evaluate concentration of volatile components, samples were diluted 20-fold into
acetonitrile containing 5.0 wt% n-butanol as an internal standard and analyzed on a gas
chromatograph (HP 5890 series II) equipped with thermal conductivity and flame ionization
detectors. A 30 m long Alltech Aqua WAX-DA column (0.53 mm i.d., 1.20 µm film thickness)
was used with the following temperature program: initial temperature 313 K for 3 min; ramp at
20 K/min to 523 K, and hold at 523 K for 0.5 min. The GC injection port was maintained at 543
K in a splitless mode, and detector temperature was 523 K. Helium was used as carrier gas (0.25
cm3/s) and liquid injection volumes of 0.5 µL were used.
For both analyses, standard samples of known composition in the range of interest were
injected in triplicate to obtain calibration curves repeatable to within ±0.5% by mass.
Karl-Fisher analysis (Aquacount coulometric titrator AQ-2100) was used to measure
water content in reagents and samples.
5.4 Results and discussion
The complete set of batch experiments carried out to characterize the reactions involved
in this study is given in Table 5-3.

130
Table 5-3. Experimental conditions of batch reactions.
RUN T
( K )
Mole Ratio
EtOH/SA
Mole Ratio
EtOH/AcOH
Catalyst loading
(g/g)
Time
( h )
1 363 - - 0.080 48 2 373 - - 0.088 24 3 388 - - 0.081 48 4 403 - - 0.080 48 5 363 - - 0.160 48 6 373 - - 0.175 24 7 388 - - 0.160 48 8 403 - - 0.160 48 9 373 - - 0.022 24
10 373 - - 0.044 24 11 373 - - 0.131 24 12 393 4.99 - 0.089 24 13 393 7.55 - 0.089 24 14 393 9.98 - 0.089 24 15 393 12.49 - 0.089 24 16 353 5.07 - 0.088 24 17 353 7.59 - 0.088 24 18 353 10.03 - 0.089 23.5 19 353 12.60 - 0.088 24 20 365 5.04 - 0.088 24 21 365 7.54 - 0.089 24 22 365 10.33 - 0.087 24 23 365 12.35 - 0.089 24 24 379 5.03 - 0.088 24 25 379 7.48 - 0.088 24 26 379 9.79 - 0.088 24 27 379 12.50 - 0.087 24 28 353 7.51 - 0.045 24 29 353 7.49 - 0.044 24 30 353 7.55 - 0.044 24 31 365 3.00 - 0.022 24 32 365 5.00 - 0.022 24 33 365 7.49 - 0.022 24 34 365 5.03 - 0.044 24 35 365 7.47 - 0.044 24 36 343 22.80 - 0.011 5 37 353 22.80 - 0.011 5 38 365 22.80 - 0.011 5 39 379 22.80 - 0.011 5 40 353 22.80 - 0.021 5 41 353 22.80 - 0.022 5 42 365 22.80 - 0.019 5 43 379 22.80 - 0.020 5 44 353 23.07 - 0.046 5
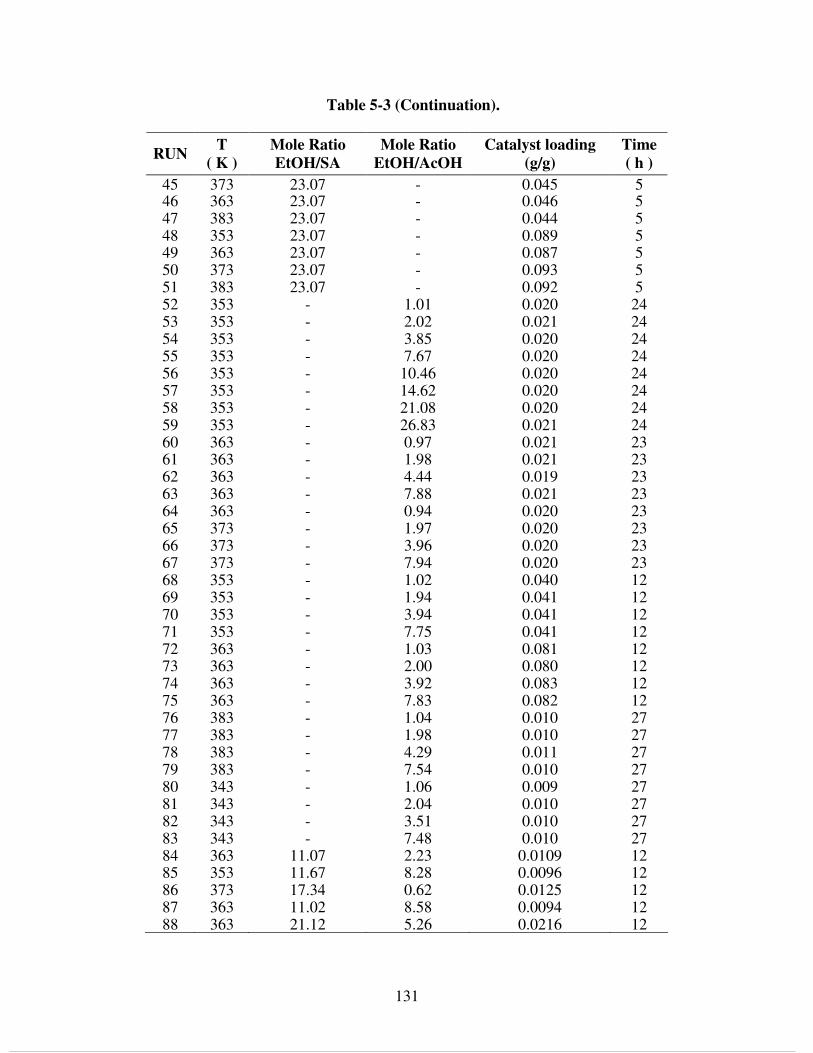
131
Table 5-3 (Continuation).
RUN T
( K )
Mole Ratio
EtOH/SA
Mole Ratio
EtOH/AcOH
Catalyst loading
(g/g)
Time
( h )
45 373 23.07 - 0.045 5 46 363 23.07 - 0.046 5 47 383 23.07 - 0.044 5 48 353 23.07 - 0.089 5 49 363 23.07 - 0.087 5 50 373 23.07 - 0.093 5 51 383 23.07 - 0.092 5 52 353 - 1.01 0.020 24 53 353 - 2.02 0.021 24 54 353 - 3.85 0.020 24 55 353 - 7.67 0.020 24 56 353 - 10.46 0.020 24 57 353 - 14.62 0.020 24 58 353 - 21.08 0.020 24 59 353 - 26.83 0.021 24 60 363 - 0.97 0.021 23 61 363 - 1.98 0.021 23 62 363 - 4.44 0.019 23 63 363 - 7.88 0.021 23 64 363 - 0.94 0.020 23 65 373 - 1.97 0.020 23 66 373 - 3.96 0.020 23 67 373 - 7.94 0.020 23 68 353 - 1.02 0.040 12 69 353 - 1.94 0.041 12 70 353 - 3.94 0.041 12 71 353 - 7.75 0.041 12 72 363 - 1.03 0.081 12 73 363 - 2.00 0.080 12 74 363 - 3.92 0.083 12 75 363 - 7.83 0.082 12 76 383 - 1.04 0.010 27 77 383 - 1.98 0.010 27 78 383 - 4.29 0.011 27 79 383 - 7.54 0.010 27 80 343 - 1.06 0.009 27 81 343 - 2.04 0.010 27 82 343 - 3.51 0.010 27 83 343 - 7.48 0.010 27 84 363 11.07 2.23 0.0109 12 85 353 11.67 8.28 0.0096 12 86 373 17.34 0.62 0.0125 12 87 363 11.02 8.58 0.0094 12 88 363 21.12 5.26 0.0216 12

132
Ethanol dehydration to diethyl ether (DEE) was studied in Runs 1 to 11; SA esterification
was examined in Runs 11 to 51; AcOH esterification was evaluated in Runs 52 to 83; and finally
mixed SA/AcOH esterification experiments were carried out in Runs 84 to 88. In these
experiments, the catalyst loadings used (0.5 to 9.3 wt% Amberlyst 70) correspond to the
equivalent acidity of 0.1 to 2.0 wt% H2SO4 in solution.
5.4.1 Mass transfer considerations
Preliminary SA esterification experiments in which agitation speed was varied showed
nearly identical conversion rates at all speeds above 500 rpm, indicating that no external liquid-
solid mass transfer resistances are present. Evaluation of intra-particle mass transfer effects is
carried out using the observable modulus ( wΦ ) and the Weisz-Prater criterion. For a spherical
particle
(5-1)
Here, †.Obs
r is the observed rate of reaction per mass of catalyst, CATρ and Pd are the
particle density and particle diameter of the catalyst, respectively, under reaction conditions (e.g.
the particle swelled state in EtOH), effD is the effective diffusivity of SA inside the catalyst
pores, and SAC is the concentration of SA in the bulk phase. Reaction rate †r can be calculated
as:
(5-2)
( )2
†
6P
CATObs
weff SA
dr
D C
ρ Φ =
†
CAT Sol
rr
w ρ=

133
where r is the rate of reaction per unit volume of reacting (liquid) phase determined as the
slope of the SA concentration vs. time curve, CATw is the mass of catalyst per mass of reacting
phase, and Solρ is density of the reacting phase.
A simple measurement showed that the swelling ratio (swelled volume PswollenV
divided by dry volume PdryV ) of Amberlyst 70 catalyst was 2.0 in EtOH. Assuming
homogeneous swelling of the spherical particles, the actual particle diameter is calculated as
(5-3)
Taking the average particle diameter of dry solids used in experiments as 0.30 mm, a
swelled particle diameter of 0.37 mm is obtained. Because of liquid absorption that gives
Amberlyst 70 a porosity similar to macroreticular resins [17- 19], the swelled particle density is
1000 kg/m3 as reported previously [30]. The effective diffusivity ( effD ) is estimated from the
liquid-phase diffusion coefficient ( SAD ) computed from the Wilke-Chang equation and by
assuming pore tortuosity (τ ) is the inverse of particle porosity (ε ) [30]. The effective
diffusivity of SA is thus given by
(5-4)
The Thiele modulus (φ ) and effectiveness factor (η ) for SA esterification can be
calculated from the observable modulus if it is assumed the reaction is pseudo-first order in SA
because of the large excess of EtOH present.
3 PswollenP Pdry
Pdry
Vd d
V= ×
2eff SA SAD D D
εε
τ
= =

134
(5-5)
where
(5-6)
Values for wΦ calculated for an initial EtOH:SA molar ratio of 7.5:1 and at three
different temperatures are presented in Table 5-4.
Table 5-4. Evaluation of mass transfer resistances using the Weisz-Prater criterion.
SAx 0.115
CATw (kgCAT/kgsol) 0.088
Solρ (kg/m3) 830
SAC (kmol/m3) 1.77
Pswollend (mm) 0.37
CATρ (kg/m3) 1012
EtOH Association Factor for Wilke-Chang model 1.5
SA molar volume at TB (cm3/mol) 83.58
T (K) 353.15 379.15 393.15
liquidµ (cP) 0.755 0.507 0.397
SAD (m2/s) 2.02x10
-9 3.23 x10
-9 4.28 x10
-9
effD (m2/s) 6.57 x10
-10 1.05 x10
-9 1.39 x10
-9
mr (kmol / m3) (1/s) 8.05 x10
-4 9.92 x10
-4 8.86 x10
-4
†mr (kmol / kg CAT) (1/s) 1.1 x10
-5 1.35 x10
-5 1.20 x10
-5
φ 0.196 0.171 0.140 η 0.987 0.994 0.993
wΦ 0.038 0.028 0.019
The effectiveness factor for each of these experiments is greater than 0.95η > ,
indicating that internal mass transfer resistances can be neglected in SA esterification [31].
2w ηφΦ =
tanhφη
φ=

135
Similar calculations likewise indicated the absence of diffusion limitations in AcOH
esterification and dehydration of EtOH to DEE. To validate the above analysis of intraparticle
mass transfer, the resin catalyst was separated in a series of US-standard sieves (Dual
Manufacturing Co.). First, particles larger than 35 mesh (> 500 µm) were collected in the sieve
tray. Smaller particles were ground and collected in two additional fractions: the -35+60 mesh
fraction (250-500 µm) and <100 mesh fraction (<< 150 µm). Ion exchange capacity was
measured in each fraction; no change in acidity was observed as a result of the grinding process.
Experiments were run at identical conditions with the three different Amberlyst 70
catalyst particle sizes. Results are presented in Figure 5-2; no difference in the rate of reaction
was observed for the different catalyst particle sizes, verifying that internal mass transfer
resistances can be neglected in this system.
Figure 5-2. Esterification of SA with EtOH over different particle sizes of Amberlyst 70: (●) -
dP < 150 µm; (□) - 250 µm < dP < 590 µm; (∆) - dP > 590 µm. Catalyst loading = 0.1 eq/kg solution; mole ratio EtOH:SA = 7.5:1; T = 353 K.
0
20
40
60
80
100
0 100 200t (min)
SA C
onve
rsio
n %

136
5.4.2 Reaction equilibrium constants
Equilibrium constants for the esterification reactions were measured by running
experiments long times (> 23 hr). By taking the average composition of the last two samples, the
equilibrium constant ( mEQK ) for each reaction was calculated using mole fractions and activity
coefficients of each of the CN components of the reaction:
(5-7)
Here ix , iγ , and vi are the mole fraction, activity coefficient, and stoichiometric
coefficient of component i in the reactive mixture, respectively. The ratio of activity
coefficients mKγ accounts for deviations from ideal behavior of the mixture. At 383 K, the
irreversible formation rate of diethyl ether (DEE) was significant and thus it was difficult to
approach an equilibrium composition, so experiments at this temperature were not included in
equilibrium constant calculations.
The NRTL equation was used to evaluate activity coefficients of components in the
reaction mixture [32, 33]. Some binary interaction parameters were obtained from literature or
from the Aspen Plus (Version 7.1, AspenTech, Inc.) database [33, 34]; others were determined
by vapor-liquid equilibrium and liquid-liquid equilibrium measurements in our laboratory [35-
38]. Parameters for H2O-DEE, EtOH-DEE, AcOH-DEE and EtOAc-DEE were regressed from
reported vapor-liquid and liquid-liquid phase equilibria data using the regression tool in Aspen
Plus [33]. Plots of binary and ternary phase equilibrium data along with fitted predictions are
presented in Figure 5-9 to 5-11 of the Supplementary Material. The list of binary parameters
( )1
NCm m mEQ x i i EQ
i
viK K K xγ γ=
= = ∏

137
used in calculation of activity coefficients is presented in Table 5-6 of the Supplementary
Material.
Figure 5-3. Mole fraction (gray) and activity (black) based esterification equilibrium constants
from experimental data. a.) Succinic acid esterification: (●,●) - 1EQK : (+,+) - 2
EQK (Reported
values for mole fraction are 1ln 1.66EQK = and 2ln 0.182EQK = [21]) b.) Acetic acid
esterification: (▲, ▲) -this work; (◊) - Darlington [22]; (∆) - Hangx [26]; (□) - Tang [34].
0
1
2
3
4
0.0025 0.003 0.0035
1 / T (K-1)
Ln
KE
Q
b
0
1
2
3
4
5
0.0025 0.0027 0.0029
1 / T (K-1)
Ln
KE
Qa

138
The calculated mole fraction- and activity-based equilibrium constants for SA and AcOH
esterification are presented in a Van’t Hoff plot in Figure 5-3. These values agree with those
reported in the literature under similar conditions [21, 22, 27, 34] as noted on the plot. The
difference between activity- and mole fraction-based equilibrium constants reflects the
significant non-ideality of the system ( Kγ ~ 4).
The scatter in the equilibrium constants (±15%) is attributed to experimental and
analytical uncertainties, and was noted to be worse with large excess of EtOH where nearly
complete SA or AcOH conversion was obtained. Given that calculation of the equilibrium
constant requires values for all species concentrations, some by different means, the uncertainty
is reasonable. Further, a prior study of esterification equilibrium over ion exchange resin
catalysts [22] reports that selective absorption of reacting components inside the catalyst
particles changes the bulk liquid concentration and thus the value of the calculated equilibrium
constant. This would affect the mole fraction-based calculation but not the activity-based
equilibrium constant, as activity at equilibrium will be the same inside and outside of the catalyst
particles.
As observed in Figure 5-3a, the slope of the trend line of SA esterification equilibrium
constant is nearly zero, so the heat of reaction can be taken as zero and the equilibrium constant
can be considered temperature independent. The averaged mole fraction based values of 1EQK =
9.1 and 2EQK = 1.4 agree reasonably well with those reported in the literature [21], and are used
as initial estimates in regression of the kinetic model that follows.
Figure 5-3b indicates that the equilibrium constant for ethyl acetate formation decreases
with increasing temperature. From the slope of this plot, the estimated heat of reaction for ethyl

139
acetate formation is -13.8 kJ/mol, a value consistent with that obtained for similar catalysts [26,
28]. It should be noted, however, that for the kinetic modeling of acetic acid esterification, we
have assumed the equilibrium constant is independent of temperature over the range of
experimental conditions examined.
5.4.3 Kinetic model
In a batch reactor, the change in number of moles iN of component i participating in m
reactions can be expressed as
(5-8)
Here TN is the total number of moles in the reactor, V is the reaction volume, mr is the
rate of reaction m per unit volume, and ix is the mole fraction of component i in the liquid
mixture. The parameter ,i mθ is the ratio of stoichiometric coefficients of component i with
respect to the reference component in reaction m.
Equation 5-8 can be expressed in terms of total molar concentration in the liquid phase
CT (V/NT = 1/ CT) calculated from average molecular weight ( AvgMW ) and the density of the
solution.
(5-9)
,1
mi i
T i m m
m
dN dxN r V
dt dtθ
=
= =
∑
, ,1 1
1=
m mAvgi
i m m i m mT Solm m
MWdxr r
dt Cθ θ
ρ= =
=
∑ ∑

140
Preliminary experiments confirmed that rates of reaction are linearly dependent on the
catalyst loading ( CATw ) (Figure 5-4); this is further evidence of the intrinsic nature of the
reaction rate data collected.
Figure 5-4. Rates of reaction under different catalyst loadings. a) SA esterification at T = 353 K,
EtOH:SA = 23:1. (●) - r1; (∆) - r2. b) (○) - AcOH esterification (r3) at T = 353 K, EtOH:AcOH = 7.5:1; (▲) - EtOH etherification (r4) at T = 393 K.
0
0.2
0.4
0.6
0 0.02 0.04 0.06 0.08 0.1
w CAT (kg cat / kg sol)
r x
103 (
kmol
/m3 s
)
a
0
3
6
9
0 0.015 0.03 0.045
w CAT (kg cat / kg sol)
r x
103 (
kmol
/m3 s
)
b

141
Using a pseudo-homogeneous model for the reversible esterification reactions, the rate of
reaction of SA with EtOH can be expressed as
(5-10)
Using the same approach for the second step of SA esterification (Figure 5-1), the rate of
formation of DES is described by
(5-11)
Here 0mk and
maE represent the pre-exponential factor and the energy of activation of
the forward reaction m, respectively. The equilibrium constant of reaction m,mEQK , is the ratio
of forward and reverse rate constants. Similarly, the rate of AcOH esterification with EtOH can
be expressed as
(5-12)
Considering that EtOH dehydration is irreversible, the rate of DEE formation can be
expressed as
( )( )( ) ( )1
2 211 0 1
exp MES MES H O H OaCAT Sol SA SA EtOH EtOH
EQ
x xEr w k x x
RT K
γ γρ γ γ
− = −
( )( )( ) ( )2
2 222 0 2
exp DES DES H O H OaCAT Sol MES MES EtOH EtOH
EQ
x xEr w k x x
RT K
γ γρ γ γ
− = −
( )( )( )( )3
2 233 0 3
exp EtAc EtAc H O H OaCAT Sol AcAc AcAc EtOH EtOH
EQ
x xEr w k x x
RT K
γ γρ γ γ
− = −

142
(5-13)
Substituting Eq. (5-10) to (5-13) into Eq. (5-9) for each component gives a set of ordinary
differential equations to be solved simultaneously in a mixed acid esterification model. Two
forms of this model were fit to the experimental data: the first being activity-based with activity
coefficients in all rate expressions, and the second a simplified mole fraction form generated by
setting all activity coefficients in Eq. (5-10 to 5-13) equal to 1.0.
In the complete mixed acid esterification model, there are 11 adjustable parameters: 4
pre-exponential factors, 4 energies of activation and 3 equilibrium constants. In order to simplify
the parameter fitting and ultimately investigate interdependence of the reactions, the kinetics of
EtOH dehydration, SA esterification, and AcOH esterification were measured independently and
the kinetic parameters for each reaction were obtained.
To determine kinetic parameters, Eq. (5-9) was numerically integrated for each
component via a fourth order Runge-Kutta method using differential equation solver ode23 in
Matlab 7.0. Optimization of kinetic parameters was performed by minimizing the sum of squared
differences between experimental ( i Expx − ) and calculated ( i Calcx − ) species mole fractions
using the following objective function in Matlab 7.0.
(5-14)
where n is the number of experimental samples withdrawn from batch reactors in all
experiments fitted and NC is the number of components considered in each sample. For EtOH
( )4
244 0 exp a
CAT Sol EtOH EtOHE
r w k xRT
ρ γ − =
( )22
min1
1 NC
i Exp i Calc
samples i
F x xn
− −=
= −∑ ∑

143
etherification and AcOH esterification, all components present were considered in Eq. (5-14); for
SA esterification only the succinate species (SA, MES, DES) were considered.
Once optimized constants were obtained, the average absolute error ABSf and average
relative percent error RELf for each model were used to evaluate mean relative deviation on an
absolute and on a percentage basis as shown in Eq. (5-15) and (5-16).
(5-15)
(5-16)
5.4.4 Kinetic constants
For EtOH dehydration, both mole fraction and activity-based models predict DEE
formation reasonably well (Figure 5-5). Only one activity-based predicted profile is presented
because all others overlap those of the mole fraction model. Experiments at high temperatures
(>393 K), high loadings of catalyst ( CATw > 0.04) and long reaction time (>500 min) showed
significant formation of DEE. At these conditions, flashing of liquid during sampling was
observed; this flashing and the resulting change in liquid composition may explain deviation of
the model from experiment at the most extreme conditions.
1
1 NC
ABS i Exp i Calc
samples i
f x xn
− −=
= −∑ ∑
1
1100
NC i Exp i CalcREL
i Expsamples i
x xf
n x
− −
−=
−= × ∑ ∑

144
Figure 5-5. Experimental and predicted mole fraction profiles of DEE formation. (○) - Run 1: T
= 363 K, wCAT = 0.08; (□) - Run 3: T = 388 K, wCAT = 0.081; (∆) - Run 4: T = 403 K, wCAT =
0.08; (●) - Run 5: T = 363 K, wCAT = 0.16; (▲) - Run 7: T = 388 K, wCAT = 0.16. (▬ ▬) Activity based model; (▬) Mole fraction model.
EtOH dehydration kinetics are included in the kinetic analysis of SA esterification (Runs
12-51) and AcOH esterification (Runs 52-83). In these regression analyses, the equilibrium
constants determined in experiment (Figure 5-3) were used as initial estimates for predicting
reverse reaction rate constants in the model. Although these equilibrium constants were allowed
to vary in the optimization, their final values differ negligibly from those reported in Figure 5-3.
Final optimized kinetic parameters for Eq. (5-10) to (5-13) are listed in Table 5-5. Experimental
results from Runs 33 and 37 for succinic acid, and Runs 61 and 78 for acetic acid are presented
and compared with predictions from the kinetic models in Figures 5-6 and 5-7, respectively.
Additional kinetic profiles are presented in the Supplementary Material.
Again, the activity-based kinetic model predictions overlap the profiles obtained from the
mole fraction model, so only one set is shown. Good agreement between model and experimental
0
0.02
0.04
0.06
0 250 500 750time (min)
x D
EE
0
0.1
0.2
1000 3000

145
data is observed at different conditions for simultaneous esterification and etherification
reactions. In general, it is seen that with excess EtOH and high loadings of catalyst (wCAT > 0.01),
almost complete conversion of SA is obtained after 2 h of reaction. This time is even shorter
when temperatures above 373 K are used; however, significant quantities of DEE are produced
at the high temperature. This DEE formation limits the maximum temperature that can be used
for ethanol esterification reactions.
Table 5-5. Parameters for pseudo-homogeneous kinetic models.
Parameter Mole Fraction Activity
SA Esterification 10k (kmol / kg CAT / s) 1.53x10
3 1.04x10
4
1aE (kJ/kmol) 44400 46200
1EQK 8.83 48.9
20k (kmol / kg CAT) (1/s) 2.78x10
4 2.11x10
3
2aE (kJ/kmol) 54700 46600
2EQK 1.35 10.14
AcOH Esterification 30k (kmol / kg CAT) (1/s) 1.50x10
4 1.03x10
4
3aE (kJ/kmol) 49400 47600
3EQK 2.84 12.11
EtOH Dehydration 40k (kmol / kg CAT) (1/s) 8.06 x10
4 4.99 x10
4
4aE (kJ/kmol) 86900 85400
The kinetic parameters presented in Table 5-5 agree well with those reported for similar
catalysts in the literature [21, 26-28, 34]. For the optimized parameters, the average absolute and
relative errors for both mole fraction- and activity-based kinetics were computed and are listed in
Table 5-7 in the Supplementary Information.

146
Figure 5-6. Experimental and predicted mole fraction profiles in SA esterification. (∆) - SA; (○)
- DES; (□) - MES; (▲) - EtOH; (●) - H2O; (+) - DEE; (▬ ▬) - activity based model; (▬) -
mole fraction model. a) Run 33: T = 365 K, wCAT = 0.022, EtOH:SA = 7.49. b) Run 37: T = 343
K, wCAT = 0.011, EtOH:SA = 22.8.
0
0.05
0.1
0 200 400 600time (min)
Mol
e fr
actio
n
0.7
0.8
0.9
1
x EtO
H
b
0
0.1
0.2
0.3
0 100 200 300time (min)
Mol
e fr
actio
n
400 1800
0.4
0.6
0.8
1
x EtO
H
a
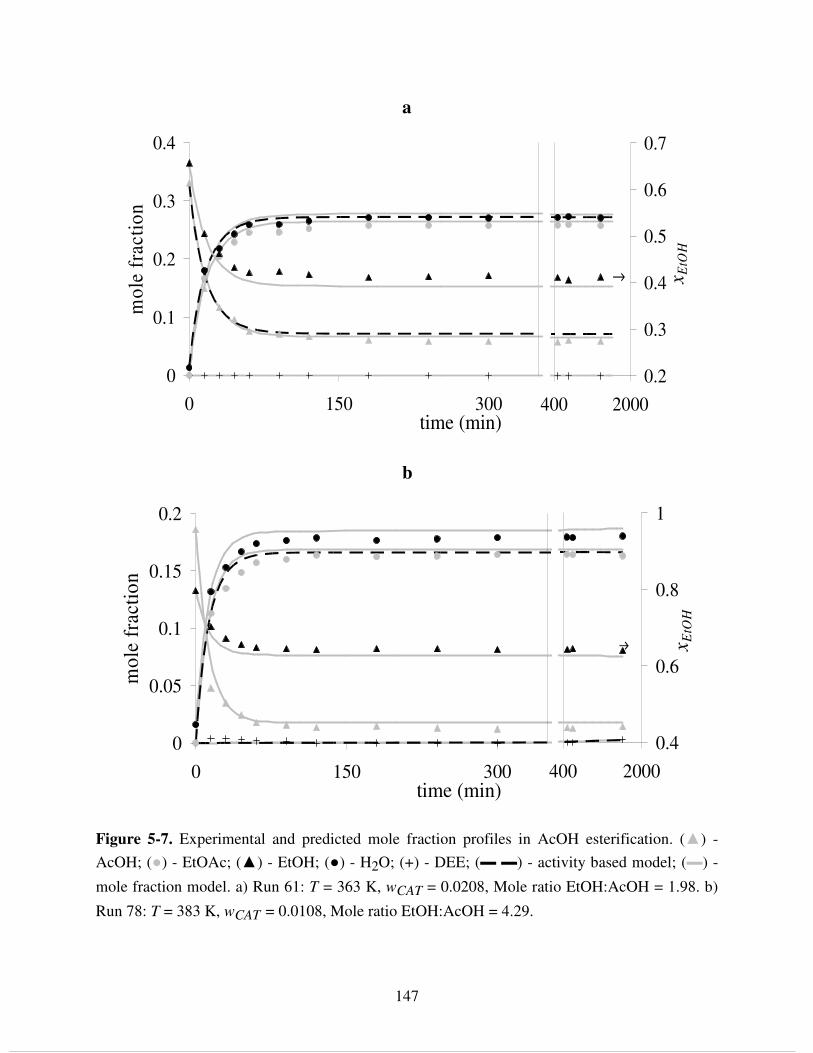
147
Figure 5-7. Experimental and predicted mole fraction profiles in AcOH esterification. (▲) -
AcOH; (●) - EtOAc; (▲) - EtOH; (●) - H2O; (+) - DEE; (▬ ▬) - activity based model; (▬) -
mole fraction model. a) Run 61: T = 363 K, wCAT = 0.0208, Mole ratio EtOH:AcOH = 1.98. b)
Run 78: T = 383 K, wCAT = 0.0108, Mole ratio EtOH:AcOH = 4.29.
0
0.1
0.2
0.3
0.4
0 150 300time (min)
mol
e fr
actio
n
400 2000
0.2
0.3
0.4
0.5
0.6
0.7
x EtO
H
a
0
0.05
0.1
0.15
0.2
0 150 300time (min)
mol
e fr
actio
n
400 2000
0.4
0.6
0.8
1
x EtO
H
b

148
Relative deviations for both models are similar to those previously reported from our
laboratory [21]. The large average relative errors (average values are ~ 16 % for SA
esterification, ~ 9% for AcOH esterification and ~ 13% for EtOH etherification) are mainly
attributed to components that are present at low concentrations. This was the case for SA, AcOH,
and DEE, for which mole fractions were less than 0.005 in the majority of samples, and for MES
(mole fraction between 0.01 - 0.04) mainly at long reaction times. For all other components,
relative error values were less than 5%.
The large excess of ethanol used in most experiments, and the large deviations arising
from analytical uncertainty at the low values of mole fraction for some species, is a consequence
of the low solubility of SA (~10 wt% or 23:1 EtOH:SA at 298 K) in the alcohol. We ran
experiments at higher SA initial concentrations, but the slow dissolution rate and solubility limits
of SA at low temperature resulted in undissolved SA in the reactor after reaction started. This
led to error in the mass balance and in the fit of the kinetic data at short reaction times. Thus,
experiments with higher SA concentrations were limited to taking samples at least 30 minutes
after reaching reaction temperature; no attempt was made to capture the early kinetic behavior of
these esterification reactions. Characterizing such early reaction behavior would require handling
a predissolved, heated feed solution under pressure, a scenario that we were not prepared to
undertake. Based on a catalyst acid site density of 2.35 meq/g, the initial turnover number for SA
esterification over Amberlyst 70 at 353 K and 7.5:1 EtOH:SA molar ratio is 69 h-1
. At the same
conditions, we have found that more commonly used Amberlyst 15 macroreticular resin has a
turnover frequency of 48 h-1
. These results agree with the higher acid strength and higher
turnover numbers reported for sulfonic groups in chlorinated resins such as Amberlyst 70 [19,

149
39] , and are consistent with higher accessibility (e.g. higher effective diffusivity of reactants) to
actives sites in a swelled gel-type structure compared with a macroreticular resin [19].
5.4.5 Mixed acid esterification
Using the kinetic parameters determined in individual SA and AcOH esterification
reactions (Table 5-5), the modeling of mixed SA and AcOH esterification was performed by
integrating Eq. (5-9) for each species in the mixture. Absolute and relative errors of mixed acid
model predictions with respect to experimental observations were calculated from Equations 5-
15 and 5-16 and are presented in Table 5-7 of the supplementary material. Larger relative errors
(~ 20%) in the mixed acid esterification relative to those in AcOH esterification alone can again
be attributed to the large excess of EtOH used in these experiments: mole fractions of acids are
initially low and decline rapidly as near-complete conversion of both SA and AcOH is achieved,
thus increasing error because of uncertainties in analytical measurements at low concentrations.
Nevertheless, the model predicts mixed acid esterification reasonably well, as shown in the
kinetic profiles presented in Figure 5-8.
Because the combination of individual esterification reactions reasonably predicts the
mixed acid results, it is apparent that the esterification reactions proceed without competition for
catalyst active sites among the acid species. In some other esterification studies, a Langmuir-
Hinshelwood type expression has been invoked to describe rate [40,41]; it is clear here that the
active sites are not occupied to a significant degree by either SA or AcOH, and that the simple
second-order rate expressions suffice to describe rate behavior of mixed acid esterification.

150
Figure 5-8. Experimental and predicted mole fraction profiles in mixed SA/AcOH esterification.
(▲) - AcOH; (●) - EtOAc; (∆) - SA; (○) - DES; (□) - MES; (▲) - EtOH; (●) - H2O; (+) - DEE.
(▬ ▬) - activity based model; (▬) - mole fraction model. a) Run 84: T = 363 K, wCAT = 0.011,
mole ratio EtOH:SA = 11.1 and SA:AcOH = 2.2. b) Run 86: T = 373 K, wCAT = 0.0125, Mole ratio EtOH:SA = 17.3 and SA:AcOH = 0.62.
0
0.07
0.14
0.21
0 150 300time (min)
Mol
e fr
actio
n
400 1000
0.5
0.6
0.7
0.8
0.9
1
x EtO
H
a
0
0.07
0.14
0.21
0 150 300time (min)
Mol
e fr
actio
n
400 1000
0.4
0.6
0.8
1
x EtO
H
b

151
5.5 Supplementary material
Table 5-6. Binary parameters for NRTL model. Gij = exp(-ααααij ττττij), ττττij = (aij + bij/T).
i j aij aji bij bji ααααij
H2O EtOH 0.514285 0.806535 444.8857 -266.533 0.4
H2O SA 0 0 296.7226 -328.506 0.3
H2O DES 4.384591 -1.58 184.7326 1136.555 0.36842
H2O MES 0 0 880.7603 -200.977 0.3
H2O DEE 8.412378 0.617494 -1496.24 547.9293 0.348988
H2O AcOH 3.3293 -1.9763 -723.888 609.8886 0.3
H2O EtOAc 3.853826 -2.34561 -4.42868 1290.464 0.364313 EtOH SA 0 0 -605.634 113.4481 0.3 EtOH DES 0 0 653.8819 -158.856 0.3 EtOH MES 0 0 -292.308 400.6306 0.3 EtOH DEE 4.3596 -3.5877 -1209.49 1381.066 0.3 EtOH AcOH 0 0 225.4756 -252.482 0.3 EtOH EtOAc 1.817306 -4.41293 -421.289 1614.287 0.1 AcOH EtOAc 0 0 -235.279 515.8212 0.3 AcOH SA 0 0 -386.393 2132.132 0.3 AcOH MES 0 0 -176.711 302.7477 0.3 AcOH DES -3.32574 18.50486 1067.921 -5736.06 0.3 AcOH DEE -2.36704 20.157 479.0254 -5769.5 0.2 EtOAc SA 0 0 191.9869 1976.63 0.3 EtOAc MES 0 0 191.701 -142.115 0.3 EtOAc DES 0 0 236.0739 -211.388 0.3 EtOAc DEE 0 0 144.9525 -113.666 0.3
SA DES 0 0 1946.876 218.2243 0.3 SA MES 0 0 -368.762 1039.777 0.3 SA DEE 0 0 1947.928 248.4113 0.3
DES MES 0 0 -44.2052 137.2218 0.3 DES DEE 0 0 595.5747 -404.406 0.3 MES DEE 0 0 100.6717 88.62851 0.3

152
Table 5-7. Evaluation of intraparticle mass transport under experimental conditions and
relative deviations of compositions calculated form regressed models and experimental
data. Mole fraction (MF) and Activity (Act.) based kinetics.
Average Error Experimental diffusion criteria
Absolute Relative RUN
wΦ η MF Act. MF Act.
1 - - 0.0019 0.0018 10.29 10.69 2 - - 0.0026 0.0026 43.17 42.99 3 - - 0.0021 0.0025 4.05 4.20 4 - - 0.0097 0.0110 13.26 14.75 5 - - 0.0011 0.0012 8.84 9.45 6 - - 0.0024 0.0024 13.41 15.70 7 - - 0.0072 0.0075 13.98 14.58 8 - - 0.0225 0.0237 14.30 14.50 9 - - 0.0004 0.0004 5.09 5.05
10 - - 0.0006 0.0006 8.53 8.49 11 - - 0.0022 0.0022 15.26 15.26 12 0.024 0.992 0.0471 0.0469 32.05 36.98 13 0.020 0.993 0.0087 0.0081 12.04 15.68 14 0.020 0.993 0.0076 0.0073 12.74 14.44 15 0.019 0.994 0.0102 0.0102 16.20 16.54 16 0.048 0.984 0.0098 0.0089 15.11 17.65 17 0.038 0.987 0.0066 0.0067 22.16 22.51 18 0.040 0.987 0.0034 0.0033 14.06 11.95 19 0.041 0.986 0.0033 0.0034 19.03 17.47 20 0.042 0.986 0.0075 0.0059 11.28 14.08 21 0.036 0.988 0.0037 0.0033 7.90 8.35 22 0.034 0.989 0.0017 0.0017 9.34 8.22 23 0.033 0.989 0.0016 0.0016 7.16 8.37 24 0.031 0.990 0.0069 0.0054 9.75 14.69 25 0.029 0.990 0.0040 0.0033 6.68 8.64 26 0.027 0.991 0.0040 0.0037 12.15 12.56 27 0.026 0.991 0.0032 0.0031 8.38 7.51 28 0.168 0.945 0.0065 0.0063 20.88 20.94 29 0.172 0.943 0.0056 0.0054 19.49 19.67 30 0.168 0.945 0.0063 0.0060 20.78 21.00 31 0.165 0.946 0.0122 0.0121 14.20 17.08 32 0.128 0.958 0.0042 0.0062 10.84 14.95 33 0.114 0.962 0.0039 0.0042 12.10 12.67 34 0.076 0.975 0.0032 0.0048 9.85 13.72 35 0.056 0.982 0.0035 0.0040 9.93 11.34 36 0.128 0.958 0.0018 0.0018 14.95 16.06 37 0.138 0.954 0.0024 0.0025 19.01 19.60 38 0.238 0.922 0.0052 0.0051 21.63 19.60 39 0.166 0.945 0.0026 0.0025 23.57 22.15 40 0.086 0.972 0.0088 0.0089 46.08 46.45 41 0.125 0.959 0.0027 0.0025 21.03 20.48 42 0.109 0.964 0.0073 0.0073 39.52 39.14 43 0.126 0.958 0.0024 0.0024 23.29 23.79 44 0.075 0.975 0.0056 0.0056 29.67 28.27

153
Table 5-7. (Continuation).
Average Error Experimental diffusion criteria
Absolute Relative RUN
wΦ η MF Act. MF Act.
45 0.078 0.974 0.0037 0.0037 22.81 20.79 46 0.080 0.973 0.0031 0.0030 21.72 19.31 47 0.072 0.976 0.0025 0.0025 20.72 18.73 48 0.059 0.981 0.0028 0.0026 20.43 21.97 49 0.049 0.984 0.0024 0.0023 21.44 19.08 50 0.039 0.987 0.0022 0.0022 18.75 24.52 51 0.036 0.988 0.0016 0.0016 16.94 21.90 52 0.080 0.973 0.020 0.014 8.955 6.355 53 0.099 0.967 0.008 0.008 4.161 5.610 54 0.132 0.956 0.009 0.008 6.001 9.458 55 0.117 0.961 0.008 0.006 9.071 6.860 56 0.126 0.958 0.006 0.005 7.446 7.815 57 0.127 0.958 0.006 0.005 15.393 15.506 58 0.131 0.957 0.004 0.003 18.224 28.747 59 0.132 0.956 0.004 0.003 13.980 21.184 60 0.094 0.969 0.021 0.015 9.248 6.647 61 0.100 0.967 0.010 0.008 4.848 5.043 62 0.126 0.958 0.010 0.007 6.567 5.922 63 0.108 0.964 0.009 0.007 9.485 8.062 64 0.076 0.975 0.016 0.018 7.378 8.003 65 0.094 0.969 0.009 0.008 4.459 4.758 66 0.106 0.965 0.012 0.009 6.925 5.968 67 0.098 0.968 0.009 0.008 10.207 7.084 68 0.059 0.981 0.017 0.013 8.182 6.591 69 0.063 0.979 0.009 0.008 4.855 6.028 70 0.077 0.974 0.009 0.006 4.784 7.787 71 0.075 0.975 0.009 0.007 9.558 8.883 72 0.028 0.991 0.017 0.013 8.035 6.557 73 0.033 0.989 0.009 0.009 5.892 7.211 74 0.039 0.987 0.009 0.006 5.247 6.805 75 0.043 0.986 0.006 0.005 6.562 7.435 76 0.156 0.949 0.028 0.022 14.684 12.013 77 0.163 0.946 0.010 0.011 10.287 10.855 78 0.172 0.943 0.009 0.008 8.656 11.363 79 0.175 0.942 0.009 0.008 12.240 15.366 80 0.111 0.963 0.033 0.029 17.261 14.744 81 0.071 0.977 0.037 0.036 18.698 19.067 82 0.089 0.970 0.023 0.021 15.171 15.681 83 0.128 0.958 0.009 0.008 10.258 11.756 84 - - 0.004 0.004 18.63 16.53 85 - - 0.005 0.005 22.98 20.87 86 - - 0.003 0.003 14.82 13.55 87 - - 0.005 0.005 28.40 26.82 88 - - 0.003 0.003 23.44 20.76

154
Figure 5-9. Reported phase equilibria in mixtures with DEE and modeling using NRTL-HOC
(solid lines). a) vapor-liquid DEE-H2O at T = 308 K [42]. b) liquid-liquid DEE-H2O [43]. c) vapor-liquid DEE-AcOH at P = 51.9, P = 65 and P = 79.5 kPa [44].
a
0
40
80
120
0 0.2 0.4 0.6 0.8 1
x DEE
P
(kPa
)
b
260
320
380
0 0.2 0.4 0.6 0.8 1x DEE
T (
K)
c
280
340
400
0 0.2 0.4 0.6 0.8 1x DEE
T
(K)

155
Figure 5-10. a) vapor-liquid DEE-EtOAc at T = 273, T = 283 and T = 303 K [44]. b) vapor-liquid DEE-EtOH at T = 273, T = 283, T = 293, T = 298, T = 303, T = 313 and T = 323 K [45].
a
0
30
60
90
0 0.2 0.4 0.6 0.8 1
x DEE
P (
kPa)
b
0
60
120
180
0 0.2 0.4 0.6 0.8 1x DEE
P (
kPa)

156
Figure 5-11. a) ternary diagram H2O-AcOH-DEE at T = 298 K (mole fraction basis) [42]. b)
ternary diagram H2O-EtOH-DEE at T = 298 K (mole fraction basis) [46].
AcOH a
b

157
Figure 5-12. Experimental and predicted mole fraction profiles in SA esterification. (∆) - SA;
(○) - DES; (□) - MES; (▲) - EtOH; (●) - H2O; (+) - DEE; (▬ ▬) - activity based model; (▬) -
mole fraction model. a) Run 48: T = 353K, wCAT = 0.093, mole ratio EtOH/SA = 23.07:1. b)
Run 51: T = 383 K, wCAT = 0.092, mole ratio EtOH:SA = 23.07:1.
0
0.04
0.08
0.12
0 30 60 90 120time (min)
Mol
e fr
actio
n
150 300 450
0.7
0.8
0.9
1
x EtO
H
b
0
0.05
0.1
0 100 200 300 400 500time (min)
Mol
e fr
actio
n
0.7
0.8
0.9
1
x E
tOH
a

158
Figure 5-13. Experimental and predicted mole fraction profiles in AcOH esterification. (▲) - AcOH; (●) - EtOAc; (▲) - EtOH; (●) - H2O; (+) - DEE; (▬ ▬) - activity based model; (▬) - mole fraction model. a) Run 65: T = 373 K, wCAT = 0.0199, mole ratio EtOH:AcOH = 1.97:1. b) Run 69: T = 353 K, wCAT = 0.0408, mole ratio EtOH:AcOH = 1.94:1.
0
0.1
0.2
0.3
0.4
0 400 800time (min)
mol
e fr
actio
n
0
0.3
0.6
x EtO
H
a
0
0.1
0.2
0.3
0.4
0 400 800time (min)
mol
e fr
actio
n
0
0.3
0.6
0.9
xE
tOH
b

159
REFERENCES
160
5.6 REFERENCES
[1] C. Potera. Environ. Health Persp. 113, 12 (2005) A832-A835. [2] M. Patel, M. Crank, V. Dornburg, B. Hermann, L. Roes, B. Hüsing, L. Overbeek, F.
Terragni, E. Recchia. Medium and long-term opportunities and risks of the biotechnological production of bulk chemicals from renewable resources - The potential of white biotechnology. (The BREW project). Utrecht, Netherlands. 2006. [Online] Available: http://www.bio-economy.net/applications/files/Brew_project_ report.pdf [June, 2010].
[3] B. Hermann, M. Patel. Appl. Biochem. Biotechnol. 136 (2007) 361-388. [4] J. B. McKinlay, C. Vieille, J. G. Zeikus. Appl. Microbiol. Biotechnol. 76 (2007) 727-740. [5] A. Cukalovic, C. V. Stevens. Biofuels, Bioprod. Biorefin. 2, 6 (2008) 505-529. [6] C. Delhomme, D. Weuster-Botz, F. E. Kühn. Green Chem. 11 (2009) 13-26. [7] O. Wolf, M. Crank, M. Patel, F. Marscheider-Weidemann, J. Schleich, B. Hüsing, G.
Angerer. Techno-economic feasibility of large-scale production of Bio-based polymers in Europe, European Science and Technology Observatory, EUR 22103 EN. (2005). [Online] Available: http://ftp.jrc.es/EURdoc/eur22103en.pdf [June, 2010].
[8] I. Bechthold, K. Bretz, S. Kabasci, R. Kopitzky, A. Springer. Chem. Eng. Technol. 31(2008)
647-654. [9] J. G. Zeikus, M. K. Jain, P. Elankovan. Appl. Microbiol Biotechnol 51(1999) 545-552. [10] L. Agarwal, J. Isar, R. Saxena. J. Biochem. Biophys. Methods 63 (2005) 24-32. [11] P. Rogers, J. Chen, M. Zidwick. The prokaryotes. Chapter 3.1. Organic Acid and Solvent
Production, Part I: Acetic, Lactic, Gluconic, Succinic and Polyhydroxyalkanoic Acids. (2006) 511-755.
161
[12] H. Song, S. Y. Lee. Enzime Microb. Tech. 39 (2006) 352-361. [13] A. Orjuela, A. J. Yanez, Lira, C. T., Miller, D. J. (2009). Carboxylic Acid Recovery from
Fermentation Solutions. US Patent Application filed Dec. 2009. [14] C. Bianchi, Appl. Catal. B. 40, 2 (2003) 93-99. [15] D. Sutton, G., Reed, G., Hiles. Process for the production of esters of mono-, di or
polycarboxylic acids. WO patent 051885 A1, US patent application 0129565 A1. (2005, 2007).
[16] W. Zhao, X. Sun, Q. Wang, H. Ma, Y. Teng. Biomass. Bioenerg. 33, 1 (2009) 21-25. [17] R. Bringué, M. Iborra, J. Tejero, J. F. Izquierdo, F. Cunill, C. Fité, V. J. Cruz. J. Catal. 244
(2006) 33–42. [18] R. Bringué, J. Tejero, M. Iborra, J. F. Izquierdo, C. Fité, F. Cunill. Topics in Catal. 45, 1-4
(2007) 181-186. [19] P. F. Siril, H. E. Cross, D. R. Brown. J. Mol. Catal. A. Chem. 279 (2008) 63-68. [20] Rohm and Haas. Amberlyst 70 product data sheet. Philadelphia, USA. 2005. [21] A. Kolah, N. Asthana, D. Vu, C. T. Lira, D. J. Miller. Ind. Eng. Chem. Res. 47, 15 (2008)
5313–5317. [22] A. Darlington, W. Guenther. J. Chem. Eng. Data. 12, 4 (1967) 605-607. [23] J. Gimenez, S. Cervera-March. Appl. Catal. 48, 2 (1989) 307-32. [24] M. Mazzotti, B. Neri, D. Gelosa, A. Kruglov, M. Morbidelli. Ind. Eng. Chem. Res. 36, 1
(1997) 3–10.

162
[25] J. Helminen, M. Leppämäki, E. Paatero, P. Minkkinen. Chemometr. Intell. Lab. 44, 1-2
(1998) 341-352. [26] G. Hangx, G. Kwant, H. Maessen, P. Markusse, I. Urseanu. Reaction Kinetics of the
Esterification of Ethanol and Acetic Acid Towards Ethyl Acetate. Deliverable 22, Intelligent Column Internals for Reactive Separations (INTINT). Technical Report to the European Commission. (2001). [Online] Available: http://www.cpi.umist.ac.uk/intint/NonConf _Del/22.pdf. [June, 2010].
[27] Ş. Kirbaşlar, Z. Baykal, U. Dramur. Turk. J. Engin. Environ. Sci. 25 (2001) 569-577. [28] N. Calvar, B. Gonzalez, A. Dominguez. Chem. Eng. Process. 46 (2007) 1317-1323. [29] I. Lai, Y. Liu, C. Yu, M. Lee, H. Huang. Chem. Eng. Process. 47 (2008) 1831-1843. [30] T. Dogu, E. Aydiny, N. Bozz, K. Murtezaoglu, G. Doguyy. Int. J. Chem. Reac. Eng. 1 A6
(2003) 1-10. [31] P. B. Weisz, C. D. Prater. Advan. Catal. 6 (1954) 143-196. [32] Renon, H., Prausnitz, J. M. AIChE J. 14 (1968) 135-144. [33] Aspentech, Aspen Physical Property System, physical property models/methods,
Burlington, 2007. [34] Tang, Y., Huang, H., Chien, I. J. Chem. Eng. Japan. 36, 11 (2003) 1352-1366. [35] A. Orjuela, A. J. Yanez, D. Vu, D. Bernard-Brunel, D. J. Miller, C. T. Lira. Fluid Phase
Equilibr. 290, 1-2 (2010) 63-67. [36] A. Orjuela, A. J. Yanez, P., Rossman, D. Vu, D. Bernard-Brunel, D. J. Miller, C. T. Lira.
Fluid Phase Equilibr. 290, 1-2 (2010) 68-74.

163
[37] A. Orjuela, A. J. Yanez, J. Evans, D. J. Miller, C. T. Lira. Phase Equilibria in Binary
Mixtures with Monoethyl Succinate. (2010) Manuscript in revision. [38] A. Orjuela, A. J. Yanez, A. Lee, D. J. Miller, C. T. Lira. Solubility and Phase Equilibria for
Mixtures with Succinic Acid. (2010) Manuscript in revision. [39] J. R. Collin, D. Ramprasad. Methods, systems and catalysts for the hydration of olefins.
European patent application EP 1479665 A1. [40] T. Pöpken, L. Götze, and J. Gmehling. Ind. Eng. Chem. Res. 39, 7 (2000) 2601-2611. [41] H.T.R. Teo, B. Saha. J. Catal. 228 (2004) 174-182. [42] M. Villamañan, A. Allawl, H. Van Ness. J. Chem. Eng. Data 29 (1984) 431-435. [43] J. M. Sørensen, W. Arlt. Liquid-Liquid Equilibrium Data Collection. Binary Systems.
Ternary Systems. DECHEMA. Chemistry Data Series, Vol V, Part 1 and Part 2. 1980. [44] J. Gmenhling, U. Onken, W. Arlt. Vapor-liquid Equilibrium Data Collection. Aldehydes and
kethone ethers. DECHEMA. Chemistry Data Series, Vol I, Part 3+4. 1979. [45] J. Gmenhling, U. Onken, W. Arlt. Vapor-liquid Equilibrium Data Collection. Organic
Hydroxy Compounds: Alcohols. DECHEMA. Chemistry Data Series, Vol I, Part 2a. 1979. [46] T. Letcher, J. Sewry, D. Naran. Fluid Phase Equilibr. 49 (1989) 187-193

164
PART 2: RECOVERY OF SUCCINIC ACID FROM
FERMENATION BROTHS

165
6. A novel process for recovery of fermentation-derived succinic acid
6.1 Summary
A novel approach to recovering succinic acid from fermentation broth via acidification
and esterification in ethanol is presented, based on solubility of sulfate and succinate salts in
ethanol-water mixtures. Acid salts from fermentation are placed in ethanol along with a slight
stoichiometric excess of sulfuric acid. Simultaneous acidification and esterification take place,
with the inorganic sulfate salt formed precipitating out of the ethanol solution. The succinate
recovered in present as a mixture of free succinic acid, monoethyl succinate, and diethyl
succinate in ethanol, can be used as a suitable feedstock for further esterification via reactive
distillation. Results are reported here for both model succinate salts and for actual fermentation
broth mixtures. Recovery of succinate species in excess of 95% is obtained for both model and
actual broths.
6.2 Introduction
Succinic acid (SA) produced by fermentation has been recognized as an attractive
building block for many chemicals derivatives including monomers and solvents [1]. Prospective
studies have estimated the potential market for SA as 270,000 metric tons per year, ten times
higher than current manufactured, with a potential production price (0.55 – 1.10 US$/kg) that
competes with maleic anhydride ($1.05 to 1.29 US/kg) [2-14]. Demonstration plants are
currently under construction [15-16] to produce SA; life cycle assessment indicates a net fossil
energy consumption of 30-40% less than the current petroleum-based route [17].

166
In producing organic acids by fermentation, 50% to 80% of processing costs are typically
attributed to recovery and purification of the desired product. The primary challenges in organic
acid recovery are low titer (g/liter) of the acid, the presence of byproducts including other
carboxylic acids, and the requirement for pH control during fermentation that leads to the
carboxylic acids being present in the salt form.
Table 6-1. Summary on patented processes for succinic acid recovery.
PROCESS REMARKS RECOVERY Ref.
Acidification –
crystallization
Selective crystallization by pH change pH controlled precipitation
Selective precipitation from sodium sulfate
- -
74 %
[19] [20] [21]
Salt precipitation
– acidification
As calcium salt. Ion exchange, re-crystallization Crystallization in methanol. Cracking of
ammonium salt Salt is selectively precipitated adding ethanol
- 78 %
-
[22, 23] [24]
[25]
Solvent extraction
“wettable” organic solvents (ketones) Octanol in several cycles
Olefinic co-solvents
84 % 80 %
-
[26] [27] [28]
Amine extraction
with/without solvent
Under CO2 atmosphere with alcohol as solvent Tertiary amines with alcohol al solvent Water is removed with secondary amine
Alcohol as solvent. Esters are formed Electrolytic membranes required
80 % - - -
94 %
[29, 30] [31] [32] [33] [34]
Ion exchange
Back extract with amine removed by stripping Anionic resin
Strongly acidic cationic resin Anionic resin
Cationic resins
87 % - - - -
[35] [36] [37] [38] [39]
Nanofiltration Initial ion exchange of calcium required
Electrodialysis required Initial crystallization under pH control required
- - -
[40] [41] [42]
Electro-dialysis,
Membranes
Salt-splitting, Low recovery per pass Polishing with ion exchange. Non selective
78 % 79 %
[43] [44]
Esterification with/without
Reactive distillation
Esterification assisted with pervaporation Ammonium salt with ethanol. Amides formation
Ammonium salt with ethanol. CO2 as catalyst Ammonium salt with butanol. P-TSA as catalyst
- - -
96.5 %
[45] [46] [47] [48]

167
In the early 1980’s, a comprehensive review covered the major technologies and
principles governing recovery of carboxylic acids from fermentative media using solvents,
amines, phosphates, or their mixtures [18]. Since then, in addition to reports in the open
literature, several patented processes for SA recovery have been developed (Table 6-1).
These methods can be classified as those that use direct precipitation (as salt or acid),
extraction (solvents, amines), ion exchange, membranes, or esterification of the free acid
followed by hydrolysis. In all cases, acidification of the salts is a key step in the recovery. From
a chemical production viewpoint, succinate esters are more desirable than the free acid for
derivatives such as tetrahydrofuran and 1-4 butanediol [49] as the maleic anhydride route already
goes through the ester. Thus, succinate recovery as esters directly from the fermentation broth
would be of economic interest.
6.3 Description of Process
The process concept to recover SA from fermentation broth involves direct esterification
of the succinate salts in ethanol (EtOH). To carry out the process, the fermentation broth must
be treated as usual by centrifugation to remove cell biomass and by activated carbon addition to
remove impurities and color. Water is then removed from the clean broth until the succinate salts
are present as wet solids. Then the wet salts are placed in ethanol along with sulfuric acid.
The chemistry of the recovery process is presented for sodium salts (sodium succinate –
Na2Succ) in Eq. (6-1)–(6-5). The solid succinic salts react with H2SO4 to form free succinic acid
and the corresponding sulfate salt. Unreacted or excess H2SO4 acts as a catalyst for esterification
of the dissolved free acid with EtOH, forming a mixture of mono- and di-ethyl succinates (MES

168
and DES) along with the free acid. The sodium sulfate formed is insoluble in ethanol and thus
precipitates, binding water as available because of its propensity to form hydrates. These
reactions occur simultaneously during acidification at rates and extents that depend on
temperature, H2SO4 concentration, and time. Once acidification is complete, the succinate
species dissolved in ethanol are subject to further esterification via reactive distillation to form
the desired product, diethyl succinate.
Na2Succ (s) + H2SO4 (l) → SA (sol) + Na2SO4 (s) (6-1)
SA (sol) + EtOH (l) ↔ MES (l) + H2O (l) (6-2)
MES (l) + EtOH (l) ↔ DES (l) + H2O (l) (6-3)
Na2SO4 (s) + 10 H2O (l) → Na2SO4•10 H2O (s) (6-4)
Na2SO4 (s) + H2SO4 (l) ↔ NaHSO4 (s) + H2O (l) (6-5)
A more detailed description of this process with different salts has been presented by the
authors in a parallel work [50].
6.4 Material and methods
6.4.1 Materials
Succinic acid (>99.5 %, Sigma-Aldrich), acetic acid (AcOH, 99.9%, Aristar), diethyl
succinate (DES, 99.92%, Sigma-Aldrich), monoethyl succinate (MES, 89.3%, Sigma-Aldrich),
ethyl acetate (EtOAc, HPLC grade, J. T. Baker), ethanol (200 proof, Decon Labs), water (HPLC

169
grade, J.T. Baker), anhydrous sodium succinate (Na2Succ, ≥ 98 %, SAFC), sodium succinate
hexahydrate (Na2Succ•6H2O ≥ 99 %, Fluka), calcium succinate monohydrate (CaSucc•H2O ≥
99 %, GFS), sodium acetate (NaOAc, ≥ 99.6 %, J.T. Baker), sulfuric acid (H2SO4, 98%, EMD),
n-butanol (99.9%, Mallinckrodt), and acetonitrile (HPLC grade, EMD) were used without further
purification for experiments and calibrations. Species purity was confirmed by gas
chromatography; no impurities other than small amounts of water were detected in appreciable
concentrations. Hydranal-coulomat E solution (Riedel-de Haën) was used in Karl-Fisher analysis
for water measurement.
6.4.2 Experimental procedures
6.4.2.1 Solubility measurements
The solubility of sodium succinate and sodium acetate in EtOH-H2O mixtures was
determined by placing measured quantities of the salt into solution within glass vials (10 cm3)
stirred with a magnetic stir bar. The total mass placed in each vial was about 10g. These vials
were placed in an isothermal bath equipped with a circulator pump and temperature control
(Isotemp immersion circulator 730, Fisher Scientific, ± 0.1 K). Temperature was measured with
an ASTM certified glass thermometer (model 64 C, ± 0.1 K).
To first obtain the coarse range of solubility (+/- 5 w %) for a specific EtOH- H2O
solution composition, 10 vials containing the same amount of solution were charged with
different amounts of Na2Succ near the expected solubility limit. After equilibration at the desired
temperature under agitation for 12 h, the solubility range was obtained by visual observation of
170
remaining solids and total dissolution in two consecutive (by salt concentration) vials. After this,
the experiment was repeated as above using 10 vials but with initial masses of salt in between
upper and lower solubility limits as determined in the coarse measurement. After equilibration
for 12 h, the solubility value was obtained as before by visual inspection with an uncertainty of ±
0.5 % w/w. This experimental approach avoids ethanol or water vaporization if the vials are
opened for sequential addition of solids. It also avoids crystallization of solids during sampling.
This methodology was repeated for different EtOH-H2O compositions, and was also used to
evaluate the solubility of sodium acetate (NaOAc).
Because of experimental uncertainty, sodium salt content in solutions containing >90
wt% EtOH was measured by sodium detection using ICP-AES (Simultaneous sequential
inductively coupled plasma - atomic emission spectrometer, Thermo-Jarrel-Ash-Polyscan-61E)
with vacuum spectrometers and Ar-purged optical paths. Yttrium was used as an internal
standard in 2% HNO3.
6.4.2.2 Conditioning of fermentation products
Two fermentation products, consisting of dilute succinate salt solutions, were obtained
from independent sources; the two fermentation processes involved different microorganisms,
nutrient blends, and operating conditions in the fermenter. One broth was contained succinic
acid in the form of the sodium salt, the other as magnesium succinate. The raw broth was filtered
to remove biomass and treated with activated carbon to remove nutrients and color bodies. The
liquid solution was then concentrated in a rotary evaporator, followed by drying under vacuum at
343 K to a constant weight. The dried solids were scraped out of the evaporator, ground and

171
stored in sealed containers at 278 K. A sample of each dry solid was dissolved in water for
analysis.
6.4.2.3 Succinate recovery experiments
Simultaneous acidification and esterification of Na2Succ, Na2Succ•6H2O, CaSucc•H2O
and NaOAc was conducted in EtOH using different molar ratios of H2SO4 to the corresponding
salt. Tracking the reaction using aliquot samples does not provide the degree of conversion
because of the interchange of species between liquid and solid phases. Further, the mass of each
phase changes during the reaction, and the degree of hydration of the solid phase may change
during conversion. To overcome these challenges, analysis was performed using the entire
contents of reaction vials. A set of stirred test tubes were identically loaded with reagents and
placed in an isothermal bath. Tubes were removed from the bath at specified times and their
entire contents analyzed, thus mimicking the operation of a multiphase batch reactor over time.
To prepare each tube, a solution of H2SO4 in EtOH was stored in a flask maintained in an
ice bath to avoid heating and evaporation of the alcohol during mixing. Fifty-ml test tubes were
charged with a measured amount of this solution (~ 30 cm3), and succinate salt was added to
each tube at a measured ratio with respect to H2SO4. The quantity of succinate salt was set such
that the amount of SA produced was able to dissolve in EtOH at the reaction temperature. Each
tube was taken out of the bath at a specified time and quenched; after centrifugation at 7000 rpm
for 5 minutes, the supernatant liquid was removed, weighed and collected for analysis. The
solids remaining were washed in the same tube with anhydrous ethanol to remove remaining
soluble succinic species, and were then centrifuged again to collect, weigh, and analyze the

172
supernatant liquid. Finally, the remaining solids were dissolved in water for further analysis. In
the case of calcium succinate, because of its limited solubility in water, the solids were mixed
with an aqueous solution of H2SO4 to dissolve any succinate salt remaining, and the liquid phase
was analyzed. Total recovery is calculated on a molar basis, taking into account initial salt
loading.
6.4.3 Analysis
Samples were analyzed by both by gas and liquid chromatography. Reaction samples
were diluted 50-fold in water and analyzed via HPLC with a system containing a Waters®
717
autosampler, a Waters®
410 refractive index detector, and a Perkin-Elmer LC90 UV detector. A
100 mm x 7.6 mm fast acid analysis column (BioRad®
) at 298 K along with a mobile phase of 5
mM H2SO4 in water flowing at 1.0 cm3/min was used for the separation.
Volatile component concentrations were measured in a gas chromatograph (HP 5890
series II) equipped with thermal conductivity and flame ionization detectors. Reaction samples
were diluted 20-fold into acetonitrile containing 5.0 wt% n-butanol as an internal standard. A 30
m Alltech Aqua WAX-DA column (0.53 mm i.d., 1.20 µm film thickness) was used with the
following temperature program: initial temperature 313 K for 3 min; ramp at 20 K/min to 523 K,
and hold at 523 K for 0.5 min. The GC injection port was maintained at 543 K in a splitless
mode, and detector temperatures were 523 K. Helium was used as carrier gas (15 cm3/min) and
liquid injection volumes of 0.5 µL were used.

173
For both HPLC and GC analyses, standard samples of known composition in the range of
interest were injected in triplicate to obtain calibration curves repeatable to within ±0.5% by
mass. Karl-Fisher analysis (Aquacount coulometric titrator AQ-2100) was used to measure water
content in reagents and samples.
6.5 Results and discussion
6.5.1 Salts solubility
Experimental solubility data of Na2Succ in EtOH-H2O mixtures obtained at different
temperatures are shown in Figure 6-1. The solubility of Na2SO4 in EtOH-H2O from the
literature [51] is also presented. For Na2Succ at 60 °C, phase splitting was observed in solutions
containing 20 to 60 wt% EtOH. This effect is characteristic of the salting out observed in similar
water – organic mixtures, and was previously reported for potassium succinate [52].
Data in Figure 6-1 indicate that solubility of salts in EtOH is negligible up to water
concentrations of 20 wt%. This is advantageous for the recovery process described herein,
because EtOH containing some water (e.g. azeotropic EtOH) may be used and fermentation
solids do not have to be completely dried. In fact, recovery can be enhanced in the presence of
small quantities of water, because solubility of SA is higher in mixtures of EtOH-H2O than in
EtOH or water alone [53, 54]. Sodium acetate is more soluble than sodium succinate, suggesting
that acidification of NaOAc in EtOH can be enhanced by dissolution of solids in the reacting
media, mainly at high temperatures.

174
Figure 6-1. Experimental and reported solubilities of sodium salts in ethanol/water mixtures at
different temperatures. (+) - 298 K, (□) - 313 K, (▲) - 333 K. a) Na2Succ, this work; b) NaOAc,
this work; c) Na2SO4, reported by Vener [51].
Solubility (g/100g solution) at 298 K
EtOH H2O
Na2SO4 < 0.095 21.5
Na2Succ < 0.08 27.8 NaOAc < 0.008 36.8
a
0
0.1
0.2
0.3
0.4
0 0.2 0.4 0.6 0.8 1Mass fraction water
Na 2
Succ
sol
ubili
ty
(g /
100
g SO
LU
TIO
N)
b
00.10.20.30.40.50.6
0 0.2 0.4 0.6 0.8 1Mass fraction water
NaO
Ac
solu
bilit
y (g
/ 10
0 g
SOL
UT
ION)
c
0
0.1
0.2
0.3
0.4
0 0.2 0.4 0.6 0.8 1Mass fraction water
Na 2
SO4
solu
bilit
y (g
/ 10
0 g
SOL
UT
ION)

175
6.5.2 Demonstration of recovery method
Early exploratory tests gave succinate recoveries greater than 80% [50]. The proof-of-
concept recovery experiments described here were performed with pure sodium and calcium
succinate salts and with mixtures of sodium succinate and sodium acetate. The conditions and
material quantities used for these experiments are presented in Table 6-2. Because it is more
stable, the hydrated form of Na2Succ (Na2Succ•6H2O) was used instead of the anhydrous salt
because it is expected to be the species resulting from precipitation from the fermentation broth.
The quantities of H2SO4 added were equal to or in excess of the amount required to acidify the
organic acid salts.
Table 6-2. Experimental conditions for acidification tests.
Run Time
(h) Salt
Succinate
salt
(g)
Acetate
salt
(g)
EtOH
(g) H2SO4
(g)
H+:Na+
(2H+:Ca+2)
Ratio
T
(K)
1 6 Na2Succ•6H2O 4.13 - 23.7 1.50 Stoich. 303
2 6 Na2Succ•6H2O 4.13 - 23.73 1.8 1.2 303
3 6 Na2Succ•6H2O 4.13 - 23.74 2.1 1.4 303
4 6 CaSucc•H2O 2.66 - 23.77 1.49 Stoich. 303
5 24 Na2Succ•6H2O + NaOAc
2.42 0.15 20.42 1.16 1.2 323
6 2 Na2Succ•6H2O 2.43 - 20.21‡ 1.03 1.16 323
7 2 Na2Succ•6H2O 2.42 - 20.60 1.44 1.63 323
8 24 CaSucc•H2O 2.66 - 23.73 1.81 1.21 303
‡ Ethanol 95% w/w
Results of proof-of-concept experiments are presented in Table 6-3; succinate species
profiles over time are shown in Figures 6-2 and 6-3. Results in Table 6-3 illustrate that recovery
of SA by direct esterification of sodium salts with EtOH is possible even at ambient

176
temperatures. Recoveries are good in most experiments, and in some runs more than 95% of the
initial succinate salts are extracted into ethanol after 3 hr. Even with the uncertainty in the mass
balances, these recoveries are higher than those reported using other methods in the patent or
open literature, indicating the attractiveness of the recovery approach.
Table 6-3. Product yields during acidification reactions.
Molar recovery in liquid phase
mol %
Acetate Succinate Run
AcOH EtOAc SA MES DES TOTAL
Succinate
remaining in
solid phase
mol %
Total
succinate
recovery
mol %
1 - - 78.09 12.31 0.91 91.3 13.67 105.0
2 - - 31.43 50.68 14.23 96.4 1.36 97.7
3 - - 4.79 40.93 47.26 93.0 0.43 93.4
4 - - 29.70 39.64 23.37 92.7 7.62 100.3
5 38.35. 52.83 3.62 27.91 58.45 90.0 - 90.0
6 - - 74.82 9.47 0.20 84.5 21.85 106.4
7 - - 48.28 31.27 18.50 98.1 7.82 105.9
8 - - 0.60 11.92 88.86 101.4 1.29 102.7
Because multiple phases are present in recovery experiments and because quantities of
succinate species were measured by three independent methods (GC, HPLC, Karl-Fischer) as
described in Section 3.2.4, some scatter in species profiles and uncertainty (±5%) in closure of
the overall mass balances is observed. Differences in agitation patterns were noticed in every set
of reactors studied under identical conditions, contributing to the scatter in species profiles with
time. Overall, however, the quality of the results is reasonable and clearly demonstrates the
viability of the recovery method.

177
Figure 6-2. Recovery of succinic species in liquid phase during acidification of Na2Succ•6H2O in EtOH at 303 K. (+) - SA, (□) - MES, (▲) - DES, (○) - Total succinate species. a)
Stoichiometric H2SO4 (Run 1); b) 20 % molar excess of H2SO4 (Run 2); c) 40 % molar excess
of H2SO4 (Run 3).
a
0
25
50
75
100
0 1 2 3 4
t (h)
Succ
inat
e re
cove
ry
(mol
ar %
)
b
0
25
50
75
100
0 1 2 3 4
t (h)
Succ
inat
e re
cove
ry
(mol
ar %
)
c
0
25
50
75
100
0 1 2 3 4
t (h)
Succ
inat
e re
cove
ry
(mol
ar %
)

178
Figure 6-3. Recovery of succinic species in liquid phase during acidification of CaSucc•H2O in
EtOH at 303 K C in Run 4. Stoichiometric H2SO4. (+) - SA, (□) - MES, (▲) - DES, (○) - Total succinate species.
The distribution of succinate species changes with the quantity of H2SO4 used; at higher
excesses of sulfuric acid, MES and DES predominate over free SA. This result is observed for
both sodium and calcium salts. In Run 5, the simultaneous recovery of acetate species along with
succinates is achieved, indicating that the process can produce a mixture of esters that can be
more easily separated (i.e. by distillation) than the original acids mixture.
A qualitative indicator of the extent of recovery is the observed change in the nature of
the solid phase during reaction. Initially, crystalline succinate salts were suspended in the EtOH
solution; after a few minutes of reaction, a white-powdery slurry started to form. After
centrifugation two clearly different solid layers were observed.
Because the reaction occurs between a solid and a liquid phase, good mass transfer is
important for a rapid recovery process. This is perhaps evidenced by the initial rapid increase of
0
25
50
75
100
0 1 2 3 4
t (h)
Succ
inat
e re
cove
ry(m
olar
%)

179
succinate species in the ethanol solution during the first 15 minutes of reaction, during which
succinate salt is quickly acidified and Na2SO4 forms. The solid sulfate salt formed must separate
from the succinate salt surface to some extent (in accordance with the observation of a second
solid type), but at some point it is likely that the sulfate salt layer encases the succinate crystals
and slows acidification. This results in the need for 3 hr of reaction time to achieve the highest
yields of succinate in ethanol (Figure 6-2).
6.5.3 Succinate recovery from fermentation products
After demonstration of the process concept using pure succinate salts, a set of solids
obtained from fermentation were subjected to the acidification/esterification process in EtOH.
Characteristics of these solids are listed in Table 6-4. Concentration of salts in the broth is
reported as the equivalent SA or AcOH mass fractions in aqueous solution.
Because of the high glucose content in batch A, a viscous, sticky solid was obtained after
drying. The hygroscopic nature of glucose made water removal difficult by evaporation. For this
reason, dispersion and dissolution of particles within the reactive media was poor. Other batches
in Table 6-4 were dried without difficulties and particle size reduction was conducted until fine
brownish dusts were obtained.
Solids from batch E corresponded to crude SA obtained in the acid form because
acidification was carried out in the aqueous broth before evaporation. In this case the amount of
H2SO4 added was the required to catalyze esterification reaction (1 wt % of total solution).
Acidification conditions for fermentation solids are listed in Table 6-5 and results are
summarized in Table 6-6.

180
Table 6-4. Characterization of culture broth solids.
Batch code A B C D E
Salt form Na+
Mg+2
Mg+2
Mg+2
H+
Concentration wt %
SA 24.8 38 39.6 38.4 52.6 AcOH 2.5 - - - -
Lactic acid - 5.2 5.5 5.8 0.87 Other acids - ~ 3.0 ~ 3.8 ~ 3.8 ~ 1
Glucose 29 0.4 0.36 0.42 -
Table 6-5. Experimental conditions for acidification-esterification experiments on solids
obtained from fermentation.
Run Time
(h)
Batch
code
Solids
(g)
EtOH
(g) H2SO4
(g)
Mole ratio
H2SO4 : SA T (K)
9 24 A 5 19.8 1.3 1.1 303
10 6 A 3 19.5 1.8 1.3 303
11 2 A 3 19.7 0.9 1.3 323
12 8 B 2.04 6.7 0.7 1.04 303
13 5 B 2.01 7.4 0.9 1.43 303
14 5 B 2.01 7.4 0.9 1.44 333
15 8 C 2.04 6.7 0.7 0.98 303
16 5 C 2.03 7.8 1.0 1.4 303
17 5 C 2.02 7.7 1.0 1.41 333
18 8 D 2.03 6.8 0.8 0.98 303
19 5 D 1.99 8.3 1.0 1.57 303
20 5 D 2.01 8.3 1.0 1.57 333
21 24 D 399.8 1580 205 1.5 353
22 24 E 199.96 946.8 12.0 0.13 353

181
Table 6-6. Results of acidification-esterification of solids obtained from fermentation.
Molar recovery in liquid phase (mol %)
Acetate Succinate Run
AcOH EtOAc TOTAL SA MES DES TOTAL
9 53.1 38.1 91.2 61.7 15.1 0 76.8 10 15 31.6 46.6 7.3 14.6 12.6 34.5 11 20.6 36.7 57.3 20.0 22.8 9.4 52.2 12 - - - 43.2 10.2 6.2 59.8 13 - - - 58.4 8.6 1.3 68.3 14 - - - 73.4 5.2 3.9 82.6 15 - - - 46 2.9 3.7 52.6 16 - - - 57.1 18.6 3.4 79 17 - - - 61.2 2.4 3.2 66.8 18 - - - 51.8 6.1 4.4 62.4 19 - - - 57.3 9.3 1.3 67.9 20 - - - 78.8 6.1 5.2 90.1 21 - - - 13.6 54.1 33.3 101 22 - - - 1.3 12.1 73.4 86.9
Experiments 21 and 22 were carried out in 2L batch reactors to evaluate the process in
bench scale. In these runs reaction was performed under total reflux to avoid EtOH losses.
Even with excess of H2SO4, recovery of succinate and acetate species during
acidification of solid in Batch A was lower than that obtained with pure salts. After 2 h, around
40% recovery of succinate species was achieved compared with 80% in pure salts. However,
after 24 h, comparable results with those obtained for pure solids are observed. This indicates
that transport limitations are playing an important role in the process due to difficulties observed
in dissolution of solids in batch A. In Figure 6-4 evolution of the recovery process in run 9 is
presented. Recovery on Runs 12 to 22 was generally lower compared with pure salts. In these
experiments sulfuric acid loading was calculated only with respect to SA, therefore when
stoichiometric ratio was used molar loading was about 86 % of the required to acidify all the acid
species.

182
Figure 6-4. Recovery of succinate and acetate species in liquid phase during acidification of
solids from fermentation broth W-1 in EtOH at 303.15 K C and Stoichiometric H2SO4 (run 9). (+) - SA, (□) - MES, (▲) - DES, (X) - AcOH, (●) – EtOAc, (○) - Total species. a) Succinate species; b) acetate species.
a
0
25
50
75
100
0 5 10 15 20 25
t (h)
Succ
inat
e re
cove
ry(m
olar
%)
b
0
25
50
75
100
0 5 10 15 20 25
t (h)
Ace
tate
rec
over
y(m
olar
%)

183
This might explain the low recovery in experiments 12, 15 and 18. Remarkably, succinate
esters were also produced during the process, confirming that H2SO4 acts as a catalyst before
being consumed in salt acidification. Increasing H2SO4 loading enhances recovery as observed
in experiments 13, 16 and 19 but temperature is still low to promote esterification. Operating at
higher temperatures (333 and 383 K) similar recoveries to those obtained with pure salts were
achieved as demonstrated in runs 20 and 21.
In bench scale experiments with succinate salts and with crude SA (runs 21 y 22) high
recovery and high conversion to MES and DES were obtained verifying feasibility of the process
in a large scale. Evolution of recovery in bench scale experiments is presented Figure 6-5.
6.5.4 Process for succinate ester production direct from fermentation
As observed, acidification in ethanol is a feasible alternative to recover succinic acid as
its ester from fermentative broths, thus by-passing the need for purification of the free acid.
Figure 6-6 describes a process concept for a complete recovery and separation process to
produce diethyl succinate from fermentation product.
Conventional conditioning of fermentation broth to remove biomass and impurities is
followed by evaporation and solids drying using available technologies. After acidification in
ethanol, esterification of the succinate species in ethanol to diethyl succinate may be driven to
completion using reactive distillation [55]. If the fermentation process is engineered in such a
way that succinate salt precipitate along the process (for example as calcium salt), then solid salts
can be removed by filtration out of the broth and only drying is required before acidification;
therefore evaporation costs might be reduced.

184
Figure 6-5. Recovery of succinate species in liquid phase during acidification of solids from fermentation at bench scale. (+) - SA, (□) - MES, (▲) - DES, (○) - Total succinate species. a) run 21; b) run 22.
a
0
25
50
75
100
0 5 10 15 20 25
t (h)
Succ
inat
e re
cove
ry
(mol
ar %
)
0
25
50
75
100
0 5 10 15 20 25
t (h)
Succ
inat
e re
cove
ry(m
olar
%)
b

185
Figure 6-6. Proposed recovery process for succinic acid form fermentation broth by esterification with ethanol.
In the processing approach developed here, sulfate salts are generated as byproducts.
Some sulfates have extensive use as fertilizers or intermediates in the chemical industry (i. e.
magnesium, ammonium), so an appropriate choice of base for neutralization during fermentation
can lead to a valuable byproduct.
Biomass removal
Fermentation
Macromolecules and protein removal
Evaporation
Carboxylic salts separation
Wet salts drying
Acidification
Sodium sulfate removal
Esterification Pre-reactor
Reactive
Distillation Column
Lights and Ethanol
Recovery system
Purification and
Refining
Water for recycling to fermentation
Biomass to disposal
Solids to disposal
Solution for recycling
Ethanol Excess
Mixed esters for separation and refining
Water to disposal
Diethyl Succinate
Ethanol
Wet Sulfate for drying
and disposal
Ethanol
Sulfuric Acid
Moisture

186
6.6 Conclusions
The limited solubility of succinate and sulfate salts in ethanol solutions containing less
than 20% water forms the basis for the recovery of succinate esters from the salts formed in
fermentation. Solid succinate salts were acidified in ethanol using H2SO4 under different
conditions, and recoveries exceeding 95% were obtained using pure salts as model fermentation
products. Solid sulfates formed were easily removed by filtration or centrifugation. The
succinate species formed in ethanol included both esters and free acid, and other acids present in
the fermentation product were recovered as well. Using solids obtained from actual fermentation
media, recovery around 80% was obtained under different conditions. Recovery in ethanol is
easily integrated into an overall process to recover succinic acid as its diethyl ester directly from
the succinate salts formed in fermentation.

187
REFERENCES

188
6.7 REFERENCES
[1] R. Landucci, B. Goodman, C. Wyman. Appl. Biochem. Biotech. 45/46 (1994) 677-698. [2] J. Zeikus, M. Jain, P. Elankovan. Appl. Microbiol Biotechnol. 51(1999) 545-552. [3] T. Werpy, G. Petersen. Top Value Added Chemicals from Biomass. Volume I—Results of
Screening for Potential Candidates from Sugars and Synthesis Gas. PNNL-NREL. (2004). [Online]. Available: http://www1.eere.energy.gov/biomass/pdfs /35523.pdf [2009, Oct 21].
[4] Th. Willke, K. Vorlop. Appl. Microbiol. Biotechnol. 66 (2004) 131-142. [5] L. R. Lynd, C. Wyman, M. Laser, D. Johnson, R. Landucci. Strategic biorefinary analysis:
analysis of biorefinaries. NREL/SR-510-35578. (2005) [Online]. Available: http://www.nrel.gov/docs/fy06osti/35578.pdf [Oct, 2009].
[6] C. Potera. Environ. Health Persp. 113, 12 (2005) A832-A835. [7] O. Wolf, M. Crank, M. Patel, F Marscheider-Weidemann, J. Schleich, B. Hüsing, G.
Angerer. Techno-economic feasibility of large-scale production of Bio-based polymers in Europe, European Science and Technology Observatory, EUR 22103 EN. (2005).
[8] B. Hermann, M. Patel. Appl. Biochem. Biotechnol. 136 (2007) 361-388. [9] B. Kamm, M. Kamm. Advances in biochemical engineering and biotechnology. White
biotechnology, ed. R. Ulber and D. Sell, Springer, Heildelberg, vol 105, ch. 4, 175-203. (2007).
[10] J. B. McKinlay, C. Vieille, J. G. Zeikus. Appl. Microbiol Biotechnol. 76 (2007) 727-740. [11] I. Bechthold, K. Bretz, S. Kabasci, R. Kopitzky, A. Springer. Chem. Eng. Technol. 31, 5
(2008) 647-654.

189
[12] A. Cukalovic, C. V. Stevens. Biofuels, Bioprod. Bioref. 2 (2008) 505-529. [13] C. Delhomme, D. Weuster-Botz, F. E. Kühn. Green Chem. 11 (2009) 13-26. [14] M. Sauer D.Porro, D. Mattanovich, P. Branduardi. 26, 2 (2008) 100-108. [15] J. Elbert. The quest to commercialize biobased succinic acid. Biomass magazine. (2007).
[Online]. Available: http://www.biomassmagazine.com/article.jsp? article_id=1228 [Sept, 2010].
[16] D. Ruth. Bio-based succinic acid bring ‘green’ chemicals closer to the market. Medical
news today. (2008) [Online]. Available: http://www.medicalnewstoday.com /articles/133890.php [Sept, 2010].
[17] H. Kidwell. Bio-succinic acid to go commercial. In-pharma technologist. (2008). [Online].
Available: http://www.in-pharmatechnologist.com/Materials-Formulation/Bio-succinic-acid-to-go-commercial [Sept, 2010].
[18] A. S. Kertes, C. J. King. Biotechnol Bioeng. 28 (1986) 269-282. [19] N. A. Collins, M. R. Shelton, G. W. Tindall, S. T. Perri R. S. O’Meadhra, C. W. Sink, B. K.
Arumugam, J. C. Hubbs. Process for the recovery of organic acids from aqueous solutions. US Patent 6670505 B1. (2003).
[20] W. H. Hong, S. Y. Lee, Y. G. Hong, H. J. Won, S. Yue, H. H. Song, E. J. Lee,
Crystallization of succinic acid from filtered fermentation broth. Korean patent application KR2007-134710. (2007).
[21] I. Fujita, K. Wada. A process for producing succinic acid. World patent application. WO
2008/010373 A1. (2008). [22] R. Datta, Process for the production of succinic acid by anaerobic fermentation. US Patent
5143833. (1992).

190
[23] R. Datta, D. Glassner, M. Jain, J. Vick, Fermentation and purification process for succinic acid. US Patent 5168055. (1992).
[24] S. Yedur, K. Berglund, D. Dunuwila. Succinic acid production and purification. US Patent
6265190 B1. (2001). [25] S. Yoshito, W. Minato, H. C. Moon, S. Praneetrattananon. Method for producing succinic
acid form raw garbage and method for separating and purifying the same. Japanese patent. JP2006296306. (2006).
[26] C. J. King, J. Starr. Recovery of carboxylic acids from water by precipitation from organic
solutions. US Patent 5104492. (1992). [27] G. Vice, M. Staley, L. Rebrovic, W. Kozak. Process for recovering carboxylic acids from
fermentation broth. Patent WO/00/20620. (2000). [28] M. Staley. Isolation of carboxylic acids from fermentation broth. US patent 6.777.213 B2.
(2004). [29] A. Baniel. A process for the recovery of dicarboxylic acid. European patent WO98/01413.
(1998). [30] A. Baniel. Recover of carboxylic acid from organic solution that contains an amine and an
extraction enhancer. US Patent 5773653. (1998). [31] A. Eyal. Process and extractant composition for extracting acids. US Patent 5831122.
(1998). [32] M. Holtzapple, R. Davison, T. Luettich. Recovery of fermentation salts from dilute aqueous
solutions. US Patent 6478965. (2002). [33] D. W. Verser, T. J. Eggeman. Recovery of organic acids. US Patent Application 0256337
A1. (2005).
191
[34] J. Van Erkel, E. L. V. Goetheer. Process for the recovery of acids. European patent EP1659197A1. (2006).
[35] C. J. King, L. Tung. Sorption of carboxylic acid from carboxylic salt solution at pHs close
to or above the pKa of the acid, with regeneration with an aqueous solution of ammonia or low-molecular-weight alkylamine. US patent 5132456. (1992).
[36] M. Cockrem, I. Kovacs, I. Mohamednur, D. Heidel. Process for purifying an organic acid.
US patent 6641734 B2. (2003). [37] T. Kushiku, K. Fujiwara, T. Satou, C. Sano. Method for purifying succinic acid from
fermentation broth. US Patent Application 0276674 A1. (2006). [38] Z. Sun, P. Zheng, Y. Ni, J. Dong. Method for extracting succinic acid from fermentation
broth by anionic resin adsorption. Chinese patent application CN2008-10195851. (2008). [39] Z. Sun, P. Zheng, Y. Ni, J. Dong. Cationic resin exchange method for separating succinic
acid from fermentation broth. Chinese patent application CN2008-10195852. (2008). [40] M. A. Theoleyre, Y. Bathany. Procede de purification d’acides organiques. French patent
application 2910823. (2008). [41] Y. Wan, J. Lu, S. Gu, W. Hua, X. Rui. Method for extracting succinic acid from ferment
broth. Chinese patent application CN2009-10067834. (2009). [42] C. Wu, M. Jiang, P. Wei, D. Lei, Z. Yao, P. Zuo. Nanofiltration method for separation of
succinic acid from its fermented broth. Chinese patent application CN2009-10025531. (2009).
[43] K. Berglund. Carboxylic acid purification and crystallization process. US patent 5034105.
(1991). [44] D. Glassner, R. Datta. Process for the production and purification of succinic acid. US
Patent 5143834. (1992).

192
[45] R. Datta, S. P. Tsai. Esterification of fermentation derived acids via pervaporation. US Patent 5723639. (1998).
[46] M. C. Cockrem. Process for the production of organic acids and esters thereof. US Patent
6291708 B1. (2001). [47] D. Dunuwila. Process for the direct production of esters of carboxylic acids from
fermentation broths. Canadian patent application 02657666. (2009). [48] C. Bauduin, W. Fischer, R. Pinkos, E. Scholten. Method of producing a carboxylic alkyl
ester. US patent application 0137825 A1. (2009). [49] S. Varadarajan, D. J. Miller. Biotechnol. Prog. 15, 5 (1999) 845-854. [50] A. Orjuela, A. J. Yanez, C. T. Lira, D. J. Miller. Carboxylic Acid Recovery from
Fermentation Solutions. US Patent Application filed Dec. 2009. [51] R. E. Vener, A. R. Thompson. Ind. Eng. Chem. 42, 1 (1950) 171-174. [52] H. Marshall, A. T. Cameron. J. Chem. Soc., Trans. 91 (1907) 1519-1537. [53] W. D. Bancroft, F. J. C. Butler. J. Phys. Chem. 36, 9 (1932) 2515-2520. [54] A. Orjuela, A. J. Yanez, A. Lee, D. J. Miller, C. T. Lira. Solubility and Phase Equilibria for
Mixtures with Succinic Acid. (2010) In revision. [55] A. Orjuela, A. J. Yanez, C. T. Lira, D. J. Miller. Recovery of succinic acid from
fermentative broth through esterification with ethanol. World Congress on Industrial Biotechnology & Bioprocessing. Jun. 27-30, Washington DC, USA, (2010).

193
PART 3: REACTIVE DISTILLATION EXPERIMENTS AND
SIMULATION

194
7. Diethyl Succinate Synthesis by Reactive Distillation
7.1 Summary
Diethyl succinate is continuously produced from succinic acid and ethanol in a six-meter,
elevated pressure reactive distillation column. Esterification is carried out in excess ethanol such
that water and ethanol are produced in the distillate and diethyl succinate is produced in the
bottoms stream. The reaction is catalyzed by Amberlyst 70 cation exchange resin contained in
KATAPAK SP-11®
structured packing within the stainless steel column. Succinic acid
conversions approaching 100%, and diethyl succinate yields of up to 98% have been
experimentally achieved in the lab scale column. The esterification process has been simulated
using the RADFRAC module in Aspen Plus®
. Simulations used reaction kinetic and phase
equilibrium data collected in our laboratory to predict the steady state stream compositions from
the column. Good agreement between experimental and simulation results was observed, thus
facilitating the use of the model for design and scale up of the reactive distillation process.
7.2 Introduction
Among the large variety of “green” chemicals of industrial importance, succinic acid
(SA) has been highlighted as a renewable platform for production of major commodities. SA can
replace petrochemical derived maleic anhydride as a feedstock for 1,4-butanediol,
tetrahydrofuran, γ-butyrolactone, 3-hydroxypropionic acid, polymers and a large variety of
value-added products. This corresponds to a current addressable market of about 1.6 million

195
tonnes per year [1]. Despite technical improvements in SA fermentation processes, recovery and
purification of the free acid still constitutes 50 to 80 percent of processing costs, because high
purity SA is required for downstream conversions.
To reduce these recovery costs, the authors have recently demonstrated a novel recovery
approach in which products obtained from SA fermentation are acidified and esterified in ethanol
[2]. At the end of this process, partially esterified succinic acid remains dissolved in ethanol,
from where it can be further converted to the pure ester. These pure esters can be catalytically
transformed into commercial SA derivatives [3-10].
Esterification with ethanol (EtOH) proceeds though a series reaction scheme as shown in
Figure 7-1, with monoethyl succinate (MES) as intermediate and diethyl succinate (DES) as final
product. Depending on reaction temperature, dehydration of EtOH to form diethyl ether (DEE)
also occurs.
Figure 7-1. Esterification of succinic acid with ethanol.
Succinic Acid Monoethyl Succinate Ethanol
Diethyl Succinate Monoethyl Succinate Ethanol
H2OOH
O
O
OH O
O
O
OHOH+ + H2OOH
O
O
OH O
O
O
OHOH+ +
H2OH2O
2H2O2H2O
Ethanol Diethyl ether

196
Because the extent of esterification is thermodynamically limited, removal of reaction
products is required to achieve complete conversion. To overcome such thermodynamic
limitations, reactive distillation (RD) can be implemented as a scalable industrial process [11-16]
to continuously remove either water or ester from the reactive media as it is formed.
Esterification of fermentation-derived acids by RD has been practiced since the 1920’s
when acids and alcohols from distillery waste were recovered using this method [17]. Recent
studies have used RD for esterification of dilute solutions of acetic, lactic, citric, and succinic
acids [18-28]. For example, dimethyl succinate was produced in a semi-batch RD process by
esterification of succinic anhydride with methanol excess using H2SO4 as catalyst [24].
Similarly, dibutyl succinate was obtained in high yields (96%) by reacting ammonium succinate
with butanol using p-toluene sulfonic acid as catalyst in a batch RD column [25].
Preliminary experiments in a glass reactive distillation column showed that achieving
high reaction rates is the primary challenge in succinic acid esterification. To raise the
temperature and obtain the highest possible rates, we examine here the esterification of succinic
acid with EtOH in a stainless steel, elevated pressure distillation column. Industrial-scale systems
a process simulations are developed using the RADFRAC module in ASPEN Plus® (Version 7.1,
ASPENTech) based on: (1) models of thermodynamic and kinetic batch experiments; (2)
verification of experimental observations of the lab-scale column performance. The effect of
major processing variables on SA conversion and DES purity are presented, along with a
proposed column design for commercial production.
7.3 Material and methods

197
7.3.1 Materials
Succinic acid (>99.5 %, Sigma-Aldrich), diethyl succinate (99.92%, Sigma-Aldrich),
monoethyl succinate (89.3%, Sigma-Aldrich), ethanol (200 proof, Decon Labs), water (HPLC
grade, J.T. Baker), diethyl ether (EMD chemicals, 99.9%), n-butanol (99.9%, Mallinckrodt), and
acetonitrile (HPLC grade, EMD) were used for experiments and analysis. Hydranal-coulomat E
solution (Riedel-de Haën) was used in Karl-Fisher analysis. Amberlyst 70®
and Amberlyst 15®
ion exchange resins, used as the catalysts in the reactive distillation packing, were purchased
from Dow Chemical Co.
7.3.2 Analysis
Analysis was performed using gas chromatography (GC), liquid chromatography (HPLC)
and Karl Fisher titration. Samples were dissolved in water (~2 wt %) for HPLC analysis. When
samples contained high amount of DES, EtOH was also added (~2 wt %) to ensure a
homogeneous solution. A HPLC system with a Waters®
717 autosampler, and Waters®
410
refractive index and Perkin Elmer LC90 UV detectors was used for characterization of succinate
species. A 100 mm x 7.6 mm fast acid analysis column (BioRad®
) was used for the separation.
A 5 mM aqueous solution of H2SO4 flowing at 1.0 ml/min was used as the mobile phase.
For GC analysis, samples were diluted 20-fold in acetonitrile containing 5 wt% n-butanol
as an internal standard. A Shimadzu®
2010 GC equipped with a flame ionization detector and
AOC-5000 autoinjector was used with a 15 m Alltech®
EC-WAX column capillary column
(0.53 mm i.d., 1.20 µm film thickness). The column temperature program consisted of an initial

198
hold at 313 K for 1.37 min, ramping at 30 K/min to 353 K, ramping at 40 K/min to 523 K, and
holding at 523 K for 4 min. The injection port was maintained at 553 K with a split ratio 5:1, and
the detector temperature was 573 K. Hydrogen was used as carrier gas (50 cm/min), with volume
injections of 1 µL.
Samples of known composition in the range of interest were used for calibration and
injected by triplicate to obtain repeatability within 0.5% by mass.
Karl-Fisher analysis (Aquacount coulometric titrator AQ-2100) was used to measure
water content in reagents and samples.
7.3.3 Reactive distillation column description
Continuous RD experiments were carried out in a 5.1 cm ID x 4.9 m tall pilot-scale
stainless steel reactive distillation column (Figure 2). The column is constructed of six removable
sections joined by flanges and separated by liquid redistributors that allowed sample collection.
The reactive zone (3.6 m) consists of sections of Katapak-SP-11®
(Sulzer Chemtech Ltd.)
structured packing containing approximately 76 kg/m3 of 0.5 mm diameter Amberlyst 70
®
cation exchange resin beads (Dow Chemical Co.). The non-reactive stripping (0.74 m) and
rectifying (0.42 m) sections contain BX®
structured gauze packing (Sulzer Chemtech Ltd.).
Stage labels in Figure 7-2 were assigned by applying the number of theoretical stages per meter
(NTSM = 2 m-1
) reported for structured packing on the literature [29, 30].
The column and the kettle-type reboiler are wrapped with electric heating tapes and glass
wood insulation. Internal thermocouples and external surface thermocouples were used to
register temperature profiles inside and outside the column.

199
Figure 7-2. Scheme of pilot plant RD column with internal catalytic packing Katapack-SP-11®
(middle zone) and BX®
structured packing (shaded zones). The brackets on the right indicate the approximate theoretical stages as described in the text. TI – Temperature indicator, S-P – Sampling port, LI – Level indicator, WI – Weight indicator, PI-Pressure indicator.
TI
TI
TI
TI
TI
TI
TI
TI
TI
TI
FI
WI
WI
WI PI
LI
LI
WI

200
The tapes along the column exterior were individually controlled at the internal column
temperature to minimize heat loss to the surroundings. The operational liquid volume in the
reboiler was 1.5 liter with a level controller. Heating power was supplied with a 2.4 kW
stainless-steel-coated electric resistance heater submerged in the liquid and connected to an
Omega temperature controller.
The column was equipped with a total condenser; coolant was supplied by a chiller
capable of providing liquid at 253 K to allow recovery of any diethyl ether (DEE).
The vapor outlet flow at the top of the column was controlled with a solenoid valve, thus
maintaining constant pressure in the column. A constant liquid level reservoir was used to collect
condensate, with an overflow outlet for distillate withdrawal. Reflux was also dispensed from
this reservoir via a controlled flow pump, and the flow rate was measured with a Coriolis
flowmeter.
Inlet streams were drawn from tanks positioned on electronic balances using two
diaphragm pumps. Pumps were calibrated prior to experiments and flow rates were controlled by
adjusting stroke length.
Because succinate species have lower volatilities than EtOH, succinic acid in EtOH was
fed above the reactive zone of the column to provide sufficient contact with the catalyst and with
EtOH vapors rising through the column. For experiments in which the column was operated
without reflux, succinic acid was introduced at the top of the column. Pure EtOH (when
required) was introduced to the column below the reactive zone. Inlet streams were fed through
heat-traced and insulated pipelines, and inlet temperatures were maintained as close as possible
to the correspondent internal temperature of the column at the feed location.

201
When required, a 0.075 m3 stirred Pyrex-glass vessel was used as a batch pre-reactor for
succinic acid in EtOH, thus providing a partially converted feed solution to the column. For the
prereactor, dry Amberlyst 15®
cation exchange resin (Dow Chemical Co.) was used as catalyst
(2% by total mass) and reaction was allowed to take place for 24 hr prior to feeding. Partial
conversions were determined prior to feeding the column.
7.3.4 Reactive distillation column operation
Because the solubility of SA in ethanol is approximately 8 wt% at 298 K, a large excess
of EtOH was used during experiments. Temperatures in the reactive zone were maintained below
393 K to avoid excessive dehydration of EtOH to DEE and to protect the Amberlyst catalyst.
Additionally, in these elevated-pressure experiments some EtOH was allowed to flow into the
reboiler to maintain temperature low enough to avoid unsafe conditions or thermal
decomposition of succinate species (as was observed in a similar system) [22].
To reduce excessive use of reactants and minimize waste generation during start-up, the
liquid hold-up from the column at the end of a run was kept in the reboiler and the lower part of
the column. This liquid contained mainly succinate species, which are generally removed in the
bottom product during operation. Considering both the large reboiler holdup and the low SA feed
concentration, this method provides a large initial inventory of succinate species and thus
reduces the time required to reach steady state in subsequent runs.
In typical operation, the column was started by slowly adding power to the reboiler heater
and external heating tapes as the vapor reached each zone of the column. After vapors reached
the condenser, total reflux was maintained until a stable temperature profile and pressure were

202
reached. Feed pumps were then started at the specified rates for the experiment and products
from distillate and bottoms were collected.
Stream flow rates, acid values of the bottom product, column top pressure, and
temperature profiles were recorded on time intervals of 15 to 30 minutes throughout the run.
Inlet flows were measured by weight change of the feed tanks during operation. Outlet flows
from distillate and bottoms were obtained by measuring volume and density of liquid collected in
volumetric flasks. The acid value (AV) of the bottom product, reported as mg KOH per gram of
sample, was obtained by titration with 0.1M solution of NaOH in EtOH-H2O until final point
with phenolphthalein. This parameter was used to indicate the approach to steady state and was
calculated as:
(7-1)
VNaOH and MNaOH are the volume and molarity of NaOH solution used in the titration.
After reaching steady state, liquid samples were collected in sealed vials from sampling
ports along the column and from the bottom and top streams every hour until the end of the
experiment. These samples were labeled and refrigerated at 277 K before analysis.
The criteria for achieving steady state during column operation included reaching acid
values (AV) with less than ~ 5 % variation in consecutive samples, temperature profiles
changing less than ± 0.5 K/hr, and pressure remaining constant (± 7 kPa) at the top of the
column. Additional criteria were variations of less than 5% in inlet and outlet mass flow rates,
and closure of total and component mass balances over the column within ± 5%. This last
56100
NaOH NaOHmg KOH
V Mequivalent
AVg sample
× ×
=

203
criterion was evaluated after the run ended, because most analyses were done following the
experiment.
7.4 Results and discussion
7.4.1 Reactive distillation experiments
The complete set of conditions and results of the reactive distillation runs carried out in
this study are presented in Tables 7-1 and 7-2. Experimental conditions are given in Table 7-1,
and outlet flow rates and compositions are given in Table 7-2.
Numbers within square brackets in flow column in Table 7-1 correspond to mass flow
rate of EtOH from bottoms. The SA/EtOH feed was converted in the pre-reactor only in Runs
11A, 11B and 11C. All experiments were conducted without reflux (RR) except for experiments,
9B (RR = 0.58) and 9C (RR = 1.88). In all experiments, flow rates and temperatures of feed
streams (succinate/EtOH and pure EtOH) were maintained as constant as possible to facilitate
comparison among different operating conditions, although some variation in feed rates was
observed. Variations in outlet flow rates are caused by foaming, pressure variations, and uneven
boiling, all of which affect the level controller in the reboiler and condensate reservoir. Both
inlet and outlet flow rates are therefore reported in Tables 7-1 and 7-2 as the average total inlet
feed rate (W•
) over the course of experiment with the mean absolute deviation (MAD) of flow
rate from the average over all measurements (W•
± MAD). In almost all experiments, the
difference between the sum of average flow rates in and the sum of average flow rates out was
less than 5%, although a few experiments (Runs 6A, 7A and 11A) exhibited slightly larger
differences and were thus deemed not to have entirely reached steady state.

204
Table 7-1. Experimental conditions for continuous RD. Corresponding outlet compositions are summarized in Table 7-2
Top Feed (SA in EtOH-H2O)
[Bottom Feed, (100 % EtOH)] Bottoms
Run
Code
Reboiler
Power
(kW)
Gauge
P
(kPa)
wt% SA wt% H2O Flow
(g/min)
Distillate
flow
(g/min) flow
(g/min)
AV
(mg KOH / g)
T
(K)
5A 0.84 310 6.7 - 31.9 ± 0.8 17.1 ± 0.9 13.9 ± 1.0 - 393.1 5B 0.72 310 6.7 - 30.2 ± 0.3 11.1 ± 0.5 18.2 ± 1.1 - 392.4 5C 0.55 310 6.7 - 30.4 ± 0.1 4.0 ± 0.1 26.1 ± 0.4 - 393.1 6A 1.03 310 6.7 - 31.2 ± 0.2 30.8 ± 0.9 3.3 ± 0.6 33 404.7 7A 0.74 138 6.7 - 31.9 ± 1.3 22.7 ± 0.8 11.8 ± 1.3 12.7 378.2
8A 0.98 310 6.7 - 31.1± 0.1 [5.0 ± 0.2]
25.5 ± 0.2 10.1 ± 0.3 13.7 394.4
8B 1.08 310 6.7 - 31.2 ± 0.2
[10.3 ± 0.1] 31.2 ± 0.5 9.7 ± 0.4 8.7 393.9
9A 0.89 310 6.7 - 30.7 ± 0.7 19.9 ± 0.3 10.6 ± 0.5 10 393.9 9B 1.13 310 6.7 - 30.0 ± 1.2 19.1 ± 0.4 10 ± 0.9 12.6 394.6 9C 1.61 310 6.7 - 30.8 ± 0.1 20.7 ± 0.5 9.4 ± 0.4 9.4 393.8 10A 1.08 579 6.7 - 30.6 ± 0.3 21.5 ± 0.5 10.1 ± 0.7 19 411.0
10B 1.34 579 6.7 - 30.4 ± 0.1
[14.8 ± 0.6] 33.7 ± 0.4 11.6 ± 0.9 9.1 410.6
11A 1.15 310 25.0† - 30.0 ± 0.5 20.8 ± 0.2 11.6 ± 1.0 148.4 439.7
11B 1.54 310 25.0† -
31.6 ± 1.3 [16.5 ± 0.3]
35.6 ± 0.3 11.8 ± 0.6 4.7 474.8
11C 1.78 310 25.0† -
31.6 ± 0.1 [27.9 ± 0.8]
47.6 ± 0.5 12.4 ± 0.6 2.3 481.0
15A 0.77 72 6.7 - 32.8 ± 0.5 23.5 ± 1.0 9.2 ± 0.7 12.5 368.1 15B 0.74 41 6.7 - 30.8 ± 0.1 23.1 ± 0.5 8.2 ± 0.6 15.6 362.6 16A 1.25 41 6.7 - 59.3 ± 1.1 51.1 ± 0.9 7 ± 0.7 54 373.2 17A 1.74 34 6.7 - 90.5 ± 0.8 81.2 ± 0.7 9.8 ± 1.0 89.4 380.1 18A 1.28 41 6.7 7.0 59.7 ± 0.6 49.5 ± 0.8 10.3 ± 0.7 80.8 365.7 19A 1.33 41 6.7 7.0 60.2 ± 0.4 49.9 ± 2.0 8 ± 1.2 112.8 372.0
† SA concentration in top feed is reported before pre-reaction

205
Table 7-2. Summary of outlet streams composition obtained in RD experiments. Corresponding flowrates are in Table 7-1.
Distillate composition wt% Bottoms Composition wt% Run
Code H2O DEE EtOH MES DES SA
H2O DEE EtOH MES DES SA
SA
conversion
(%)
Selectivity
to DES
(%)
5A 1.0 1.5 97.5 0.0 0.0 0.0 4.3 0.0 71.3 2.7 21.9 0.1 99.5 87.2 5B 0.4 3.1 96.4 0.0 0.0 0.1 3.7 0.0 77.9 1.6 16.6 0.1 98.1 89.6 5C 0.2 8.3 91.4 0.0 0.0 0.1 3.0 0.0 84.2 0.9 11.7 0.2 97.8 91.4 6A 1.8 0.6 97.6 0.0 0.0 0.0 5.0 0.0 21.0 12.6 61.1 0.8 98.8 80.3 7A 0.9 0.3 98.7 0.0 0.0 0.1 4.0 0.0 70.6 2.4 22.8 0.2 97.8 88.6 8A 1.3 1.1 97.5 0.0 0.0 0.1 3.2 0.0 64.2 3.3 29.2 0.2 98.1 88.1 8B 1.8 1.1 97.1 0.0 0.0 0.1 1.4 0.0 68.4 1.6 28.6 0.0 98.8 93.7 9A 2.5 1.9 95.5 0.0 0.0 0.0 3.6 0.0 63.8 2.9 29.7 0.1 99.7 89.7 9B 3.1 1.7 95.2 0.0 0.0 0.0 2.5 0.0 61.5 3.0 32.9 0.1 99.7 90.2 9C 2.9 2.2 94.9 0.0 0.0 0.0 3.0 0.0 62.4 1.8 32.7 0.1 99.5 93.7 10A 1.1 6.5 92.2 0.0 0.0 0.1 6.6 0.0 62.4 4.4 26.3 0.3 97.1 83.5 10B 2.4 4.3 93.3 0.0 0.0 0.1 1.7 0.0 72.2 1.6 24.5 0.1 98.3 92.8
11A 6.7 1.0 91.9 0.1 0.2 0.2 2.8 0.0 1.8 30.4 63.2 1.8 96.7§ 86.4
§
11B 7.1 1.6 90.8 0.1 0.2 0.2 0.1 0.0 2.9 0.5 96.0 0.5 98.4§ 99
§
11C 6.6 1.3 91.7 0.0 0.2 0.2 0.1 0.0 1.8 0.3 97.5 0.2 92.2
‡
98.4§
62.7‡
99.6§
15A 1.9 0.1 98.0 0.0 0.0 0.0 2.4 0.0 63.5 3.5 30.5 0.1 99.7 87.9 15B 2.4 0.0 97.5 0.0 0.0 0.0 2.5 0.0 58.2 4.6 34.6 0.1 99.4 86 16A 2.1 0.0 97.8 0.0 0.0 0.0 2.1 0.0 24.6 12.9 59.3 1.2 95.7 79.5 17A 1.6 0.0 98.4 0.0 0.0 0.0 2.3 0.0 19.0 18.3 57.8 2.5 93.1 72.6 18A 6.8 0.0 93.2 0.0 0.1 0.0 10.6 0.0 28.9 16.1 42.1 2.4 92.1 68.9 19A 6.8 0.0 93.1 0.0 0.1 0.0 14.1 0.0 12.0 22.8 47.3 3.7 90.1 63.7
‡ Intermediate calculation for pre-reactor contents fed to the column.
§ Total conversion including pre-reactor and RD column.

206
Characteristic dynamics of flows and compositions during approach to steady state in a
typical experiment (Run 11) are presented in Figures 7-3 and 7-4. As presented in Table 7-1, Run
11 operated with a pre-reacted acid mixture as the top feed. Column performance was evaluated
by feeding EtOH to the bottom of the reactive zone at three different flow rates (A, B and C). As
seen in Figure 7-3, the total time to initially reach steady state was 18 to 24 h; this value
depended on the bottoms flow rate used in the experiment.
Acid value (AV) of the bottoms stream was measured during operation and gave a good
indicator of approach to steady state, particularly when compared with product composition
profiles reported in Figures 7-3 and 7-4.
Figure 7-3. Outlet flows and acid value profiles with time during approach to steady state in run 11A (left), 11B (middle) and 11C (right). (□) - Distillate flow, (○) – Bottoms flow, (▲) Acid value at the bottoms.
Chromatographic analyses of product samples were conducted following completion of
reactive distillation runs as described in Section 7.3. Concentrations of succinate species reported
0
15
30
45
60
75
400 1200 2000 2800
time (min)
Flow
c
m3 /m
in
0
40
80
120
160
AV
m
gKO
H/g

207
in Table 7-3 are the average of HPLC and GC measurements; H2O concentration was obtained
by Karl Fischer analysis. Variations in stream compositions with time are mainly attributed to
flow instabilities and pressure perturbations during operation.
Figure 7-4. Time evolution of composition in distillate and bottom product in run 11B during
approach to steady state. (○) - DES, (□) - MES, (∆) - SA, (●) - H2O, (▲) - EtOH, (+) - DEE.
0
1
2
3
4
5
1900 2000 2100 2200 2300
Time (min)
%w
80
85
90
95
100
DE
S %
w
Run 11B - Bottoms
0
3
6
9
1900 2000 2100 2200 2300
Time (min)
%w
80
85
90
95
100E
tOH
%w
Run 11B - Distillate
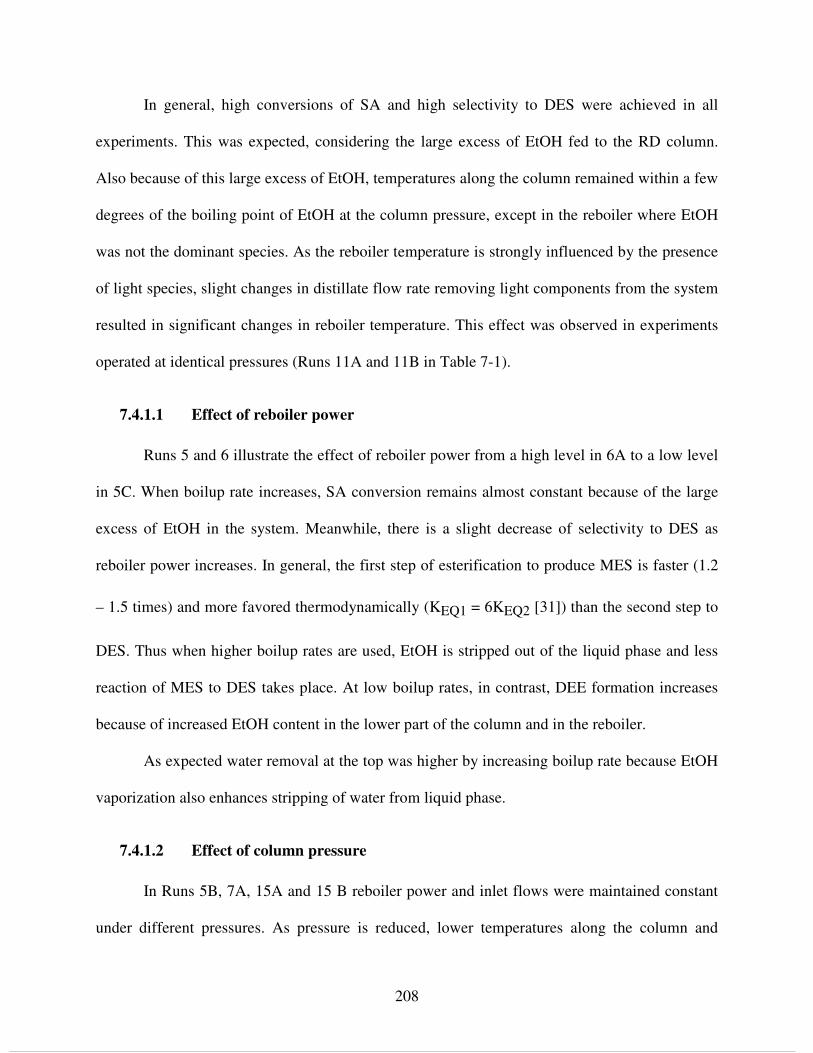
208
In general, high conversions of SA and high selectivity to DES were achieved in all
experiments. This was expected, considering the large excess of EtOH fed to the RD column.
Also because of this large excess of EtOH, temperatures along the column remained within a few
degrees of the boiling point of EtOH at the column pressure, except in the reboiler where EtOH
was not the dominant species. As the reboiler temperature is strongly influenced by the presence
of light species, slight changes in distillate flow rate removing light components from the system
resulted in significant changes in reboiler temperature. This effect was observed in experiments
operated at identical pressures (Runs 11A and 11B in Table 7-1).
7.4.1.1 Effect of reboiler power
Runs 5 and 6 illustrate the effect of reboiler power from a high level in 6A to a low level
in 5C. When boilup rate increases, SA conversion remains almost constant because of the large
excess of EtOH in the system. Meanwhile, there is a slight decrease of selectivity to DES as
reboiler power increases. In general, the first step of esterification to produce MES is faster (1.2
– 1.5 times) and more favored thermodynamically (KEQ1 = 6KEQ2 [31]) than the second step to
DES. Thus when higher boilup rates are used, EtOH is stripped out of the liquid phase and less
reaction of MES to DES takes place. At low boilup rates, in contrast, DEE formation increases
because of increased EtOH content in the lower part of the column and in the reboiler.
As expected water removal at the top was higher by increasing boilup rate because EtOH
vaporization also enhances stripping of water from liquid phase.
7.4.1.2 Effect of column pressure
In Runs 5B, 7A, 15A and 15 B reboiler power and inlet flows were maintained constant
under different pressures. As pressure is reduced, lower temperatures along the column and

209
higher distillate flow rates were observed. Operating at high pressures high SA conversion and
high selectivity to DES were obtained but higher temperatures enhanced undesirable dehydration
of EtOH.
7.4.1.3 Effect of EtOH feed
When pure EtOH is fed below the reactive zone (Runs 8A and 8B) and a constant
bottoms flow rate is maintained, a higher concentration of DES is achieved in the bottoms along
with more extensive removal of H2O in the distillate. In this case, EtOH acts both as a reactant
and as stripping agent to pull H2O out of the liquid phase via formation of the azeotrope.
Operating with EtOH feed to the column at higher pressures (Runs 10A and 10B) improved DES
yield, but also increased DEE generation because of higher temperatures and a larger excess of
EtOH.
7.4.1.4 Effect of reflux ratio
Increasing reflux ratio (Runs 9A, 9B, 9C) while maintaining constant outlet flow rates
gave no appreciable change in SA conversion and a slight increase in DES selectivity.
7.4.1.5 Operation with pre-reactor
In Run 11, a pre-reacted succinate acid-ester mixture in EtOH that was run to nearly an
equilibrium composition was used as the feed. This prereacted feed contained a much higher
succinate concentration (25 wt% SA equivalent) than the regular feed (7 wt% SA). Higher
boiling points were thus observed in the reboiler; however, no decomposition products were
detected in the bottoms. With only the prereacted feed stream to the column, high concentrations
of MES were found at bottoms. In contrast, when EtOH was fed to the column in a second feed

210
stream below the reactive zone, almost complete conversion of SA was achieved with DES
purity in the bottoms of 98%. This demonstrates clearly the attractiveness of reactive distillation
for the production of DES.
7.4.1.6 Effect of inlet acid flow rates
In Runs 15B, 16A and 17A, the effect of different flow rates of acid feed was studied at
low pressure to evaluate processing capacity of the pilot equipment. As expected, increasing
flow rate of the top feed reduces SA conversion and DES purity. Considering that KATAPAK
SP-11 is a sandwich-type structured packing with one catalytic layer per non-catalytic layer,
excess liquid may bypass the catalyst layer and flow downwards without reacting. In this case, a
higher dynamic liquid hold-up on the structured packing may be created by the higher vapor
flow rate generated in the reboiler. This condition has been extensively reported in the literature
as operation over the catalytic loading point [29, 32-36].
7.4.1.7 Effect of water in the feed
The presence of water in the acid feed was evaluated in Runs 18A and 19A, where the
SA solution was prepared with the azeotropic mixture of EtOH and water. A substantial drop in
SA conversion and selectivity to DES relative to Run 16A (with pure EtOH fed) was observed,
and substantial water was found in the reboiler (up to 14 wt %) that contributes to product
hydrolysis.
After analysis of experiments described above, a preferable RD process to obtain high
purity DES would include a pre-reactor and an EtOH feed below the reactive zone of the
column. Operating pressures must be as high enough to guarantee high conversion but as low as

211
possible to minimize DEE formation. According to experimental results, operating at 140 kPa
with EtOH feed near the bottoms may drive reaction to completion with low dehydration to
DEE. Despite results indicating that higher reflux ratios benefit conversion, the inlet flow rate of
EtOH at the bottom port also affects conversion. It is expected that, above a certain limit, reflux
water content starts to have a negative impact on the extent of esterification in the column.
Considering the large amount of work required to evaluate a variety of operating
conditions that still remain to be studied more operating conditions by experiment, further
analysis of RD column performance is addressed by simulation in next section.
7.4.2 Simulation of RD experiments
Simulation of RD operation was performed using a steady state model (RADFRAC®
) in
Aspen Plus® process design software (Version 7.1, AspenTech). Modeling of distillation was
carried out using an equilibrium stage approach with chemical reactions modeled using pseudo-
homogeneous kinetics. Description of the calculation algorithm has been previously described in
detail in the literature [37]. Phase equilibria of these non-ideal reactive mixtures were modeled
by the NRTL equation to calculate activity in the liquid phase [38], and by the Hayden O-
Connell (HOC) equation for fugacity coefficient in the vapor phase [39, 40]. Most binary
parameters were obtained by regression of experimental data, as reported in previous work from
our group [41-44]. Remaining parameters were obtained or regressed from literature data [31,
45], or used directly from the ASPEN database. A list of parameters used in phase equilibria
models are summarized in Table 7-3. In the absence of strong association in the vapor phase
listed in table, the HOC parameter is zero.

212
Table 7-3. Binary parameters for NRTL and HOC equations [38, 39].
HOC binary parameters
i j i j i j
H2O H2O 1.7 EtOH EtOH 1.4 DES DEE 0.5
H2O EtOH 1.55 EtOH DES 1.3 DEE DEE 0.5
H2O DES 1.3 EtOH DEE 0.5
H2O DEE 0.5 DES DES 0.53
NRTL binary parameters
i j aij aji bij bji ααααij
H2O EtOH 0.514285 0.806535 444.8857 -266.533 0.4
H2O SA 0 0 296.7226 -328.506 0.3
H2O DES 4.384591 -1.58 184.7326 1136.555 0.36842
H2O MES 0 0 880.7603 -200.977 0.3
H2O DEE 8.412378 0.617494 -1496.24 547.9293 0.348988 EtOH SA 0 0 -605.634 113.4481 0.3 EtOH DES 0 0 653.8819 -158.856 0.3 EtOH MES 0 0 -292.308 400.6306 0.3 EtOH DEE 4.3596 -3.5877 -1209.49 1381.066 0.3
SA DES 0 0 1946.876 218.2243 0.3 SA MES 0 0 -368.762 1039.777 0.3 SA DEE 0 0 1947.928 248.4113 0.3
DES MES 0 0 -44.2052 137.2218 0.3 DES DEE 0 0 595.5747 -404.406 0.3 MES DEE 0 0 100.6717 88.62851 0.3
Reactions were described by a pseudo-homogeneous activity-based kinetic model
previously developed for Amberlyst 70®
[31]. Collected data on self-catalytic and Amberlyst
15®
catalyzed SA esterification previously fitted with a mole fraction based kinetics [46] were
also regressed with the activity model. Volumetric rates of reaction for the first and second steps
of esterification and also for DEE formation are presented in Equations 7-2, 7-3 and 7-4
respectively.

213
(7-2)
(7-3)
(7-4)
In Eq. (2) – (4), 0m
k and maE are the pre-exponential factor and the energy of activation
of the forward reaction m, respectively. The equilibrium constant of reaction m,mEQK , is the
ratio of forward and reverse rate constants. ix , and iγ , are the mole fraction and activity
coefficient of component i in the liquid phase. CATw is the catalyst weight loading per weight of
liquid and Solρ is density of the reactive solution.
In self-catalyzed reactions, CATw and Solρ are set to one for Eq. 7-2, 7-3 and 7-4.
Etherification was only considered when catalysts were present.
The above kinetics for Amberlyst 70®
was used to model reactive stages in the column.
Self-catalyzed kinetics, evaluated experimentally for homogeneous mixtures of SA and EtOH,
were included to model reactions in stripping stages (including the reboiler) below the reactive
zone to account for hydrolysis caused by H2O remaining in the reboiler and bottoms streams.
( )3
233 0 exp a
CAT Sol EtOH EtOHE
r w k xRT
ρ γ − =
( ) ( )( )( )1
2 211 0 1
exp MES MES H O H OaCAT Sol SA SA EtOH EtOH
EQ
x xEr w k x x
RT K
γ γρ γ γ
− = −
( )( )( ) ( )2
2 222 0 2
exp DES DES H O H OaCAT Sol MES MES EtOH EtOH
EQ
x xEr w k x x
RT K
γ γρ γ γ
− = −

214
The pre-reactor was modeled as a continuous stirred tank reactor with 24 hr retention time using
the kinetic expression for Amberlyst 15®
resin. The complete list of kinetic parameters used in
simulations is summarized in Table 7-4. Parameters used for simulation of pilot plant
experiments are summarized in Table 7-5.
The catalyst volumetric concentration CATC (kg Catalyst / m3 Liquid) in AspenPlus for
each reactive stage was calculated from the volumetric hold-up (h = 0.1 m3 Liquid / m
3 Column)
and the catalyst loading (or catalyst packing density in the column, Catρ = 78 kg CAT / m3
Column) using Equation 7-5.
(7-5)
Table 7-4. Parameters for activity-based kinetics used in simulation of RD experiments.
Parameter Amberlyst 70®
Amberlyst 15®
Self-Catalytic
10k (kmol/ kg CAT) (1/s) 1.04x10
4 5.17x10
3 1.57 x10
5 §
1aE (kJ/kmol/K) 46200 46900 57300
1EQK 48.9
20k (kmol/ kg CAT) (1/s) 2.11x10
3 7.0x10
4 17.8
§
2aE (kJ/kmol/K) 46600 61400 34400
2EQK 10.14
30k (kmol/ kg CAT) (1/s) 4.99 x10⁴ 8.06 x10
4 ‡ -
3aE (kJ/kmol/K) 85400 86900
‡ -
§ Pre-exponential factor has units of (kmol/m
3)(1/s)
‡ Mole fraction model assuming unity activity coefficients in Eq. 7-4.
CatCAT CAT SolC w
h
ρρ= × =

215
Table 7-5. Parameters used for simulation of RD system.
Parameter
Total number of stages (N) 12 HETP – Height equivalent to theoretical plate (m) 0.5
Catalytic (3-9) 7 Reactive stages
Non-catalytic (10-12) 3 Acid feed Above 3
Feed Stages EtOH feed On 10
Column pressure drop per stage (kPa) 0.07
Reflux ratio 0.001
Murphree stage efficiency (stages 2 to 11) 0.5
Liquid holdup (cm3) (stages 2 to N-1) (10 % vol) 98.2
Reboiler holdup (cm3) 1500
Top 1 Product removal stage
Bottom 12
Catalyst loading (kg Catalyst / m3 Column) 78
Catalyst concentration ( CATC ) was multiplied by 0k in Eq. 7-2 to 7-4 and results were
used as pre-exponential factors in Aspen input formats of reactive distillation type-kinetics. For
the pre-reactor, 0k was multiplied by the catalyst loading used in experiments (0.02 kgCAT /
kgLiq) and the average liquid density of 900 kg/m3.
To estimate hydrodynamic conditions attained in the column, the fractional approach to
maximum capacity (fMC) was calculated in each simulation using the Aspen pack sizing tool.
Hydrodynamics for catalytic packing were evaluated by using a structured packing available in
Aspen database (MELLAPAK-250Y®
, Sulzer) with similar HETP, holp-up and pressure drop
per meter to KATAPAK SP-11. In every simulation, fMC was adjusted until calculated column
diameter matched that of the pilot column.

216
Considering the strong dependence of reboiler temperature on boilup rate observed in
column operation, simulations were matched with experiments by equating bottoms temperature
and EtOH concentration in the reboiler. For this purpose, distillate flow rates were adjusted in
simulations within the range of variation observed in experimental flows (~ 5%) to obtain a
reboiler temperature and EtOH mass fraction as close as possible to those obtained in
experiments.
Simulation results are summarized in Table 7-6. In general, the results are in good
agreement with experimental results reported in Tables 7-1 and 7-2; for example, most simulated
column temperature profiles agree with experimental profiles to within a few degrees
Centigrade. The average deviation between predicted and experimental concentrations of DES in
the bottoms stream and EtOH in the distillate stream is less than 10% in most experiments. As
expected, higher relative deviations were observed in components present at low concentrations
(<5%) because at low concentrations uncertainty in analytical measurements are more
significant.
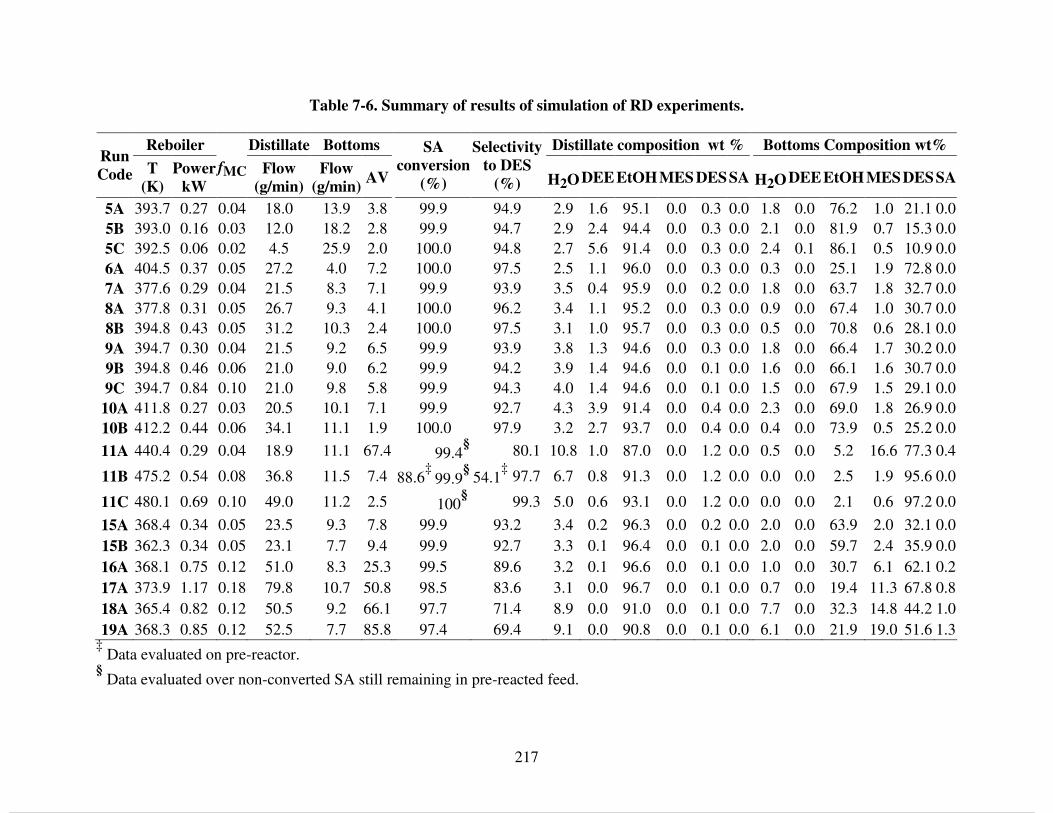
217
Table 7-6. Summary of results of simulation of RD experiments.
Reboiler Distillate Bottoms Distillate composition wt % Bottoms Composition wt% Run
Code T
(K)
Power
kW
fMC Flow
(g/min)
Flow
(g/min) AV
SA
conversion
(%)
Selectivity
to DES
(%)
H2O DEE EtOH MES DES SA
H2O DEE EtOH MES DES SA
5A 393.7 0.27 0.04 18.0 13.9 3.8 99.9 94.9 2.9 1.6 95.1 0.0 0.3 0.0 1.8 0.0 76.2 1.0 21.1 0.0 5B 393.0 0.16 0.03 12.0 18.2 2.8 99.9 94.7 2.9 2.4 94.4 0.0 0.3 0.0 2.1 0.0 81.9 0.7 15.3 0.0 5C 392.5 0.06 0.02 4.5 25.9 2.0 100.0 94.8 2.7 5.6 91.4 0.0 0.3 0.0 2.4 0.1 86.1 0.5 10.9 0.0 6A 404.5 0.37 0.05 27.2 4.0 7.2 100.0 97.5 2.5 1.1 96.0 0.0 0.3 0.0 0.3 0.0 25.1 1.9 72.8 0.0 7A 377.6 0.29 0.04 21.5 8.3 7.1 99.9 93.9 3.5 0.4 95.9 0.0 0.2 0.0 1.8 0.0 63.7 1.8 32.7 0.0 8A 377.8 0.31 0.05 26.7 9.3 4.1 100.0 96.2 3.4 1.1 95.2 0.0 0.3 0.0 0.9 0.0 67.4 1.0 30.7 0.0 8B 394.8 0.43 0.05 31.2 10.3 2.4 100.0 97.5 3.1 1.0 95.7 0.0 0.3 0.0 0.5 0.0 70.8 0.6 28.1 0.0 9A 394.7 0.30 0.04 21.5 9.2 6.5 99.9 93.9 3.8 1.3 94.6 0.0 0.3 0.0 1.8 0.0 66.4 1.7 30.2 0.0 9B 394.8 0.46 0.06 21.0 9.0 6.2 99.9 94.2 3.9 1.4 94.6 0.0 0.1 0.0 1.6 0.0 66.1 1.6 30.7 0.0 9C 394.7 0.84 0.10 21.0 9.8 5.8 99.9 94.3 4.0 1.4 94.6 0.0 0.1 0.0 1.5 0.0 67.9 1.5 29.1 0.0 10A 411.8 0.27 0.03 20.5 10.1 7.1 99.9 92.7 4.3 3.9 91.4 0.0 0.4 0.0 2.3 0.0 69.0 1.8 26.9 0.0 10B 412.2 0.44 0.06 34.1 11.1 1.9 100.0 97.9 3.2 2.7 93.7 0.0 0.4 0.0 0.4 0.0 73.9 0.5 25.2 0.0
11A 440.4 0.29 0.04 18.9 11.1 67.4 99.4§ 80.1 10.8 1.0 87.0 0.0 1.2 0.0 0.5 0.0 5.2 16.6 77.3 0.4
11B 475.2 0.54 0.08 36.8 11.5 7.4 99.9§ 97.7 6.7 0.8 91.3 0.0 1.2 0.0 0.0 0.0 2.5 1.9 95.6 0.0
11C 480.1 0.69 0.10 49.0 11.2 2.5
88.6‡
100§
54.1‡
99.3 5.0 0.6 93.1 0.0 1.2 0.0 0.0 0.0 2.1 0.6 97.2 0.0
15A 368.4 0.34 0.05 23.5 9.3 7.8 99.9 93.2 3.4 0.2 96.3 0.0 0.2 0.0 2.0 0.0 63.9 2.0 32.1 0.0 15B 362.3 0.34 0.05 23.1 7.7 9.4 99.9 92.7 3.3 0.1 96.4 0.0 0.1 0.0 2.0 0.0 59.7 2.4 35.9 0.0 16A 368.1 0.75 0.12 51.0 8.3 25.3 99.5 89.6 3.2 0.1 96.6 0.0 0.1 0.0 1.0 0.0 30.7 6.1 62.1 0.2 17A 373.9 1.17 0.18 79.8 10.7 50.8 98.5 83.6 3.1 0.0 96.7 0.0 0.1 0.0 0.7 0.0 19.4 11.3 67.8 0.8 18A 365.4 0.82 0.12 50.5 9.2 66.1 97.7 71.4 8.9 0.0 91.0 0.0 0.1 0.0 7.7 0.0 32.3 14.8 44.2 1.0 19A 368.3 0.85 0.12 52.5 7.7 85.8 97.4 69.4 9.1 0.0 90.8 0.0 0.1 0.0 6.1 0.0 21.9 19.0 51.6 1.3
‡ Data evaluated on pre-reactor.
§ Data evaluated over non-converted SA still remaining in pre-reacted feed.

218
At identical conditions, SA conversion and selectivity to DES are slightly higher in
simulation than in experiments. Possible explanations for this observation include: 1) actual
column operation at a low fraction of flooding (fMC < 0.2), which likely results in incomplete
liquid distribution and therefore incomplete catalyst wetting within the structured packing; and 2)
the particle size of Amberlyst 70 catalyst used in the structured packing (dP > 0.5 mm) was
larger than that used in kinetic measurements (dP < 0.3 mm), thus reducing effectiveness factor
of the column catalyst [31, 46].
In simulations, HETP is taken as a constant along the column height. In reality, changes
in flows (and other parameters such as pressure, reflux ratio, number and location of feed
streams, etc. [47, 48]) in different sections of the column result in changes in HETP along the
column height. The differing stage-to-stage HETP values will result in a mismatch of
temperature and composition profiles between experiment and simulation. Temperature and
composition profiles obtained by simulation of experimental Run 11C are presented in Figure 7-
5. While simulated outlet flow compositions and temperature profiles match well with
experiments, composition profiles within the column differ significantly, mainly in the lower part
of the column. Nevertheless, the simulations carried out here using the equilibrium stage model
reproduce all major trends seen in experiments, and are able to predict reasonably accurately
column performance. We therefore use the model to examine column behavior over a broader
range of operating conditions than what was done experimentally.

219
Figure 7-5. Results obtained by simulation of run 11C. a) Global mass and component balance comparison with experimental data. b) Temperature and concentration profiles. Lines in column profiles represent results obtained by simulation. (○, ▬) - DES, (□, - -) - MES, (∆, - - ▬ - -) -
SA, (●, ▬ ▬) - H2O, (▲, ▬ ▬) - EtOH, (Χ, ▬) - DEE.
TOP
FEED
FEED
31.65 g/min
298 K
wt%
SA 25 EtOH 75
PRE-REACTED
FEED
31.65 g/min
353 K
wt%
Exp. Sim.
SA 1.95 2.85 MES 12.48 12.58 DES 21.31 17.70
EtOH 58.34 61.68 H2O 5.43 5.20 DEE - -
EtOH
FEED
16.65
g/min
353 K
%w
EtOH 100
CSTR
80 °C
55 L
DISTILLATE
Exp. Sim.
T (K) 384 390 Flow
(g/min) 35.5 36.8
wt%
SA 0.18 - MES 0.10 0.01 DES 0.25 1.22
EtOH 90.83 91.34 H2O 7.06 6.67 DEE 1.58 0.77
BOTTOMS
Exp. Sim.
T (K) 474 474 Flow
(g/min) 11.8 11.5
wt%
SA 0.50 - MES 0.55 1.92 DES 96.0 95.62
EtOH 2.89 2.45 H2O 0.06 0.01 DEE - -
a

220
Figure 7-5. Continuation. b) Temperature and concentration profiles. Lines in column profiles represent results obtained by simulation. (○, ▬) - DES, (□, - -) - MES, (∆, - - ▬ - -) - SA, (●, ▬
▬) - H2O, (▲, ▬ ▬) - EtOH, (Χ, ▬) - DEE.
7.4.2.1 Effect of reflux ratio in operation without pre-reactor
Figure 7-6 describes results obtained by simulation of Run 9 in which reflux ratio was
varied. It is seen that SA conversion remains high even up to a reflux ratio of 10, because the
large excess of EtOH drives first step of esterification (SA to MES) to completion.
0 2 4 6 8
1
2
3
4
5
6
7
8
9
10
11
12
Stage
% w
0 25 50 75 100
% w EtOH, DES
380 420 460 500
T (K)
b

221
However, in accord with experiment, the selectivity to DES goes through a maximum
around a reflux ratio of 2.0 and declines at higher reflux ratios because H2O recycling limits
MES conversion and leads to DES hydrolysis. Low reflux ratios are therefore desirable for
optimal column operation.
Figure 7-6. Effect of reflux ratio under experimental conditions in run 9. (▬ ▬) - SA conversion, (▬) - Selectivity to DES, (Χ) - Power at the reboiler.
7.4.2.2 Effect of splitting EtOH inlet flow
As discussed above, the use of the pre-reactor with the RD column requires less EtOH to
achieve a homogeneous solution of the SA feed stream. Also, adding EtOH near the bottom of
the column enhances overall DES yield (Run 11). Here, simulations were conducted to examine
the effect of distributing EtOH between top and bottom feeds at conditions of Run 11A. Split
ratio is defined as the ratio of EtOH flow introduced to a bottom feed over EtOH fed with SA.
92
94
96
98
100
0 1 2 3 4 5 6
Reflux ratio
% X
SA ,
% S
DE
S
0
0.5
1
1.5
2
njnj njnj
(kW
)

222
The effect of varying split ratio from zero (Run 11A) to 0.5 (maximum to achieve a
homogeneous SA solution) is presented in Figure 7-7.
Despite a lower SA conversion in the pre-reactor (from 88% to 82%) because of the
smaller concentration of EtOH in the acid feed, increasing the EtOH split ratio produces a higher
global SA conversion and higher selectivity to DES at the same reboiler power. Even with a
higher DES concentration in the reboiler and thus a slightly higher reboiler temperature as split
ratio is increased, a negligible increase in DEE formation is observed. This result indicates that
using an elevated temperature pre-reactor (i.e. high SA solubility) and redirecting some ethanol
to a feed near the bottom of the column results in increased DES yield from the process.
Figure 7-7. Effect of splitting total EtOH inlet flow in run 11A between two inlet streams: pre-reacted acid feed steam at the top and pure EtOH stream at bottom. (▬) - SA conversion, (▬) - Selectivity to DES, (○) – Reboiler temperature.
75
80
85
90
95
100
0 0.2 0.4 0.6
EtOH Split Ratio
% X
SA ,
% S
DE
S
438
443
448
453
458
T B
ott
om
s (K
)
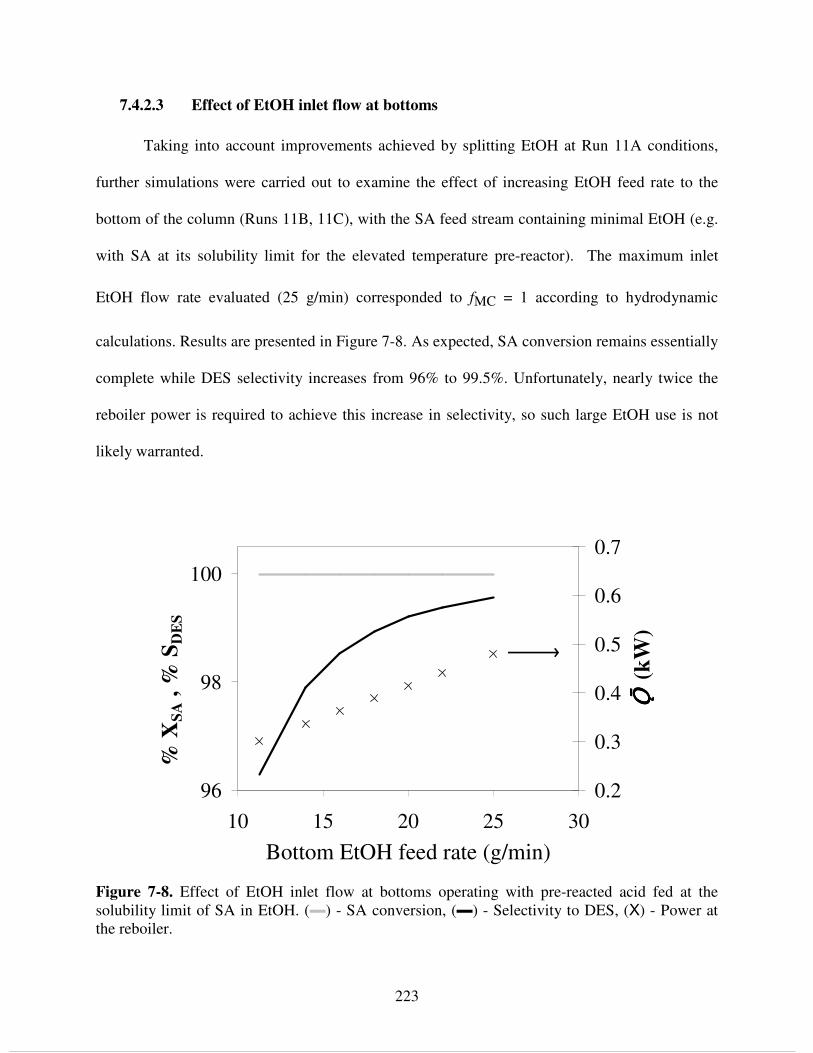
223
7.4.2.3 Effect of EtOH inlet flow at bottoms
Taking into account improvements achieved by splitting EtOH at Run 11A conditions,
further simulations were carried out to examine the effect of increasing EtOH feed rate to the
bottom of the column (Runs 11B, 11C), with the SA feed stream containing minimal EtOH (e.g.
with SA at its solubility limit for the elevated temperature pre-reactor). The maximum inlet
EtOH flow rate evaluated (25 g/min) corresponded to fMC = 1 according to hydrodynamic
calculations. Results are presented in Figure 7-8. As expected, SA conversion remains essentially
complete while DES selectivity increases from 96% to 99.5%. Unfortunately, nearly twice the
reboiler power is required to achieve this increase in selectivity, so such large EtOH use is not
likely warranted.
Figure 7-8. Effect of EtOH inlet flow at bottoms operating with pre-reacted acid fed at the solubility limit of SA in EtOH. (▬) - SA conversion, (▬) - Selectivity to DES, (Χ) - Power at the reboiler.
96
98
100
10 15 20 25 30
Bottom EtOH feed rate (g/min)
% X
SA ,
% S
DE
S
0.2
0.3
0.4
0.5
0.6
0.7
njnj njnj (
kW
)

224
7.4.2.4 Effect of reboiler power and reflux ratio using pre-reactor – column
configuration
The effect of increasing boilup rate at improved conditions of Run 11A (with SA at its
solubility limit and an EtOH split ratio of 0.5) at several reflux ratios up to the maximum
hydrodynamic capacity of the column (fMC = 1) is presented in Figure 7-9 and 7-10. In general,
both SA conversion and selectivity to DES increase with reboiler power at low reflux ratios. As
EtOH is removed in the distillate stream, it entrains water, thus driving esterification to
completion. However, as observed in Figure 7-10a, increasing reflux ratio has a negative impact
on selectivity to DES mainly due to H2O recycling. In Figures 7-9b – 7-10, distillate flows were
plotted to facilitate comparison between different reflux ratios. As observed in Figure 7-9b,
above a certain distillate flow limit (~ 9 g/min) mostly succinic species remain at the bottom of
the column and a sudden increase in reboiler temperature is observed. Above this level, any
increase in heating power results in removal of MES and DES from the reboiler and the
separation efficiency is severely reduced. Selectivity to DES increases above this limit because
MES remains in the catalytic zone where it is consumed. However, a significant amount of DES
appears at the top of the column, signifying a change in overall column performance. This
sudden increase of temperature with a small change of inlet power was experienced
experimentally in Run 11C. In Figures 7-10a and 7-10b, it is seen that when operating with
distillates flows below ~ 9 g/min both SA conversion and selectivity to DES slightly increase
with increased reflux ratio. Below this boilup rate, EtOH fed at the bottom flows downwards to
the reboiler and is not used efficiently in the catalytic stages. However, some H2O is removed in
the distillate, shifting the equilibrium toward the product while EtOH is still at a large excess.

225
Figure 7-9. Effect of boiling power under different reflux ratios (RR = 0, 1, 2, 4, 8, 12) using pre-reactor and acid feed at the solubility limit of SA in EtOH. a) (▬) - SA conversion, (▬) - Selectivity to DES; b) (▬) - DES composition at bottoms, (- -) - DES composition in distillate, (○) - Reboiler temperature.
0
20
40
60
80
100
0 10 20 30Distillate flow rate (g/min)
% w
DE
S
350
450
550
650
750
TB
ott
om
s (K
)
0 12
4812
Bottoms
Distillate
b
a
92
94
96
98
100
0 1 2 3 4 5Boiling power (kW)
% X
SA
65
75
85
95
% S
DE
S
RR =0
1
24
812

226
Figure 7-10. Effect of boiling power under different reflux ratios (RR = 0, 1, 2, 4, 8, 12) using pre-reactor and acid feed at the solubility limit of SA in EtOH. a) (▬) - SA conversion; b) (▬) - Selectivity to DES.
a
98
98.5
99
99.5
100
0 5 10 15 20 25Distillate flow rate (g/min)
% X
SA
RR = 01
24
812
b
65
75
85
95
0 5 10 15 20 25Distillate flow rate (g/min)
% S
DE
S
RR = 01
2
4
8
12

227
Increasing distillate flow above this level causes EtOH fed below the catalytic stages to
move upward in the column and participate in reaction, also enhancing H2O removal. At
distillate flows above 9 g/min, any increase in reflux ratio has a negative impact on column
performance as expected.
7.5 Conclusions
The synthesis of diethyl succinate by esterification of succinic acid and ethanol was
studied using a stainless steel pilot scale reactive distillation system containing KATAPAK SP-
11®
filled with Amberlyst 70®
as catalytic packing and Sulzer BX®
in non-reactive stages. A set
of experiments were carried out to investigate the performance of the system varying total
pressure, reflux ratio, boiling power, feed flows, and use of ethanol feed below the reactive zone.
Results indicated that is possible to obtain high conversions and yields of diethyl succinate above
98%. Simulations using a simple equilibrium stage model including phase equilibria and
chemical kinetics previously obtained were developed to validate experimental observations
using RADFRAC®
model in Aspen Plus®
. The model also took into account dehydration
reaction to produce diethyl ether. Simulation results were compared with experiments showing
good agreement and the model has prediction capabilities under different operation conditions.
Detailed analysis of experimental and simulation results indicated that a preferable
configuration will require a pre-reactor operating with initial compositions of succinic acid and
ethanol close to the solubility limit at reactor temperature. The pre-reacted feed has to be
introduced in the column above the reactive zone while an ethanol stream must be located below

228
catalytic stages to enhance both reaction conversion and water entrainment. Power supplied to
the reboiler must be sufficient to drive ethanol fed at bottoms to the catalytic stages, and low
reflux ratios (<0.5) are required to obtain high yields of diethyl succinate. While operation at
higher pressures enhanced esterification rates, it also increased production of undesirable diethyl
ether. The model developed here can be used to perform optimization of the process and to
evaluate economics under different production configurations and scales.

229
REFERENCES

230
7.6 REFERENCES
[1] H. Van der Pol. Biobased innovations @ Purac: from lactic acid and lactide/PLA to succinic
acid. The world Congress on Industrial Biotechnology & Bioprocessing. Washington D.C., USA. June. (2010).
[2] A. Orjuela, A. Yanez, C. T. Lira, D. J. Miller. Carboxylic Acid Recovery from Fermentation
Solutions. US Patent application. Filed 2009. [3] D. J. Thomas, D. L. Trimm and M. S. Wainwright, N. W. Cant. Chem. Eng. Process. 31, 4
(1992) 241-245. [4] T. Turek, D.L. Trimm, D.StC. Black, N.W. Cant. Appl. Catal. A - Gen. 116, 1-2 (1994)
137-150. [5] S. Varadarajan, D. J. Miller. Biotechnol. Prog. 15 (1999) 845–854. [6] S.H. Vaidya, C.V. Rode, R.V. Chaudhari. Catal. Commun. 8, 3 (2007) 340-344. [7] A. Cukalovic, C. V. Stevens. Biofuels, Bioprod. Bioref. 2 (2008) 505-529. [8] C. Delhomme, D. Weuster-Botz, F. E. Kühn. Green Chem. 11 (2009) 13-26. [9] G. Ding, Y. Zhu, H. Zheng, W. Zhang, Y. Li. Catal. Commun. 11, 14 (2010) 1120-1124. [10] G. Ding, Y. Zhu, H. Zheng, H. Chen, Y. Li. J. Chem. Thechnol Biotechnol. 2010. n/a.
doi: 10.1002/jctb.2503. [11] S. Kulprathipanja (Ed.). Reactive separation processes. Ed. Taylor & Francis, Philadelphia -
USA. 2000. [12] A. Stankiewicz. Chem. Eng. Proc. 42 (2003) 137-144.

231
[13] A. Tuchlenski, A. Beckmann, D. Reusch, R. Düssel, U. Weidlich and R. Janowsky. Chem.
Eng. Sci. 56 (2001) 387-394. [14] S. Schoenmakers, B. Bessling. Chem. Eng. Proc. 42 (2003) 145 -155. [15] R. Hiwale, N. Bhate, Y. Mahajan, S. Mahajani. Recent trends. Int. J. Chem. React. Eng.
Review R1. 2 (2004) 1-52. [16] G. Jam Harmsen. Chem. Eng. Process. 46, 9 (2007) 774-780. [17] A. A. Backhaus. (1921) Method for the production of esters. US Patent 1400852. [18] Cockrem, M. C. (2001). Process for the production of organic acids and esters thereof. US
Patent 6291708 B1. [19] C. Bianchi, V. Ragaini, C. Pirola and G. Carvoli. Appl. Catal. B. 40, 2 (2003) 93-99. [20] N. Asthana, A. Kolah, D. Vu, C. T. Lira, D. J. Miller. J. Org. Process Res. Dev. 9 (2005)
599-607. [21] D. J. Miller, N. Asthana, A. Kolah, D. Vu, C. T. Lira. (2006). Process for reactive
esterification distillation. US Patent 7667068. [22] A. Kolah, N. Asthana, D. Vu, C. T. Lira, D. J. Miller. Ind. Eng. Chem. Res. 47, 4 (2008)
1017-1025. [23] D. Dunuwila. (2009). Process for the direct production of esters of carboxylic acids from
fermentation broths. Canadian patent application 02657666. [24] H. Bart, J. Reidetschlager. Sep. Sci. Technol. 30 (1995) 1849-1865.

232
[25] C. Bauduin, W. Fischer, R. Pinkos, E. Scholten. (2009). Method of producing a carboxylic alkyl ester. US patent application 0137825 A1.
[26] D. Sutton, G. Reed, G. Hiles. (2005, 2007). Process for the production of esters of mono-, di
or polycarboxylic acids. WO patent 051885 A1, US patent application 0129565 A1. [27] A. Orjuela, A. Kolah, X. Hong, C. T. Lira, D. J. Miller. Reactive Distillation in a Mixed
Acid Esterification Process for Biobased Chemicals Production. 2009 AIChE Annual Meeting, Nov 8-13, Knoxville, TN, USA, (2009).
[28] A. Kolah, A. Orjuela, N. Hanna, C. T. Lira, D. J. Miller. Reactive distillation for the
biorefinary: Pilot plant synthesis of succinic acid esters. 10AIChE - 2010 AIChE Spring Meeting and 6th Global Congress on Process Safety. Mar 21-25, San Antonio, TX, USA (2010).
[29] L. Götze, O. Bailer, P. Moritz, C. von Scala. Catal. Today 69 (2001) 201–208. [30] J. Sieres, J. Fernández-Seara. Int. J. Refrig. 30 (2007) 58-67. [31] A. Orjuela, A. J. Yanez, C. T. Lira, D. J. Miller. Kinetics of mixed succinic acid/acetic acid
esterification with Amberlyst 70 ion exchange resin as catalyst. Submitted. Appl. Catal. A. (2010).
[32] M. Behrens, Ž. Olujić, P. J. Jansens. Chem. Eng. Technol. 31, 11 (2008) 1630-1637. [33] S. Ratheesh, A. Kannan. Chem. Eng. J. 104 (2004) 45-54. [34] A. Hoffmann, C. Noeres, A. Górak. Chem. Eng. Process. 43 (2004) 383-395. [35] A. Kolodziej, M. Jaroszyński, I. Bylica. Chem. Eng. Process. 43 (2004) 457-464. [36] Ž. Olujić, M. Behrens. Chem. Eng. Technol. 29, 8 (2006) 979-985. [37] S. Venkataraman, W.K. Chan, J.F. Boston. Chem. Eng. Prog. 86, 8 (1990) 45-54.

233
[38] H. Renon, J. M. Prausnitz. AIChE J. 14 (1968) 135-144. [39] J. G. Hayden, J. P. O'Connell. Ind. Eng. Chem. Process Des. Dev., 14, 3 (1975) 209-216. [40] Aspentech, Aspen Physical Property System, physical property models/methods,
Burlington, 2007. [41] A. Orjuela, A. Yanez, D. Vu, D. Bernard-Brunel, D. J. Miller, C. T. Lira. Fluid Phase
Equilibr. 290 (1-2) (2010) 63-67. [42] A. Orjuela, A. Yanez, P. Rossman, D. Vu, Bernard-Brunel, D. J. Miller, C. T. Lira. Fluid
Phase Equilibr. 290 (1-2) (2010) 68-74. [43] A. Orjuela, A. Yanez, J. Evans, D., D. J. Miller, C. T. Lira. Phase equilibria in binary
mixtures with monoethyl succinate. In revision. (2010). [44] A. Orjuela, A. Yanez, J. A. Lee, D. J. Miller, C. T. Lira. Solubility and phase equilibria for
mixtures with succinic acid. In revision. (2010). [45] Y. Tang, H. Huang, I. J. Chien. Chem. Eng. Japan. 36, 11 (2003) 1352-1366. [46] A. Kolah, N. Asthana, D. Vu, C. T. Lira, D. J. Miller. Ind. Eng. Chem. Res. 47 (15) (2008)
5313-5317. [47] F. Carrillo, A. Martin, A. Rosello. Chem. Eng. Technol. 23 5 (2000) 425-428. [48] Sulzer Chemtech. (2010) Structured packings for distillation, adsoption, and reactive
distillation. [Online]. Available: http://www.sulzerchemtech.com/portaldata/11/ Resources //brochures/mtt/Structured_Packings_April_2010.pdf [2010, Nov 1].

234
8. Mixed Succinic Acid/Acetic Acid Esterification with Ethanol by
Reactive Distillation
8.1 Summary
Simultaneous esterification of succinic acid and acetic acid with ethanol in a continuous
reactive distillation unit has been studied. Experiments were carried out in a 6 m tall, 51 mm
diameter pilot scale stainless steel column. The reactive zone consisted of structured packing
KATAPAK SP-11®
containing Amberlyst 70®
as catalyst. BX®
structured gauze packing was
used in stripping and enrichment stages. Steady state experiments were performed under
different conditions varying composition and number of inlet streams, column pressure, heating
power at the reboiler, and reflux ratio. Conversions of ~ 100 % for both succinic acid and acetic
acid were verified experimentally. While succinate esters were obtained as bottom products with
purities of diethyl succinate higher than 98 %, acetate species were recovered mostly from
distillates. Computer simulations based upon experimental phase equilibria and chemical kinetics
were performed in Aspen Plus®
using RADFRAC®
model to reproduce steady state results.
Good agreement between experiments and simulations was observed under different conditions
evaluated. Model develop here can be used to scale-up a mixed acid esterification process.
8.2 Introduction
Fermentation of renewable substrates has been used as an alternative method to produce
many chemical commodities currently obtained from petrochemical routes. Particularly,

235
synthesis of carboxylic acids has gained major attention because they occur naturally in
metabolisms of many microorganisms and can be used as building blocks for many other bio-
based chemicals of commercial interest [1-5]. Among these, succinic acid (SA) has been
recognized as a potential substitute for maleic anhydride to be used in the synthesis of 1,4
butanediol, γ-butyrolactone and tetrahydrofuran. SA can also be used to produce biodegradable
deicing agents, bio-polymers, surfactants, plasticizers, green solvents and a large variety of
value-added products [6-9].
Despite the large variety of organisms studied in SA production, major challenges
include low titers produced in the broth (50-100 kg/m3) and contamination with other
byproducts. Reports indicate that acetic acid (5-40 kg/m3), pyruvic acid (0-20 kg/m
3), lactic acid
(0-14 kg/m3), formic acid (0-5 kg/m
3), traces of other acids and even ethanol are also found in
final products depending on microorganisms used during fermentation [2, 10-12].
Among many separation alternatives, reactive extraction of fermentation products with
ethanol (EtOH) has been successfully applied to isolate SA in the form of esters [13]. In such
processes, extraction occurs by esterification of the acid mixture while inorganic salts are
removed from the organic solution. Using this approach, different esters can be obtained
simultaneously and separation of the complex mixture can be performed by distillation. However
esterification extent is limited by chemical equilibrium and removal of reaction products is
required to drive reaction to completion.
In order to avoid thermodynamic reaction limitations in the system, reactive distillation
(RD) can be used to simultaneously drive the reaction to high conversions and also
simultaneously separate acids from various acids. RD also can reduce capital and energy costs by

236
combining reactions and separations in a single unit. These advantages have been recognized at
the industrial scale where many RD processes has been implemented [14-17].
Although RD has been successfully applied in esterification of single acids with EtOH,
less is known about multiple reactions in a single column. Because SA has low volatility and low
solubility in most solvents, fast esterification kinetics is required to avoid accumulation or
precipitation at the bottom of the column, where succinate species are withdrawn as product. Fast
kinetics is also required for other acids present in the mixture (e. g. lactic acid, pyruvic acid,
malic acid). If SA is mixed with light carboxylic acids (e. g. formic acid, acetic acid), boiling rate
and reflux ratio can strongly affect the performance of the operation because light acid esters are
removed with the distillate stream. To achieve complete esterification of volatile acids they must
have enough residence time in the reactive zone of the column and some reflux may be required
to drive to high conversions. However water content in the reflux can be detrimental to the goal
of high conversions.
Mixed acids esterification was studied even at earliest stages of RD development.
Mixtures of acetic, propionic and butyric acids were simultaneously esterified with methanol
using sulfuric acid as catalyst in one of the first reports of continuous RD processes [18]. Since
then, few applications have been reported. Only recently, a mixed acid esterification by RD has
been explored as a recovery method for maleic acid present in mixtures with different carboxylic
acids in aqueous solutions [19].
Previous studies developed by our research program indicated that esterification of SA
with EtOH can be carried out in a RD unit achieving high conversion and selectivity to diethyl
succinate (DES) under continuous operation [20, 21]. Considering that the most common
237
impurity in SA fermentation broths is acetic acid (AcOH), this work explores esterification of
mixtures of SA and AcOH with EtOH using a continuous RD system.
Figure 8-1. Reactions in mixed acids esterification process: esterification of succinic acid (SA) to monoethyl succinate (MES) and diethyl succinate (DES); esterification of acetic acid (AcOH) to ethyl acetate (EtOAc); dehydration of EtOH to diethyl ether (DEE).
Figure 8-1 presents chemical descriptor of the mixed acid esterification including
possible dehydration of EtOH to diethyl ether (DEE).
Experiments to evaluate feasibility of the mixed acid esterification were conducted in
pilot scale RD column under different conditions. Simulations to verify experimental
observations and to explore improvements on the system were performed using process design
software (Aspen Plus®
, Version 7.1, AspenTech). The effect of major processing variables on
Succinic Acid Monoethyl Succinate Ethanol
Diethyl Succinate Monoethyl Succinate Ethanol
Acetic Acid Ethyl Acetate Ethanol
H2OOH
O
O
OH O
O
O
OHOH+ + H2OOH
O
O
OH O
O
O
OHOH+ +
H2OH2O
H2OH2O
2H2O2H2O
Ethanol Diethyl ether

238
SA and AcOH conversions, separation efficiency, and DES purity were studied. Finally a
preferable process configuration obtained by simulation of experimental RD system is presented.
8.3 Material and methods
8.3.1 Materials
Succinic acid (>99.5 %, Sigma-Aldrich), acetic acid (99.9%, Aristar), diethyl succinate
(99.92%, Sigma-Aldrich), monoethyl succinate (89.3%, Sigma-Aldrich), ethyl acetate (HPLC
grade, J. T. Baker), ethanol (200 proof, Decon Labs), water (HPLC grade, J.T. Baker), diethyl
ether (EMD chemicals, 99.9%) n-butanol (99.9%, Mallinckrodt), and acetonitrile (HPLC grade,
EMD) were used for experiments and analysis. Hydranal-coulomat E solution (Riedel-de Haën)
was used in Karl-Fisher analysis. Amberlyst 70®
and Amberlyst 15®
ion exchange resins used
as catalysts were purchased from Dow Chemical Co.
8.3.2 Analysis
Analysis was performed using gas chromatography (GC) for volatile components, liquid
chromatography (HPLC) for succinate species, and Karl Fisher titration for water measurement.
Samples were diluted 50-fold in water for HPLC analysis. When samples contained high amount
of DES, EtOH was also added (~2% w/w) to ensure a homogeneous solution. A HPLC system
with a Waters®
717 autosampler, and Waters®
410 refractive index and Perkin Elmer LC90 UV
detectors was used for characterization of succinic species. A 100 x 7.6 mm fast acid analysis
column (Bio-rad®
) was used for the separation. 1 cm3/min of 5 mM aqueous solution of H2SO4
was used as mobile phase.

239
In GC analysis, samples were dissolved 20 fold in acetonitrile using butanol as internal
standard (5 % w/w). A Shimadzu®
2010 GC equipped with a Flame ionization detector and
AOC-5000 autoinjector was used. 15 m Alltech®
EC-WAX column (0.53 mm i.d., 1.20 µm film
thickness) was used with the following temperature program: column initial temperature 313 K
(1.37 min), ramp at 30 K/min to 353 K, and ramp at 40 K/min to 523 K (hold 4 min). The
injection port was maintained at 553 K with a split ratio 5:1, and detector temperature was 573
K. Hydrogen was used as carrier gas (50 cm/s), with volume injections of 1 µL. Total
Calibration for both GC and HPLC was performed by analysis of samples of known
composition in the range of interest. Repeatability within 0.5 % by mass was obtained.
Karl-Fisher analysis was performed using an Aquacount coulometric titrator AQ-2100.
8.3.3 Reactive distillation column description
Continuous RD experiments were carried out in a stainless steel pilot scale column. Table
8-1 describes major characteristics of the experimental equipment and Figure 8-2 shows a
scheme of RD system.
High separation efficiency structured packings (Sulzer Chemtech Ltd.) were used in both
catalytic and non-catalytic zones. As shown in Figure 8-2, the column was built with six flanged
sections, 4 reactive and 2 non reactive. Reactive sections were separated by liquid redistributors
that allowed sample collection. The column and the reboiler were wrapped with electric heating
tapes and glass wood bands. Internal thermo-probes and external surface thermocouples were
used to record temperature profiles inside and outside the column. The tapes along the column
were individually controlled to reduce temperature gradients with surroundings.

240
Heating power in the reboiler was supplied with an electrical resistance submerged in the
liquid and it was connected to an Omega controller. Liquid level was maintained with an
overflow outlet controlled with a level indicator and a pneumatic valve.
Table 8-1. Characteristics of reactive distillate unit
Material of construction SS-316 Rated pressure (kPa) 2000
Rated temperature (K) 573 Diameter (cm) 5.1
Height (cm) 74 Stripping zone
Packing BX®
Height (cm) 360
Packing Katapak-SP-11®
Catalyst Amberlyst 70®
Catalyst Particle size (mm) > 0.5
Reactive zone
Catalyst loading (kg/m3) 76
Height (cm) 42 Enrichment zone
Packing BX®
Type Kettle
Heating element Stainless steel coated electrical resistance
Maximum Power (kW) 2.4 Reboiler
Hold-up (m3) 0.0015
Type Total Geometry Coiled concentric tubes
Inner tube diameter (cm) 0.63 Outer tube diameter (cm) 1.27
Cooling fluid Water-glycol Cooling fluid chiller Julabo FL 2506
®
Operating temperature range (K) 258 – 313
Condenser
Cooling power at 263 K (kW) 0.3 Construction material Pyrex glass
Volume (m3) 0.075
Maximum Power (kW) 2 Stirrer power (kW) 0.25
Catalyst Amberlyst 15®
Pre-reactor
Catalyst loading (% w/w) 2

241
Figure 8-2. Scheme of pilot plant RD column with internal catalytic packing Katapack-SP-11®
(middle zone) and BX®
structured packing (doted zone).
TI
TI
TI
TI
TI
TI
TI
TI
TI
TI
FI
WI
WI
WI PI
LI
LI
WI

242
Column pressure was maintained with a solenoid valve that controlled outlet vapor flow
at the top. After the condenser, a liquid reservoir was used to collect distillate. Reflux was
dispensed from this reservoir via a controlled flow pump, and the flow rate was registered with a
coriolis flowmeter. Because succinate species and acetic acid have lower volatilities than EtOH,
acid solution was fed from the upper part of the column. When the column operated without
reflux acid stream was fed closer to the top of the column. Using reflux, acid fed was introduced
just above the catalytic packing. In some experiments an additional EtOH inlet stream was fed
below the catalytic zone.
Inlet streams were fed from tanks positioned on electronic balances using heat-traced and
insulated pipelines and diaphragm pumps. Inlet temperatures were maintained as close as
possible to the correspondent internal temperature of the column at the feed location.
8.3.4 Reactive distillation column operation
To avoid solids precipitation, the acid stream was introduced at the column close to the
solubility limit of SA in EtOH at room temperature (~ 8 wt %). Concentration of AcOH in this
stream was 1/3 to 1/10 of SA. This is the usual ratio of concentrations observed in different
fermentation broths. In most experiments some EtOH was kept in the reboiler to maintain boiling
temperature low enough to avoid unsafe conditions or thermal decomposition of succinate
species. When the column was operated with high concentrations SA in acid feed, this stream
was pre-reacted in a separate batch reactor under total reflux at atmospheric pressure for 24 h
before the experiment. The resulting feed solution was a partially converted mixture (acids,
esters, EtOH and H2O) soluble in EtOH.

243
To reduce the time required to achieve steady state liquid hold-up drained from a
previous run was kept in the reboiler. In typical operation, the column was started by slowly
turning on the reboiler heater and the external heating tapes as the vapor reached the different
zones of the column. After vapors reached the condenser, total reflux was maintained until a
stable temperature profile and pressure were attained. Then feed pumps were started at the
specified rates for the experiment and products from distillate and bottoms started to be
collected.
Stream flow rates, acid value of bottom product, column top pressure and temperature
profiles were recorded on time intervals of 15 to 30 minutes throughout the run. Outlet flows
from distillate and bottoms were obtained by measuring volume and density of liquid collected in
volumetric flasks. The acid value (AV, mgKOH/g) of the bottom product was obtained by
titration with 0.1M solution of NaOH in EtOH-H2O until final point with phenolphthalein.
After reaching steady conditions, liquid samples from column redistributors, reboiler and
distillates reservoir were collected in sealed vials every hour until the end of the experiment.
These samples were refrigerated until they were analyzed.
Experimental steady state was assumed after reaching AV within maximum ~ 5 %
variation in consecutive samples, temperature profiles change over time of ± 0.5 K, and constant
pressure at the top (± 7 kPa). Additional steady state criteria were: maximum variations of inlet
and outlet within a ± 5 wt % of the set point, and closed mass and component balance on the
column streams (± 5 %).This last criterion was evaluated after run ended because the long time
required for sample preparation and analysis.
After final samples were collected, feed pumps were shut down, inlet and outlet valves
closed, and reboiler and column heaters were turned off. Evaporation was stopped by

244
pressurizing the column at ~ 700 kPa with nitrogen. Finally refrigeration at the condenser was
stopped and the general power supply was shut down.
8.4 Results and discussion
8.4.1 Reactive distillation experiments
Operating conditions during RD experiments are listed in Table 8-2. In most experiments,
the inlet feed rate and temperature of the acid stream were maintained as constant as possible to
facilitate comparison among different operational conditions.
A typical dynamic behavior of the RD system is presented in Figures 8-3 and 8-4 in run
14A and 14B. In general steady conditions were obtained after ~ 20 h of operation.
Figure 8-3. Outlet flows and acid value profiles with time during approach to steady state in runs 14A (up to 1100 min) and 14B (after 1100 min). (□) - Distillate flow, (●) - Bottoms flow, (∆) - Acid value at the bottoms.
0
20
40
60
80
0 500 1000 1500 2000time (min)
Flow
(cm
3 /min
)
0
2
4
6
8
AV
(m
g K
OH
/ g)

245
Table 8-2. Experimental conditions for continuous RD at pilot plant scale
Top Feed
(SA in EtOH-H2O) Bottom feed
(EtOH) Bottoms
Run
Code
Pre-
Reactor
Reboiler
Power
(kW)
Gauge
P
(kPa)
Reflux
Ratio wt%
SA
wt%
H2O
wt%
AcOH
Flow
(g/min) Flow (g/min)
Distillate
Flow
(g/min) Flow
(g/min) AV‡
T
(K)
12A No 0.96 310.3 0 6.7 2.2 30.3 ± 0.3 0.0 20.6 ± 0.4 10.1 ± 0.2 12.5 394.2 12B No 1.15 310.3 0.59 6.7 2.2 30.2 ± 0.2 0.0 20.1 ± 0.5 10.6 ± 0.4 11.8 394.2 12C No 1.41 310.3 0.36 6.7 2.2 30.3 ± 0.2 11.2 ± 0.5 32.2 ± 0.7 9.4 ± 0.7 5.6 394.2 13A No 1.03 310.3 0 6.7 2.2 30.7 ± 0.5 0.0 25.2 ± 0.7 5.4 ± 0.7 22.3 394.2 13B No 1.44 310.3 0.97 6.7 2.2 30.3 ± 0.2 0.0 24.9 ± 0.4 5.8 ± 0.5 19.4 394.2 13C No 1.68 310.3 0.65 6.7 2.2 30.4 ± 0.1 12.5 ± 0.2 36.1 ± 0.4 6.3 ± 0.4 5.8 394.2 14A Yes 1.63 310.3 0 25.0
† 2.5
† 31.2 ± 0.4 16.6 ± 0.6 35.9 ± 0.7 11.7 ± 0.8 5.9 505.3
14B Yes 1.85 310.3 0 25.0† 2.5
† 30.9 ± 0.1 28.7 ± 0.6 46.5 ± 0.7 11.7 ± 0.5 3.7 515.8
20A Yes 1.92 34.5 0.35 25.0† 2.5
† 29.6 ± 0.3 30.5 ± 0.9 49.7 ± 1.0 9.6 ± 1.2 7.8 498.2
21A No 1.49 34.5 0 8.0 5.5 0.8 41.9 ± 2.6 23.2 ± 0.4§ 57.4 ± 3.6 7.8 ± 2.4 75.8 364.6
22A Yes 1.50 34.5 0 8.0† 5.5
† 0.8
† 45.2 ± 0.7 23.5 ± 0.4
§ 58.8 ± 1.2 9.4 ± 1.6 42.9 365.6
22B Yes 1.94 34.5 0.29 8.0† 5.5
† 0.8
† 45.0 ± 0.4 23.8 ± 0.4
§ 59.5 ± 0.5 8.5 ± 0.7 47.7 363.3
23A No 1.92 34.5 0 8.0 91.2 0.8 30.6 ± 0.6 29.8 ± 0.3 44.0 ± 4.1 17.2 ± 6.0 131.2 379.1 24A No 2.40 34.5 0 6.2 93.0 0.8 30.9 ± 0.4 55.4 ± 0.9 67.9 ± 1.7 17.3 ± 2.0 50.6 362.9 26A No 2.35 34.5 0.58 6.7 92.7 0.6 29.4 ± 1.1 28.9 ± 1.2 40.9 ± 0.7 14.7 ± 1.0 119.2 381.3
† SA concentration is top feed is reported before pre-reaction
§ 6 wt% H2O in EtOH
‡ Acid value, mg KOH / g

246
Table 8-3. Summary of outlet streams composition obtained in RD experiments
Distillate composition wt% Bottoms Composition wt % Conversion § Run
Code H2O DEE EtOAc EtOH AcOH MES DES SA H2O DEE EtOAc EtOH AcOH MES DES SA SA AcOH
SDES
(%) ‡
12A 3.1 2.1 4.2 90.4 0.1 0.1 0.0 0.0 2.9 0.0 0.1 61.6 0.1 2.9 32.3 0.1 99.2 94.9 89.5 12B 3.2 2.0 4.3 90.3 0.1 0.1 0.0 0.0 3.4 0.0 0.0 66.5 0.1 2.7 27.1 0.1 99.2 95.0 88.6 12C 3.3 1.3 2.6 92.5 0.1 0.1 0.0 0.0 0.8 0.0 0.0 66.5 0.1 1.4 31.0 0.1 99.4 94.7 93.2 13A 3.0 1.4 3.6 91.8 0.1 0.1 0.0 0.0 2.1 0.0 0.0 37.3 0.1 5.5 54.5 0.3 98.7 94.4 88.7 13B 3.9 1.2 3.4 82.4 0.1 0.1 0.0 0.1 1.9 0.0 0.0 55.8 0.1 4.3 37.7 0.1 98.2 95.1 86.9 13C 2.9 1.6 2.3 93.0 0.1 0.1 0.0 0.1 0.3 0.0 0.0 48.6 0.1 1.2 49.6 0.2 98.6 94.1 96.3 14A 8.2 1.8 2.7 87.2 0.0 0.1 0.0 0.0 0.1 0.0 0.0 0.5 0.1 1.2 98.0 0.2 99.7 97.9 98.4 14B 6.1 1.8 2.0 90.0 0.0 0.1 0.0 0.0 0.1 0.0 0.0 0.4 0.1 0.9 98.3 0.2 95.3
† 99.7 82.1
† 97.4 98.7
20A 5.1 0.1 1.7 92.9 0.1 0.0 0.0 0.2 0.0 0.0 0.0 6.5 0.0 2.3 90.4 0.6 96.8† 97.6 86.1
† 95.5 97.0
21A 7.6 0.0 0.7 91.6 0.1 0.0 0.0 0.0 6.0 0.0 0.0 35.4 0.1 13.8 42.9 1.8 95.7 85.4 72.2 22A 7.4 0.0 0.5 92.1 0.0 0.0 7.4 0.0 3.7 0.0 0.0 34.4 0.3 9.7 3.7 0.0 98.2 87.0 81.5 22B 6.9 0.0 0.7 92.3 0.1 0.0 6.9 0.0 6.1 0.0 0.0 35.4 0.4 10.8 6.1 0.0 96.8
† 98.0 78.5
† 78.9 78.2
23A 40.3 0.0 0.3 59.2 0.1 0.0 0.0 0.1 80.5 0.0 0.8 5.4 0.0 4.3 0.1 8.8 28.4 77.7 2.2 24A 34.0 0.0 0.2 65.5 0.1 0.0 0.0 0.1 34.8 0.0 0.0 53.2 0.1 5.3 4.4 2.3 72.6 60.9 41.0 26A 36.1 0.0 0.4 63.3 0.1 0.0 0.0 0.0 85.9 0.0 0.0 0.0 0.1 1.9 0.0 12.0 11.7 70.1 5.3
§ Conversion in mole percentage.
‡ Selectivity to diethyl succinate.
† Pre-reactor final concentration fed to column.

247
As observed in Figure 8-4, a slight change in a process variable between runs 14A and
14B (different EtOH feed flow as reported in Table 8-2) drove the system to a new steady
condition but in less time (~ 6h). In most experiments this programmed study of variables
allowed to reduce operating time and also to minimize waste generation.
Scatter observed in flows are due to pulsating behavior obtained by using overflow level
control in the reboiler and the condensates reservoir. Level controllers might be affected by
excessive foaming and also by uneven evaporation. This might cause displacement of liquid
level from operating set point, creating flow fluctuations. During experiments, short flow
irregularities in top and bottoms outlet streams were observed even at steady state. However
bottoms and distillates concentrations were fairly constant with time in most experiments. Figure
8-4 suggests that on-site AV measurement is a rapid and good indicator to ensure steady state
conditions. A summary of results obtained during RD experiments are listed in Table 8-3.
Reported concentrations were obtained by reconciliation of different analytical methods.
Succinate species are reported as the average of HPLC and GC analysis, while concentrations of
other components are obtained by GC. H2O content was obtained by Karl Fischer analysis.
In general, high conversions of SA and AcOH together with high selectivity to DES were
achieved in most experiments. In order to evaluate feasibility of processing acid streams diluted
in water (resembling acidified fermentation broth), aqueous acid solutions were used as feed in
experiments 23A, 24A and 26A. Only in these experiments low conversions were observed.
Operating at low conversion conditions was challenging because solids would precipitate
and obstruct bottom outlet lines as the streams cooled. This affected normal liquid withdrawal at
bottoms, and large flow fluctuations were observed during operation. After data reconciliation it
was noticed that that experiments 23A, 24A and 26A did not reach steady state.

248
Figure 8-4. Time evolution of composition in bottom and distillate products in run 14A during
approach to steady state. (○) - DES, (□) - MES, (∆) - SA, (▲) – AcOH, (●) – EtOAc, (●) - H2O, (▲) - EtOH, (+) - DEE.
Run 14A - Bottoms
0
0.5
1
1.5
2
600 800 1000 1200
Time (min)
Con
cent
ratio
n (%
w)
80
85
90
95
100
DE
S (%
w)
Run 14A - Distillate
0
2
4
6
8
10
600 800 1000 1200
Time (min)
Con
cent
ratio
n (%
w)
60
70
80
90
100
EtO
H (
%w
)
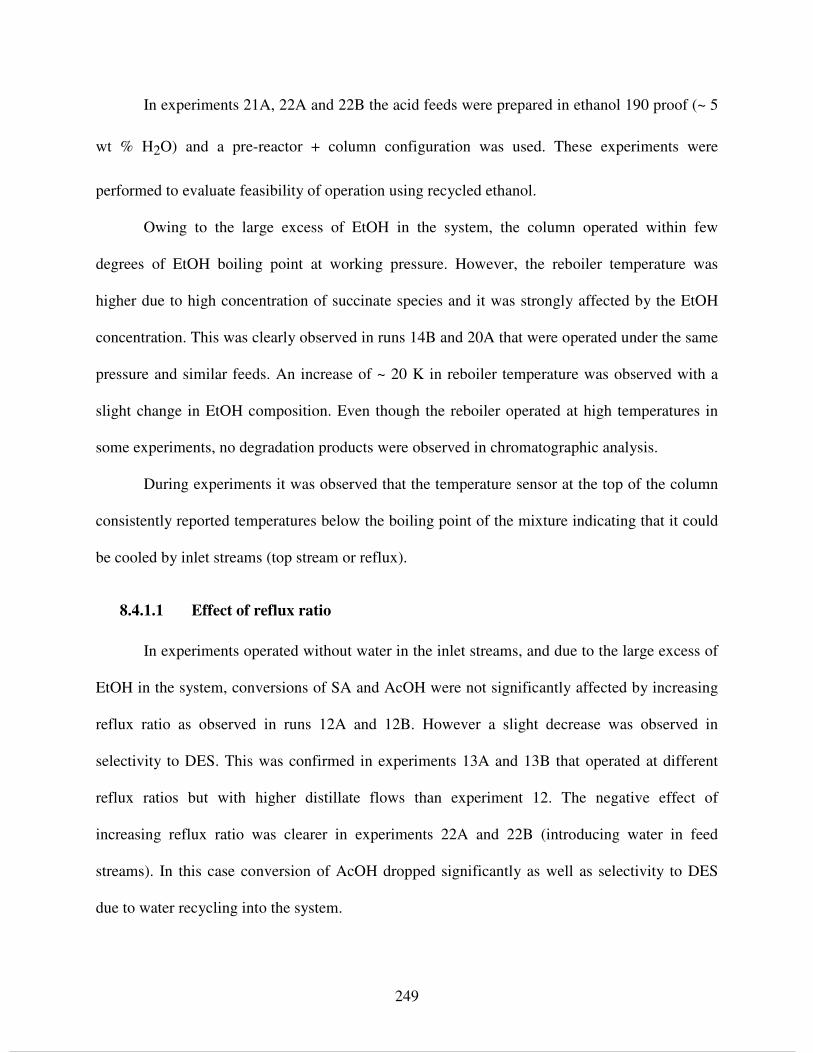
249
In experiments 21A, 22A and 22B the acid feeds were prepared in ethanol 190 proof (~ 5
wt % H2O) and a pre-reactor + column configuration was used. These experiments were
performed to evaluate feasibility of operation using recycled ethanol.
Owing to the large excess of EtOH in the system, the column operated within few
degrees of EtOH boiling point at working pressure. However, the reboiler temperature was
higher due to high concentration of succinate species and it was strongly affected by the EtOH
concentration. This was clearly observed in runs 14B and 20A that were operated under the same
pressure and similar feeds. An increase of ~ 20 K in reboiler temperature was observed with a
slight change in EtOH composition. Even though the reboiler operated at high temperatures in
some experiments, no degradation products were observed in chromatographic analysis.
During experiments it was observed that the temperature sensor at the top of the column
consistently reported temperatures below the boiling point of the mixture indicating that it could
be cooled by inlet streams (top stream or reflux).
8.4.1.1 Effect of reflux ratio
In experiments operated without water in the inlet streams, and due to the large excess of
EtOH in the system, conversions of SA and AcOH were not significantly affected by increasing
reflux ratio as observed in runs 12A and 12B. However a slight decrease was observed in
selectivity to DES. This was confirmed in experiments 13A and 13B that operated at different
reflux ratios but with higher distillate flows than experiment 12. The negative effect of
increasing reflux ratio was clearer in experiments 22A and 22B (introducing water in feed
streams). In this case conversion of AcOH dropped significantly as well as selectivity to DES
due to water recycling into the system.

250
8.4.1.2 Effect of column pressure
As column pressure increased, higher temperatures were observed along the column and
in the reboiler. Despite the higher temperatures esterification conversions were not particularly
enhanced. However higher dehydration of EtOH to DEE was observed. This behavior is
explained considering the large excess of EtOH in the system and also strong acidity of
Amberlyst 70®
.
8.4.1.3 Effect of EtOH feed
Higher conversions and high selectivity to DES were obtained by feeding EtOH below
the catalytic zone of the column. This can be observed by comparing results obtained in runs
12B and 12C, and also in experiments 13B and 13C. This behavior was also verified when
processing pre-reacted acid feed as observed in runs 14A, 14B and 20A. EtOH enhanced
entrainment of water in distillates while promoting esterification of esters in the reactive zone.
8.4.1.4 Operation with pre-reactor
In general higher esters yield were obtained operating with pre-reacted acid feed.
Concentrations obtained after processing acid stream in the pre-reactor were close to chemical
equilibrium conditions for both SA and AcOH esterification. Despite high conversion of SA in
pre-reactor, selectivity to DES was around 50 to 60%. In runs 14A, 14B and 20A column
operated with high concentrations of SA in the acid feed. In these experiments high
concentration of succinate species were observed at the reboiler, and consequently high
temperatures were obtained at bottoms. Specifically in run 14 B it was verified that the column
can operate with almost complete conversion of acids, obtaining high purity of DES (> 98%) at
the bottoms and recovering EtOAc in distillate stream.

251
8.4.1.5 Effect of water in the feed
As observed in experiments 21A, 22A and 22B operating with ethanol 190 reduces
conversion of both SA and AcOH as well as the selectivity to DES. In these experiments high
concentrations of MES and H2O were found at the bottom product of the column. Conditions
were even worse when reflux was used at the top of the column (run 22B). In this case separation
efficiency between succinate and acetate species was affected, because major part of non-
converted AcOH was entrained to the bottoms by the water recycled in the system. When
operation was performed feeding aqueous acid solutions (runs 23A, 24A and 26A) low
conversions were obtained. A large amount of EtOH at the bottoms was required to obtain SA
and AcOH conversions of ~ 70 and ~ 60% respectively. However MES was the predominant
succinate specie in the final product. In these experiments high boiling rates were used to remove
major part of the water, but because reboiler power limitations it was not possible to operate
under higher distillate flows. This indicates that operation of RD system with aqueous acid
solutions as directly obtained from acidified fermentation broths might not be economically
feasible. To extent the study of performance of RD system under different conditions, and
considering the large amount of resources required in pilot plant experiments, a simulation model
of the system was developed and validated with results described above.
8.4.2 Simulation of RD experiments
Steady state simulations of RD operation were performed using an equilibrium stage
model (RADFRAC®
) in Aspen Plus®
. Phase equilibria were modeled by using NRTL equation
to calculate activity in the liquid phase [22], and Hayden O-Connell (HOC) equation for the
vapor phase [23]. Binary parameters were obtained from experiments or literature and were

252
reported in previous works from our group [24-29]. Rates of reactions were described by using
pseudo-homogeneous activity-based kinetics previously developed for Amberlyst 70® [29].
Kinetics for Amberlyst 15®
and self-catalyzed SA esterification were fitted to activity based
model from collected data in a previous work [30]. Amberlyst 70®
kinetics was used to model
reactive stages in the column. Self-catalyzed kinetics was included in non-catalytic stages in the
stripping zone. Pre-reactor was modeled as a CSTR with 24h retention time using Amberlyst
15®
kinetic model. Kinetic parameters are summarized in Table 8-4, and parameters used for
simulation of pilot plant experiments are listed in Table 8-5.
Table 8-4. Parameters for activity-based kinetics used in simulation of RD experiments
Reaction Parameter Amberlyst
70®
Amberlyst
15®
Self-
Catalytic
0k (kmol/ kg CAT) (1/s) 1.04x10⁴ 5.17x10
3 1.57 x10
5 §
aE (kJ/kmol/K) 46200 46900 57300 SA + EtOH ↔ MES + H2O
EQK 48.9
0k (kmol/ kg CAT) (1/s) 2.11x10³ 7.0x10
4 17.8 §
aE (kJ/kmol/K) 46600 61400 34400 MES + EtOH ↔ DES + H2O
EQK 10.14
0k (kmol/ kg CAT) (1/s) 1.03x10⁴ 1.28 x10
3 -
aE (kJ/kmol/K) 47600 44600 - AcOH + EtOH ↔ EtOAc + H2O
EQK 12.11 2.12 -
0k (kmol/ kg CAT) (1/s) 4.99 x10⁴ 8.06 x10
4 ‡ - 2 EtOH → DEE + H2O
aE (kJ/kmol/K) 85400 86900 ‡ -
§ Pre-exponential factor has units of (kmol/m
3)(1/s)
‡ Mole fraction model assuming unitary activity coefficients.

253
Number of stages in simulation of pilot plant column were determined taking into
account the height equivalent to a theoretical stage (HETP = 0.5 m) reported for structured
packing [31, 32]. Hydrodynamic conditions in the column were estimated using correlations for
structured packings included in Aspen Plus. Because neither KATAPAK SP-11 or BX are
included in the data base, available parameters for a structured packing (MELLAPAK-250Y®
,
Sulzer) with similar liquid hold-up, pressure drop and HETP [33] were used in simulations. In
each case fractional approach to maximum capacity (fMC) was varied to match calculated
column diameter with that of the pilot plat unit.
Table 8-5. Parameters used for simulation of RD system
Parameter
Total number of stages (N) 12 Rectifying stages 2
Catalytic 3-9 Reactive stages
Non-catalytic 10-12 Acid feed Above 3
Feed Stages EtOH feed On 10
Column pressure drop per stage (kPa) 0.07 Murphree stage efficiency (stages 2 to 11) 0.5
Liquid holdup (cm3) (stages 2 to N-1) (10 % vol) 98.2
Reboiler holdup (cm3) 1500
Top 1 Product removal stage
Bottom 12
Catalyst loading (kg Catalyst / m3 Column) 78
Catalyst loading at pre-reactor (% w/w) 2
Because in most experiments temperature at the reboiler was governed by EtOH
concentration, distillate flows were adjusted in each simulation within the range of variation
observed in experimental flows (~ 5%) to match both, EtOH concentration and temperature at
the bottoms. Only those runs that reached steady state were evaluated by simulation.

254
Results obtained by simulation are summarized in Table 8-6 and 8-7, and comparing with
experimental results in Table 8-3 good agreement is most runs is observed. Average deviation
between predicted and experimental concentrations of DES in bottoms and EtOH on tops is less
than 5 % in most experiments. Expected higher relative deviations were observed in components
present at low concentrations (<5%) because at low concentrations uncertainty in analytical
measurements have a major impact.
SA and AcOH conversions and selectivity to DES are slightly over predicted in
simulations compared with experiments. Because intrinsic kinetics and an equilibrium stage
model were used in modeling, influence of transport phenomena is not considered.
Because catalyst particle size used in RD catalytic packing (> 0.5 mm) is higher than that
used in obtaining kinetic model (< 0.3 mm) [29], diffusion may affect rate of reaction as
previously reported for a similar catalyst [30].
In the other hand because reaction is enhanced by water removal, separation efficiency
plays an important role in the performance of the system. In simulations efficiency was assumed
constant along the column using a value of HETP = 0.5 m. Because distribution of flows in the
column varies from top to bottoms, in real operation different HETP and different hold-ups
within the structured packing are expected [34-38].These values are also different among the
variety of experimental conditions evaluated. Then these efficiency variations not considered in
the simulation model can also explain over prediction of reactions extent. In addition to this
hydrodynamic calculations indicated that the column operated well below maximum capacity
(fMC ‹‹ 1) flooding conditions. Under these conditions poor liquid distribution may affect catalyst
efficiency [37].
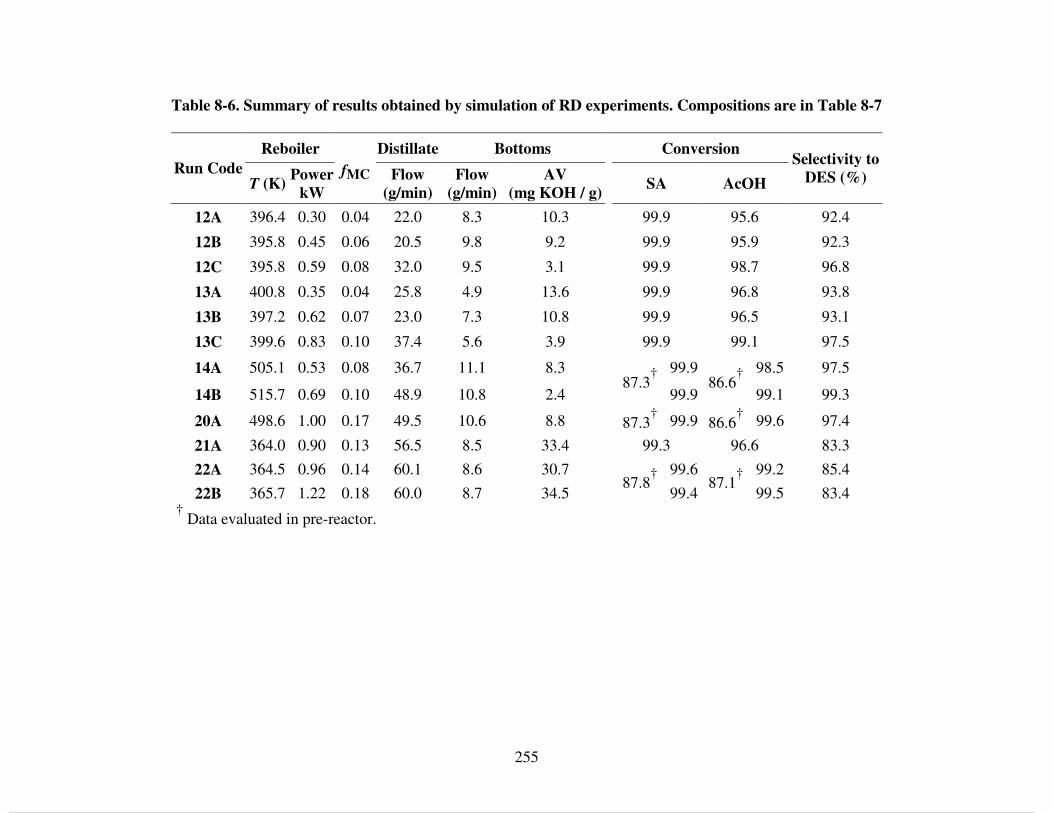
255
Table 8-6. Summary of results obtained by simulation of RD experiments. Compositions are in Table 8-7
Reboiler Distillate Bottoms Conversion
Run Code T (K)
Power
kW
fMC Flow
(g/min)
Flow
(g/min)
AV
(mg KOH / g)
SA AcOH
Selectivity to
DES (%)
12A 396.4 0.30 0.04 22.0 8.3 10.3 99.9 95.6 92.4
12B 395.8 0.45 0.06 20.5 9.8 9.2 99.9 95.9 92.3
12C 395.8 0.59 0.08 32.0 9.5 3.1 99.9 98.7 96.8
13A 400.8 0.35 0.04 25.8 4.9 13.6 99.9 96.8 93.8
13B 397.2 0.62 0.07 23.0 7.3 10.8 99.9 96.5 93.1
13C 399.6 0.83 0.10 37.4 5.6 3.9 99.9 99.1 97.5
14A 505.1 0.53 0.08 36.7 11.1 8.3 99.9 98.5 97.5
14B 515.7 0.69 0.10 48.9 10.8 2.4 87.3
†
99.9 86.6
†
99.1 99.3
20A 498.6 1.00 0.17 49.5 10.6 8.8 87.3† 99.9 86.6
† 99.6 97.4
21A 364.0 0.90 0.13 56.5 8.5 33.4 99.3 96.6 83.3
22A 364.5 0.96 0.14 60.1 8.6 30.7 99.6 99.2 85.4
22B 365.7 1.22 0.18 60.0 8.7 34.5 87.8
†
99.4 87.1
†
99.5 83.4 †
Data evaluated in pre-reactor.

256
Table 8-7. Products concentration obtained by simulation of RD experiments. Conditions are in Table 8-6.
Distillate composition wt % Bottoms Composition wt % Run
Code H2O DEE EtOAc EtOH AcOH MES DES SA
H2O DEE EtOAc EtOH AcOH MES DES SA
12A 4.5 1.3 3.8 90.1 0.0 0.0 0.3 0.0 2.0 0.0 1.2 61.8 0.2 2.2 32.6 0.0
12B 4.7 1.4 4.0 89.8 0.0 0.0 0.1 0.0 2.1 0.0 1.2 66.7 0.2 1.9 28.0 0.0
12C 3.5 1.0 2.9 92.5 0.0 0.0 0.1 0.0 0.5 0.0 0.4 68.2 0.0 0.7 30.1 0.0
13A 4.4 1.1 3.6 90.6 0.0 0.0 0.3 0.0 0.9 0.0 0.8 38.1 0.2 3.0 57.0 0.0
13B 4.6 1.3 3.8 90.2 0.0 0.0 0.1 0.0 1.5 0.0 0.9 57.4 0.2 2.2 37.8 0.0
13C 3.3 1.4 2.5 92.7 0.0 0.0 0.1 0.0 0.3 0.0 0.3 46.5 0.0 0.9 52.0 0.0
14A 7.2 0.7 3.1 87.6 0.0 0.0 1.3 0.0 0.0 0.0 0.0 1.1 0.0 2.2 96.7 0.0
14B 5.4 0.6 2.3 90.3 0.0 0.0 1.4 0.0 0.0 0.0 0.0 0.8 0.0 0.6 98.5 0.0
20A 5.0 0.1 2.2 92.2 0.0 0.0 0.6 0.0 0.0 0.0 0.0 0.1 0.0 2.3 97.6 0.0
21A 7.9 0.0 0.9 91.1 0.0 0.0 0.1 0.0 3.2 0.0 0.0 41.6 0.0 8.0 46.9 0.3
22A 8.0 0.0 0.9 90.9 0.0 0.0 0.2 0.0 2.7 0.0 0.0 38.3 0.0 7.6 51.3 0.2
22B 7.9 0.0 0.9 91.1 0.0 0.0 0.1 0.0 3.0 0.0 0.0 38.5 0.0 8.4 49.9 0.2

257
Temperature and concentration profiles for typical experiments (runs 13C and 14A) are
presented in Figures 8-5 and 8-6. Experimental temperature profiles are well described by
simulations in most experiments except for the value at the top of the column. This may be
related with cooling effects of inlet streams as discussed in section 8.4.1.
Figure 8-5. Comparison of profiles obtained by simulation (lines) and experimental data in run 13C. a) (○, ▬) - DES, (▲, ▬ ▬) – EtOH. b) (∆, - - ▬ - -) - SA, (□, - -) - MES, (▲, - ▬ -) -
AcOH, (●, - -) - EtOAc, (●, ▬ ▬) - H2O, (Χ, ▬) - DEE. c) Temperature profile.
a b c
0 30 60 90
1
2
3
4
5
6
7
8
9
10
11
12
Stage
% w EtOH, DES
0 1 2 3% w
380 395 410
T (K)

258
Figure 8-6. Comparison of profiles obtained by simulation (lines) and experimental data in run 14A. a) (○, ▬) - DES, (▲, ▬ ▬) - EtOH. b) (∆, - - ▬ - -) - SA, (▲, - ▬ -) - AcOH. c) (□, - -) -
MES, (●, - -) - EtOAc, (●, ▬ ▬) - H2O, (Χ, ▬) - DEE. d) Temperature profile.
Composition profiles obtained by simulation described reasonably well trends observed
in all experiments. However, composition profiles differ significantly mainly at the lower part of
the column. Considering the uncertainty in real separation efficiencies along the column under
different experimental conditions as discussed before, the number of stages used in simulations
was obtained from reported HETP. Then location of sampling ports in the column does not
necessarily correspond to those assigned in the model, and a mismatch between experimental and
simulation profiles is expected.
a b c d
0 30 60 90
1
2
3
4
5
6
7
8
9
10
11
12
Stage
% w EtOH, DES
0.0 0.3 0.6
% w SA, AcAc
0 3 6 9
% w
380 455 530
T (K)

259
Despite differences observed between experimental and simulation results, a simple
equilibrium stage model is able to reproduced major trends under different conditions evaluated
experimentally. Then a broader range of operation parameters not evaluated in the pilot unit can
be studied with the computational model.
In next sections simulations are performed using similar conditions to those evaluated in
run 14A. The same total inlet mass flow of SA (7.81 g/min) and AcOH (0.781 g/min) is used,
however mixed acid solution is fed to pre-reactor as a saturated solution of SA in EtOH (40 wt
%) at inlet temperature (363 K).
8.4.2.1 Effect of EtOH feed from bottoms
Figure 8-7 describes results obtained varying EtOH feed flow from bottoms. As expected
increasing EtOH flow enhances both SA and AcOH conversion. In addition to the higher excess
of EtOH, reaction is driven to completion because H2O is entrained by EtOH and is removed in
distillates. After certain level (~ 10 g/min) no significant improvement in SA or AcOH
conversion is gained by using higher amount of EtOH. However selectivity to DES increases up
to ~ 99 % by increasing EtOH flow up to 20 g/min because some MES still remains. This
corresponds to a total EtOH inlet flow (including acid feed and EtOH from bottoms) of ~ 31
g/min. By Operating under these conditions similar performance of that observed in experiment
14A was obtained. However major energy and material savings are achieved by splitting EtOH
inlet flow because run 14A used a total EtOH inlet flow from tops and bottoms of ~ 40 g/min.
Also a lower temperature in the reboiler was obtained.

260
Figure 8-7. Effect of EtOH inlet flow at bottoms operating with pre-reacted mixed acids fed at the solubility limit of SA in EtOH. a) (▬) - SA conversion, (▬ ▬)- AcOH conversion, (▬) -
Selectivity to DES, (○) - Reboiler temperature. b) Concentrations at the reboiler, (●) - H2O, (▲) - EtOH
40
50
60
70
80
90
100
0 5 10 15 20
EtOH feed rate at Bottoms (g/min)
% X
SA
, A
cAc
, %
SD
ES
420
430
440
450
460
470
T B
ott
om
s (K
)
a
0
1
2
3
4
0 5 10 15 20EtOH feed rate at Bottoms (g/min)
% H
2O
Reb
oil
er
0
2
4
6
8
% E
tOH
Reb
oil
er
b

261
The maximum observed in temperature profile in Figure 8-7a at different EtOH feed rates
is explained by the accumulation of H2O and/or EtOH in the reboiler. Operating with low boilup
flows limits the extent of reaction and H2O and EtOH accumulates at the reboiler. In the other
hand, operating at high inlet flows of EtOH at bottoms enhances water separation, and excess
EtOH accumulates at the reboiler decreasing boiling temperature of the mixture. As observed in
Figure 8-7b a minimum concentration of EtOH at the reboiler of 3.5 wt % (with negligible
amount of H2O) corresponded to the maximum of temperature (~ 461 K) when 12 g/min of
EtOH were fed from bottoms.
8.4.2.2 Effect of acid feed tray location
Simulations varying location of acid feed were evaluated using an inlet EtOH flow from
bottoms of 14 g/min. As observed in Figure 8-8, by introducing the acid feed stream close to the
bottom of the column selectivity to DES is severely reduced. Because the large excess of EtOH
mostly all SA is converted to MES. However because MES is virtually non-volatile,
esterification to DES can not take place in catalytic stages above inlet port. Then the lack of
catalytic stages avoids complete esterification and EtOH accumulates at bottoms reducing
boiling temperature.
In the other hand a positive effect of having catalytic stages above the mixed acids inlet
port is observed for AcOH conversion. In this case, some AcOH entrained by EtOH rising to the
top can be esterified in those catalytic sections, decreasing unreacted AcOH in the distillate.

262
Figure 8-8. Effect of acid feed tray location operating with pre-reacted acid fed at the solubility limit of SA in EtOH. (▬) - SA conversion, (▬ ▬) - AcOH conversion, (▬) - Selectivity to DES, (○) - Reboiler temperature.
8.4.2.3 Effect of boil-up rate and reflux ratio
The effect of boiling rate was evaluated using EtOH feed from bottoms (14 g/min) and
pre-reacted mixed acids feed. The boil-up ratio was evaluated at different reflux ratios up to the
maximum capacity of the column (fMC = 1). At a given reflux, distillate flow increases with
boiling rates, so results presented in Figure 8-9 are plotted with respect to distillate flow.
As observed SA and AcOH conversion as well as selectivity to DES decrease by
increasing reflux ratio, indicating the negative impact of H2O in the reflux.
80
85
90
95
100
1 3 5 7 9
Acid feed stage
% X
SA
, A
cAc
, %
SD
ES
400
420
440
460
480
T B
ott
om
s (K
)

263
Figure 8-9. Effect of boil-up rate and reflux ratio using pre-reactor and acid feed at the solubility limit of SA in EtOH. a) SA conversion. b) Selectivity to DES. c) AcOH conversion.
a
98.5
99
99.5
100
13 17 21 25
Distillate flow rate (g/min)
% X
SA
RR = 0
12
48
12
c
80
90
100
13 17 21 25
Distillate flow rate (g/min)
% X
AcA
c RR = 0
124
8
12
b
65
75
85
95
13 17 21 25
Distillate flow rate (g/min)
% S
DE
S
RR = 0
12
4
8
12

264
When reflux is fixed, increasing boil-up rate increases the amount of EtOH in catalytic
stages improving reaction performance. This also helps to entrain H2O in the overhead,
overcoming equilibrium limitations. However above a certain reflux ratio (~ 8) increasing boilup
ratio has a negative effect on conversion of SA and selectivity to DES. In this case most of the
EtOH is maintained in the upper part of the column and is removed from tops while H2O is
recycled and maintained in high concentrations in reactive stages limiting SA and MES
esterification. Because AcOH is also recycled and maintained with EtOH in top sections, its
conversion is improved by higher boiling rates even at high refluxes.
As seen in experiments and simulations, operating with a pre-reactor + column
configuration can provide better performance in the mixed acid esterification system. Preferably,
mixed acids must be introduced at the solubility limit of SA in EtOH to reduce energy and
material consumption.The column must operate with small or no reflux and with an EtOH feed
from bottoms to entrain water in distillates while maintaining low temperatures at the reboiler
avoiding formation of DEE. Finally, having catalytic stages above the mixed acids stream feed
port can help to enhance AcOH conversion otherwise affected by its removal in distillates.
8.5 Conclusions
Steady state RD experiments were conducted on the esterification of mixed SA and
AcOH with EtOH using a pilot scale unit. Operating under different conditions it was possible to
obtain almost complete conversion of both acids, with purity of DES higher than 98% as bottom
product. Succinate esters were completely separated from ethyl acetate that was removed within

265
distillate stream. This proved that simultaneous mixed acid esterification and separation of esters
can be accomplished in a single RD unit.
An Aspen model was developed and validated using the experimental results. The
equilibrium stage model included homogeneous kinetics and activity based phase equilibrium
model (NRTL-HOC). In general, the simulation model reproduces reasonably well experimental
observations and it was used to evaluate the effect of different processing variables on the
performance of the system. A preferable set of operating conditions to achieve high acids
conversion with high selectivity to DES was obtained. This model can be used to scale-up a
process for mixed acids esterification and to perform preliminary economical evaluation.

266
REFERENCES

267
8.6 REFERENCES
[1] O. Wolf, M. Crank, M. Patel, F. Marscheider-Weidemann, J. Schleich, B. Hüsing, G.
Angerer. Techno-economic feasibility of large-scale production of Bio-based polymers in Europe, European Science and Technology Observatory, EUR 22103 EN. 2005.
[2] P. Rogers, J. Chen, M. Zidwick. The prokaryotes. Chapter 3.1. Organic Acid and Solvent
Production, Part I: Acetic, Lactic, Gluconic, Succinic and Polyhydroxyalkanoic Acids. 511-755. 2006.
[3] Hermann, B., Patel, M. Biochem. Biotechnol. 136 (2007) 361-388. [4] B. Kamm, M. Kamm. Advances in biochemical engineering and biotechnology. White
biotechnology, ed. R. Ulber and D. Sell, Springer, Heildelberg, vol 105, ch. 4, 175-203, 2007.
[5] M. Sauer, D. Porro, D. Mattanovich, P. Branduardi. Trends Biotechnol. 26, 2 (2008) 100-
108. [6] J. B. McKinlay, C. Vieille, J. G. Zeikus. Appl. Microbiol Biotechnol. 76 (2007) 727-740. [7] I. Bechthold, K. Bretz, S. Kabasci, R. Kopitzky, A. Springer. Chem. Eng. Technol. 31, 5
(2008) 647-654. [8] A. Cukalovic, C. V. Stevens. Biofuels, Bioprod. Bioref. 2 (2008) 505-529. [9] C. Delhomme, D. Weuster-Botz, F. E. Kühn. Green Chem. 11 (2009) 13-26. [10] J. G. Zeikus, M. K. Jain, P. Elankovan. Appl. Microbiol. Biotechnol. 51 (1999) 545-552. [11] L. Agarwal, J. Isar, R. Saxena. J. Biochem. Biophys. Methods 63 (2005) 24-32.

268
[12] H. Song, S. Y. Lee. Enzyme Microb. Technol. 39 (2006) 352-361. [13] A. Orjuela, A. Yanez, C. T. Lira, D. J. Miller. Carboxylic Acid Recovery from
Fermentation Solutions. US Patent application. Filed 2009 [14] A. Tuchlenski, A. Beckmann, D. Reusch, R. Düssel, U. Weidlich and R. Janowsky. Chem.
Eng. Sci. 56 (2001) 387-394. [15] S. Schoenmakers, B. Bessling. Chem. Eng. Proc. 42 (2003) 145 -155. [16] R. Hiwale, N. Bhate, Y. Mahajan, S. Mahajani. Recent trends. Int. J. Chem. React. Eng.
Review R1. 2 (2004) 1-52. [17] G. Jam Harmsen. Chem. Eng. Process. 46, 9 (2007) 774-780. [18] A. A. Backhaus. (1921) Method for the production of esters. US Patent 1400852. [19] D. Sutton, G. Reed, G. Hiles. (2005, 2007). Process for the production of esters of mono-,
di or polycarboxylic acids. WO patent 051885 A1, US patent application 0129565 A1. [20] A. Kolah, A. Orjuela, N. Hanna, C. T. Lira, D. J. Miller. Reactive distillation for the
biorefinary: Pilot plant synthesis of succinic acid esters. 10AIChE - 2010 AIChE Spring Meeting and 6th Global Congress on Process Safety 2010, 13p. Mach 21-25, 2010. San Antonio, TX. USA.
[21] A. Orjuela, A. Kolah, X. Hong, C. T. Lira, D. J. Miller. Diethyl succinate synthesis by
reactive distillation. In revision. 2010. [22] H. Renon, J. M. Prausnitz. AIChE J. 14 (1968) 135-144. [23] J. G. Hayden, J. P. O'Connell. Ind. Eng. Chem. Process Des. Dev., 14, 3 (1975) 209-216. [24] Y. Tang, H. Huang, I. J. Chien. Chem. Eng. Japan. 36, 11 (2003) 1352-1366.

269
[25] A. Orjuela, A. Yanez, D. Vu, D. Bernard-Brunel, D. J. Miller, C. T. Lira. Fluid Phase
Equilibr. 290 (1-2) (2010) 63-67. [26] A. Orjuela, A. Yanez, P. Rossman, D. Vu, Bernard-Brunel, D. J. Miller, C. T. Lira. Fluid
Phase Equilibr. 290 (1-2) (2010) 68-74. [27] A. Orjuela, A. Yanez, J. Evans, D., D. J. Miller, C. T. Lira. Phase equilibria in binary
mixtures with monoethyl succinate. In revision. (2010). [28] A. Orjuela, A. Yanez, J. A. Lee, D. J. Miller, C. T. Lira. Solubility and phase equilibria for
mixtures with succinic acid. In revision. (2010). [29] A. Orjuela, A. J. Yanez, C. T. Lira, D. J. Miller. Kinetics of mixed succinic acid/acetic acid
esterification with Amberlyst 70 ion exchange resin as catalyst. Submitted. Appl. Catal. A. (2010).
[30] A. Kolah, N. Asthana, D. Vu, C. T. Lira, D. J. Miller. Ind. Eng. Chem. Res. 47 (15) (2008)
5313-5317. [31] L. Götze, O. Bailer, P. Moritz, C. von Scala. Catal. Today 69 (2001) 201–208. [32] J. Sieres, J. Fernández-Seara. Int. J. Refrig. 30 (2007) 58-67. [33] Sulzer Chemtech. (2010) Structured packings for distillation, adsoption, and reactive
distillation. [Online]. Available: http://www.sulzerchemtech.com/ portaldata/11/ Resources//brochures/mtt/Structured_Packings_April_2010.pdf [2010, Nov 1].
[34] M. Behrens, Ž. Olujić, P. J. Jansens. Chem. Eng. Technol. 31, 11 (2008) 1630-1637. [35] S. Ratheesh, A. Kannan. Chem. Eng. J. 104 (2004) 45-54. [36] A. Hoffmann, C. Noeres, A. Górak. Chem. Eng. Process. 43 (2004) 383-395.

270
[37] A. Kolodziej, M. Jaroszyński, I. Bylica. Chem. Eng. Process. 43 (2004) 457-464. [38] Ž. Olujić, M. Behrens. Chem. Eng. Technol. 29, 8 (2006) 979-985. [39] A. Orjuela, A. Kolah, X. Hong, C. T. Lira, D. J. Miller. Diethyl succinate synthesis by
reactive distillation. In revision.

271
PART 4: PROCESS CONCEPT AND PRELIMINARY
ECONOMICS

272
9. A novel process for recovery of fermentation-derived succinic acid:
Conceptual design and preliminary economics
9.1 Summary
Conceptual design of a process for recovery of bio-based succinic acid via esterification
with ethanol using reactive extraction and reactive distillation is presented. The process model is
based upon experiments validated at the pilot scale and it is implemented in the Aspen Plus®
process simulator. Processing alternatives are developed to operate with fermentation broths
containing a single acid (succinic acid) or mixed acids (succinic acid and acetic acid). Industrial
scale simulations are performed varying succinic acid processing capacities (~ 13 to 52 million
kilogram per year) and different concentrations of succinic acid in the fermentation broth (50, 70
and 100 kg/m3). Preliminary process economics are evaluated for the installation of a new
recovery plant within an existing fermentation facility. For a 10-year lifetime production facility
processing ~52 million kg/yr of succinic acid in a broth containing 100 kg/m3, the model
predicts a capital investment of ~ $ 67 million and a process operating cost of $ 1.586 per
kilogram of succinic acid. Selling price for diethyl succinate was estimated in 2.64 $/kg to
achieve 30% return of investment.
9.2 Introduction
Fermentation-derived succinic acid (SA) is a valuable carboxylic acid that potentially can
replace maleic anhydride as a renewable building block for many chemical commodities as 1,4

273
butanediol (BDO), tetrahydrofuran (THF), γ-butyrolactone (GBL), polybutilene succinates
(PBS), succinimides, succinate salts, etc. As chemical platform SA has a potential market of
around 1.6 million tonnes per year [1]. However current prices of petrochemical-derived maleic
anhydride (1.72-1.80 $/kg) is still lower than SA obtained by fermentation (3.3 – 5.5 $/kg) which
makes it unattractive as industrial feedstock.
Even though cost is still a limiting factor for the commercial success of bio-based SA, it
is recognized that the fermentation route has a net fossil energy consumption of 30-40% less than
the current petroleum-based route [2]. In addition to this SA can be produced with a variety of
feed stocks and microorganisms, with net consumption of CO2, making possible to integrate it
within an ethanol bio-refinery. These positive attributes have been recognized by many chemical
industries who envision the opportunities to obtain governmental support to assist in construction
of new biobased production facilities. Currently several demonstration plants are under
construction or operation [1, 3-5].
In general, in bio-based SA production 50% to 80% of processing costs are due to
separation and refining of final product. Major challenges in purification are the low titer in
fermentation broth (50-100 kg/m3), the presence of various by-products including other
carboxylic acids, and the nature of final product that is in the salt form due to neutralization
required to control pH during fermentation.
To overcome these challenges, alternative methods have been proposed to recover SA
from fermentation. After acidification of the broth to release SA in aqueous solution, selective
precipitation [6-8], extraction with solvents and/or amines [9-12], ion exchange [13, 14],
membrane separation [15, 16] and even esterification [17-20] have been reported. Among these
the esterification route is of special interest. From a chemical production viewpoint, succinate

274
esters are more desirable than the free acid for derivatives such as tetrahydrofuran and 1-4
butanediol [21], as the maleic anhydride route already goes through the ester. Thus, succinate
recovery as esters directly from the fermentation broth would be of economic interest.
Recently our research program has demonstrated that succinic acid in salt form can be
recovered directly from fermentation solids by reactive extraction with ethanol (EtOH) [22]. In
this process, succinate salts from the fermentation broth are partially esterified to succinate esters
in an ethanol-rich solution, from which it can be further converted into diethyl succinate using
reactive distillation. Because other carboxylic acids are typically present in the fermentation
broth, a mixture of different carboxylic ethyl esters is obtained as a final product. From reports
on SA fermentation using different microorganisms it has been established that acetic acid
(AcOH) is one of the major byproducts (5-40 kg/m3) [23-25].
Because esterification extend is limited by chemical equilibrium, driving reaction to
completion require products removal. In this direction, and specifically applied for esterification
of SA and AcOH mixtures, reactive distillation has been used to simultaneously accomplish
water (H2O) removal along reaction, together with separation of diethyl succinate (DES) from
ethyl acetate (EtOAc) [26, 27]. Additional advantages of RD as the reduction of capital cost and
lower energy consumption have been exploited in many chemical processes some of which have
been implemented at the industrial scale [28-31].
In this work the integration of a reactive extraction process to recover SA and AcOH with
EtOH together with a reactive distillation system to obtain DES as the main product is presented.
Conceptual design of the process was conducted using Aspen Plus® process simulation software
(Version 7.1, AspenTech). Finally a preliminary economic evaluation of the process is presented

275
including major costs components such as raw materials, equipment, utilities, labor and other
economic factors.
9.3 Conceptual design of the process
9.3.1 Process concept
The process concept to recover SA from fermentative broth was by our research program
and experimental validation is presented elsewhere [22, 26, 27, 32].
Na2Succ (s) + H2SO4 (l) + EtOH → SA (sol) + Na2SO4 (s)
2 NaOAc (s) + H2SO4 (l) + EtOH → 2 AcOH (sol) + Na2SO4 (s)
Figure 9-1. Reaction chemistry during reactive extraction of SA and AcOH with EtOH directly from sodium salts obtained by fermentation.
Succinic Acid Monoethyl Succinate Ethanol
Diethyl Succinate Monoethyl Succinate Ethanol
Acetic Acid Ethyl Acetate Ethanol
H2OOH
O
O
OH O
O
O
OHOH+ + H2OOH
O
O
OH O
O
O
OHOH+ +
H2OH2O
H2OH2O
2H2O2H2O
Ethanol Diethyl ether

276
The overall concept involves partial esterification of the succinate salts in EtOH in a
reactor, followed by reactive distillation of the mixture. Figure 9-1 describes reaction chemistry
considering that both SA and AcOH are present in the fermentation broth as sodium salts:
sodium disuccinate (Na2Succ) and sodium acetate (NaOAc). Esterification of SA occurs in a
series-parallel scheme of reaction with monoethyl succinate (MES) as intermediate.
Etherification of EtOH is also considered in the model.
A block diagram of the process is presented in Figure 9-2. Three different sections are
described. Initially the fermentation broth is treated as usual by typical centrifugation or filtration
to remove cell biomass and by clarification to remove impurities and color. Water is then
removed by evaporation until the succinate and acetate salts precipitate. Wet solids removed by
filtration or any other method are dried to removed major part of moisture.
In the second section, extraction and pre-esterification of solid salts is performed in
EtOH, adding required equivalents of sulfuric acid to acidify succinate and acetate salts. In
general a slight excess of H2SO4 is used to ensure complete recovery. The amount of EtOH used
is at least the required to dissolve SA at the temperature of extraction. Because inorganic sulfates
are virtually insoluble in EtOH, they are removed by centrifugation or filtration.
Finally pre-estererified mixture is sent to a RD unit where high purity DES is obtained as
bottom product. EtOAc is recovered within distillate along with excess EtOH and H2O. In order
to recovery EtOAc and recycle excess EtOH, a separation system is required for the distillate
stream.

277
Figure 9-2. Recovery process for succinic acid form fermentation broth by esterification with ethanol.
9.3.2 Process description
The process flow diagram as a result of this study is presented in Figures 9-3 and 9-4.
When AcOH is present in the broth EtOAc is recovered and additional units are required as
presented in Figure 9-4. A train of three thermally integrated evaporators is used to concentrate
fermentation broth. As a result of evaporation, succinate and acetate salts precipitate and are
Biomass removal
Fermentation
Macromolecules and protein removal
Evaporation
Carboxylic salts separation
Wet salts drying
Acidification
Sodium sulfate removal
Esterification Pre-reactor
Reactive
Distillation Column
Lights and Ethanol
Recovery system
Purification and
Refining
Water for recycling to fermentation
Biomass to disposal
Solids to disposal
Solution for recycling
Ethanol Excess Mixed esters
for separation and refining
Water to disposal
Diethyl Succinate
Ethanol
Wet Sulfate for drying
and disposal
Ethanol
Sulfuric Acid
Water
ACIDIFICATION PRE-
ESTERIFICATION IN
ETHANOL
REACTIVE
DISTILLATION
BROTH
CONDITIONING

278
removed by centrifugation. It was assumed that dry solids were obtained here, and saturated
liquor is recycled to the last evaporation stage. Dry salts are then mixed with EtOH and H2SO4
in two stirred reactors operating in parallel to maintain tank sizes under dimensions
commercially available. After reactive extraction solid sulfates are removed and the ethanolic
solution of acids and esters is sent to the RD unit.
Two inlet streams are fed into the RD unit, ethanolic acid solution from tops and recycled
EtOH from bottoms. In this unit nearly pure DES is obtained from bottoms, while distillate
stream reach in EtOH also removes H2O, EtOAc, DEE and traces of DES.
In a subsequent distillation (C-1) most of the water is removed from bottoms and a top
stream containing less than 10 % wt of water is obtained. Even though this top stream also
contains small amounts of DEE and DES, a ternary diagram including only EtOH, H2O and
EtOAc (Figure 9-5) can help to visualize major challenges in further water removal by
distillation. Top stream from column C-1 is located close to a distillation boundary (Figure 9-5)
in a region where only H2O can be obtained as pure product. Because the large excess of EtOH
in C-1 distillate, a large amount of highly concentrated EtOAc or EtOH (e. i. using recycled
stream after further separation) is required to move this stream to a different distillation region
where other products can be obtained. In order to avoid excessive use of material and energy, a
separation process including molecular sieves was used. In this case most of the water in
distillates from C-1 is removed and thus moved to a region where pure ethanol can be obtained
by distillation. Because saturation of molecular sieves, a common practice in the EtOH industry
is recycling around 20 % of processed product into a parallel unit operating in a regeneration
cycle. Then regenerating stream is sent back to column C-1.

279
Figure 9-3. Process flow diagram for recovery of succinic acid from fermentation broths by esterification with ethanol using reactive extraction and reactive distillation.
Evaporators
Acidification Reactors
RD Column
Ethanol distillation
C-1
Molecular Sieves
Fermentors
Biomass
Steam Water recycle to
fermentation
Dry salts
H2SO4
Recycled ethanol
Recycled ethanol
Fresh ethanol
Pre-reacted solution in
ethanol
Regeneration ethanol
Diethyl succinate
Water
Sulfates
Diethyl ether purge
Fresh ethanol
Fresh ethanol H2SO4

280
Figure 9-4. Process flow diagram for recovery of ethyl acetate.
Ethyl acetate – ethanol azeotrope
Molecular Sieves
Ethanol Recovery
C-2
Ethyl acetate Recovery
C-3 Regeneration
stream
Ethanol recycling to RD column
Ethanol – ethyl acetate To C-1
Ethyl acetate
Diethyl ether purge

281
When AcOH is not present in the broth, there is no EtOAc in the system and pure ethanol
obtained from molecular sieves can be recycled to reactors or RD unit. However a purge to
remove DEE must be used otherwise it will built up in the system. In the other hand if EtOAc is
present in the system this must be removed.
As observed in Figure 9-5, EtOAc concentration in tops of C-1 is higher than 20 wt %.
Under these conditions the use of a purge will remove substantial amount of EtOH.
Figure 9-5. Ternary diagram for the system EtOH-H2O-EtOAC at 101.3 kPa.
T e r n a r y M a p ( M a s s B a s i s )
ETAC
H2O
ET
OH
0.1 0.2 0.3 0.4 0.5 0.6 0.7 0.8 0.9
0.1
0.2
0.3
0.4
0.5
0.6
0.7
0.8
0.9
0.9
0.8
0.7
0.6
0.5
0.4
0.3
0.2
0.1
344.53 K
342.90 K
350.91 K
343.19 K
Bottoms C-1
Bottoms C-2
Top C-1
Sieve
Top RD
Top C-2
EtOAc

282
Figure 9-6. Ternary diagram for the system EtOH-H2O-EtOAc at 404.3 kPa.
After water removal in molecular sieves, top stream from C-1 is now in a region where pure
EtOH can be obtained as bottom product using column C-2 in Figure 9-4. In this case separation
is limited by another distillation boundary where azeotrope EtOH-EtOAc is obtained as top
product. However, as observed in Figure 9-6, a pressure shift can move distillation boundary in
such a way that top stream from column C-2 can be further distilled in column C-3 to obtain pure
T e r n a r y M a p ( M a s s B a s i s )
ETAC
H2O
ET
OH
0.1 0.2 0.3 0.4 0.5 0.6 0.7 0.8 0.9
0.1
0.2
0.3
0.4
0.5
0.6
0.7
0.8
0.9
0.9
0.8
0.7
0.6
0.5
0.4
0.3
0.2
0.1
388.86 K
386.03 K
389.90 K
386.48 K
Bottoms C-2
Top C-3
Sieves Product
Bottoms C-3
Top C-2
EtOAc

283
EtOAc as bottom product. Distillates from this last column are recycled to column C-2, but a
purge is required to remove DEE out of the system
9.3.3 Process simulation
Computer simulation was carried out using steady state models in Aspen Plus®
for a
facility processing approximately 13, 26, 36 and 52 million kilograms of SA annually. Three
different SA concentrations in the original broth were considered (50, 70 and 100 kg/m3). When
simulations were performed with broths also containing AcOH, a SA/AcOH mass ratio of 1/10
was assumed.
Required physicochemical data (e. g. vapor pressures, solubility, multicomponent phase
equilibria, etc) and kinetics of reactions were evaluated experimentally by our group, or were
obtained from literature [33-39].
Reactive extraction units were modeled as CSTR reactors. In a previous work it was
demonstrated that acidification of salts in EtOH occurs in less than 3 hours [32], so residence
time in reactors was defined as 8h. RD unit and other distillation units were modeled using an
equilibrium stage approach, corrected by Murphree efficiency and height equivalent to a
theoretical plate (HETP). A list of major design specifications is presented below:
• Minimum heating surface in evaporators calculated with methodology applied in sugar
cane industry [40].
• Acidification reactors operated as CSTR at 363 K under 304 kPa. Kinetics of
esterification was described with a model for Amberlyst 70 assuming acidity equivalents
to 0.3 wt % H2SO4.
• Concentration of SA as free acid in EtOH in acidification reactors was 50%.

284
• Maximum MES concentration of 1 wt % in RD column bottom product.
• Maximum temperature of 453 K at the reboiler of RD column.
• Maximum H2O concentration of 0.5 wt % in recycled EtOH
• Molecular sieves operated at 393 K and 152 kPa, with a recycle of 20 % of processed
stream for regeneration.
• Water content of 0.3 wt % in outlet stream form molecular sieves.
• Minimum concentration of 99 wt% of ethyl acetate in bottom product of column C-3,
when AcOH was considered present in the fermentation broth.
• Pressure of 404.3 kPa in EtOAc recovery column (C-3).
• Columns operated at 80% of maximum hydrodynamic capacity.
• Distillation columns operated with a constant heat transfer coefficients at reboiler (0.85
kW/m2 K) and condensers (0.64 kW/m2 K).
• Water was used as cooling service with a minimum temperature of 293 K.
• Compressors and pumps operated at 0.78 and 0.9 efficiency respectively.
A list of parameters used in simulation of major units is presented in Tables 9-1 to 9-3.
Table 9-1. Parameters in simulation of evaporation system
Number of effects 3 Flow arrangement Co-current
Temperature (K) 423 Steam
Inlet effect 1 Effect 1 296 Effect 2 152 Pressure (kPa) Effect 3 35 Effect 1 3.97 Effect 2 2.55 Heat transfer coefficient (kW/m
2 K)
Effect 3 1.13

285
Table 9-2. Parameters in simulation of reactive distillation unit
Number of stages 27 Pressure (kPa) 304 Reflux ratio 0.04 Distillate/feed mass ratio 0.61 Pre-esterified acid mixture feed stage 5 Ethanol feed stage 26
Stages 1 Stripping zone
Packing BX®
Stages 2-24 Packing KATAPAK SP-11
Catalyst Amberlyst 70®
Catalytic
Catalyst loading (kg/m3) 76
Reactive stages
Self-catalytic Stages 25-26 Stages 25-26
Enrichment zone Packing BX
®
HETP (m-1
) [41-43] 0.5
Hold up (vol %) [41-43] 0.14 Murphree efficiency 0.5
Table 9-3. Parameters in simulation of distillation columns C-1, C-2 and C-3
Column C-1 C-2 C-3
Number of stages 10 12 17 Pressure (kPa) 152.0 101.3 404.3 Reflux ratio 1.7 4 5 Distillate/feed mass ratio 0.875 - - Bottoms/feed mass ratio - 0.221 0.023 Feed stage 9 10 10 Plate type Sieve tray Murphree efficiency 0.5
9.3.4 Preliminary economics of the process
Economic evaluation of the process is based upon results obtained from Aspen Plus®
simulations. Stream flows and conditions as well as process equipment sizes and energy

286
requirements were transferred into a spreadsheet program where economic analysis was
implemented. Costs of major units were evaluated with correlations available in the literature
[44]. Structured packing and catalyst costs were obtained from vendors (Sulzer, Dow Chemical
Co.). Price of raw materials, products and utilities were obtained from reports as July 2010 [45,
46]. Cost of pretreated (filtered and clarified) raw fermentation broth was estimated in 0.33 $/kg
of SA. Major parameters and key assumptions in economic model were obtained from literature
[47] and are presented in Tables 9-4 to 9-6. A list of major equipment included in economic
evaluation is presented in Table 9-7.
Table 9-4. Parameter for economic analysis
Plant location USA - Midwest
Plant startup 2013
Plant life 10 years
Operation time 24h/day, 360 days/yr
Marshall & Swift cost index (2nd
quarter 2009) 1446.5
Return of investment (ROI) 30 %
Net present worth at project end $ 0
Combined federal/state income tax rate 35 %
Effective loan ratio 5 %
Broth 0.3306 $/kg SA
Ethanol 1.72 $/gal Raw materials
Sulfuric Acid 0.23988 $/kg
Electricity 0.0654 $/kW Utilities
Natural Gas 5.68 $/MMkJ
Byproducts Ethyl acetate 1.102 $/kg

287
Table 9-5. Parameters used in the estimation of the total capital investment
Percentage Calculation basis
Direct costs Installation 40 % Instrumentation 35 % Piping 50 % Electrical 30 % Buildings, process, and auxiliary 60 % Service facilities, and yard improvements
70 %
Land 5 %
of purchased equipment cost
Direct costs 75 %
Indirect costs 15 % of fixed capital investment
Fixed capital investment Direct costs + Indirect costs
Working capital 15 % of total capital investment
Total capital investment Fixed capital investment + working capital
Table 9-6. Parameters used in the estimation of the total operating costs
percentage Calculation Basis
Fixed Operating Costs
Capital Cost 100 % Of installed equipment cost
Total Labor Costs Plant Operators' Salaries 5.24 % Operators / Shift at (25$/hour) Maintenance Salaries 1.0 % Of Capital Costs Supervision & Administration
40.0 % Of Operators & Maintenance salaries
Fringe Benefits 30 % Of Operators, Maintenance & Supervision
Labor Supplies Operating Supplies 0.75% Of Capital Cost Maintenance Supplies 1.0% Of Capital Cost Insurance & Local Taxes 0.8% Of Capital Cost
Depreciation Straight line - 10 Years Economic Life
Total Operating Cost Fixed operating costs+ variable operating costs+
Depreciation
Process Operating Cost Fixed operating costs+ variable operating costs (minus
byproducts)+ Depreciation

288
Table 9-7. Major units included in equipment cost evaluation
Equipment Number
Evaporators 3 Reactors 2 Centrifuges 2 Reactive distillation column 1 Distillation columns 3 (1
§)
Heat exchangers (condensers and reboilers) 13 (7§)
Molecular sieves 1 Pumps 6 Compressor 1 Fire heater 1 Cooling tower 1 Solids conveyor 1
§ Operation without AcOH in fermentation broth
9.4 Results and discussion
Major simulation results obtained for a facility processing ~ 52 million kg/yr SA in a
broth containing 100 kg/m3 of SA with and without AcOH are presented in Table 8. Total capital
investment of ~ $ 70 million (without AcOH) and ~ $101 million (with AcOH) was obtained.
Clearly, additional distillation units required to remove and recover EtOAc increase capital
investment and also processing costs. However DES prices calculated with a 30% ROI for both
processing alternatives (1.21 $/kg and 1.44 $/kg respectively) is lower than current commercial
price for diethyl maleate (2.5-2.8 $/kg).
A breakdown of processing costs for a ~ 52 million kg/yr SA facility without AcOH in
the broth is presented in Figure 9-7. As observed raw materials play a major role in determining
final price for DES. Other than the broth cost that is common in any SA purification process, in
our process fresh EtOH accounts for 42% of total processing costs. Nevertheless, more than 90
wt % of inlet EtOH ends up in the final product. Around 10% EtOH is lost in water stream

289
removed from column C-1 or in purge to remove DEE (Figure 9-3). However this purge can be
used as a fuel in fire heaters or further processed to obtain DEE as valuable byproduct. After
global optimization of the process some EtOH savings can be obtained. It is also important to
consider the opportunity of integration of this process within a bio-refinery where EtOH price
can be lower than commercial price used in this study.
Figure 9-7. Operating costs breakdown of in the recovery of SA from fermentation broths by esterification with EtOH. Facility processing ~ 52 million kg/yr SA in a broth containing 100
kg/m3 SA without AcOH.
Sulfuric acid consumption is the third major contribution to the selling price for DES.
Despite in most of current technologies is a common practice to use sulfuric acid in acidification
of broths; recovery from aqueous solutions is difficult. In this process sulfates precipitate
because their negligible solubility in EtOH and can be easily removed. Depending on the salt
Depreciation0.065 $/kg SA
5%
Insur. & Tax.0.005 $/kg SA
0%
Supplies0.011 $/kg SA
1%Labor
0.052 $/kg SA4%
Natural Gas0.102 $/kg SA
7%
Electricity0.004 $/kg SA
0%
Sulfuric acid0.239 $/kg SA
17%
Ethanol 0.573 $/kg SA
42%
Broth0.331 $/kg SA
24%

290
form obtained in the fermentation broth (magnesium, ammonium), sulfates generated may have
value as fertilizers. The value or cost of sulfates are not included in the analysis.
Table 9-8. Simulation results for a processing capacity of ~ 52 million kg/yr SA in a broth
containing 100 kg/m3 SA with and without AcOH.
Without AcOH With AcOH
Fermentation broth feed rate, (kg/yr) 5.25x10⁸
SA feed rate, (kg/yr) 5.25x10⁷
AcOH feed rate, (kg/yr) - 5.25x10⁶
Total fresh EtOH feed rate, (kg/yr) 5.23x10⁷ 5.73x10
7
DES production rate, (kg/yr) 8.03 x10⁷
EtOAc recovered, (kg/yr) - 3.58x10⁶
Electricity, (kW-h) 3.09x10⁶ 1.26x10
7
Natural gas, (kW) 2.63x10⁸ 3.95x10
8
Purchase equipment price, ($) 1.12x10⁷ 1.73x10
7
Direct costs, ($) 4.63x10⁷ 6.74x10
7
Direct costs per kg of SA, ($/kg) 0.083 0.128
Fixed capital investment, ($) 5.81x10⁷ 8.98x10
7
Working capital, ($) 8.71x10⁶ 1.35x10
7
Total capital investment, ($) 6.68x10⁷ 1.03x10
8
Total capital investment per kg of SA, ($/kg) 0.127 0.197
Total process operating cost, ($) 7.26x10⁶ 8.15x10
7
Total process operating cost per kg of SA, ($/kg) 1.382 1.552
DES price at pay back period of 10 years ($/kg) 0.967 1.066
DES price (ROI 30%) ($/kg) 1.210 1.443
Even though water removal was carried out by evaporation, energy provided by natural
gas combustion corresponds only to 7% of the total operating cost. In fact 4% is due to
evaporation and 3% is used in distillation systems. Considering that energy integration has not
been developed here, further energy savings can be obtained. In addition to this distillated water

291
from evaporators can be recycled into the fermentation process without further treatment.
Remaining supplies, labor, depreciation and other utilities costs, play a relative minor role in this
process.
In Figure 9-8 direct costs, total capital investment and operating costs are reported per
mass of SA processed for all conditions evaluated. As observed the lowest costs are obtained by
processing ~ 52 million kg/yr of SA at 100 kg/m3 in the broth without AcOH. Considering that
this process has been evaluated also for broths containing SA in the free acid form, [32] and also
taking into account that current developments in fermentation can lead to higher concentration
and high purities of SA, this processing alternative can become even more attractive in the near
future.
In general directs costs and capital investment represent less than 10 % and 20 %
respectively of operating costs. Above a processing capacity of ~ 36 million kg/yr of SA costs
are slightly reduced because energy, broth, EtOH and H2SO4 consumption is proportional to the
scale of production, and they account for more than 90 % of processing costs.
Selling price of DES for a 30 % ROI for all simulated cases is presented in Figure 9-9.
Remarkably even at low concentrations, low processing capacities and with AcOH in the broth
calculated prices are lower than diethyl maleate current price (2.5-2.8 $/kg). This indicates that a
processing alternative using recovery of SA by esterification would open new commodity-scale
market for DES. However, taking into account that DES is meant to replace maleic anhydride as
feed stock for major commodities, a comparison of prices in a molar basis can provide useful
information.
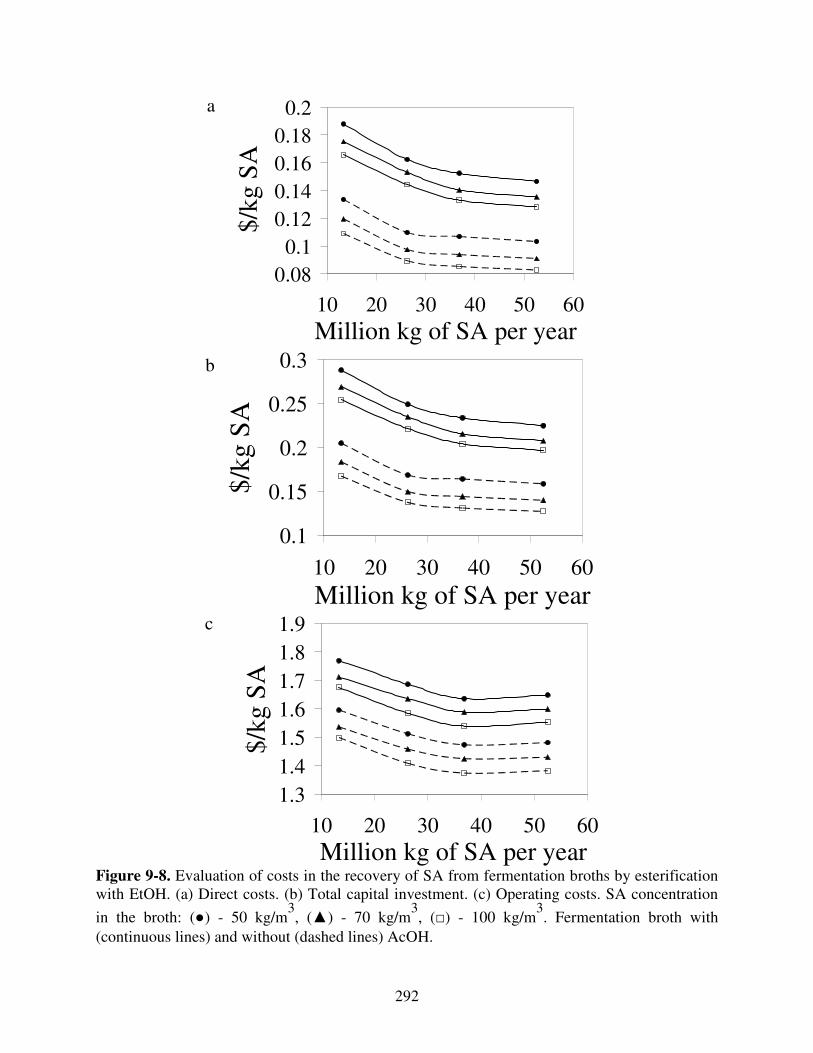
292
Figure 9-8. Evaluation of costs in the recovery of SA from fermentation broths by esterification with EtOH. (a) Direct costs. (b) Total capital investment. (c) Operating costs. SA concentration
in the broth: (●) - 50 kg/m3, (▲) - 70 kg/m
3, (□) - 100 kg/m
3. Fermentation broth with
(continuous lines) and without (dashed lines) AcOH.
a
0.080.1
0.120.140.160.18
0.2
10 20 30 40 50 60Million kg of SA per year
$/kg
SA
b
0.1
0.15
0.2
0.25
0.3
10 20 30 40 50 60Million kg of SA per year
$/kg
SA
c
1.31.41.51.61.71.81.9
10 20 30 40 50 60Million kg of SA per year
$/kg
SA

293
Figure 9-9. Evaluation of selling price of DES at different SA processing capacities with a ROI
of 30 %. SA concentration in the broth: (●) - 50 kg/m3, (▲) - 70 kg/m
3, (□) - 100 kg/m
3.
Fermentation broth with (continuous lines) and without (dashed lines) AcOH.
For example, when DES selling price is calculated in a molar basis for a ~ 52 million
kg/yr process without AcOH (1.21 $/kg = 210 $/kmol), a price slightly higher of that computed
for maleic anhydride (1.78 $/kg = 174.5 $/kmol) is obtained. But taking into account that
transformation of DES to other derivatives (e. g. BDO, GBL, THF) involves hydrogenolysis of
the ester, two moles of EtOH are produced. Recalling that alcohol consumption plays the major
role in processing costs, then EtOH liberated after hydrogenolisis can be recycled to the recovery
process. This would increases efficiency and profitability of the whole process.
1.15
1.35
1.55
1.75
1.95
10 20 30 40 50 60
Million kg of SA per year
$ / k
g D
ES
294
9.5 Conclusions
A conceptual design and economic evaluation of a process to recover SA from
fermentations broths is developed. The separation involves esterification with EtOH via reactive
extraction and reactive distillation to obtain DES as final product by-passing SA purification and
refining. Evaluating under different production scales and considering presence of AcOH in
fermentation broth, it is found that raw materials (Broth, EtOH, and H2SO4) are the most
significant contributors to DES selling price. Even at the lower processing capacities with low
concentrations of SA in the broth and including AcOH, predicted DES prices are lower than
petrochemical derived diethyl maleate.
Because utilities and equipment costs have a relative minor effect in DES final price, it is
expected that changes in the proposed process configuration have minor influence in overall
economics. Further improvements in the model by performing energy integration and global
optimization will have a positive impact on already favorable economics demonstrated for this
process.

295
REFERENCES

296
9.6 REFERENCES
[1] P. Taylor. Biosuccinic acid ready for take off? Chemical world. 2010. [Online]. Available:
http://www.rsc.org/chemistryworld/News/2010/January/ 21011003.asp [2010, Nov 26]. [2] D. Ruth. Bio-based succinic acid bring ‘green’ chemicals closer to the market. Medical
news today. (2008) [Online]. Available: http://www.medicalnewstoday.com /articles/133890.php [Sept, 2010].
[3] M. Sauer D.Porro, D. Mattanovich, P. Branduardi. Trends Biotechnol. 26, 2 (2008) 100-
108. [4] J. Elbert. The quest to commercialize biobased succinic acid. Biomass magazine. (2007).
[Online]. Available: http://www.biomassmagazine.com/article.jsp? article_id=1228 [Sept, 2010].
[5] H. Kidwell. Bio-succinic acid to go commercial. In-pharma technologist. (2008). [Online].
Available: http://www.in-pharmatechnologist.com/Materials-Formulation/Bio-succinic-acid-to-go-commercial [Sept, 2010].
[6] N. A. Collins, M. R. Shelton, G. W. Tindall, S. T. Perri R. S. O’Meadhra, C. W. Sink, B.
K. Arumugam, J. C. Hubbs. Process for the recovery of organic acids from aqueous solutions. US Patent 6670505 B1. (2003).
[7] I. Fujita, K. Wada. A process for producing succinic acid. World patent application. WO
2008/010373 A1. (2008). [8] R. Datta, D. Glassner, M. Jain, J. Vick, Fermentation and purification process for succinic
acid. US Patent 5168055. (1992). [9] C. J. King, J. Starr. Recovery of carboxylic acids from water by precipitation from organic
solutions. US Patent 5104492. (1992).

297
[10] A. Eyal. Process and extractant composition for extracting acids. US Patent 5831122. (1998).
[11] M. Holtzapple, R. Davison, T. Luettich. Recovery of fermentation salts from dilute
aqueous solutions. US Patent 6478965. (2002). [12] D. W. Verser, T. J. Eggeman. Recovery of organic acids. US Patent Application 0256337
A1. (2005). [13] M. Cockrem, I. Kovacs, I. Mohamednur, D. Heidel. Process for purifying an organic acid.
US patent 6641734 B2. (2003). [14] T. Kushiku, K. Fujiwara, T. Satou, C. Sano. Method for purifying succinic acid from
fermentation broth. US Patent Application 0276674 A1. (2006). [15] K. Berglund. Carboxylic acid purification and crystallization process. US patent 5034105.
(1991). [16] D. Glassner, R. Datta. Process for the production and purification of succinic acid. US
Patent 5143834. (1992). [17] R. Datta, S. P. Tsai. Esterification of fermentation derived acids via pervaporation. US
Patent 5723639. (1998). [18] M. C. Cockrem. Process for the production of organic acids and esters thereof. US Patent
6291708 B1. (2001). [19] D. Dunuwila. Process for the direct production of esters of carboxylic acids from
fermentation broths. Canadian patent application 02657666. (2009). [20] C. Bauduin, W. Fischer, R. Pinkos, E. Scholten. Method of producing a carboxylic alkyl
ester. US patent application 0137825 A1. (2009). [21] S. Varadarajan, D. J. Miller. Biotechnol. Prog. 15, 5 (1999) 845-854.

298
[22] A. Orjuela, A. Yanez, C. T. Lira, D. J. Miller. Carboxylic Acid Recovery from
Fermentation Solutions. US Patent application. Filed 2009. [23] J. G. Zeikus, M. K. Jain, P. Elankovan. Appl. Microbiol. Biotechnol. 51 (1999) 545-552. [24] L. Agarwal, J. Isar, R. Saxena. J. Biochem. Biophys. Methods 63 (2005) 24-32. [25] H. Song, S. Y. Lee. Enzyme Microb. Technol. 39 (2006) 352-361. [26] A. Orjuela, X. Hong, A. Kolah, C. T. Lira, D. J. Miller. Diethyl succinate synthesis by
reactive distillation. In revision. 2010. [27] A. Orjuela, A. Kolah, C. T. Lira, D. J. Miller. Mixed succinic acid/acetic acid esterification
with ethanol by reactive distillation. In revision. 2010. [28] A. Tuchlenski, A. Beckmann, D. Reusch, R. Düssel, U. Weidlich and R. Janowsky. Chem.
Eng. Sci. 56 (2001) 387-394. [29] S. Schoenmakers, B. Bessling. Chem. Eng. Proc. 42 (2003) 145 -155. [30] R. Hiwale, N. Bhate, Y. Mahajan, S. Mahajani. Int. J. Chem. React. Eng. Review R1. 2
(2004) 1-52. [31] G. Jam Harmsen. Chem. Eng. Process. 46, 9 (2007) 774-780. [32] A. Orjuela, A. J. Yanez, L. Peereboom, C. T. Lira, D. J. Miller A novel process for
recovery of fermentation-derived succinic acid. In revision. 2010. [33] Y. Tang, H. Huang, I. J. Chien. Chem. Eng. Japan. 36, 11 (2003) 1352-1366. [34] A. Kolah, N. Asthana, D. Vu, C. T. Lira, D. J. Miller. Ind. Eng. Chem. Res. 47 (15) (2008)
5313-5317.

299
[35] A. Orjuela, A. J. Yanez, D. Vu, D. Bernard-Brunel, D. J. Miller, C. T. Lira. Fluid Phase
Equilibr. 290 (1-2) (2010) 63-67. [36] A. Orjuela, A. J. Yanez, P. Rossman, D. Vu, Bernard-Brunel, D. J. Miller, C. T. Lira. Fluid
Phase Equilibr. 290 (1-2) (2010) 68-74. [37] A. Orjuela, A. J. Yanez, J. Evans, D., D. J. Miller, C. T. Lira. Phase equilibria in binary
mixtures with monoethyl succinate. In revision. (2010). [38] A. Orjuela, A. J. Yanez, J. A. Lee, D. J. Miller, C. T. Lira. Solubility and phase equilibria
for mixtures with succinic acid. In revision. (2010). [39] A. Orjuela, A. J. Yanez, C. T. Lira, D. J. Miller. Kinetics of mixed succinic acid/acetic acid
esterification with Amberlyst 70 ion exchange resin as catalyst. Submitted. Appl. Catal. A. (2010).
[40] E. Hugot. Handbook of cane sugar engineering. 3rd, completely rev., ed. Elsevier; New
York, NY, 1986, p. 588- 595. [41] L. Götze, O. Bailer, P. Moritz, C. von Scala. Catal. Today 69 (2001) 201–208. [42] J. Sieres, J. Fernández-Seara. Int. J. Refrig. 30 (2007) 58-67. [43] Sulzer Chemtech. (2010) Structured packings for distillation, adsoption, and reactive
distillation. [Online]. Available: http://www.sulzerchemtech.com/ portaldata/11/ Resources//brochures/mtt/Structured_Packings_April_2010.pdf [2010, Nov 1].
[44] S. M. Walas. (1990) Chemical process equipment - selection and design. Elsevier.
[Online]. Available: http://knovel.com.proxy1.cl.msu.edu/web/portal/browse /display?_EXT_KNOVEL_DISPLAY_bookid=401&VerticalID=0
[45] ICIS. Chemical price reports. [Online]. Available: http://www.icispricing.com [2010, July]. [46] ICIS. ICIS Heren. [Online]. Available: http://www.icis.com/heren/ [2010, July].

300
[47] M. S. Peters, K. D. Timmerhaus, R. E. West. (2003). Plant design and economics for
chemical engineers. 5th ed. McGraw-Hill. New York, NY.