Embed Size (px)
Citation preview

Illinois Department of Revenue

Economic Indicators
Consumer SpendingLabor
Data SummaryHousing Gross Domestic
Product
Economic indicators measure activity on a given topic. As researchers, businesses, economists, we probe these
macroeconomic datasets at the local level to summarize how they interact and impact our community.

(In the Labor Force, not working but looking for work)
Unemployment Rates
5.1%
Bloomington-Normal and Other Illinois Cities Unemployment RatesAugust 2015-August 2016
Aug-15 Sep-15 Oct-15 Nov-15 Dec-15 Jan-16 Feb-16 Mar-16 Apr-16 May-16 Jun-16 Jul-16 Aug-160.00%
1.00%
2.00%
3.00%
4.00%
5.00%
6.00%
7.00%
8.00%
9.00%
BN Chicago Decatur Peoria Springfield IL5.1% 6.7%5.4% 6.2% 4.6% 5.5%

Continuing decline …Labor Force and Employment
Aug-11
Oct-11
Dec-11
Feb-12
Apr-12
Jun-12
Aug-12
Oct-12
Dec-12
Feb-13
Apr-13
Jun-13
Aug-13
Oct-13
Dec-13
Feb-14
Apr-14
Jun-14
Aug-14
Oct-14
Dec-14
Feb-15
Apr-15
Jun-15
Aug-15
Oct-15
Dec-15
Feb-16
Apr-16
Jun-16
Aug-1680,000
85,000
90,000
95,000
100,000
105,000
110,000
Labor Force Employed
• US Labor Force also continues to decline, especially in the middle-aged ranges, and Illinois employment declines, as did some of the nearby communities.
• B-N decline in employment during the summer months of 2016 matched 2015, due to the universities.• However, labor force decline was greater this summer than last summer with a drop in June.
Labor Participation

BN Existing Home Sales and Value: 2015 vs 2016 YTD > increase of 6% in number of existing-homes, value steady
Homes Sold Value
Source: Bloomington-Normal Association of Realtors® (BNAR)
Jan Feb Mar Apr May Jun Jul Aug0
50
100
150
200
250
300
350
400
100
128
199223
262
340
286
254
136
106
206
262
299
329
292
261
2015 2016
Jan Feb Mar Apr May Jun Jul Aug$0
$10,000,000
$20,000,000
$30,000,000
$40,000,000
$50,000,000
$60,000,000
$70,000,000
2015 2016

BN New Home Sales: 2015 vs 2016 YTD > 3% increase in value for new homes, appx equal in number
Homes Sold Value
Illinois Department of Revenue
Jan Feb Mar Apr May Jun Jul Aug0
5
10
15
20
25
30
7
10
22
26
1415
1312
3
12
1516
14
22
20
14
2015 2016
Jan Feb Mar Apr May Jun Jul Aug$0
$1,000,000
$2,000,000
$3,000,000
$4,000,000
$5,000,000
$6,000,000
$7,000,000
$8,000,000
2015 2016

Illinois Department of Revenue
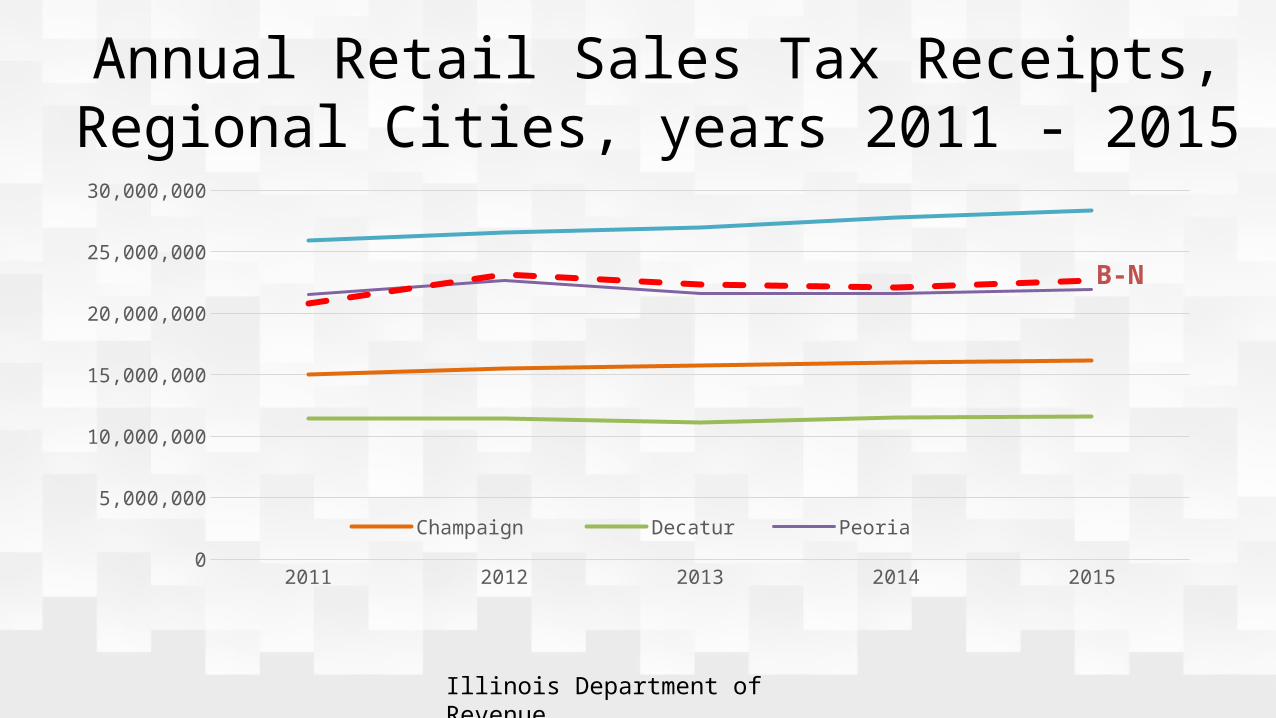
$22.6 M
$22.1 M
$22.3 M
$23.1 M
$20.8 M
Illinois Department of Revenue
Annual Retail Sales Tax Receipts,Regional Cities, years 2011 - 2015
2011 2012 2013 2014 20150
5,000,000
10,000,000
15,000,000
20,000,000
25,000,000
30,000,000
Champaign Decatur Peoria Springfield
B-N

Jobs by Industry 2011-2016
Source: U.S. Bureau of Labor Statistics
Mining and Constr
uction
Manufac
turin
g
Transporta
tion, Ware
housing a
nd Utilities
Retail Tr
ade
Informati
on
Finan
cial A
ctiviti
es
Professional a
nd Business
Servi
ces
Educati
onal and Healt
h Servi
ces
Leisure an
d Hospitality
Other Servi
ces
Government
0
5,000
10,000
15,000
20,000
25,000
2011 2012 2013 2014 2015 2016

“Areas of stability, some growth, but some declines”
Unemployment rate declineB-N unemployment rate declined to 5.2 percent by July, which is less than the IL state average of 5.6 percent. This was also a full percentage point less than the most near-term peak of 6.5% of last January..
Labor Force and Employment decline
Drop in Labor Force over the summer and drop in Employment numbers are a concern. Numbers for final quarter of 2016 will be important.
Retail Sales -- Stable but not growingRecovery in housing market reflect state trends Retail sales have been flat or slightly
declining for 2012 through 2015, led by declines for Bloomington. However, Peoria has had similar declines and Decatur has been flat.
3.2% increase in the avg price of new homes and a 6% increase in existing-home sales at a price equal to last year’s.
Not indicating true ‘recovery’ but housing market rebound is a positive sign, Retail
Sales are stable, and Labor force continues decline.

Thank you!