Embed Size (px)
Citation preview

September 20, 2017
September 20, 2017
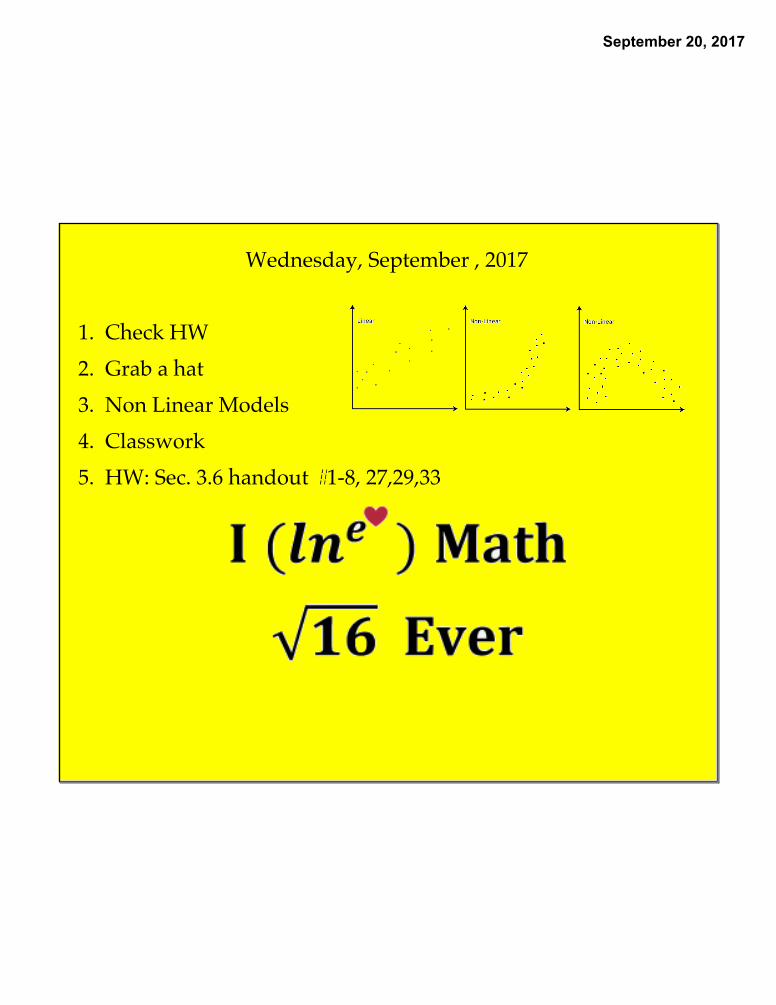
Wednesday, September , 2017
1. Check HW2. Grab a hat3. Non Linear Models4. Classwork5. HW: Sec. 3.6 handout #1-8, 27,29,33

September 20, 2017
You will receive a document titled 10_1nonlinear regression data.For each set of data, add a new page and select a Data and Statistics Page.
Create a scatterplot.
Based on the graphical pattern of the data choose the regression equation of best fit.
Check r or r2 to determine if it is the best fit. Is there another model that is better?

September 20, 2017

September 20, 2017

September 20, 2017

September 20, 2017

September 20, 2017

September 20, 2017

September 20, 2017

September 20, 2017

September 20, 2017

September 20, 2017

September 20, 2017


![ROTAX MAX - CZ - 2017 CZ-2017.pdf · hw ]ryp nrohþnr ]xe $ (' hw ]ryp nrohþnr ]xe $ âurxe 0 [ ',1 xwdkrydft prphqw 10 hw ]ryp nrohþnr ]xe $ hw ]ryp nrohþnr ]xe $ 3 torånd 0dwlfh](https://img.pdfslide.net/doc/110x75/5ec3ce4accd7ff46906c3733/rotax-max-cz-cz-2017pdf-hw-ryp-nrohnr-xe-hw-ryp-nrohnr-xe-.jpg)