Embed Size (px)
Citation preview
ACIPE RESEARCH September 2013 No 1
EUROPE 2020 A new ACIPE periodic review of the EU's
growth strategy
2
The Athens Centre for International Political Economy (ACIPE) was launched in 2010, and is part of the Institute of International Relations (IDIS) of Panteion University in Greece. The Centre focuses on the study of actors, structures, processes and dynamics that influence the transformation of the global political economy.
PUBLISHER
Athens Centre For International Political Economy (ACIPE)
PROJECT DIRECTOR & EDITOR
Dr Yorgos Stassinopoulos Assistant Professor
Department of International, European and Area Studies Panteion University
ACIPE TRAINEE RESEARCHERS
Christiana Aposkiti Margarita Eliopoulou
Calliope Ioannidou Esli Jahja
Konstantinos Kaitsas Christos Ninis
Artemis Pantazatou
For more information on this Report, please contact the project director,
Dr Yorgos Stassinopoulos
How to cite this report:
Yorgos Stassinopoulos (ed.), Europe 2020: A Review of the EU's Growth Strategy,
Athens: ACIPE, 2013.
The views expressed here are those of the authors and do not
necessarily reflect those of the ACIPE.
Copyright © 2013 Yorgos Stassinopoulos, ACIPE
3
Europe 2020: A Review of the EU's Growth Strategy
Contents Europe 2020: An Untimely Assessment of the European Union's Growth Agenda…….4
Yorgos Stassinopoulos
The European Employment Strategy in the Context of Europe 2020 Agenda…………….9
Christos Ninis
Progress towards the EU and national R&D intensity targets………………………………….16
Artemis Pantazatou & Margarita Eliopoulou
Progress towards environmental sustainability and climate policy objectives………..25 Esli Jahja
Education……………………………………………………………………………………………………………….34
Christiana Aposkiti & Calliope Ioannidou
Poverty and Social Exclusion…………………………………………………………………………………..42
Konstantinos Kaitsas
4
Europe 2020: An Untimely Assessment of the European Union's Growth Agenda
Yorgos Stassinopoulos
As the European integration has being further deepened, the European Com-
mission and the leaderships of the European Union (EU) countries have been pleased
to set grandiose politico-economic landmarks. From the “Agenda 2000: For a stronger
and wider Union” in 1990s, aimed at the reinforcement of its policies and the acces-
sion of new members, to the “Lisbon Strategy” in 2000s, by which nothing less than
setting the EU to become the most dynamic and competitive knowledge-based econ-
omy in the world, and in the present decade with the “Agenda 2020”, EU is struggling
to cut the Gordian knot, that is seeking the proper policies which would strengthen its
political and economic power and attain a prominent role in the highly globalized envi-
ronment of the 21st century, retaining the social cohesion and high-level of its living
standards, along with the economic convergence among its member-states. These are
highly ambitious targets, since during the last 30 years the European Union economic
power declines steadily and other global players (such as China and India) have em-
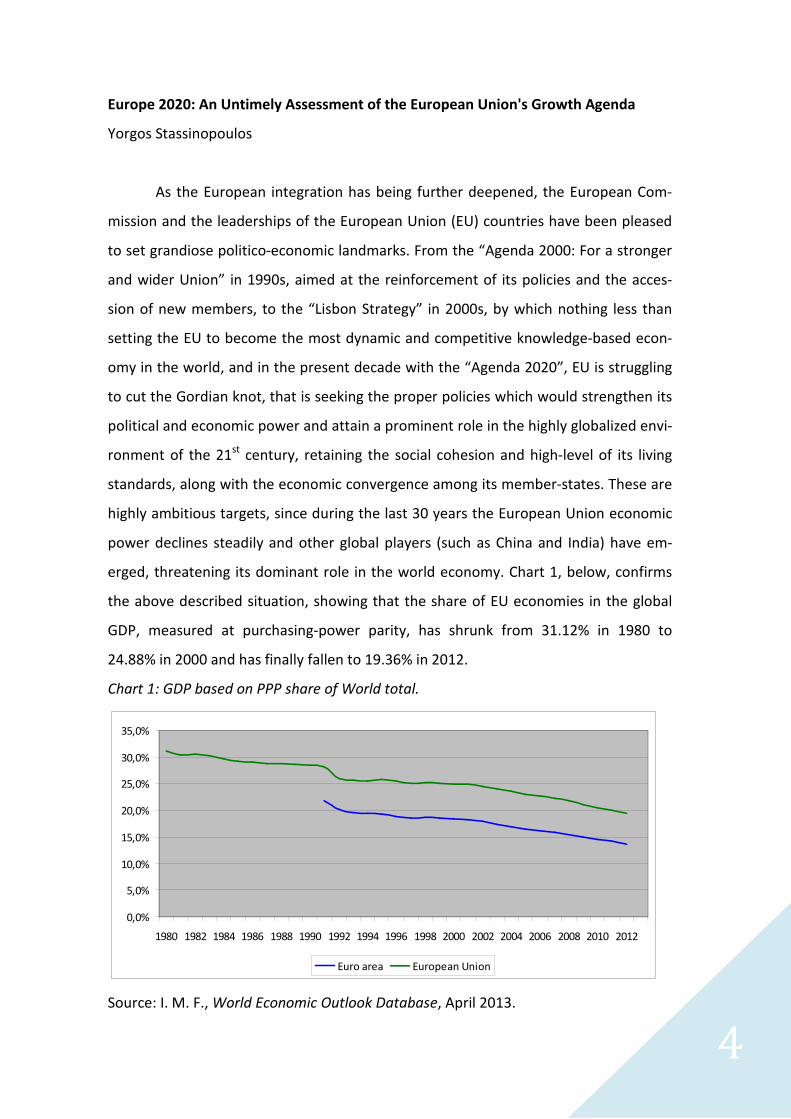
erged, threatening its dominant role in the world economy. Chart 1, below, confirms
the above described situation, showing that the share of EU economies in the global
GDP, measured at purchasing-power parity, has shrunk from 31.12% in 1980 to
24.88% in 2000 and has finally fallen to 19.36% in 2012.
Chart 1: GDP based on PPP share of World total.
0,0%
5,0%
10,0%
15,0%
20,0%
25,0%
30,0%
35,0%
1980 1982 1984 1986 1988 1990 1992 1994 1996 1998 2000 2002 2004 2006 2008 2010 2012
Euro area European Union
Source: I. M. F., World Economic Outlook Database, April 2013.
5
The above figures raised questions over the ability of the European Union to
catch-up with the rapid changes that have taken place after globalisation has prevailed
and, of course, brought up serious scepticism about the overall growth strategy that
has been set by the first decade of the 21st century,1 since the present EU's approach
is an extension and update of the Lisbon Strategy agenda which proved to be a rather
disappointing experience, despite its detailed and well-organised structure, which
composed of hundred of measures, and a sounded financial support. The appeals for a
stronger governance framework and stronger political leadership fail to notice, as has
been rightly pointed out, that a "closer co-ordination of national economic policies do
not automatically resolve the problem of who actually sets the priorities for the euro-
zone (and the EU as a whole), and how".2
We are not engaged here with these major issues. Our goal is far modest and
less far-sighted. What we are trying to do here is to present and moderately assess the
implementation of the Europe 2020 agenda, refraining from normative instructions
and cutting-edge proposals. Our target is to appreciate the challenges the European
economies are facing right now and to identify the measures and the policies that
have so far been implemented for a different type of growth that is smarter, more sus-
tainable and more inclusive. However, one has to bear in mind that the present situa-
tion is far more complicated and uncertain than in the 2000s and the 2007 financial
crisis has set certain hurdles towards these goals.3 The growth strategy that was set
forth by the European Council in June 2010 has to overcome not only the high hurdles
of the financial and sovereign debt crises in Europe, but the austerity policies as well,
that have been inflicted across EU member-states. The macro-economic policy-mix
that so-far has been imposed on many European governments by the Stability and
Growth Pact and the painful bail-out schemes for the southern European countries
have questioned the ability of this policy-mix to fulfil the goals set in the Agenda 2020,
but also for the capacity of European governance to come to grips with the major im-
1 An overall assessment of the Lisbon Strategy is provided by K. Featherstone and D. Papadimitriou,
eds., The EU's Lisbon Strategy: Evaluating Success, Understanding Failure. London: Palgrave, 2012. 2 L. Tsoukalis, "The JCMS Annual Review Lecture: The Shattering of Illusions – And What Next?", Journal
of Common Market Studies, 49 (2011): 19-44. The quotation is from p. 29. 3 See the special issue of the Greek Political Science Review, 39 (2012), which analyses the politics and
challenges of the eurozone crisis.
6
balances within the EU.4 Moreover, the present financial difficulties faced by many
European governments, including major economies such as France and Italy, have se-
riously jeopardized the convergence procedure in the EU and have raised serious
doubts about the financial viability of the welfare state and the deterioration of the
social indicators in the European continent.5 The inclusive arm of the agenda has so far
been shaken by an increasing unsustainable distribution of income,6 which "erode so-
cial security [... and] may destroy one of the great social achievements of industrialized
countries—their capacity to guarantee a reasonable income to all citizens hit by unfa-
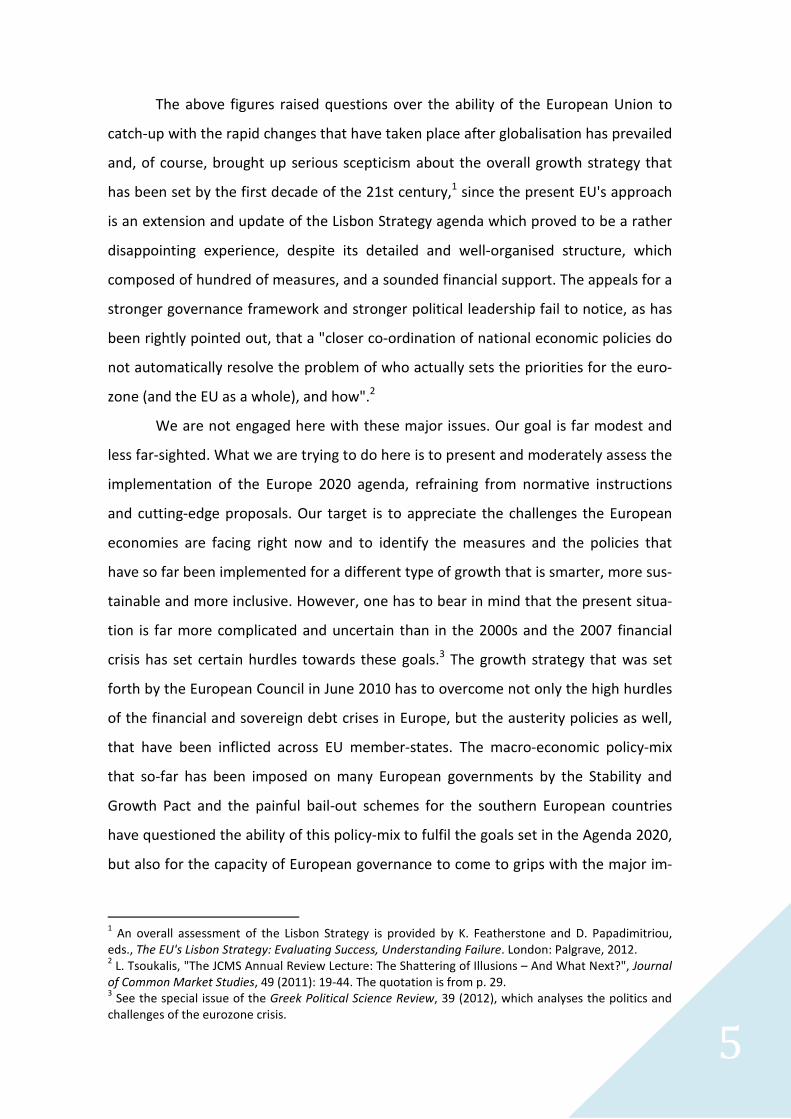
vourable conditions”.7 The dramatic decline of the private and public investments and
of the rate of employment (see chart 2, below), especially among the youth, has unfa-
vourable effects on the development prospects, since a growing part of European so-
cieties is pushing out of the labour market, which in turn retains consumption and en-
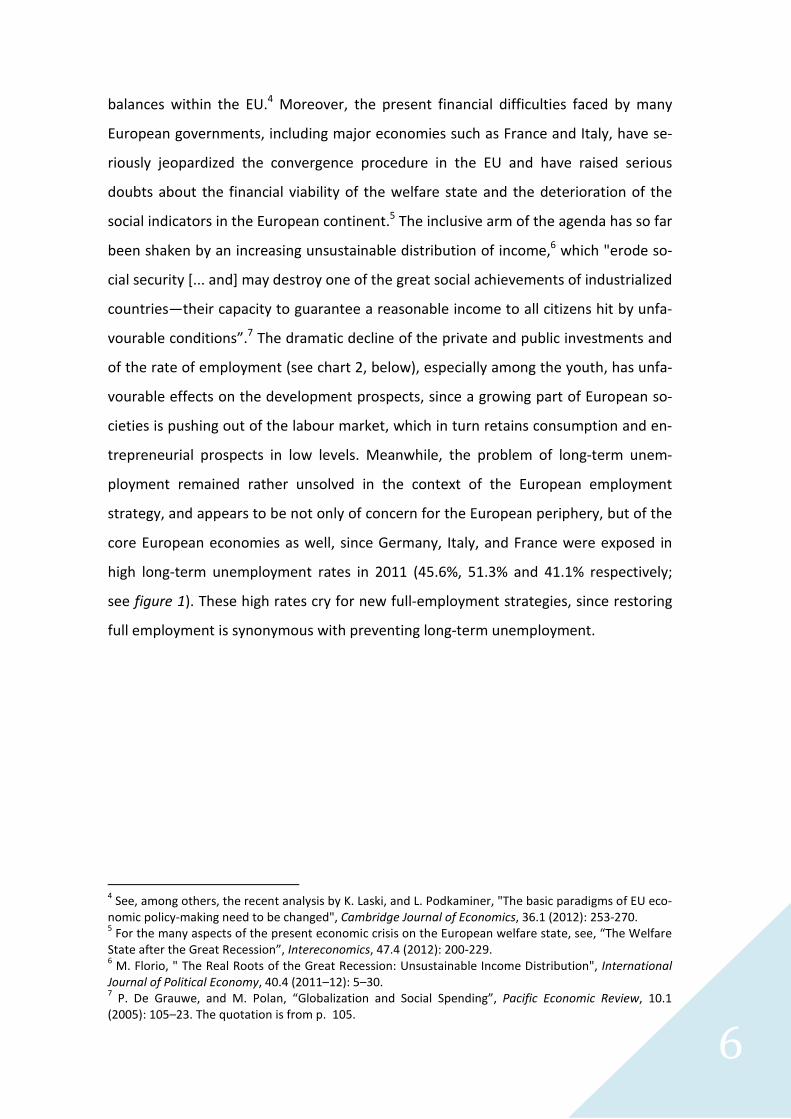
trepreneurial prospects in low levels. Meanwhile, the problem of long-term unem-
ployment remained rather unsolved in the context of the European employment
strategy, and appears to be not only of concern for the European periphery, but of the
core European economies as well, since Germany, Italy, and France were exposed in
high long-term unemployment rates in 2011 (45.6%, 51.3% and 41.1% respectively;
see figure 1). These high rates cry for new full-employment strategies, since restoring
full employment is synonymous with preventing long-term unemployment.
4 See, among others, the recent analysis by K. Laski, and L. Podkaminer, "The basic paradigms of EU eco-
nomic policy-making need to be changed", Cambridge Journal of Economics, 36.1 (2012): 253-270. 5 For the many aspects of the present economic crisis on the European welfare state, see, “The Welfare
State after the Great Recession”, Intereconomics, 47.4 (2012): 200-229. 6 M. Florio, " The Real Roots of the Great Recession: Unsustainable Income Distribution", International
Journal of Political Economy, 40.4 (2011–12): 5–30. 7 P. De Grauwe, and M. Polan, “Globalization and Social Spending”, Pacific Economic Review, 10.1
(2005): 105–23. The quotation is from p. 105.
7
Chart 2: Unemployment rate, % of total labour.
2,00
4,00
6,00
8,00
10,00
12,00
2000 2001 2002 2003 2004 2005 2006 2007 2008 2009 2010 2011 2012
Japan United States Euro area
Source: I. M. F., World Economic Outlook Database, April 2013.
Figure 1: Long Term Unemployment as a % of the unemployment rate by country (an-
nual averages)
These preliminary remarks served as the background for the following report
prepared by young researchers of the Institute of International Studies (IDIS), an effort
towards a responsible and serious dialogue between academia and society which
hopes to serve as a forum for the comprehension and de-mystification of the major
changes taking place in Europe and elsewhere. The present report aims also to alarm
the Greek authorities for the big challenges which are lying ahead and to remind them
that our country has to participate more actively in the European procedures, supply-
ing not only problems but occasionally solutions to the grand project of the European
8
integration. The report follows the priorities and targets set in the Europe 2020 ag-
enda, which is employment, research and development, climate change and energy
sustainability, education, poverty and social exclusion, and records the so-far progress
in each and every one of these areas. This approach is not only dictated by formal rea-
sons; our aim is also to emphasise the implication of the Agenda that the economic
growth is not only confined to fiscal and financial indices but requires the inclusion of
societal, environmental and cultural elements and the building of the (formal and in-
formal) institutions that warrant that this path is not only sustainable, but also widely
acceptable by the European people.
9
1. The European Employment Strategy in the context of Europe 2020 Agenda
Christos Ninis
1.1 Overall Performance
The European Employment Strategy has a rather long history. It was in the
early 1990s that the EU authorities designed and implemented a fresh governance
method in the field of employment, as a subsidiary process of the Economic and Mon-
etary Union of convergence, towards higher employment and lower unemployment. It
is not a coincidence that this strategy was introduced and materialised in a period of
high unemployment rates and budget austerity, such as the present conditions in the
EU,8 and aimed at removing the so-called "structural rigidities" which prevailed in the
labour markets across Europe. The slight convergence in employment rate during the
2000s was seriously jeopardised by the recession burst in 2008. In order to reverse this
gloomy situation and to broaden the job opportunities and prospects, especially for
the young people and women, the EU authorities have incorporated certain policies in
the Agenda Europe 2020 which aim at expanding the employment rate at 75% by
2020.
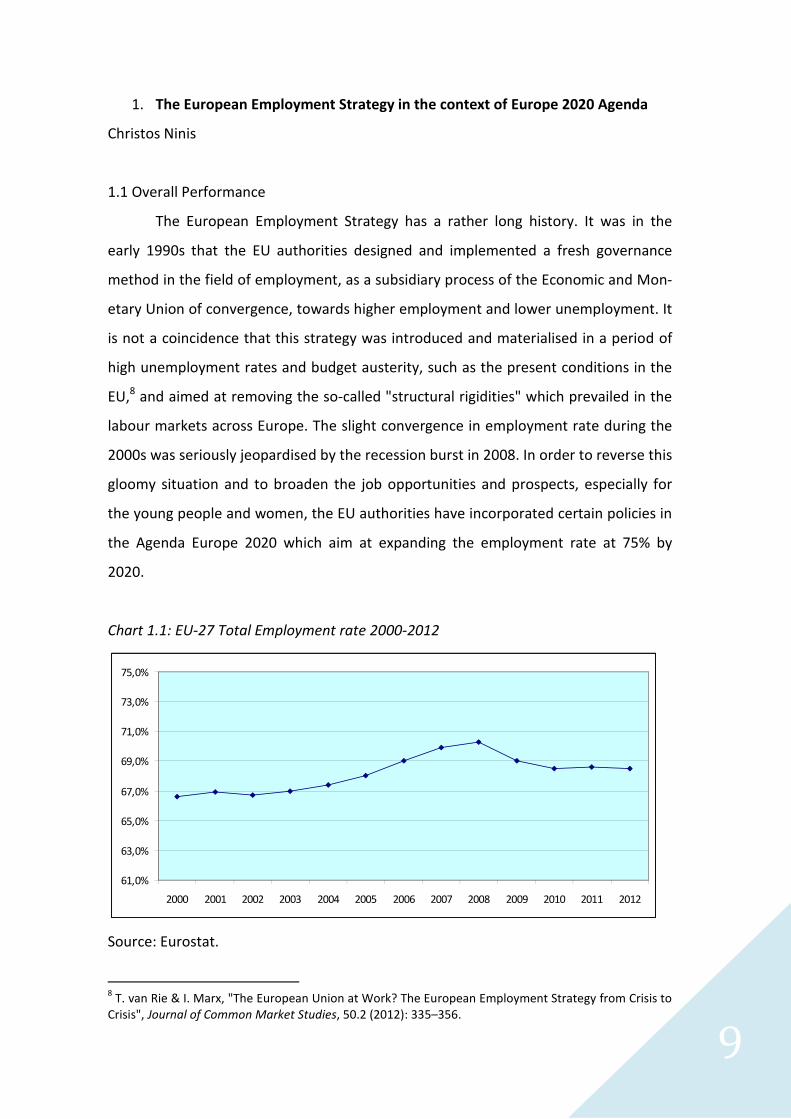
Chart 1.1: EU-27 Total Employment rate 2000-2012
61,0%
63,0%
65,0%
67,0%
69,0%
71,0%
73,0%
75,0%
2000 2001 2002 2003 2004 2005 2006 2007 2008 2009 2010 2011 2012
Source: Eurostat.
8 T. van Rie & I. Marx, "The European Union at Work? The European Employment Strategy from Crisis to
Crisis", Journal of Common Market Studies, 50.2 (2012): 335–356.
10
The results so-far are not very encouraging. In 2012, the percentage of Europe-
ans currently having a job is at 68.5%, i.e. the employment has fallen back to the 2005
rate (Chart 1.1). European economies at the moment perform, on one hand, under the
aftereffects of the big recession that global economies experienced due to the 2007
financial crisis while on the other hand, some EU Member States face fiscal problems
of significant importance, under the burden of supporting challenged economies. The
uncertainty that prevails on the European economies as a whole and the austerity
programmes that are on track have had a great impact on the employment sector so
far and created serious impediments for the European governments in achieving the
goals set in the Europe 2020 Agenda. An overall depiction of the present situation
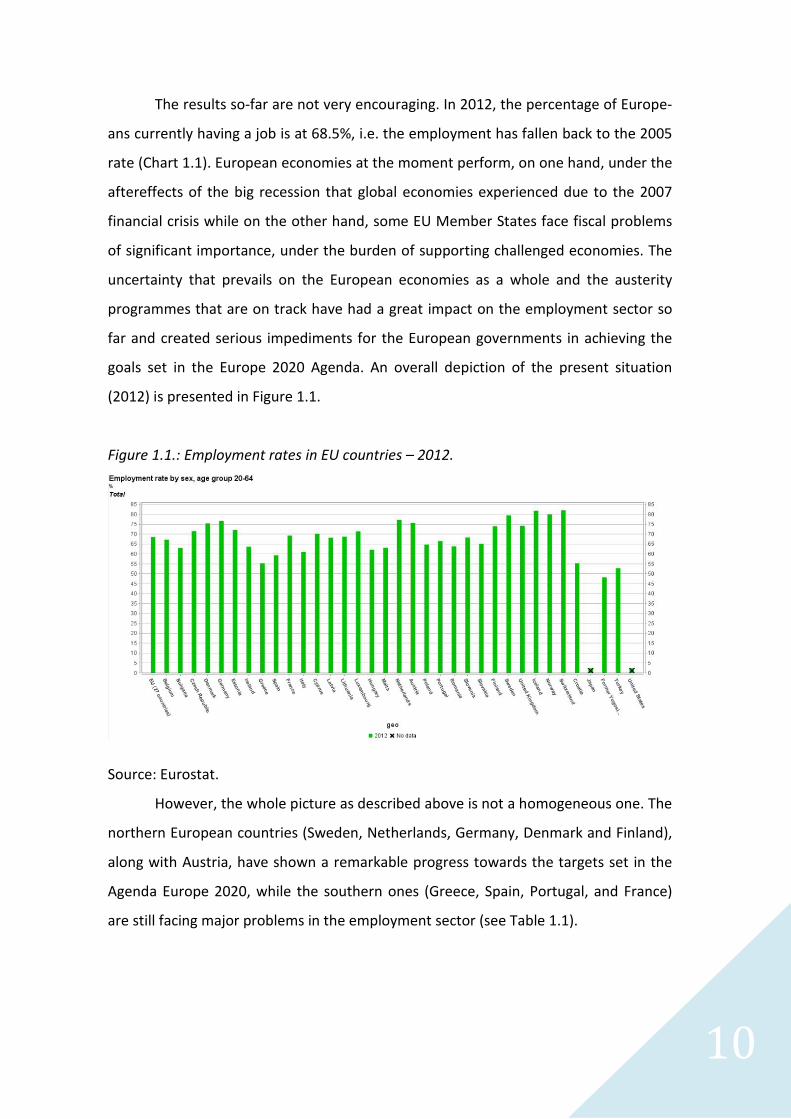
(2012) is presented in Figure 1.1.
Figure 1.1.: Employment rates in EU countries – 2012.
Source: Eurostat.
However, the whole picture as described above is not a homogeneous one. The
northern European countries (Sweden, Netherlands, Germany, Denmark and Finland),
along with Austria, have shown a remarkable progress towards the targets set in the
Agenda Europe 2020, while the southern ones (Greece, Spain, Portugal, and France)
are still facing major problems in the employment sector (see Table 1.1).
11
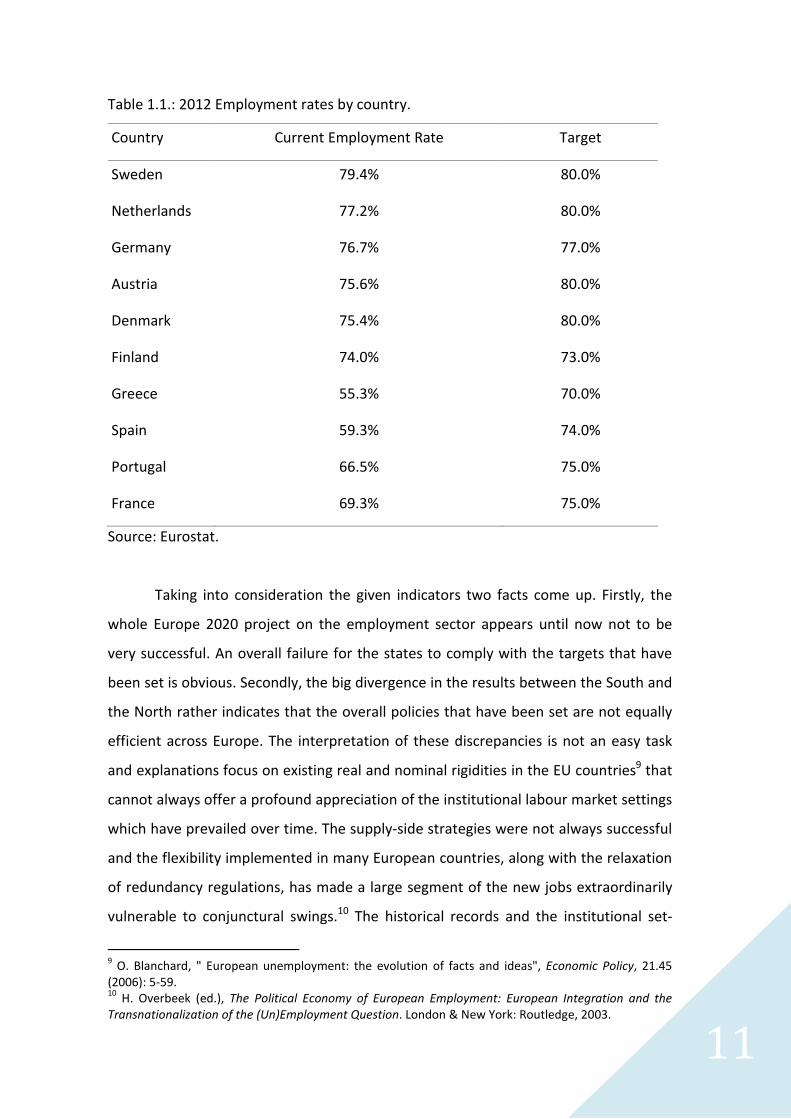
Table 1.1.: 2012 Employment rates by country.
Country Current Employment Rate Target
Sweden 79.4% 80.0%
Netherlands 77.2% 80.0%
Germany 76.7% 77.0%
Austria 75.6% 80.0%
Denmark 75.4% 80.0%
Finland 74.0% 73.0%
Greece 55.3% 70.0%
Spain 59.3% 74.0%
Portugal 66.5% 75.0%
France 69.3% 75.0%
Source: Eurostat.
Taking into consideration the given indicators two facts come up. Firstly, the
whole Europe 2020 project on the employment sector appears until now not to be
very successful. An overall failure for the states to comply with the targets that have
been set is obvious. Secondly, the big divergence in the results between the South and
the North rather indicates that the overall policies that have been set are not equally
efficient across Europe. The interpretation of these discrepancies is not an easy task
and explanations focus on existing real and nominal rigidities in the EU countries9 that
cannot always offer a profound appreciation of the institutional labour market settings
which have prevailed over time. The supply-side strategies were not always successful
and the flexibility implemented in many European countries, along with the relaxation
of redundancy regulations, has made a large segment of the new jobs extraordinarily
vulnerable to conjunctural swings.10 The historical records and the institutional set-
9 O. Blanchard, " European unemployment: the evolution of facts and ideas", Economic Policy, 21.45
(2006): 5-59. 10
H. Overbeek (ed.), The Political Economy of European Employment: European Integration and the Transnationalization of the (Un)Employment Question. London & New York: Routledge, 2003.
12
tings have played a major role for the adjustment of national labour markets to the
challenges created by the globalisation process, while the overall growth and macro-
economic performance have played a vital role for the sustenance of high employment
rates in the northern European countries, compared to the rather poor results
achieved by the Mediterranean countries. It is a truism that the northern countries,
which in general perform better, belong to a different model of capitalism than the
southern ones. The continental model of capitalism, unlike the Mediterranean one,
favours the northern countries in implementing faster and in a more efficient way the
required reforms because of their historical origins and social structures. Countries
that belong to the Scandinavian model of capitalism seem to perform great as well.
However, this truism has an interesting implication: globalization is not a process of
homogenization and employment policies only have a chance of survival if they con-
form not to general principles of labour market liberalization but respect and take in
account the complex processes of interaction between domestic processes and factors
and international factors and processes.
1.2. Impact of the current crisis on the implementation of the project
The 2008 financial crisis has had a negative impact on the European econo-
mies, mainly in the banking sector. The financial crisis was followed soon after by a
sovereign debt crisis in the southern European countries and in Ireland, which in turn
has had a severe effect on employment rates, since the contraction of demand in
these countries has negatively effected production across the EU.
In 2008, the employment rate was 70.3%, while in 2009 it dropped to 69%. The
employment rate for 2010 and 2011 stopped at 68.6% while in 2012 at 68.5%. The ad-
verse economic climate and the recession made employment rates drop down.
The countries that were mostly affected by the fiscal crisis are Greece and
Spain. Greece's employment rate before the crisis was at 64%, and one year after the
crisis it was formed at 59,9%; the picture in Spain is similar, since the employment rate
further lowered, from 62.5% in 2010 to 61.6% in 2011, and 59.3% in 2012.11 In order to
11
All the data and indicators used here are those of Eurostat.
13
deal with these dismal figures, the European Commission encourages labour mobility
within Europe, which, it is believed, would help the EMU function better and absorb
asymmetric shocks between depressed and well-off regions of the Union.12 In addition,
the Social Investment package, which the European Commission put forward on the
20th February 2013, urges the EU Member States, within existing budgetary con-
straints, to shift their focus towards investing in human capital and social cohesion in
order to support the development of social investment policies, sharing of best prac-
tices, capacity-building, and testing of social innovations, with the aim to scale-up the
most successful.13
The results so far are not very encouraging, at least for the European periphery
plagued with high unemployment rates, discrimination against non-EU immigrants and
social dumping phenomena that seriously jeopardise a genuine European labour mar-
ket. These trends are more obvious in the European periphery where the record of
strong social institutions is not marked.
1.3 Greece and European Employment Strategy
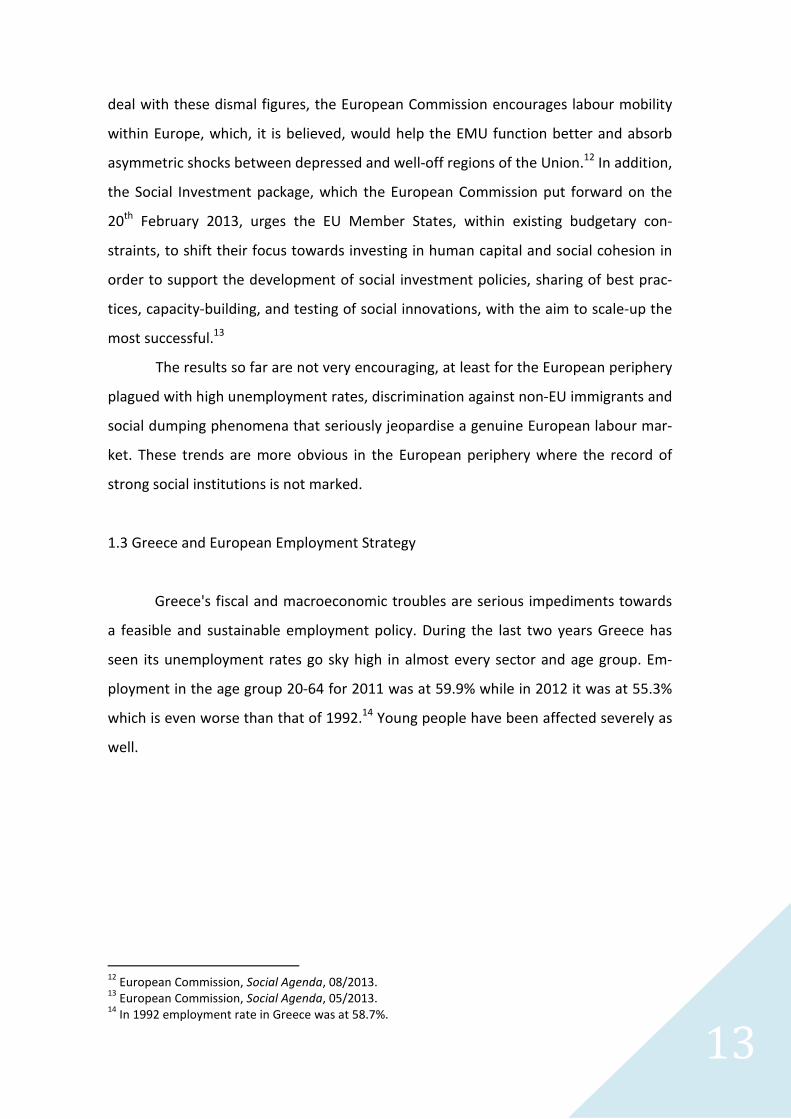
Greece's fiscal and macroeconomic troubles are serious impediments towards
a feasible and sustainable employment policy. During the last two years Greece has
seen its unemployment rates go sky high in almost every sector and age group. Em-
ployment in the age group 20-64 for 2011 was at 59.9% while in 2012 it was at 55.3%
which is even worse than that of 1992.14 Young people have been affected severely as
well.
12
European Commission, Social Agenda, 08/2013. 13
European Commission, Social Agenda, 05/2013. 14
In 1992 employment rate in Greece was at 58.7%.
14
In order to tackle these major problems Greece is currently under a national re-
form programme in the labour market.15 The top priorities of this programme are the
reduction of the labour cost and the facilitation of employment access, control over
undeclared work, introduction of more flexible forms of employment, collective bar-
gaining flexibility, along with the revision in private employment services, by simplify-
ing and revising the existent legal framework governing the establishment and admin-
istrative costs of private employment services. Through these policies the Greek au-
thorities are trying to prevent the escalation of unemployment rather than to create
new jobs, since the macroeconomic situation has not yet stabilised and the confidence
rates among entrepreneurs are still very low. However, the employment policies that
have been adopted are considered to be a long-run strategy which will bring the much
needed labour market flexibility and facilitate employment access for those currently
not holding a working position.
Although that policy has given some positive results until now according to the
Greek government's opinion,16 it is obvious that there still remains a lot to be done. A
new and more intelligent strategy should be adopted which will indirectly boost the
labour market, while new productive activities should emerge in order to sustain the
15
Hellenic National Reform Programme 2012-2015. 16
Hellenic National Reform Programme 2012-2015, p. 29
15
local labour force and strengthen the weak social links among different social strata.
That could be achieved by putting emphasis not only on deregulation and labour mar-
ket flexibility, but also on social justice and consensus on the distribution of income
along with setting mechanisms on wages and prices, compatible with sound fiscal and
monetary policies.
1.4 Some tentative conclusions
It is evident from the data that the European Union's Member States today perform
under the following circumstances:17
1. Under the burden of a constantly worsening employment situation and
2. Under their efforts to completely transform their labour markets
Given the fact that recession in Europe is deep and the fiscal problems some
Member States face affect the other Members of the Union as well, while they have
taken the initiative of supporting them, the fulfilment of the targets becomes less fea-
sible. Major challenges the European Union has to deal with are the reduction of long-
term unemployment and high youth unemployment18 rates. Moreover, the European
Union has to modernise employment legislation, bridge the gap between wages and
productivity and reduce tax burden on employment. The implementation of active la-
bour market policies, promotion of larger working lives by rising the effective retire-
ment age and implementing active ageing strategies and creation of specific policies
towards new working fields, such as eco-industry, are considered to be of significant
importance.
17
According to the Joint Employment Report 18
Citizens' summary, EU Commission proposes Youth Employment Package
16
2. Progress towards the EU and national R&D intensity targets
Artemis Pantazatou & Margarita Eliopoulou
Although Europe is one of the most educated societies, it still notes a signifi-
cant shortfall in the research field.19 Within the Lisbon Treaty the development of re-
search and development (R&D) was decided in general, without specifying any particu-
lar clear direction. One of the four goals of the Lisbon Strategy‘s revision20 was the es-
tablishment of investment knowledge and innovation.21
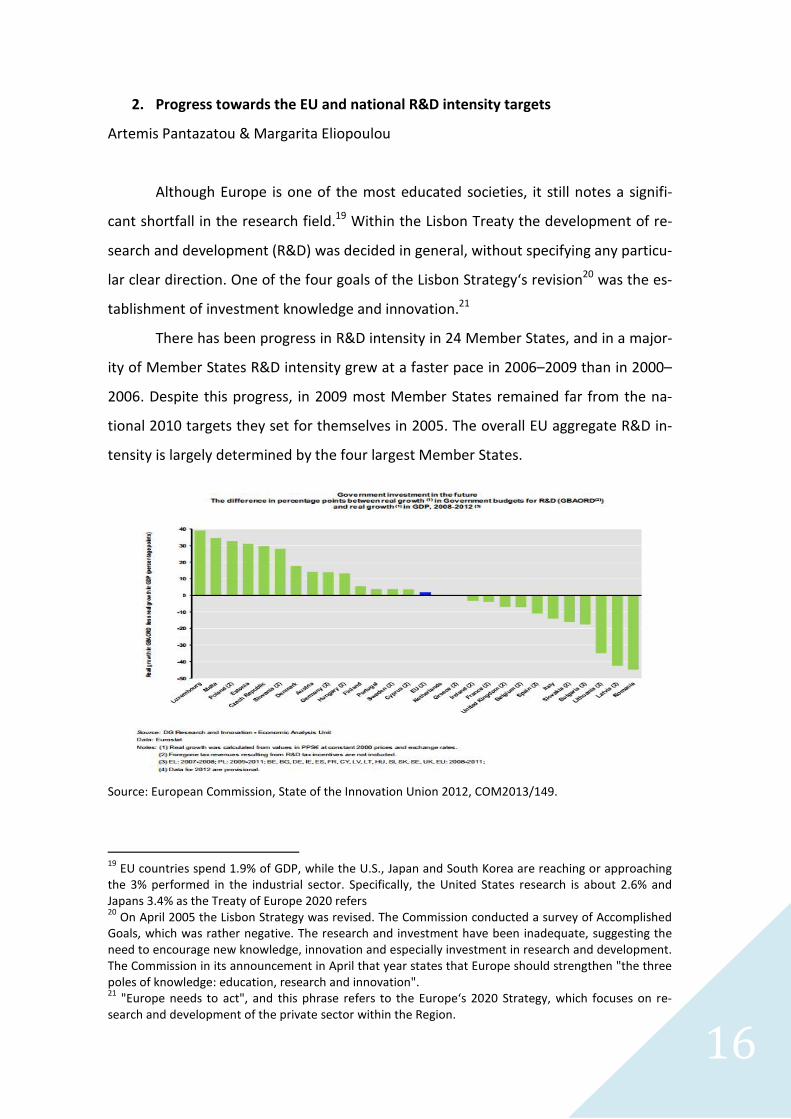
There has been progress in R&D intensity in 24 Member States, and in a major-
ity of Member States R&D intensity grew at a faster pace in 2006–2009 than in 2000–
2006. Despite this progress, in 2009 most Member States remained far from the na-
tional 2010 targets they set for themselves in 2005. The overall EU aggregate R&D in-
tensity is largely determined by the four largest Member States.
Source: European Commission, State of the Innovation Union 2012, COM2013/149.
19
EU countries spend 1.9% of GDP, while the U.S., Japan and South Korea are reaching or approaching the 3% performed in the industrial sector. Specifically, the United States research is about 2.6% and Japans 3.4% as the Treaty of Europe 2020 refers 20
On April 2005 the Lisbon Strategy was revised. The Commission conducted a survey of Accomplished Goals, which was rather negative. The research and investment have been inadequate, suggesting the need to encourage new knowledge, innovation and especially investment in research and development. The Commission in its announcement in April that year states that Europe should strengthen "the three poles of knowledge: education, research and innovation". 21
"Europe needs to act", and this phrase refers to the Europe‘s 2020 Strategy, which focuses on re-search and development of the private sector within the Region.
17
Investment in R&D is highly concentrated in some parts of the European Union.
Half of the total EU–27 R&D expenditure is located in approximately two regions, i.e.
one fifth of the regions in the EU. Conversely, half of all the regions contribute to only
6% of the total EU R&D expenditure.
Over the last years the European Union has made progress in order to meet
the R&D intensity target. The EU 3% target and further national targets have mobilised
increasing resources for R&D. The national 2020 R&D targets, set up by Member
States in 2010, are ambitious but achievable and would bring the EU R&D intensity to
2.7–2.8% of GDP in 2020, close to 3% in 2020.
There are considerable structural differences in R&D funding between Europe
and its main competitors. Policymakers in Europe have tried to overcome some of
these barriers that are thought to have hampered European research efforts, for ex-
ample, by addressing geographical, institutional, disciplinary and sectoral boundaries.
In order to empower European research efforts a European Research Area
(ERA) has been created,22 a unified research area open to the world based on the in-
ternal market, in which researchers, scientific knowledge and technology circulate
freely.23 Through ERA, the Union and its Member States will strengthen their scientific
and technological bases, their competitiveness and their capacity to collectively ad-
dress grand challenges.24
The free circulation of researchers, knowledge and technology across the ERA
is being introduced as the ‘fifth freedom’. Smart, sustainable and inclusive growth is
going to be the result of attractive conditions for carrying out research and investing in
R&D intensive sectors; Europe-wide scientific competition, along with cooperation and
coordination. The 2020 vision for the ERA is part of the wider picture of Europe’s 2020
strategy for.
22
http://ec.europa.eu/research/era/index_en.htm 23
The European Research Area (ERA) contains 7 key points according to the European Commission, which are : Resources and facilities optimized at European level, Coherent use of public instruments and resources, Dynamic private investment, A common system for improving the scientific and technical policies, More adequate human resources and greater mobility, A dynamic European landscape, open and attractive to researchers and investment, Shared values 24
The Competitiveness Council adopted a 2020 vision for the ERA http://www.consilium.europa.eu/ueDocs/cms_Data/docs/pressData/en/intm/104434.pdf
18
Member States should introduce or enhance competitive funding through calls
for proposals and institutional assessments as the main modes of allocating public
funds to research and innovation. Legislative reforms may be introduced, if necessary,
in order to ensure that all public bodies responsible for allocating research funds apply
the core principles of international peer review. The structural change in institutions
so as to raise their research quality to international levels of excellence will be a chal-
lenge.
Open national-level competition is crucial to deriving maximum value from
public money invested in research. The Commission supports mutual learning and the
exchange of good practice between Member States on the removal of national legal
and other barriers to ERA. Moreover, through the Smart Specialisation Platform it will
support Member States and regions in using Structural Funds to develop research ca-
pacity and smart specialisation strategies, including support to joint research pro-
grammes, in line with the Cohesion Policy objectives.
Joint Programming is aiming to enable transnational research and innovation
by exploiting synergies between national and international programmes and aligning
different sources of national funds at EU level.25 Differences between national funding
rules and selection processes are the main reasons for the low level of alignment.
Research organisations are expected to agree on common funding principles -
eligible costs, reporting requirements, etc. to make national research programmes
compatible, interoperable (cross-border) and simpler for researchers and try to use
synchronised calls, where possible, with single joint international peer review evalua-
tion of proposals as a basis for funding decisions.
The IU includes a commitment to complete or launch construction by 2015 of
60% of the ESFRI roadmap priority RIs of pan-European interest. This requires invest-
ment beyond the means of individual countries - pooling of regional, national and
European Union funds is thus necessary, particularly for ERIC RIs, including distributed
facilities requiring the participation of as many countries as possible with world class
national and regional capacity. Many new European RIs also benefit from international
partners or are the European branches of worldwide networks. It is crucial to ensure
25
Until the Treaty of Lisbon public expenditure scoring was 80% at a national level. This implies that research loses effectiveness when these research efforts do not form a coherent effort.
19
cost control and management of global projects. The group of twenty major econo-
mies (G20) is addressing these issues with the active participation of the Commission.
Member States need to confirm financial commitments for the construction
and operation of ESFRI, global, national and regional RIs of pan-European interest, par-
ticularly when developing national roadmaps and the next Structural Fund pro-
grammes and remove legal and other barriers to cross-border access to RIs.
Another fundamental aim is to work with ESFRI to set priorities for implement-
ing the Roadmap and to provide advice and guidance to Member States on overcom-
ing legal, financial or technical obstacles to implementation and define with ESFRI, e-
IRG and other stakeholders common evaluation principles, impact-assessment criteria
and monitoring tools which can be applied in regional, national and European pro-
grammes to help combine funds from different sources.
In November 2011 the European Commission presented Horizon 2020, an €
80,000 million programme for investment in research and innovation, implementing
the innovation union. Horizon 2020 focuses on turning scientific breakthroughs into
innovative goods and services that have the potential to provide business opportuni-
ties and change people’s lives for the better. Running from 2014 to 2020 this pro-
gramme is part of the EU’s drive to create new growth and jobs in Europe. Horizon
2020 is the financial instrument implementing the Innovation Union, a Europe 2020
flagship initiative aimed at securing Europe's global competitiveness. Running from
2014 to 2020 with an € 80 billion budget, the EU’s new programme for research and
innovation is part of the drive to create new growth and jobs in Europe.
Horizon 2020 provides major simplification through a single set of rules. It will
combine all research and innovation funding currently provided through the Frame-
work Programmes for Research and Technical Development, the innovation related
activities of the Competitiveness and Innovation Framework Programme (CIP) and the
European Institute of Innovation and Technology (EIT).
The proposed support for research and innovation under Horizon 2020 will
strengthen the EU’s position in science with a dedicated budget of € 24,598 million.
This will provide a boost to top-level research in Europe, including an increase in fund-
ing of 77% for the very successful European Research Council (ERC). Furthermore, it
will strengthen industrial leadership in innovation € 17,938 million. This includes major
20
investment in key technologies, greater access to capital and support for SMEs and it
will also provide € 31,748 million to help address major concerns shared by all Europe-
ans such as climate change, developing sustainable transport and mobility, making re-
newable energy more affordable, ensuring food safety and security, or coping with the
challenge of an ageing population.
Horizon 2020 will tackle societal challenges by helping bridge the gap between
research and the market by, for example, helping innovative enterprises develop their
technological breakthroughs into viable products with real commercial potential. This
market-driven approach will include creating partnerships with the private sector and
Member States bringing together the resources needed.
Horizon 2020 will be complemented by further measures to complete and fur-
ther develop the European Research Area by 2014. These measures will aim at break-
ing down barriers to create a genuine single market for knowledge, research and inno-
vation.
On the one hand, the scientific and technological development contributes to
economic growth and improves employment, competiveness, as well as many other
social problems. On the other hand, if research and innovation are individual efforts,
maximum efficiency can’t be achieved.
After the outbreak of the crisis, the EU is going through a transitional period. In
2008–2009, R&D expenditure was more resilient to the financial crisis than the overall
economic activity.26 As mentioned by the European Commission this fact reversed part
of the economic and social progress but at the same time revealed some of the most
important deficits in infrastructure. During this period, the EU has to accomplish the
established policy guidelines, working as a unit and overcoming the problems.
Altogether, the data shows that governments in the EU have considered R&D
as a priority in times of crisis. However, the result of the economic crisis might be a
further widening of the gap between Member States with high R&D intensities and
some Member States with lower R&D intensities, the latter having more difficulty in
avoiding cuts in R&D spending.
26
Due to a more rapid drop in GDP than in R&D expenditure, the net effect of the crisis has seen an in-crease in EU’s R&D intensity from 1.85 % of GDP in 2007 to 1.92 % in 2008 and 2.01 % in 2009. In 2009, nominal R&D budgets grew or were maintained in 17 Member States. In terms of execution, nominal R&D expenditure in the public sector grew by 1.8 % in the EU in 2009.
21
Even before the time of the crisis there were many areas that seemed to be in
delay within the EU compared to other regions. The European Commission states that
the average growth is significantly less than the principal economic partners, with the
productivity gap widening in recent decades. This problem seems be rooted mainly in
the structural basis, with lower levels of investment in research, development, innova-
tion, inefficient use of information and communication technologies, restrictions on
market accessibility and less favourable environment for businesses.
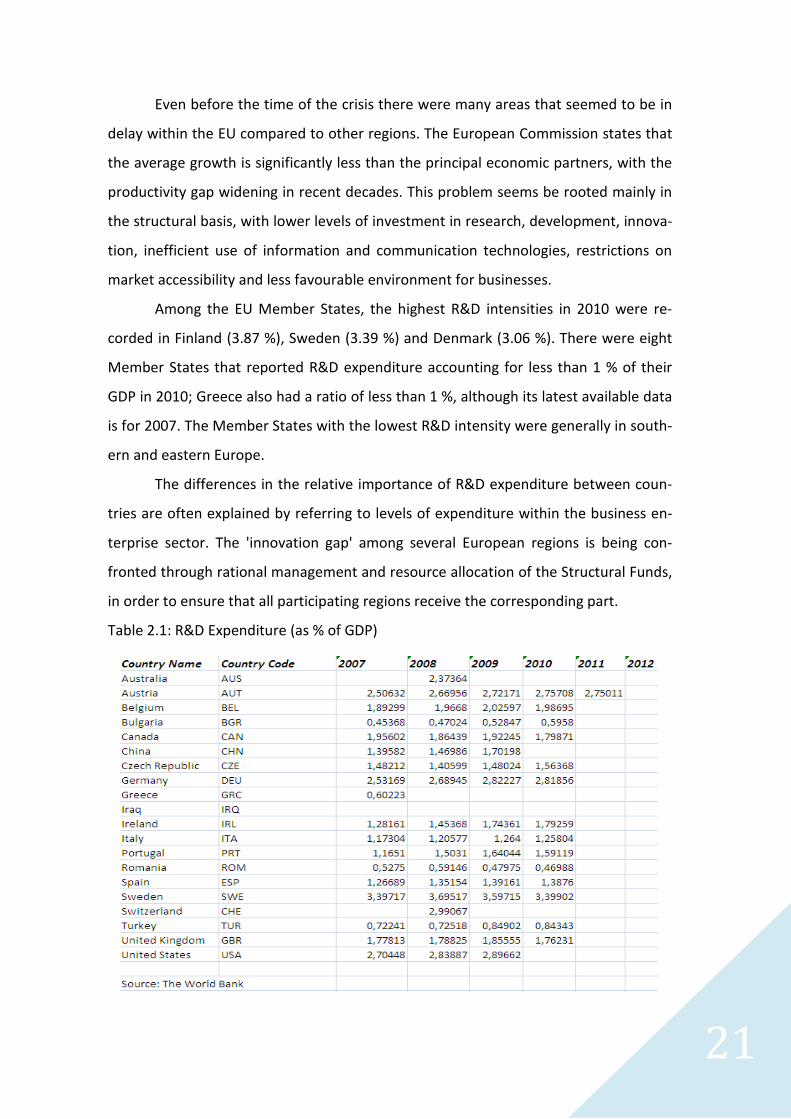
Among the EU Member States, the highest R&D intensities in 2010 were re-
corded in Finland (3.87 %), Sweden (3.39 %) and Denmark (3.06 %). There were eight
Member States that reported R&D expenditure accounting for less than 1 % of their
GDP in 2010; Greece also had a ratio of less than 1 %, although its latest available data
is for 2007. The Member States with the lowest R&D intensity were generally in south-
ern and eastern Europe.
The differences in the relative importance of R&D expenditure between coun-
tries are often explained by referring to levels of expenditure within the business en-
terprise sector. The 'innovation gap' among several European regions is being con-
fronted through rational management and resource allocation of the Structural Funds,
in order to ensure that all participating regions receive the corresponding part.
Table 2.1: R&D Expenditure (as % of GDP)
22
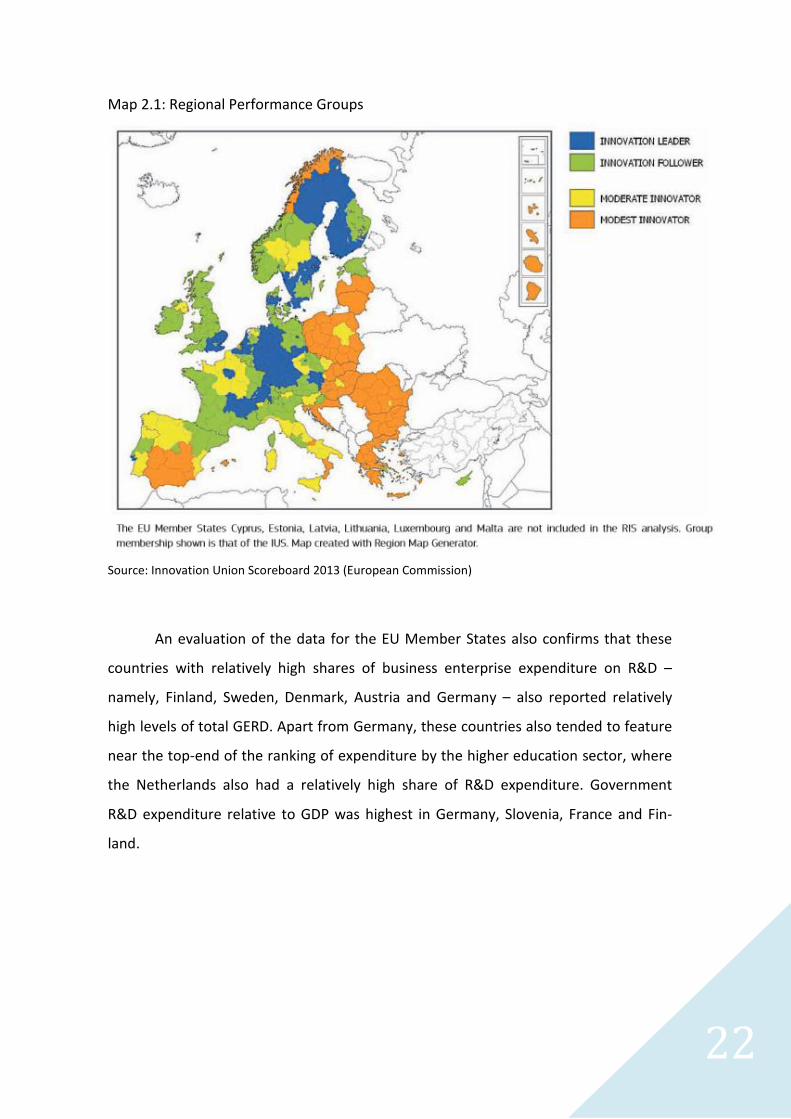
Map 2.1: Regional Performance Groups
Source: Innovation Union Scoreboard 2013 (European Commission)
An evaluation of the data for the EU Member States also confirms that these
countries with relatively high shares of business enterprise expenditure on R&D –
namely, Finland, Sweden, Denmark, Austria and Germany – also reported relatively
high levels of total GERD. Apart from Germany, these countries also tended to feature
near the top-end of the ranking of expenditure by the higher education sector, where
the Netherlands also had a relatively high share of R&D expenditure. Government
R&D expenditure relative to GDP was highest in Germany, Slovenia, France and Fin-
land.
23
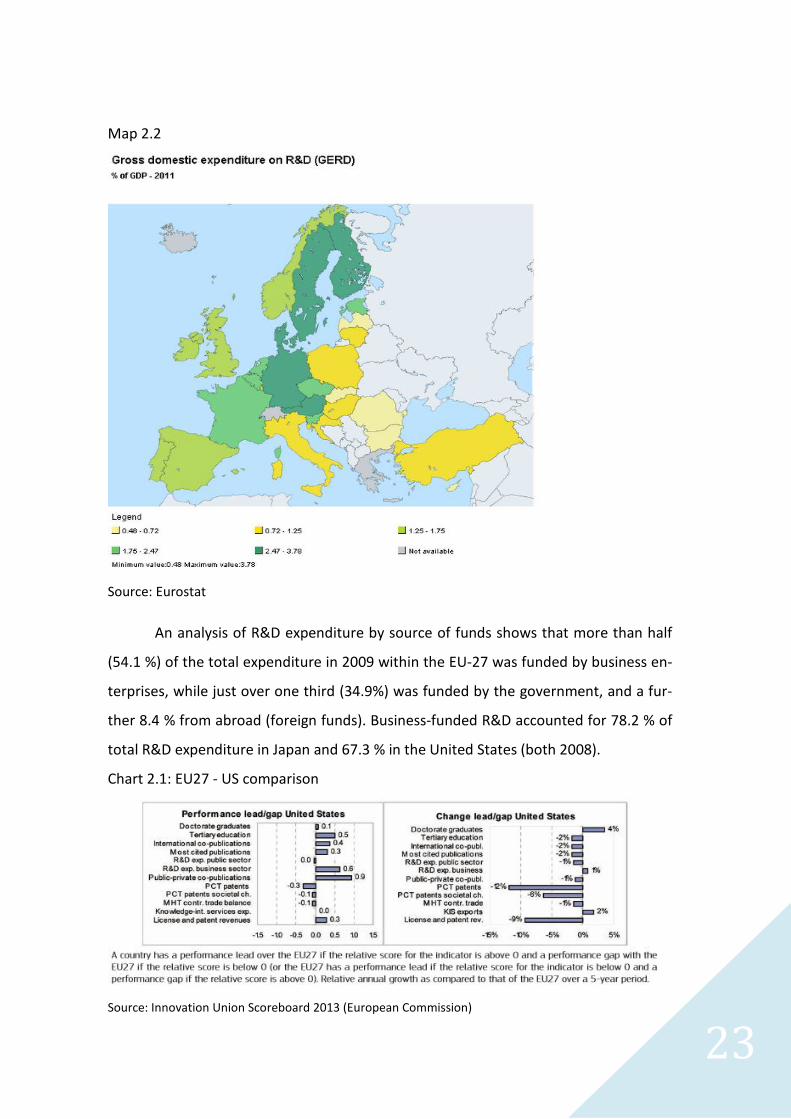
Map 2.2
Source: Eurostat
An analysis of R&D expenditure by source of funds shows that more than half
(54.1 %) of the total expenditure in 2009 within the EU-27 was funded by business en-
terprises, while just over one third (34.9%) was funded by the government, and a fur-
ther 8.4 % from abroad (foreign funds). Business-funded R&D accounted for 78.2 % of
total R&D expenditure in Japan and 67.3 % in the United States (both 2008).
Chart 2.1: EU27 - US comparison
Source: Innovation Union Scoreboard 2013 (European Commission)
24
Some countries have already made structural changes and have made R&D a
priority into their strategic plans, but few are the countries that have placed their pri-
ority in confronting with social challenges; key examples of such effort is Germany
with its high-technology, Spain with the new strategic plan and finally Slovakia with
the provision of state representation of the knowledge-based economy by establishing
two parts to study political measures for research and innovative development.
Taking into account the risk of widening the gap within the European region
and the delay in cooperation that was noted so far, the EU launched the European In-
novation Partnership, which will mobilize their organizations operating in a "cycle of
innovation" to be fast developed and having a more immediate response to social
challenges. Finally, the European Commission seeks to promote competitiveness
through the European Innovation Partnership by improving the business environment
that will put the foundation for growth and new entries into new more friendly mar-
kets but with new circumstances. Yet, the result will be an increase of productivity
through more investment.
The targets set in Europe 2020 do not have a fixed rate of R&D, but rather
some common goals, which require some time. In the interim, however, we already
have some results which therefore should promote with shorter movements public
and private investment in research and innovation development, while improving the
institutional framework and making the business environment more business-friendly
by reducing bureaucracy and other taxes, and putting stringent environmental meas-
ures preventing future issues that will arise with new technologies, and at the same
time making it environmentally friendly.
R&D does not require just a little effort of collaboration, but rather a deep-
rooted and long pan-European network of co-operations, with an inner discipline to
promote lifelong learning and higher education levels, in order to develop research
and innovation actors.
25
3. Progress towards environmental sustainability and climate policy objectives Esli Jahja
Whilst the Lisbon Treaty forebore from addressing itself to the issue of a consis-
tent environmental, energy and climate policy from its drafting, with the period 2000-
2005 distinctive of its unprioritized strategy development despite the implementation
of the Cardiff Process, the strategy pursued in light of Europe 2020 has been ambitious
in further assimilating environmental and energy policy in EU market regulation, albeit
ultimately listless.27 The ‘structural lack of sustainable planning in strategy formula-
tion’28 became a significant question which the Lisbon Treaty barely tackled and as a
result proven ineffectual—a question addressed by the Integrated Guidelines 2008-
2010 but whose inclusion in the 2020 Strategy for Growth has been rather stagnant
upon implementation in virtue of the relative detachment in the policy planning be-
tween the Cardiff Process and the Stockholm Programme, among other reasons.29
Political disinclination, often the absence of a cooperative context throughout the
implementation of the policy objectives in some Member States and the disassociation
from further integration, irresponsible business conduct for the decarbonisation of the
economy, a shortage in market-based instruments towards green production patterns
in combination with the present public debt crisis largely overshadowing the necessity
for investment securities on innovative technologies building on environmental sus-
tainability constitute substantial impediments towards green growth.30 Arguably,
27
M. B. Karan and H. Kazdağli, “The Development of Energy Markets in Europe,” in A. Dorsman, W. Westerman, M. B. Karan, & Ö. Arslan (eds.), Financial Aspects in Energy: A European Perspective, (Berlin Heidelberg: Springer-Verlag, 2011): 11-32; A. M. Boromisa, “Energy for Smart, Sustainable and Inclusive Growth,” in From the Lisbon Strategy to Europe 2020, (Zagreb: Institute of International Relations - IMO, 2010): 219. Before the implementation of the electricity and gas directives first established in 1992, common market legislation was exclusive of energy policy; European Directives followed on the liberali-zation of energy markets in the second half of the 1990s, composed of common regulations for the in-ternal market in electricity and natural gas, while the 1995 Green Paper For a European Union for an Energy Policy provided the foundation in connecting internal market policy with the strategic objectives of competitiveness, security of supply and environmental protection. The Cardiff Process (June 1998) initiated a strategy of securing environmental protection into European policy and thereby be ‘inte-grated into the definition and implementation of all Community activities and policies’ (/COM/98/0333 final). 28
S. Fischer et al., Europe 2020: Proposals for Europe's Economic, Social and Environmental Renewal, (Berlin: International Policy Analysis Friedrich Ebert Stiftung, May 2010): 5. 29
Ibid: 5-6. The Stockholm Programme (May 2010) details EU priorities in the area of justice, freedom and security for the period 2010-2014 following the Tampere and Hague Programmes, sustainable and environmentally friendly economic growth. 30
Other impediments involve, for instance, the substantial costs for monitoring and enforcing GHG emissions, information asymmetries and split incentives, or market incompleteness. Read, OECD, In-
26
green growth policy does involve high political risks owing to the general economic
restructuring that need be formed for long-term growth rather than emphasis on
short-term job creation.31
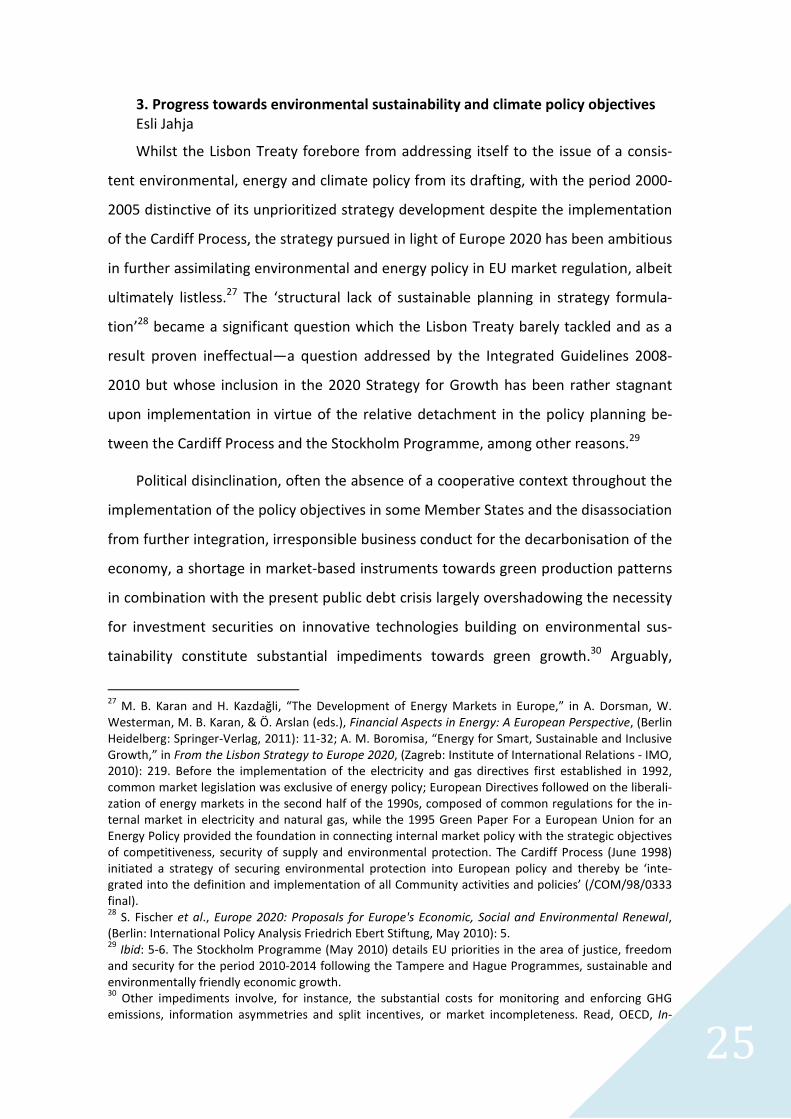
The first Europe 2020 binding environmental policy target relates to a 20% reduc-
tion in greenhouse gas (GHG) emissions by 2020 for sectors covered in the EU Emis-
sions Trading System (ETS), relative to the base year 1990, and reduction of emissions
not covered in the EU ETS by 9% relative to 2005.32 A relative disassociation of GDP
growth from GHG emissions is observed (Figure 1), illustrating the antithetical rela-
tionship between the former’s firmly rising trend to the latter’s gradual contraction
since 1990: GDP increased 46% in the EU-27 whereas emissions declined by 15% for
the period 1990-2010—with the exception of a 2.4% increase in emissions from 2009
to 2010 attributed to the economic recession, whence energy intensity grew despite
previous decreases.
Figure 1: Energy and GDP indicators, Index (1990 = 100).33
Source: Eurostat, IEA.
terim Report of the Green Growth Strategy: Implementing our Commitment for a Sustainable Future, Meeting of the OECD Council at Ministerial Level 27-28 May 2010 (OECD: Paris 2010): 20. 31
John Zysman and Mark Huberty, “Religion and Reality in the Search for Green Growth”, Intereconom-ics: Review of European Economic Policy, 47 no. 3 (Berlin: Springer): 141-146. 32
In sectors such as transport (with the exception of aviation), buildings, agriculture and waste. These targets—which differ from each country—are incorporated into the Effort Sharing Decision (ESD) that composes the climate and energy package. The targets for the period 2013-2020 in annual emission allocation were formally adopted in March 2013. See document C(2013) 1708 and the ‘Annual Report on Progress Towards Achieving the Kyoto Objectives’, (COM (2012) 626), European Commission. 33
Energy intensity is calculated as the ratio of GHG emissions produced to GDP. The energy dependence rate is defined as net imports (imports minus exports) divided by gross consumption.
27
Energy intensity, particularly in the light of the incremental patterns in gross in-
land energy consumption and subsequent costs, constitutes a central question in the
scope of energy efficiency schemes and in the reduction of energy imports expendi-
ture and ultimately energy dependency, which has remarkably increased nine per-
centage points since 1990 (at 54% in 2011).34
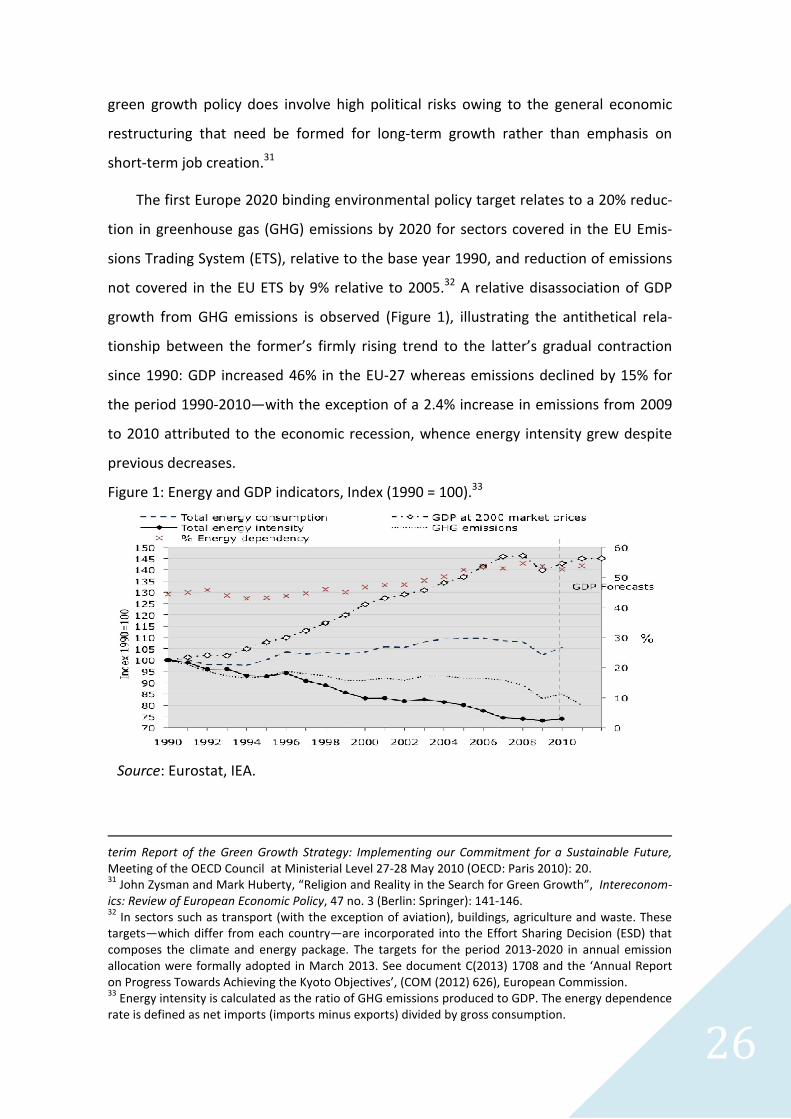
Figure 2: GHG Gas Emissions in the EU, 2010, compared to 1990.
Source: Eurostat.
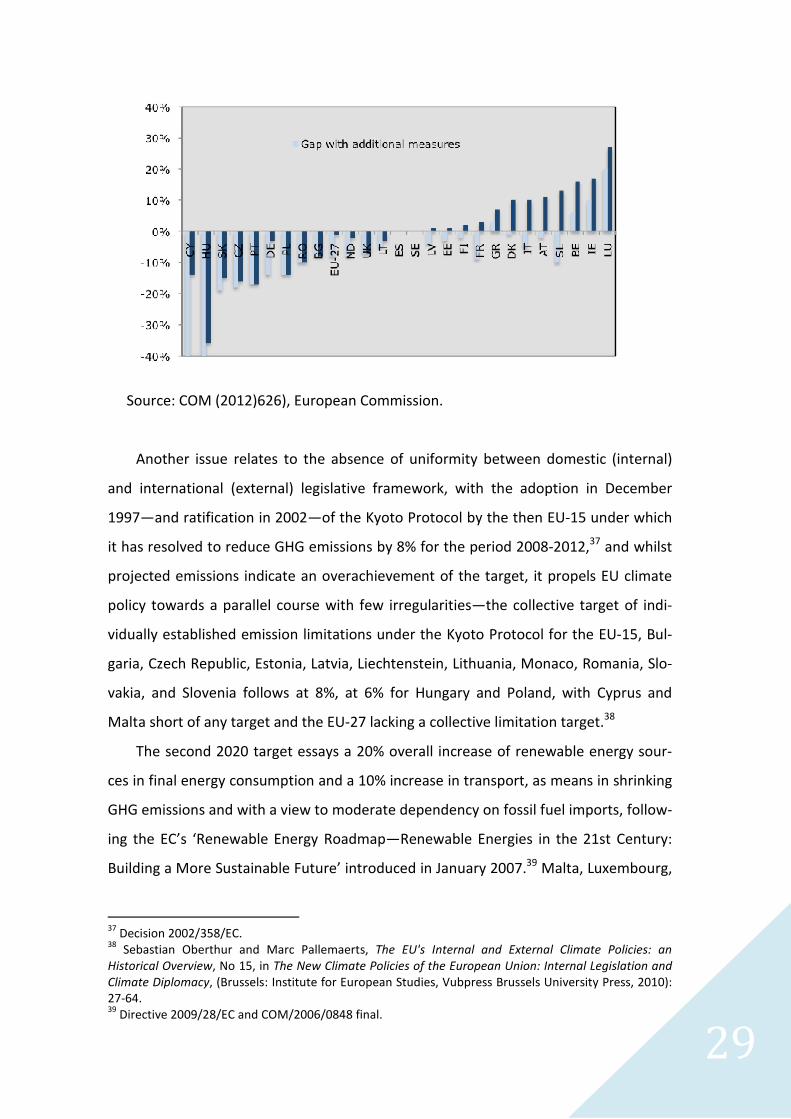
It is of keen interest to note the variance among the Member States in the 2020
projected performance, notwithstanding the EU’s overachievement of the overall tar-
get by 0.9%; only ten Member States are expected to actualize their target commit-
ment with existing measures (Bulgaria, Estonia, Lithuania, Latvia and Slovakia had the
largest gap from the EU target in 2010, see Figure 2), ten others will only fulfil their
objectives with the implementation of additionally planned measures and policies,
while the remaining seven will not realize their targets either way (Figure 3)—with
Greece, Belgium, Malta, Ireland and Luxembourg entertaining the greatest distance
from their targets, for which reason they may employ ESD flexibility mechanisms in the
form of international credits from the Kyoto Protocol’s Clean Development Mechanism
(e.g. Certified Emission Reductions) and Joint Implementation, regulated at 3% of their
34
Estonia (12%), Romania (21%), the Czech Republic (29%), the Netherlands (30%), Poland (34%), the UK (36%), and Denmark (-9%) were the least dependent on energy imports in 2011, whereas the most dependent were Malta (101%), Luxembourg (97%), Cyprus (93%) and Ireland (89%). The five greatest energy consumers were Germany (-7.7% relative to 2008), France (-4.6%), the UK (-9.4%), Italy (-4.8%) and Spain (-9.4%). See: http://europa.eu/rapid/press-release_STAT-13-23_en.htm.
28
2005 non-traded sector emissions, or in borrowing emission budgets at a maximum
value of 5% from other countries’ surpluses.35
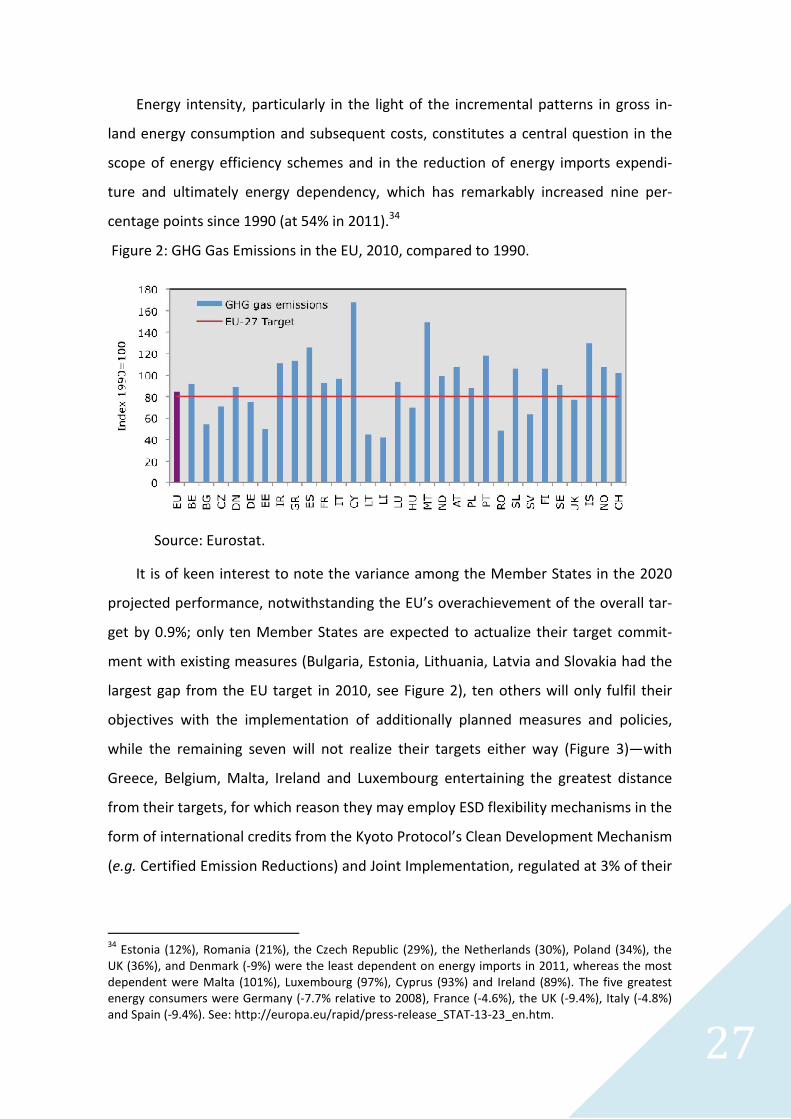
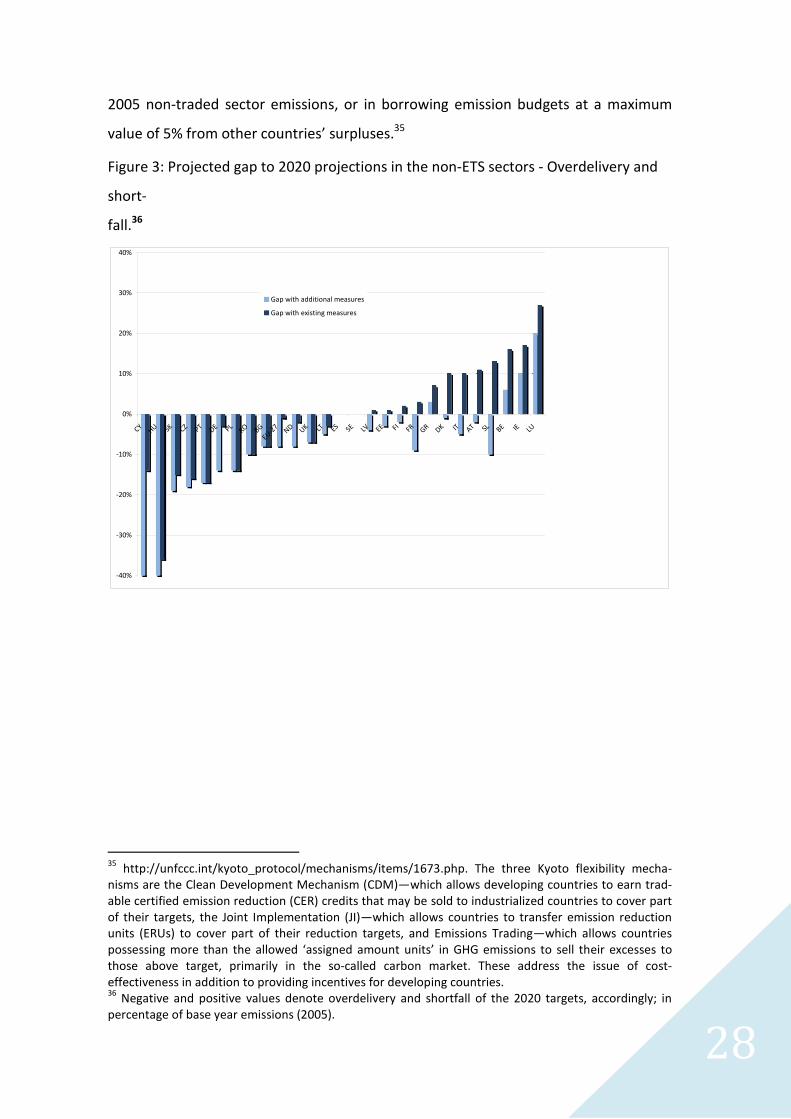
Figure 3: Projected gap to 2020 projections in the non-ETS sectors - Overdelivery and
short-
fall.36
-40%
-30%
-20%
-10%
0%
10%
20%
30%
40%
CYHU SK CZ PT DE PL
RO BG
EU-27
ND UK LT ES SE LV EE FI FR GR DK IT AT SL BE IE LU
Gap with additional measures
Gap with existing measures
35
http://unfccc.int/kyoto_protocol/mechanisms/items/1673.php. The three Kyoto flexibility mecha-nisms are the Clean Development Mechanism (CDM)—which allows developing countries to earn trad-able certified emission reduction (CER) credits that may be sold to industrialized countries to cover part of their targets, the Joint Implementation (JI)—which allows countries to transfer emission reduction units (ERUs) to cover part of their reduction targets, and Emissions Trading—which allows countries possessing more than the allowed ‘assigned amount units’ in GHG emissions to sell their excesses to those above target, primarily in the so-called carbon market. These address the issue of cost-effectiveness in addition to providing incentives for developing countries. 36
Negative and positive values denote overdelivery and shortfall of the 2020 targets, accordingly; in percentage of base year emissions (2005).
29
Source: COM (2012)626), European Commission.
Another issue relates to the absence of uniformity between domestic (internal)
and international (external) legislative framework, with the adoption in December
1997—and ratification in 2002—of the Kyoto Protocol by the then EU-15 under which
it has resolved to reduce GHG emissions by 8% for the period 2008-2012,37 and whilst
projected emissions indicate an overachievement of the target, it propels EU climate
policy towards a parallel course with few irregularities—the collective target of indi-
vidually established emission limitations under the Kyoto Protocol for the EU-15, Bul-
garia, Czech Republic, Estonia, Latvia, Liechtenstein, Lithuania, Monaco, Romania, Slo-
vakia, and Slovenia follows at 8%, at 6% for Hungary and Poland, with Cyprus and
Malta short of any target and the EU-27 lacking a collective limitation target.38
The second 2020 target essays a 20% overall increase of renewable energy sour-
ces in final energy consumption and a 10% increase in transport, as means in shrinking
GHG emissions and with a view to moderate dependency on fossil fuel imports, follow-
ing the EC’s ‘Renewable Energy Roadmap—Renewable Energies in the 21st Century:
Building a More Sustainable Future’ introduced in January 2007.39 Malta, Luxembourg,
37
Decision 2002/358/EC. 38
Sebastian Oberthur and Marc Pallemaerts, The EU's Internal and External Climate Policies: an Historical Overview, No 15, in The New Climate Policies of the European Union: Internal Legislation and Climate Diplomacy, (Brussels: Institute for European Studies, Vubpress Brussels University Press, 2010): 27-64. 39
Directive 2009/28/EC and COM/2006/0848 final.
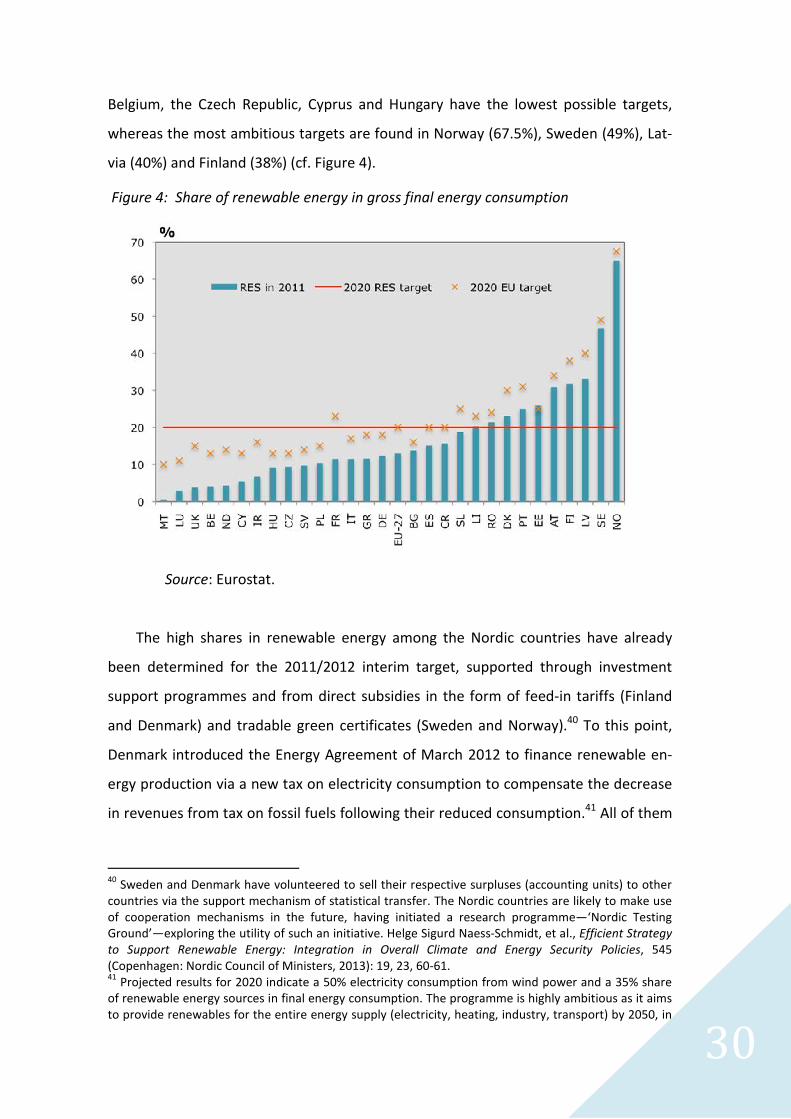
30
Belgium, the Czech Republic, Cyprus and Hungary have the lowest possible targets,
whereas the most ambitious targets are found in Norway (67.5%), Sweden (49%), Lat-
via (40%) and Finland (38%) (cf. Figure 4).
Figure 4: Share of renewable energy in gross final energy consumption
Source: Eurostat.
The high shares in renewable energy among the Nordic countries have already
been determined for the 2011/2012 interim target, supported through investment
support programmes and from direct subsidies in the form of feed-in tariffs (Finland
and Denmark) and tradable green certificates (Sweden and Norway).40 To this point,
Denmark introduced the Energy Agreement of March 2012 to finance renewable en-
ergy production via a new tax on electricity consumption to compensate the decrease
in revenues from tax on fossil fuels following their reduced consumption.41 All of them
40
Sweden and Denmark have volunteered to sell their respective surpluses (accounting units) to other countries via the support mechanism of statistical transfer. The Nordic countries are likely to make use of cooperation mechanisms in the future, having initiated a research programme—‘Nordic Testing Ground’—exploring the utility of such an initiative. Helge Sigurd Naess-Schmidt, et al., Efficient Strategy to Support Renewable Energy: Integration in Overall Climate and Energy Security Policies, 545 (Copenhagen: Nordic Council of Ministers, 2013): 19, 23, 60-61. 41
Projected results for 2020 indicate a 50% electricity consumption from wind power and a 35% share of renewable energy sources in final energy consumption. The programme is highly ambitious as it aims to provide renewables for the entire energy supply (electricity, heating, industry, transport) by 2050, in
31
have decoupled GDP growth from energy use (emissions to air),42 while the command
and control policy instituted since the 1970s (see, for example, individual emission
permits for the industrial sector founded on environmental assessments) have proven
rather cost-effective.43 A Norden study suggests that a synergy of ‘economic instru-
ments’ with policy-making addressing industrial restructuring towards new economic
activities following new technological innovations thereafter stimulated through envi-
ronmental taxes, education, R&D and ‘red tape’ abolishment of all industrial regula-
tions that impede growth, would prove a healthy foundation for other countries in
supporting a green growth agenda.44
All Member States are likely to fulfil their commitments, however supplementary
measures need be set in motion for some to implement the EU Renewable Energy Di-
rective, inclusive of Malta, the Netherlands—fourth to last in renewable energy share
owing to the political decision of unprioritized financing of wind energy and biogas
with decreased energy investments45—and the UK, whose ‘renewable energy policy
has been characterised by opportunism, cost-limiting caps and continuous adjust-
ments resulting from a lack of clarity of goals’.46
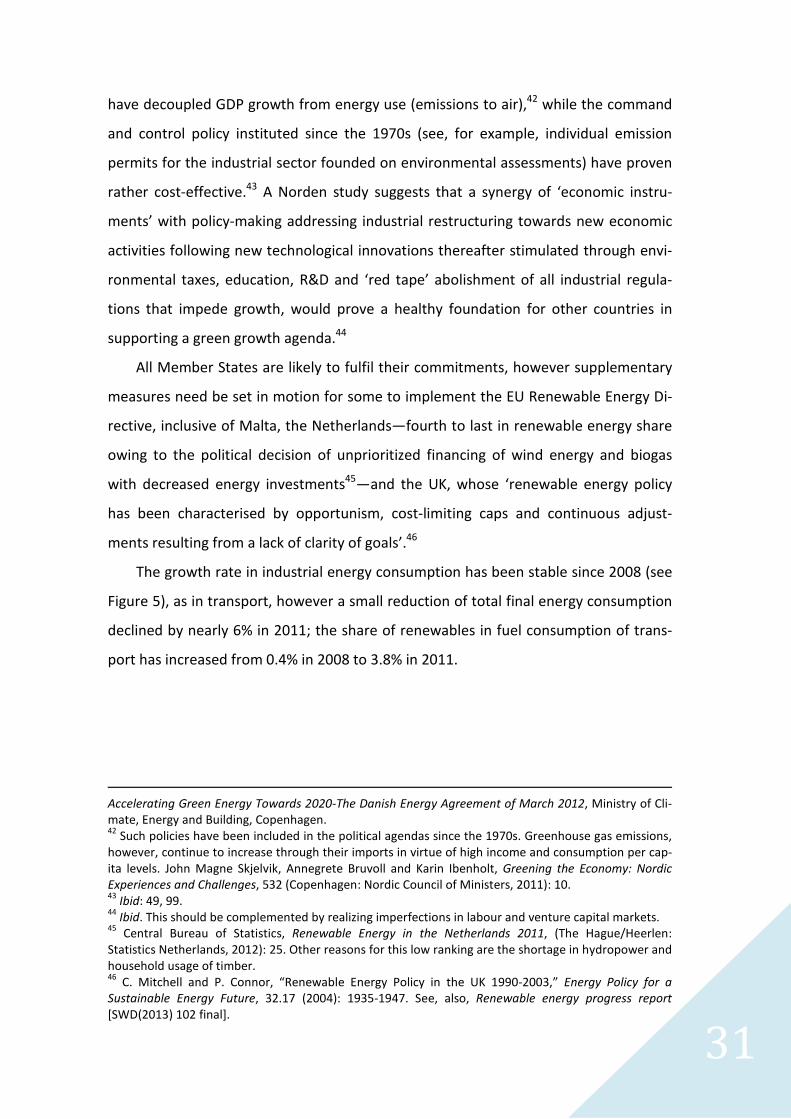
The growth rate in industrial energy consumption has been stable since 2008 (see
Figure 5), as in transport, however a small reduction of total final energy consumption
declined by nearly 6% in 2011; the share of renewables in fuel consumption of trans-
port has increased from 0.4% in 2008 to 3.8% in 2011.
Accelerating Green Energy Towards 2020-The Danish Energy Agreement of March 2012, Ministry of Cli-mate, Energy and Building, Copenhagen. 42
Such policies have been included in the political agendas since the 1970s. Greenhouse gas emissions, however, continue to increase through their imports in virtue of high income and consumption per cap-ita levels. John Magne Skjelvik, Annegrete Bruvoll and Karin Ibenholt, Greening the Economy: Nordic Experiences and Challenges, 532 (Copenhagen: Nordic Council of Ministers, 2011): 10. 43
Ibid: 49, 99. 44
Ibid. This should be complemented by realizing imperfections in labour and venture capital markets. 45
Central Bureau of Statistics, Renewable Energy in the Netherlands 2011, (The Hague/Heerlen: Statistics Netherlands, 2012): 25. Other reasons for this low ranking are the shortage in hydropower and household usage of timber. 46
C. Mitchell and P. Connor, “Renewable Energy Policy in the UK 1990-2003,” Energy Policy for a Sustainable Energy Future, 32.17 (2004): 1935-1947. See, also, Renewable energy progress report [SWD(2013) 102 final].
32
Figure 5 Final energy consumption by sector (2008-2011), Share of renewable energy.
Source: Eurostat.
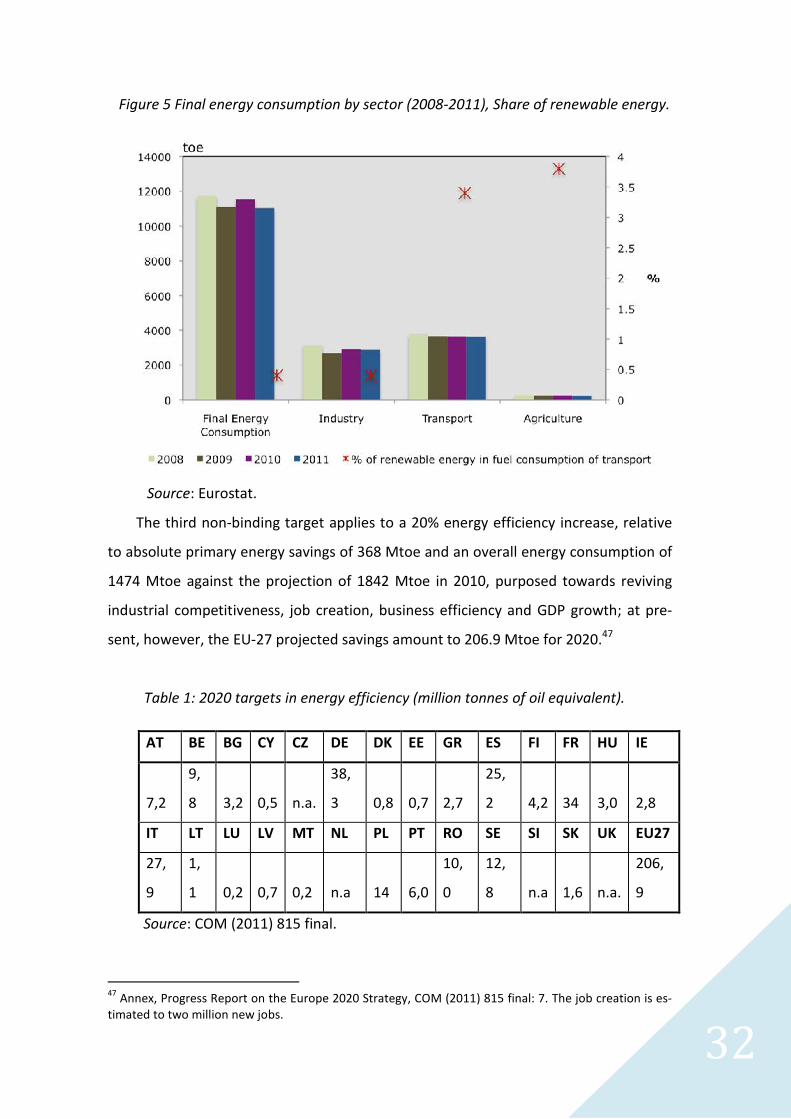
The third non-binding target applies to a 20% energy efficiency increase, relative
to absolute primary energy savings of 368 Mtoe and an overall energy consumption of
1474 Mtoe against the projection of 1842 Mtoe in 2010, purposed towards reviving
industrial competitiveness, job creation, business efficiency and GDP growth; at pre-
sent, however, the EU-27 projected savings amount to 206.9 Mtoe for 2020.47
Table 1: 2020 targets in energy efficiency (million tonnes of oil equivalent).
AT BE BG CY CZ DE DK EE GR ES FI FR HU IE
7,2
9,
8 3,2 0,5 n.a.
38,
3 0,8 0,7 2,7
25,
2 4,2 34 3,0 2,8
IT LT LU LV MT NL PL PT RO SE SI SK UK EU27
27,
9
1,
1 0,2 0,7 0,2 n.a 14 6,0
10,
0
12,
8 n.a 1,6 n.a.
206,
9
Source: COM (2011) 815 final.
47
Annex, Progress Report on the Europe 2020 Strategy, COM (2011) 815 final: 7. The job creation is es-timated to two million new jobs.
33
An important stumbling block lies partly on the political reluctance and unwilling-
ness for commitment observed in the Czech Republic, the Netherlands, Slovenia and
the UK, who were required to establish formerly absent indicative national targets by
April 2013. The results are not uniform: Slovenia set the value of 10.809 GWh in en-
ergy savings by 2020, the Netherlands set a 1.5% in energy savings per year, the Czech
Republic has not yet reported anything while the UK has set its indicative target based
on final energy consumption48—having first applied an ‘accounting trick’ which allows
the calculation of energy savings from four years prior to the Energy Efficiency Direc-
tive’s 2014-2020 period with a view to reduce its obligations by 60% in is annual sav-
ings levels.49 On 18 April 2013 the EC published a report on the financial support to be
offered for energy efficiency projects in buildings, following the EED’s requirement of
Member States to establish a long-term strategy in investment promotion for the
‘renovation of the national building stock’ by April 2014.50 The progress in energy sav-
ings, however, towards achieving the target of a low-carbon economy and as a cost-
effective means of reducing GHG emissions appears wanting, considering also that
‘though the 20% energy savings target has politically been agreed upon, it is not ex-
plicit in any legally binding EU decision. Thus, in a sense it is still to be regarded as a
policy ‘ambition’ that has not been fully translated into concrete policies.’51 Current
projections indicate that the energy savings target will founder by a significant gap.52
Finally, in relation to Greece, its poor performance as derived from the tables and
figures previously illustrated, indicates that the economic crisis has eclipsed the cli-
mate issue now set aside as a lesser priority, despite such incompatibility with the re-
covery effort in the country. It is up to the authorities to develop environmental poli-
cies that will not passively accommodate themselves to the EU policy guidelines
through typicality alone but ones confronting real domestic challenges.
48
Amounting to 129.2 Mtoe on a net calorific basis, a 18% reduction (28.5 MTOE) from the UK’s 2007 business as usual project projection for 2020. Annual 2013 Report. 49
This arrangement was founded on the allowance of exemptions in the Directive’s Article 7, much to the exasperation particularly of Germany, Austria and Finland. Euractiv, Three EU states condemn UK’s energy savings 'accounting trick', (10 June 2013). Available at: http://www.euractiv.com/climate-environment/eu-states-condemn-uk-energy-savi-news-516788. 50
Financial Support for Energy Efficiency in Buildings. COM(2013) 225 final. 51
B. Wesselink, R. Harmsen, and W. Eichhammer, Energy Savings 2020: How to Triple the Impact of En-ergy Savings Policies in Europe’, (ECOFYS: 2010): 21. 52
Ibid, 4.
34
4. The strategic framework for education and training
Christiana Aposkiti & Calliope Ioannidou
The empirical literature reaches mixed conclusions regarding the effect of un-
employment levels on the tendency to pursue education. Handa and Skolnik find a
‘very weak’ effect of youth unemployment on enrolment in university education in On-
tario, Canada,53 while Card and Lemieux, using data from the US and Canada, find a
positive effect of weak local labour market conditions on educational enrolment for
16–24 year-olds.54 In a more recent study, shows that higher regional youth unem-
ployment positively affects enrolment in post-compulsory education in England,55
which is in accordance with the conclusions reached by Rice for England and Wales, a
decade earlier.56 For Spain, Fernandez and Shioji find that regional unemployment of
non-graduates positively affects university enrolment rates – at least in the short term
– whereas the longer-term effect may be negative due to the wealth effect.57
An informal look at EU cross-country data on unemployment/employment and
enrolment data for the period 2007–9 does not suggest that there is any correlation
between youth unemployment and tertiary education enrolment. The increase in the
overall tertiary enrolment rate for the EU-27 has been less than 1%, which is less than
the trend for the period 2000–9. Most Mediterranean countries have seen little pro-
gress in the way of increased tertiary enrolment, Greece being an exception. On the
other hand, Lithuania has seen a 3% increase in the enrolment rate against the back-
drop of a 21% increase in youth unemployment.58
Some Member States objected to setting headline targets on education partici-
pation, on the basis that this is not an EU issue, but one of a national competence. Ad-
53
M. L. Handa and M. L. Skolnik, "Unemployment, expected returns, and the demand for university education in Ontario: some empirical result", Higher Education, 4 (1975): 27-43. 54
D. Card and T. Lemieux, "Can Falling Supply Explain the Rising Return to College for Younger Men? A Cohort-Based Analysis", Quarterly Journal of Economics, 116.2 (1997): 705-746. 55
D. Clark, "Do Recessions Keep Students in School? The Impact of Youth Unemployment on Enrolment in Post-compulsory Education in England", Economica, 78.311 (2011): 523-545. 56
P. Rice, "The impact of local labour markets on investment in further education: Evidence from the England and Wales youth cohort studies", Journal of Population Economics, 12.2 (1999): 287-312. 57
R. Fernandez and E. Shioji, "Human capital investment in the presence of unemployment: application to University enrolment in Spain" Institute of Economics and Statistics Oxford, Discussion Papers, 66 (2001). 58
M. Barslund, “Recent Developments in Selected Education Indicators and their Relation to Europe 2020 targets”, National Institute Economic Review, 220 (April 2012): 14-15.
35
ditionally, some critics have voiced concerns about how realistic it is to set education
targets, given the tight financial constraints that many EU governments are facing due
to the current financial and economic crisis.59
There is a major policy contradiction between the goals of the Europe 2020
strategy and the imposition of austerity measures. In most countries education and
training budgets seem either to have been cut or, to some extent, reduced (Croatia
9%, Czech 5%, Estonia, Hungary 10%, Latvia, Lithuania, Romania, Serbia 25%, Slovakia).
In Spain cuts in pre-school and primary education are planned, while in Latvia funding
for education and science was reduced by half in 2009 and no plans for restoring it
have been put forward in 2010 and 2011. Capital spending cuts in the UK have been
particularly focused on education construction, which will have impacts in the longer
term.60
Cuts in salaries also pose another issue: between 3% and 25% at all levels,
teachers have been laid-off because of the crisis; schools, in particular small public
schools in rural areas, were closed, merged, or reorganized (Latvia, Lithuania, Romania
and Russia). In some countries the size of the class has been expanded (Lithuania, Es-
tonia). Additionally, there has been an increase in hiring unqualified teachers, a rise in
tuition fees etc.61
Europe 2020 targets
In 2010, the European Commission proposed the Europe 2020 strategy for the
advancement of the EU economy. The above mentioned Agenda, aims at smart, sus-
tainable, inclusive growth with greater coordination of national and European policy.
The initiatives proposed in this process are underway, but the recent financial crisis
has already affected their progress for most European countries. The five EU bench-
marks in the strategic framework for Education and Training for 2020 are:
1. Reducing school drop-out leavers below 10%,
59
S. Theodoropoulou, “Skills and education for growth and well-being in Europe 2020: are we on the right path?”, EPC Issue Paper, 61 (October 2010): 24. 60
S. Theodoropoulou & A. Watt, “Withdrawal symptoms: an assessment of the austerity packages in Europe”, European Trade Union Institute, Working Paper, 2011.02, 26-27. 61
L. Badea, “Economic crisis and education. Case study: The Romania Educational System”, Equilibrium, 6.3 (2011): 82.
36
2. The share of 30-34 year olds with tertiary educational attainment should be at
least 40%,
3. At least 95% of children between 4 years old and the age for starting compul-
sory primary education should participate in early childhood education,
4. The share of low-achieving 15-years olds in reading, mathematics and science
should be less than 15%,
5. An average of at least 15 % of adults should participate in lifelong learning.62
It’s a fact that, as time passes by, the EU countries will try to achieve better
goals and to fulfil their targets. The 2020 benchmarks may seem a bit hard to achieve
but, with a good effort made by the 27, nothing is impossible. On the 3rd March 2010,
the Commission announced the launch of “Europe 2020”, the successor of “Lisbon
Strategy”.63 For the first time, two of the main targets are related to education: reduc-
ing school drop-out rates below 10% and at least 40% of 30-34–year-olds completing
third level education.
Top vs. Low performances
In the EU-27 the share of early school leavers (population 18-24) declined from
17.6% in 2000 to 14.1% in 2010. The best performers are Slovakia, the Czech Republic
and Poland. On the other hand, low-achieving rates were found in Malta and Portu-
gal.64 In addition, the tertiary attainment of 30-34 years old increased from 22.4% in
2000 to 33.6% in 2010 and therefore by 11 percentage points. The best performers in
this target are Ireland, Denmark and Luxembourg. However, there are countries which
have not reached the initiative: Malta, Romania.65
Summarizing the above points, it is clear that the vast majority of the EU coun-
tries has made great progress either on the elimination of the school drop-out rates or
the tertiary attainment throughout the decade 2000-2010. There are only six countries
62
J. Vero, “From Lisbon Strategy to Europe 2020: the Statistical Landscape of the Education and Training Objectives through the Lens of the Capability Approach”, Social Work & Society, 10.1 (2012): 3. 63
F. Zuleeg, “Europe 2020: better – but still not good enough”, European Policy Centre, 5.3.2010. 64
European education benchmarks, http://ec.europa.eu/education/lifelong-learning-policy/benchmarks_en.htm 65
Ibid.
37
with significant shares except for Malta, Portugal and Romania, which had lower than
usual effective performances.
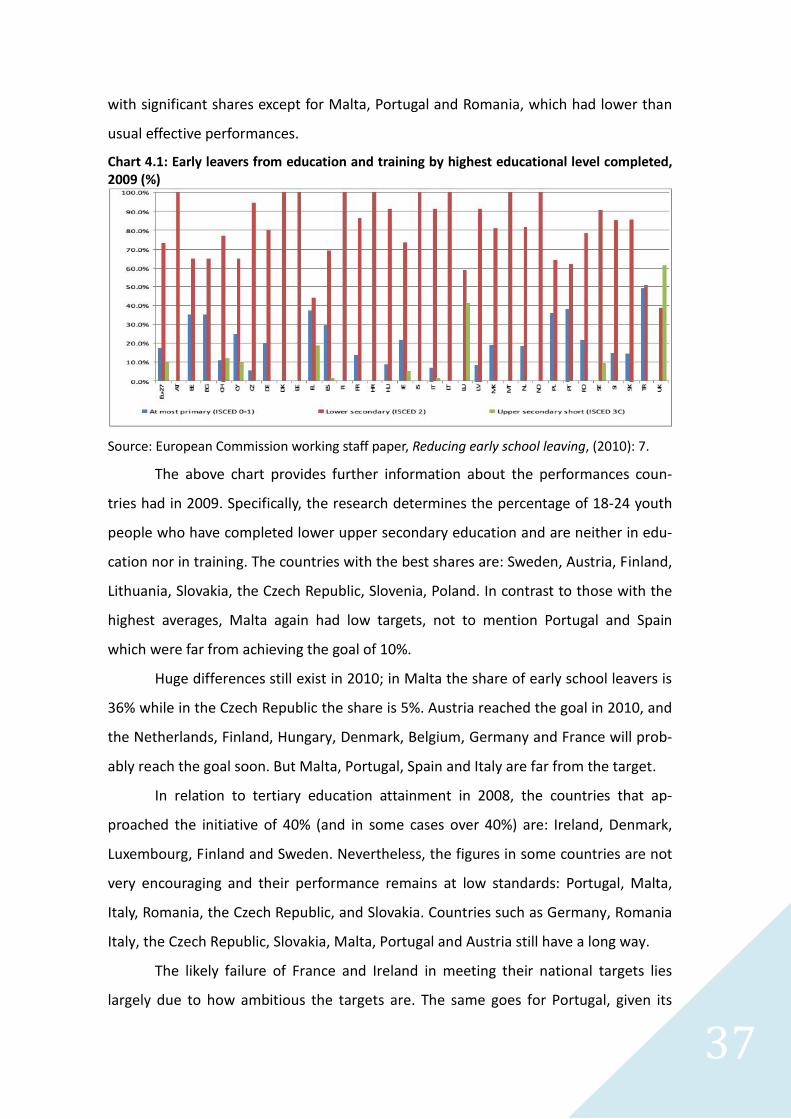
Chart 4.1: Early leavers from education and training by highest educational level completed, 2009 (%)
Source: European Commission working staff paper, Reducing early school leaving, (2010): 7.
The above chart provides further information about the performances coun-
tries had in 2009. Specifically, the research determines the percentage of 18-24 youth
people who have completed lower upper secondary education and are neither in edu-
cation nor in training. The countries with the best shares are: Sweden, Austria, Finland,
Lithuania, Slovakia, the Czech Republic, Slovenia, Poland. In contrast to those with the
highest averages, Malta again had low targets, not to mention Portugal and Spain
which were far from achieving the goal of 10%.
Huge differences still exist in 2010; in Malta the share of early school leavers is
36% while in the Czech Republic the share is 5%. Austria reached the goal in 2010, and
the Netherlands, Finland, Hungary, Denmark, Belgium, Germany and France will prob-
ably reach the goal soon. But Malta, Portugal, Spain and Italy are far from the target.
In relation to tertiary education attainment in 2008, the countries that ap-
proached the initiative of 40% (and in some cases over 40%) are: Ireland, Denmark,
Luxembourg, Finland and Sweden. Nevertheless, the figures in some countries are not
very encouraging and their performance remains at low standards: Portugal, Malta,
Italy, Romania, the Czech Republic, and Slovakia. Countries such as Germany, Romania
Italy, the Czech Republic, Slovakia, Malta, Portugal and Austria still have a long way.
The likely failure of France and Ireland in meeting their national targets lies
largely due to how ambitious the targets are. The same goes for Portugal, given its
38
starting point and the fact that it is spending below the EU average (in terms of per
cent of GDP) on its education system. This is also true of Austria, although spending on
education is higher there. The target for Spain may be reachable if public spending
reaches the EU average. Currently, Spain is committing significantly less resources as a
percentage of GDP to the education sector than the EU average.66
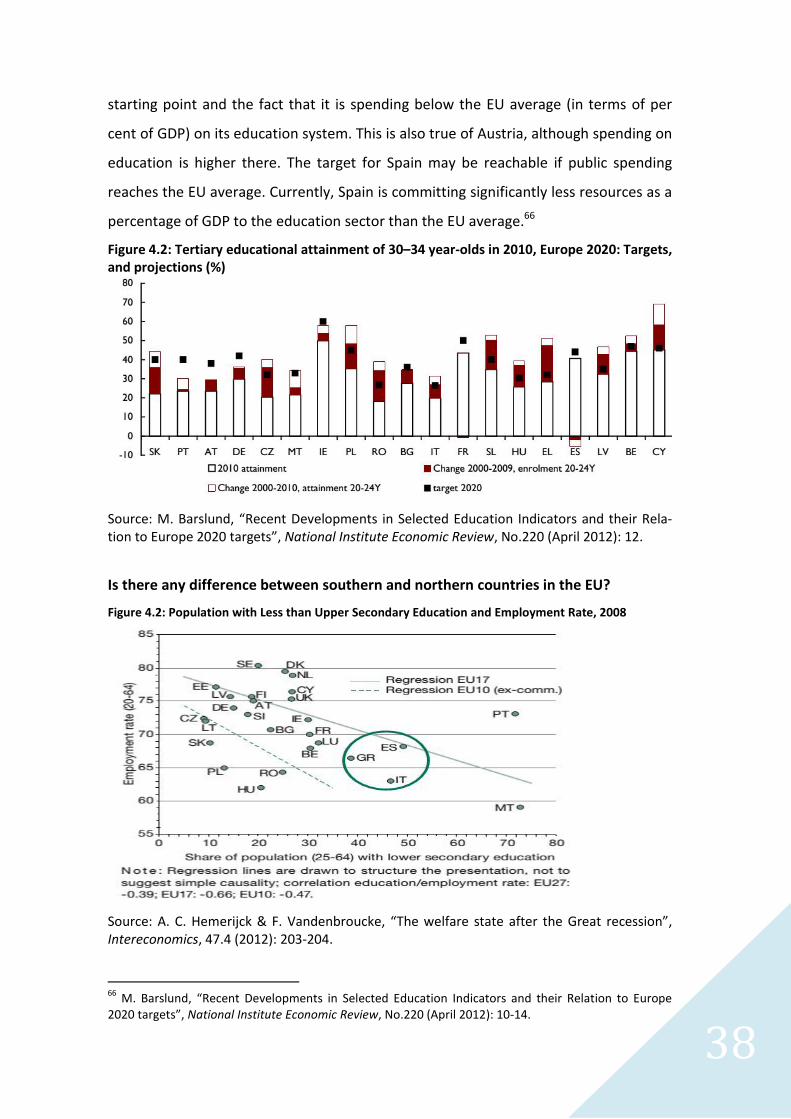
Figure 4.2: Tertiary educational attainment of 30–34 year-olds in 2010, Europe 2020: Targets, and projections (%)
Source: M. Barslund, “Recent Developments in Selected Education Indicators and their Rela-tion to Europe 2020 targets”, National Institute Economic Review, No.220 (April 2012): 12.
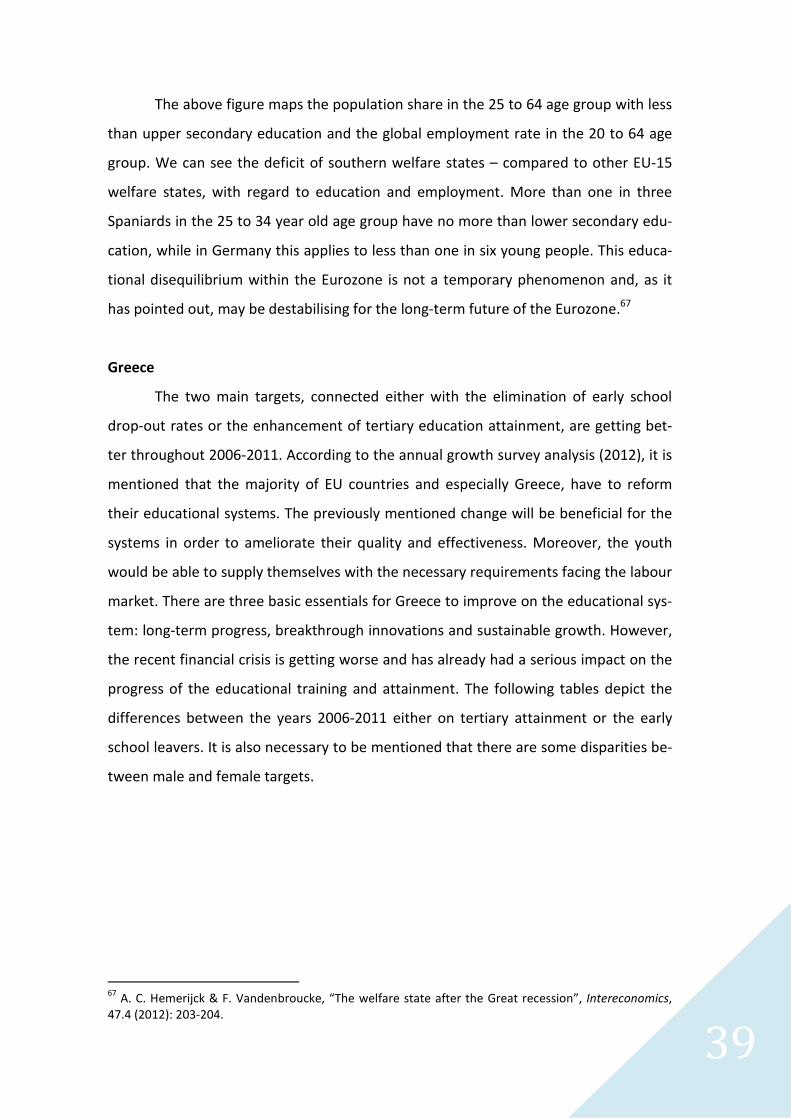
Is there any difference between southern and northern countries in the EU?
Figure 4.2: Population with Less than Upper Secondary Education and Employment Rate, 2008
Source: A. C. Hemerijck & F. Vandenbroucke, “The welfare state after the Great recession”, Intereconomics, 47.4 (2012): 203-204.
66
M. Barslund, “Recent Developments in Selected Education Indicators and their Relation to Europe 2020 targets”, National Institute Economic Review, No.220 (April 2012): 10-14.
39
The above figure maps the population share in the 25 to 64 age group with less
than upper secondary education and the global employment rate in the 20 to 64 age
group. We can see the deficit of southern welfare states – compared to other EU-15
welfare states, with regard to education and employment. More than one in three
Spaniards in the 25 to 34 year old age group have no more than lower secondary edu-
cation, while in Germany this applies to less than one in six young people. This educa-
tional disequilibrium within the Eurozone is not a temporary phenomenon and, as it
has pointed out, may be destabilising for the long-term future of the Eurozone.67
Greece
The two main targets, connected either with the elimination of early school
drop-out rates or the enhancement of tertiary education attainment, are getting bet-
ter throughout 2006-2011. According to the annual growth survey analysis (2012), it is
mentioned that the majority of EU countries and especially Greece, have to reform
their educational systems. The previously mentioned change will be beneficial for the
systems in order to ameliorate their quality and effectiveness. Moreover, the youth
would be able to supply themselves with the necessary requirements facing the labour
market. There are three basic essentials for Greece to improve on the educational sys-
tem: long-term progress, breakthrough innovations and sustainable growth. However,
the recent financial crisis is getting worse and has already had a serious impact on the
progress of the educational training and attainment. The following tables depict the
differences between the years 2006-2011 either on tertiary attainment or the early
school leavers. It is also necessary to be mentioned that there are some disparities be-
tween male and female targets.
67
A. C. Hemerijck & F. Vandenbroucke, “The welfare state after the Great recession”, Intereconomics, 47.4 (2012): 203-204.
40
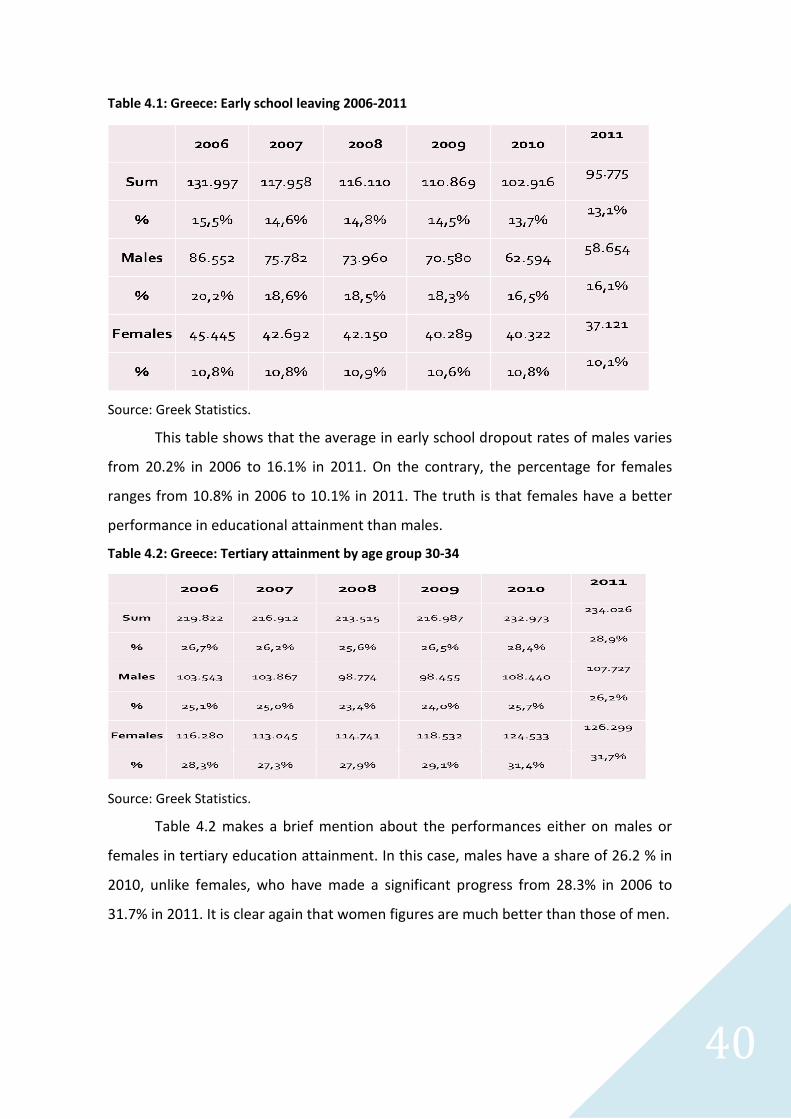
Table 4.1: Greece: Early school leaving 2006-2011
Source: Greek Statistics.
This table shows that the average in early school dropout rates of males varies
from 20.2% in 2006 to 16.1% in 2011. On the contrary, the percentage for females
ranges from 10.8% in 2006 to 10.1% in 2011. The truth is that females have a better
performance in educational attainment than males.
Table 4.2: Greece: Tertiary attainment by age group 30-34
Source: Greek Statistics.
Table 4.2 makes a brief mention about the performances either on males or
females in tertiary education attainment. In this case, males have a share of 26.2 % in
2010, unlike females, who have made a significant progress from 28.3% in 2006 to
31.7% in 2011. It is clear again that women figures are much better than those of men.
41
A brief conclusion
The above analysis aims at presenting the so-far attainment in education and
training, which is one of the five benchmarks of the strategic framework for European
cooperation. These indicators are crucial for the accomplishment of the growth strat-
egy set by the EU and related to the accumulated human and social capital, which are
regarded as a sine qua non for "the developmental capacity of social organizations and
synergy relations, and depend on qualitative features of welfare systems established
across European countries".68 The achievement of these objectives requires a more
effective organisation of the European educational system and a well-defined and ad-
equately funded social policy. The prevailed austerity policy has rather had a reversed
effect on the indicators of education and training. On the other hand, there is a lot to
be done in the institutional and organisational structures of the national educational
systems and, as has been rightly pointed out, "an alternative focus on qualitative
achievement could reap enormous gains in long-run economic performance over the
century".69
68
A. Christoforou, " Social capital and human development: an empirical investigation across European countries", Journal of Institutional Economics, 6.2 (2010): 191–214; quotation is from p. 209-210. 69
E. A. Hanushek, L. Woessmann, "The Cost of Low Educational Achievement in the European Union", European Expert Network on Economics of Education, Analytical Report No. 7 (2011).
42
5. Poverty and Social Exclusion
Konstantinos Kaitsas
The European economic crisis has been four years in the making, and its social
consequences have major effects on the so-called continental European social model.
The various difficulties, in terms of social changes, brought about by the crisis, have
raised great concerns about the EU target for lifting at least 20 million people out of
poverty or social exclusion by 2020. The Social Inclusion Process is not only of eco-
nomic importance; it has also major social and political effects, especially in the five EU
countries worst hit by the economic crisis, since an increase in unemployment and
poverty figures generates social and racist intolerance and favours political extremism
and xenophobia among European populations.
Following the target of the Lisbon Strategy to create more and better jobs, the
EU will try to become an inclusive economy by reducing poverty. Despite the intuitive
notion that employment matters for poverty reduction, there is an interaction be-
tween growth, changes in both the number and the quality of jobs, and poverty reduc-
tion. Growth in one sector of the economy will not automatically translate into bene-
fits for the poor: much will depend on the profile of growth (its employment- or pro-
ductivity-intensity), the sectoral location of the poor, and the extent of mobility across
sectors.70
This part of the report aims at addressing some key aspects of the Europe 2020
Strategy, related to the target of poverty and social exclusion. An analysis of the rele-
vant National Reform Programmes (NRPs) was carried out by every Member State and
the European Commission. Based on these country reports, aspects of respective NRPs
are examined in this part of the report, with reference to the current level of fulfil-
ment. Country specific issues are used throughout for illustration, while a number of
overarching themes have also been identified and highlighted. Furthermore where an
issue is highlighted for one country this does not mean that it is not relevant to other
countries also. Final recommendations as presented are informed by the analysis of
the individual country reports and the identification of these themes.
70
European Commission, Europe 2020: A European Strategy for smart, sustainable and inclusive growth. Luxembourg: Publications Office of the European Union, 2010.
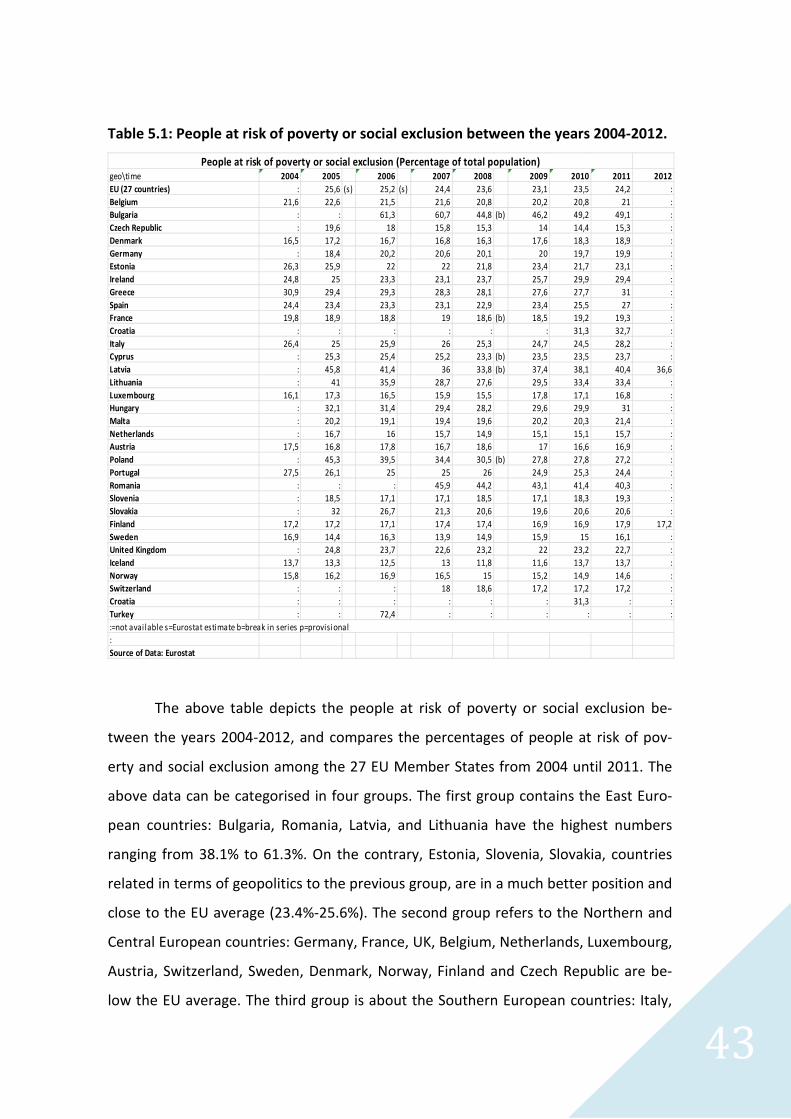
43
Table 5.1: People at risk of poverty or social exclusion between the years 2004-2012.
geo\time 2004 2005 2006 2007 2008 2009 2010 2011 2012
EU (27 countries) : 25,6 (s) 25,2 (s) 24,4 23,6 23,1 23,5 24,2 :
Belgium 21,6 22,6 21,5 21,6 20,8 20,2 20,8 21 :
Bulgaria : : 61,3 60,7 44,8 (b) 46,2 49,2 49,1 :
Czech Republic : 19,6 18 15,8 15,3 14 14,4 15,3 :
Denmark 16,5 17,2 16,7 16,8 16,3 17,6 18,3 18,9 :
Germany : 18,4 20,2 20,6 20,1 20 19,7 19,9 :
Estonia 26,3 25,9 22 22 21,8 23,4 21,7 23,1 :
Ireland 24,8 25 23,3 23,1 23,7 25,7 29,9 29,4 :
Greece 30,9 29,4 29,3 28,3 28,1 27,6 27,7 31 :
Spain 24,4 23,4 23,3 23,1 22,9 23,4 25,5 27 :
France 19,8 18,9 18,8 19 18,6 (b) 18,5 19,2 19,3 :
Croatia : : : : : : 31,3 32,7 :
Italy 26,4 25 25,9 26 25,3 24,7 24,5 28,2 :
Cyprus : 25,3 25,4 25,2 23,3 (b) 23,5 23,5 23,7 :
Latvia : 45,8 41,4 36 33,8 (b) 37,4 38,1 40,4 36,6
Lithuania : 41 35,9 28,7 27,6 29,5 33,4 33,4 :
Luxembourg 16,1 17,3 16,5 15,9 15,5 17,8 17,1 16,8 :
Hungary : 32,1 31,4 29,4 28,2 29,6 29,9 31 :
Malta : 20,2 19,1 19,4 19,6 20,2 20,3 21,4 :
Netherlands : 16,7 16 15,7 14,9 15,1 15,1 15,7 :
Austria 17,5 16,8 17,8 16,7 18,6 17 16,6 16,9 :
Poland : 45,3 39,5 34,4 30,5 (b) 27,8 27,8 27,2 :
Portugal 27,5 26,1 25 25 26 24,9 25,3 24,4 :
Romania : : : 45,9 44,2 43,1 41,4 40,3 :
Slovenia : 18,5 17,1 17,1 18,5 17,1 18,3 19,3 :
Slovakia : 32 26,7 21,3 20,6 19,6 20,6 20,6 :
Finland 17,2 17,2 17,1 17,4 17,4 16,9 16,9 17,9 17,2
Sweden 16,9 14,4 16,3 13,9 14,9 15,9 15 16,1 :
United Kingdom : 24,8 23,7 22,6 23,2 22 23,2 22,7 :
Iceland 13,7 13,3 12,5 13 11,8 11,6 13,7 13,7 :
Norway 15,8 16,2 16,9 16,5 15 15,2 14,9 14,6 :
Switzerland : : : 18 18,6 17,2 17,2 17,2 :
Croatia : : : : : : 31,3 : :
Turkey : : 72,4 : : : : : :
:
Source of Data: Eurostat
:=not avai lable s=Eurostat estimate b=break in series p=provisional
People at risk of poverty or social exclusion (Percentage of total population)
The above table depicts the people at risk of poverty or social exclusion be-
tween the years 2004-2012, and compares the percentages of people at risk of pov-
erty and social exclusion among the 27 EU Member States from 2004 until 2011. The
above data can be categorised in four groups. The first group contains the East Euro-
pean countries: Bulgaria, Romania, Latvia, and Lithuania have the highest numbers
ranging from 38.1% to 61.3%. On the contrary, Estonia, Slovenia, Slovakia, countries
related in terms of geopolitics to the previous group, are in a much better position and
close to the EU average (23.4%-25.6%). The second group refers to the Northern and
Central European countries: Germany, France, UK, Belgium, Netherlands, Luxembourg,
Austria, Switzerland, Sweden, Denmark, Norway, Finland and Czech Republic are be-
low the EU average. The third group is about the Southern European countries: Italy,
44
Spain, Portugal, Malta ranging from 19.1% to 27.5%, numbers which bring them close
to the EU average. In the fourth group, Greece, Hungary and Ireland have percentages
slightly above the EU average, a fact that makes them a special group.
At this point, some individual country rates should be mentioned and high-
lighted. For example, Denmark remained fairly stabled until 2008, but since then its
numbers started to rise. Poland experienced a rapid drop from 45.3% to 27.2%. Lithu-
ania followed a decline until 2008, but since then has faced an increase up to 33.4%.
Greece had a constantly dropping route until 2010 and a substantial rise afterwards.
These findings and a recent study confirm that some countries are on track
with the targets and some others are off.71 For instance, the government in Sweden
has introduced measures to ensure social services and in Romania certain measures
have been taken in the area of education to improve its quality. Measures in relation
to health services are focused on cost reduction, and the modernisation of these ser-
vices and the improvement in infrastructure remains to be implemented. Issues in re-
gard to health services being reduced were of particular concern for people in rural
areas. Social housing has a reasonable budget; however, issues remain in regard to the
efficiency of these programmes. Slovakia indicated an issue in regard to the absence of
sufficient financial and legislative support provided to NGO’s who are central in provid-
ing services to the more vulnerable. Spain focused on the range of structures related
to homeless services indicating that there is a lack of attention given to addressing this
issue in the comprehensive manner required. Poland identified that there is work cur-
rently underway in relation to facilitating the development of housing for people at
risk of poverty. There may be risks attached to other reforms in regard to tenant’s
rights, as there will be no obligation to ensure access to council housing in instances
where individuals are evicted. Lithuania indicated that services for older people are
particularly poorly developed and require attention. Germany considered the services
to be of a generally good quality. In Luxembourg housing remains an issue with a lim-
ited number of social houses. In France reductions in regard to funding for housing and
emergency housing was seen as being of major concern. Access to health services for
the more vulnerable groups in society was considered to need immediate attention.
71
B. Nolan and C. T. Whelan, (2011) "The EU 2020 Poverty Target", UCD Geary Institute Discussion Paper, WP2011/11.
45
Belgium stated that overall there is still a lot of work required in domains like housing.
This is due to a general lack of affordable and adequate housing; groups at risk of pov-
erty and social exclusion tend to be disproportionately affected by this issue however,
and this is a focus of the National Reform Programme for Belgium. In UK, reforms to
the National Health Service are mainly structural and do not appear to address the
needs of the marginalised in society.
Given that the number of people at risk of poverty and social exclusion has in-
creased since 2008 in 13 out of the 23 Member States for which data are available in
2011, the European Commission proposes that additional efforts are needed to ensure
the effectiveness of social protection systems in countering the effects of the crisis, to
promote social inclusion and to prevent poverty.72 The proposals refer to active inclu-
sion strategies that should be developed, encompassing efficient and adequate in-
come support, measures to tackle poverty, including child poverty, as well as broad
access to affordable and high-quality services, such as social and health services, child-
care, housing and energy supply. The link between social assistance and activation
measures should be strengthened through more personalised services ("one-stop
shop") and efforts to improve the take-up of measures by vulnerable groups. Once the
labour market recovers, it will be important to phase out crisis-related measures,
while ensuring that essential safety nets are preserved.
Furthermore, according to the Commission, fairness is essential for the sustain-
ability and effectiveness of reforms. The crisis has already had a lasting impact on the
most disadvantaged within our society, with the share of people at risk of poverty in-
creasing in many countries. Member States need to invest in their human capital and
in providing their citizens with adequate services. There is also need for greater atten-
tion to the distributional impact of reforms to ensure that they produce lasting results
for the benefit of all. Several Member States need to pay more attention to combating
different forms of poverty – child poverty,73 homelessness, in-work poverty and over-
72
European Commission, (2010) Communication from the Commission to the European Parliament, The Council, The European Economic and social Committee and the Committee of the Regions, The Euro-pean Platform against Poverty and Social Exclusion: A European framework for social and territorial cohesion. 73
M. Tomlinson, & R. Walker, Coping with complexity: child and adult poverty. London: Child Poverty Action Group, 2009.
46
indebtedness of households – and to ensure the effectiveness of the welfare systems
that deal with those affected.74
Coming to the case of Greece, the financial crisis and the subsequent fiscal
consolidation measures had an impact on the country’s ability to meet the objectives
of the 'Europe 2020', in particular those related to employment and poverty. Although
the current status is 619.000 at risk of poverty or social exclusion, the aim of the 'Eu-
rope 2020' is to decrease it by 450,000 until 2020. The major challenge for Greece is to
design a long term strategy for combating poverty and social exclusion, the develop-
ment of administrative databases, monitoring and evaluation of planned and imple-
mented. In order to achieve the objective of increasing the effectiveness of social pol-
icy, efforts are focused on clarifying the responsibilities of ministries, simplifying the
structure and reducing the fragmentation of social policy. So far, Greece cannot fulfil
the objectives of the Europe 2020 strategy, due to the financial crisis and the austerity
program imposed on it. Nonetheless, Greece should, in cooperation with the European
Commission, look for ways and financial resources that will be directly and exclusively
targeted to addressing the issue. The precondition, however, in order for the Commis-
sion to find resources, is the credibility of social policy on the part of the Greek gov-
ernment. Thus, Greece should convince its European partners that these resources will
be utilized in a transparent and effective way. Another challenge for Greece is to seek
for new tools and policies, and to escape from current insufficient strategies.75
In conclusion, the new European strategy for poverty and social exclusion may
be regarded as a long-term feasible way to help European countries dampen the crisis'
effects and achieve social cohesion.76 However, the targets, policies and actions re-
quire careful thought. They should be in line with existing strategies and policy objec-
tives, and must be realistic. The key to this is to understand the links between them,
and to define them on the basis of a thorough analysis of the current situation and fu-
ture prospects.
74
European Commission, Annual Growth Survey 2013. 75
Hellenic Republic, Ministry of Finance. 76
European Commission (2013), Communication from the Commission to the European Parliament, The Council, The European Economic and social Committee and the Committee of the Regions, 2013 Euro-pean Semester: Country-Specific Recommendations. Moving Europe beyond the crisis.
47
In addition, no target, policy or action plan will be successful without credible
political commitment. To achieve this, the EU needs to mobilise all relevant actors and
bodies behind the strategy and apply stricter control over the process. As it has been
rightly pointed out, "it is a necessary condition for making the process credible and
meaningful, both politically and popularly. If the Social Partners are not fully engaged
in the process, then it will stand little chance of ultimate success. It is therefore crucial
that all aspects of the (national/sub-national and EU) work on social inclusion are as
open as possible to the active participation of the different non-governmental actors
and bodies involved in the fight against poverty and social exclusion, including social
partners, non-governmental and grass roots organisations (at EU, national and sub-
national levels), the socially excluded people themselves, and academics".77 Involving
national and regional policy-makers and citizens in the process, requiring Heads of
State and Government to commit themselves publicly to the national and European-
wide goals, and paying close attention to communicating the new strategy, are some
of the ways in which political will and national commitment can be enhanced.
One of the most pressing challenges for the EU is to deal with the Euro crisis
and support those countries that have been hit the most. In parallel, the Union needs
to set the ground for ensuring long-term growth in all European regions. Through the
EU budget, the European Commission intends to tackle these challenges by increasing
investments in research and innovation, providing the EU with the necessary infra-
structure, but in particular by ensuring the effectiveness of each Euro spent at Euro-
pean level. It is in this context that those changes that are likely to impact most on re-
gional and local authorities have that the proposals of the Commission remain vague,
e.g. the implementation of the ‘Partnership contracts’. The reduction of priorities, the
concentration of funding and the conditionality, risk that regional policy simply be-
comes an implementation tool for top down priorities which will be imposed on re-
gional and local authorities.
At the end of this part of the report some recommendations should be done
about the issue of poverty and social change be proposed, in particular to cohesion
policy. Unfortunately, the framework of the ‘Agenda 2020’ is exclusive in this area. For
77
E. Marlier, A.B. Atkinson, B. Cantillon and B. Nolan, The EU Social Inclusion: Facing the Challenges. Bristol: The Policy Press, 2007, 230.

48
instance, the issue of poverty and social exclusion and the policies to address it should
be framed in an integrated manner to include economic and social dimensions. More
is required than a focus that approaches these issues from an almost exclusively la-
bour market perspective. National Reform Programmes should be framed in a manner
which recognises the interdependence of economic development, social development
and environmental development. All National Reform Programmes should ensure that
all areas of active inclusion are addressed. This is particularly true in this context of
strategies aimed at achieving an adequate minimum income and quality services for
all. There is a need for more participation in terms of framing and developing the Na-
tional Reform Programmes. There should be a requirement to include and engage all
stakeholders. Coupled with this, Member States should be compelled to ensure suffi-
cient time is given to stakeholders to respond to and input into National Reform Pro-
grammes in a real and meaningful manner. There is also a need for Member States to
be encouraged to increase public debate in regard to the development of National Re-
form Programmes. In practice, a more deliberative approach is required where the
evidence is addressed by all stakeholders with the power differentials between these
stakeholders removed. A more comprehensive approach to monitoring the National
Reform Programmes is required. There is a need for the EU to further ensure that ad-
equate impact assessments are implemented to safeguard people who are at risk of
poverty and social exclusion from further marginalisation by the implementation of
reforms. The EU should address all areas of the National Reform Programmes, giving
equal importance to all headline targets. In particular the EU should ensure that pov-
erty and social exclusion are addressed by all Member States appropriately.
49
other ACIPE Reports
(open access)