Embed Size (px)
Citation preview
Interviews with 1,012 adult Americans conducted by telephone by ORC International on September 4 - 8, 2015. The margin of sampling error for results based on the total sample is plus or minus 3 percentage points. The sample also includes 930 interviews among registered voters (plus or minus 3 percentage points). This sample includes 612 interviews among landline respondents and 400 interviews among cell phone respondents.
EMBARGOED FOR RELEASE:
Sunday, September 13 at 8:30 a.m.
POLL 9 -2- September 4-8, 2015
3
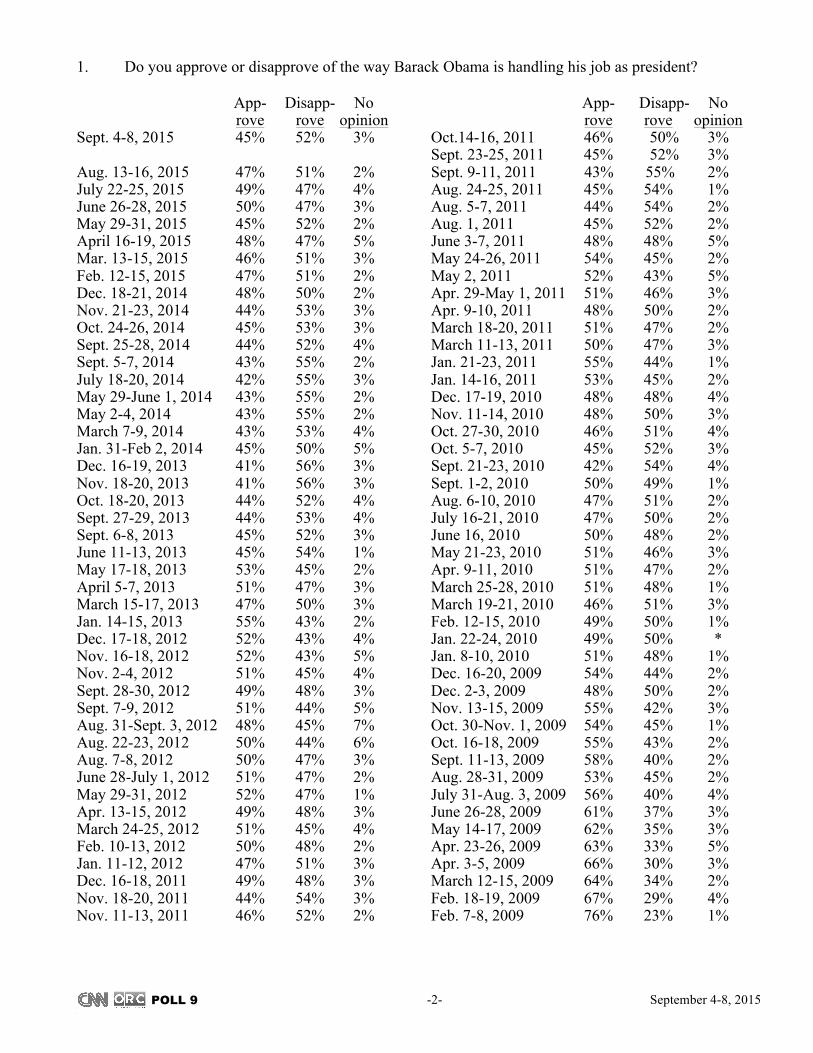
1. Do you approve or disapprove of the way Barack Obama is handling his job as president? App- Disapp- No rove rove opinion Sept. 4-8, 2015 45% 52% 3% Aug. 13-16, 2015 47% 51% 2% July 22-25, 2015 49% 47% 4% June 26-28, 2015 50% 47% 3% May 29-31, 2015 45% 52% 2% April 16-19, 2015 48% 47% 5% Mar. 13-15, 2015 46% 51% 3% Feb. 12-15, 2015 47% 51% 2% Dec. 18-21, 2014 48% 50% 2% Nov. 21-23, 2014 44% 53% 3% Oct. 24-26, 2014 45% 53% 3% Sept. 25-28, 2014 44% 52% 4% Sept. 5-7, 2014 43% 55% 2% July 18-20, 2014 42% 55% 3% May 29-June 1, 2014 43% 55% 2% May 2-4, 2014 43% 55% 2% March 7-9, 2014 43% 53% 4% Jan. 31-Feb 2, 2014 45% 50% 5% Dec. 16-19, 2013 41% 56% 3% Nov. 18-20, 2013 41% 56% 3% Oct. 18-20, 2013 44% 52% 4% Sept. 27-29, 2013 44% 53% 4% Sept. 6-8, 2013 45% 52% 3% June 11-13, 2013 45% 54% 1% May 17-18, 2013 53% 45% 2% April 5-7, 2013 51% 47% 3% March 15-17, 2013 47% 50% 3% Jan. 14-15, 2013 55% 43% 2% Dec. 17-18, 2012 52% 43% 4% Nov. 16-18, 2012 52% 43% 5% Nov. 2-4, 2012 51% 45% 4% Sept. 28-30, 2012 49% 48% 3% Sept. 7-9, 2012 51% 44% 5% Aug. 31-Sept. 3, 2012 48% 45% 7% Aug. 22-23, 2012 50% 44% 6% Aug. 7-8, 2012 50% 47% 3% June 28-July 1, 2012 51% 47% 2% May 29-31, 2012 52% 47% 1% Apr. 13-15, 2012 49% 48% 3% March 24-25, 2012 51% 45% 4% Feb. 10-13, 2012 50% 48% 2% Jan. 11-12, 2012 47% 51% 3% Dec. 16-18, 2011 49% 48% 3% Nov. 18-20, 2011 44% 54% 3% Nov. 11-13, 2011 46% 52% 2%
App- Disapp- No rove rove opinion Oct.14-16, 2011 46% 50% 3% Sept. 23-25, 2011 45% 52% 3% Sept. 9-11, 2011 43% 55% 2% Aug. 24-25, 2011 45% 54% 1% Aug. 5-7, 2011 44% 54% 2% Aug. 1, 2011 45% 52% 2% June 3-7, 2011 48% 48% 5% May 24-26, 2011 54% 45% 2% May 2, 2011 52% 43% 5% Apr. 29-May 1, 2011 51% 46% 3% Apr. 9-10, 2011 48% 50% 2% March 18-20, 2011 51% 47% 2% March 11-13, 2011 50% 47% 3% Jan. 21-23, 2011 55% 44% 1% Jan. 14-16, 2011 53% 45% 2% Dec. 17-19, 2010 48% 48% 4% Nov. 11-14, 2010 48% 50% 3% Oct. 27-30, 2010 46% 51% 4% Oct. 5-7, 2010 45% 52% 3% Sept. 21-23, 2010 42% 54% 4% Sept. 1-2, 2010 50% 49% 1% Aug. 6-10, 2010 47% 51% 2% July 16-21, 2010 47% 50% 2% June 16, 2010 50% 48% 2% May 21-23, 2010 51% 46% 3% Apr. 9-11, 2010 51% 47% 2% March 25-28, 2010 51% 48% 1% March 19-21, 2010 46% 51% 3% Feb. 12-15, 2010 49% 50% 1% Jan. 22-24, 2010 49% 50% * Jan. 8-10, 2010 51% 48% 1% Dec. 16-20, 2009 54% 44% 2% Dec. 2-3, 2009 48% 50% 2% Nov. 13-15, 2009 55% 42% 3% Oct. 30-Nov. 1, 2009 54% 45% 1% Oct. 16-18, 2009 55% 43% 2% Sept. 11-13, 2009 58% 40% 2% Aug. 28-31, 2009 53% 45% 2% July 31-Aug. 3, 2009 56% 40% 4% June 26-28, 2009 61% 37% 3% May 14-17, 2009 62% 35% 3% Apr. 23-26, 2009 63% 33% 5% Apr. 3-5, 2009 66% 30% 3% March 12-15, 2009 64% 34% 2% Feb. 18-19, 2009 67% 29% 4% Feb. 7-8, 2009 76% 23% 1%
POLL 9 -3- September 4-8, 2015
3
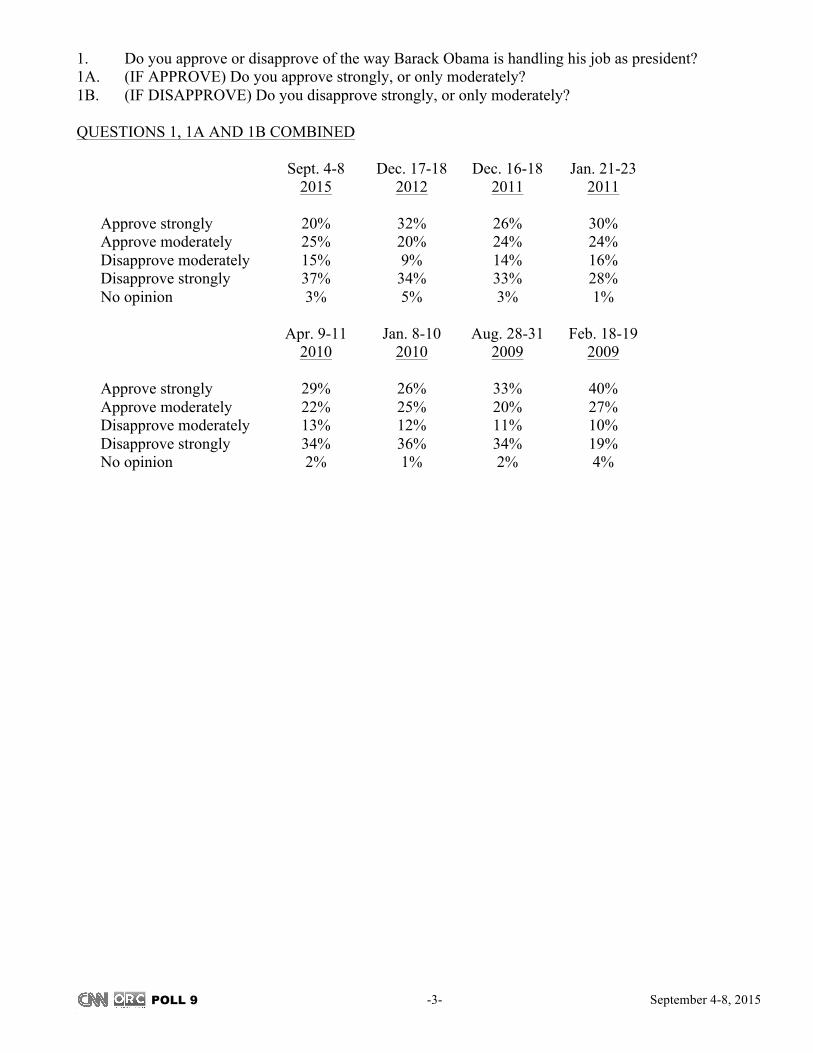
1. Do you approve or disapprove of the way Barack Obama is handling his job as president? 1A. (IF APPROVE) Do you approve strongly, or only moderately? 1B. (IF DISAPPROVE) Do you disapprove strongly, or only moderately? QUESTIONS 1, 1A AND 1B COMBINED Sept. 4-8 Dec. 17-18 Dec. 16-18 Jan. 21-23 2015 2012 2011 2011 Approve strongly 20% 32% 26% 30% Approve moderately 25% 20% 24% 24% Disapprove moderately 15% 9% 14% 16% Disapprove strongly 37% 34% 33% 28% No opinion 3% 5% 3% 1%
Apr. 9-11 Jan. 8-10 Aug. 28-31 Feb. 18-19 2010 2010 2009 2009 Approve strongly 29% 26% 33% 40% Approve moderately 22% 25% 20% 27% Disapprove moderately 13% 12% 11% 10% Disapprove strongly 34% 36% 34% 19% No opinion 2% 1% 2% 4%
POLL 9 -4- September 4-8, 2015
3
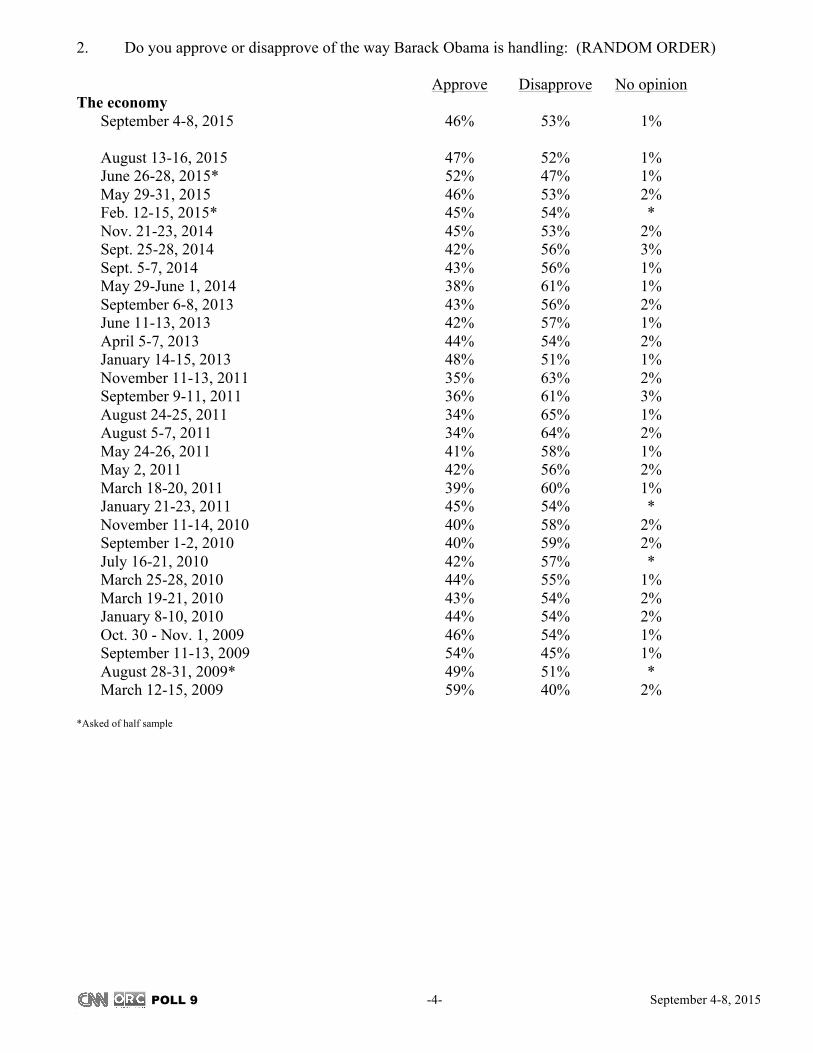
2. Do you approve or disapprove of the way Barack Obama is handling: (RANDOM ORDER) Approve Disapprove No opinion
The economy September 4-8, 2015 46% 53% 1% August 13-16, 2015 47% 52% 1% June 26-28, 2015* 52% 47% 1% May 29-31, 2015 46% 53% 2% Feb. 12-15, 2015* 45% 54% * Nov. 21-23, 2014 45% 53% 2% Sept. 25-28, 2014 42% 56% 3% Sept. 5-7, 2014 43% 56% 1% May 29-June 1, 2014 38% 61% 1% September 6-8, 2013 43% 56% 2% June 11-13, 2013 42% 57% 1% April 5-7, 2013 44% 54% 2% January 14-15, 2013 48% 51% 1% November 11-13, 2011 35% 63% 2% September 9-11, 2011 36% 61% 3% August 24-25, 2011 34% 65% 1% August 5-7, 2011 34% 64% 2% May 24-26, 2011 41% 58% 1% May 2, 2011 42% 56% 2% March 18-20, 2011 39% 60% 1% January 21-23, 2011 45% 54% * November 11-14, 2010 40% 58% 2% September 1-2, 2010 40% 59% 2% July 16-21, 2010 42% 57% * March 25-28, 2010 44% 55% 1% March 19-21, 2010 43% 54% 2% January 8-10, 2010 44% 54% 2% Oct. 30 - Nov. 1, 2009 46% 54% 1% September 11-13, 2009 54% 45% 1% August 28-31, 2009* 49% 51% * March 12-15, 2009 59% 40% 2% *Asked of half sample
POLL 9 -5- September 4-8, 2015
3
2. Do you approve or disapprove of the way Barack Obama is handling: (ASKED OF HALF SAMPLE. RESULTS BASED ON 509 INTERVIEWS IN VERSION A. SAMPLING ERROR: +/- 4.5 PERCENTAGE POINTS.) (RANDOM ORDER)
Approve Disapprove No opinion
The U.S. relationship with Iran September 4-8, 2015 37% 59% 4% August 13-16, 2015 38% 60% 3% June 26-28, 2015* 38% 58% 4% April 16-19, 2015 48% 48% 4% *Asked of half sample 2. Do you approve or disapprove of the way Barack Obama is handling: (ASKED OF HALF SAMPLE.
RESULTS BASED ON 503 INTERVIEWS IN VERSION B. SAMPLING ERROR: +/- 4.5 PERCENTAGE POINTS.) (RANDOM ORDER)
Approve Disapprove No opinion
Foreign affairs September 4-8, 2015 42% 55% 3% August 13-16, 2015 43% 56% 1% May 29-31, 2015* 43% 55% 2% Feb. 12-15, 2015* 41% 57% 1% Nov. 21-23, 2014 42% 54% 3% Sept. 25-28, 2014 42% 54% 4% Sept. 5-7, 2014 40% 57% 3% May 29-June 1, 2014 40% 57% 3% September 6-8, 2013 40% 57% 3% June 11-13, 2013 44% 54% 2% April 5-7, 2013 49% 48% 4% January 14-15, 2013 54% 42% 4% September 9-11, 2011 47% 50% 3% August 24-25, 2011 50% 47% 3% August 5-7, 2011 47% 50% 3% March 18-20, 2011 54% 43% 3% January 21-23, 2011 57% 40% 3% November 11-14, 2010 49% 46% 5% March 25-28, 2010 51% 44% 4% January 8-10, 2010 51% 46% 3% Oct. 30 - Nov. 1, 2009 51% 47% 2% September 11-13, 2009 58% 38% 4% August 28-31, 2009* 54% 42% 3% March 12-15, 2009 66% 28% 6% *Asked of half sample
POLL 9 -6- September 4-8, 2015
3
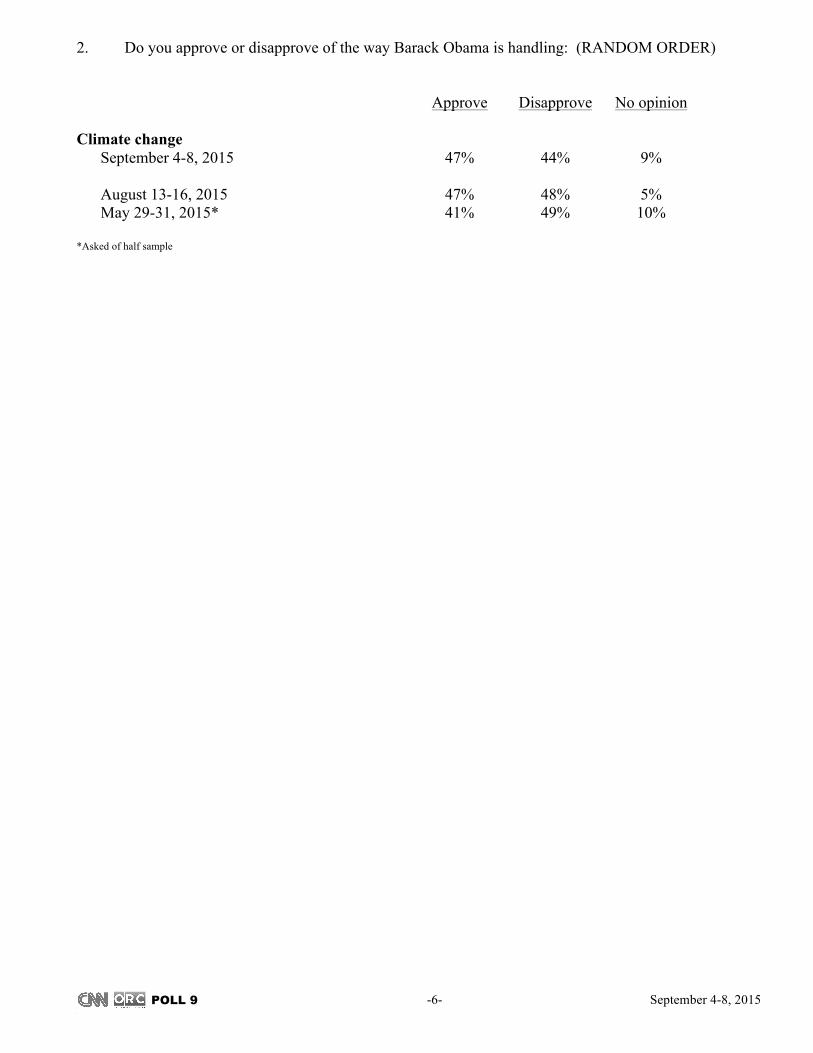
2. Do you approve or disapprove of the way Barack Obama is handling: (RANDOM ORDER) Approve Disapprove No opinion Climate change September 4-8, 2015 47% 44% 9% August 13-16, 2015 47% 48% 5% May 29-31, 2015* 41% 49% 10% *Asked of half sample
POLL 9 -7- September 4-8, 2015
3
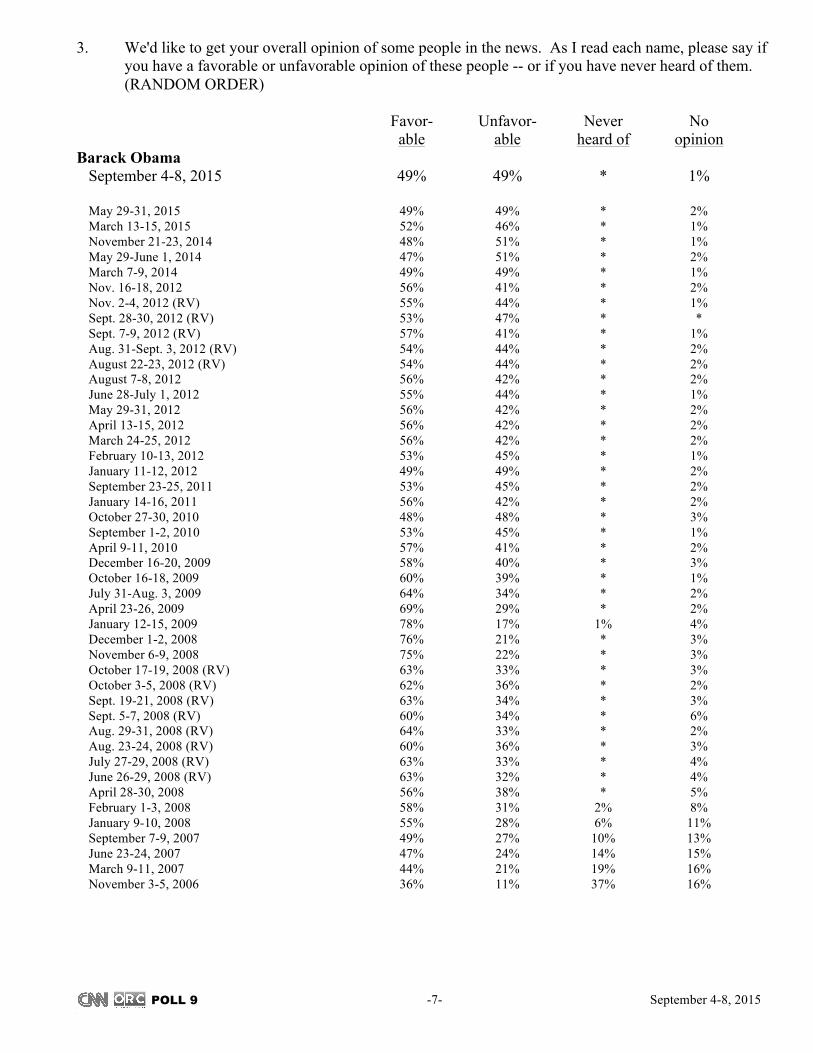
3. We'd like to get your overall opinion of some people in the news. As I read each name, please say if you have a favorable or unfavorable opinion of these people -- or if you have never heard of them. (RANDOM ORDER)
Favor- Unfavor- Never No able able heard of opinion Barack Obama
September 4-8, 2015 49% 49% * 1% May 29-31, 2015 49% 49% * 2% March 13-15, 2015 52% 46% * 1% November 21-23, 2014 48% 51% * 1% May 29-June 1, 2014 47% 51% * 2% March 7-9, 2014 49% 49% * 1% Nov. 16-18, 2012 56% 41% * 2% Nov. 2-4, 2012 (RV) 55% 44% * 1% Sept. 28-30, 2012 (RV) 53% 47% * * Sept. 7-9, 2012 (RV) 57% 41% * 1% Aug. 31-Sept. 3, 2012 (RV) 54% 44% * 2% August 22-23, 2012 (RV) 54% 44% * 2% August 7-8, 2012 56% 42% * 2% June 28-July 1, 2012 55% 44% * 1% May 29-31, 2012 56% 42% * 2% April 13-15, 2012 56% 42% * 2% March 24-25, 2012 56% 42% * 2% February 10-13, 2012 53% 45% * 1% January 11-12, 2012 49% 49% * 2% September 23-25, 2011 53% 45% * 2% January 14-16, 2011 56% 42% * 2% October 27-30, 2010 48% 48% * 3% September 1-2, 2010 53% 45% * 1% April 9-11, 2010 57% 41% * 2% December 16-20, 2009 58% 40% * 3% October 16-18, 2009 60% 39% * 1% July 31-Aug. 3, 2009 64% 34% * 2% April 23-26, 2009 69% 29% * 2% January 12-15, 2009 78% 17% 1% 4% December 1-2, 2008 76% 21% * 3% November 6-9, 2008 75% 22% * 3% October 17-19, 2008 (RV) 63% 33% * 3% October 3-5, 2008 (RV) 62% 36% * 2% Sept. 19-21, 2008 (RV) 63% 34% * 3% Sept. 5-7, 2008 (RV) 60% 34% * 6% Aug. 29-31, 2008 (RV) 64% 33% * 2% Aug. 23-24, 2008 (RV) 60% 36% * 3% July 27-29, 2008 (RV) 63% 33% * 4% June 26-29, 2008 (RV) 63% 32% * 4% April 28-30, 2008 56% 38% * 5% February 1-3, 2008 58% 31% 2% 8% January 9-10, 2008 55% 28% 6% 11% September 7-9, 2007 49% 27% 10% 13% June 23-24, 2007 47% 24% 14% 15% March 9-11, 2007 44% 21% 19% 16% November 3-5, 2006 36% 11% 37% 16%
POLL 9 -8- September 4-8, 2015
3
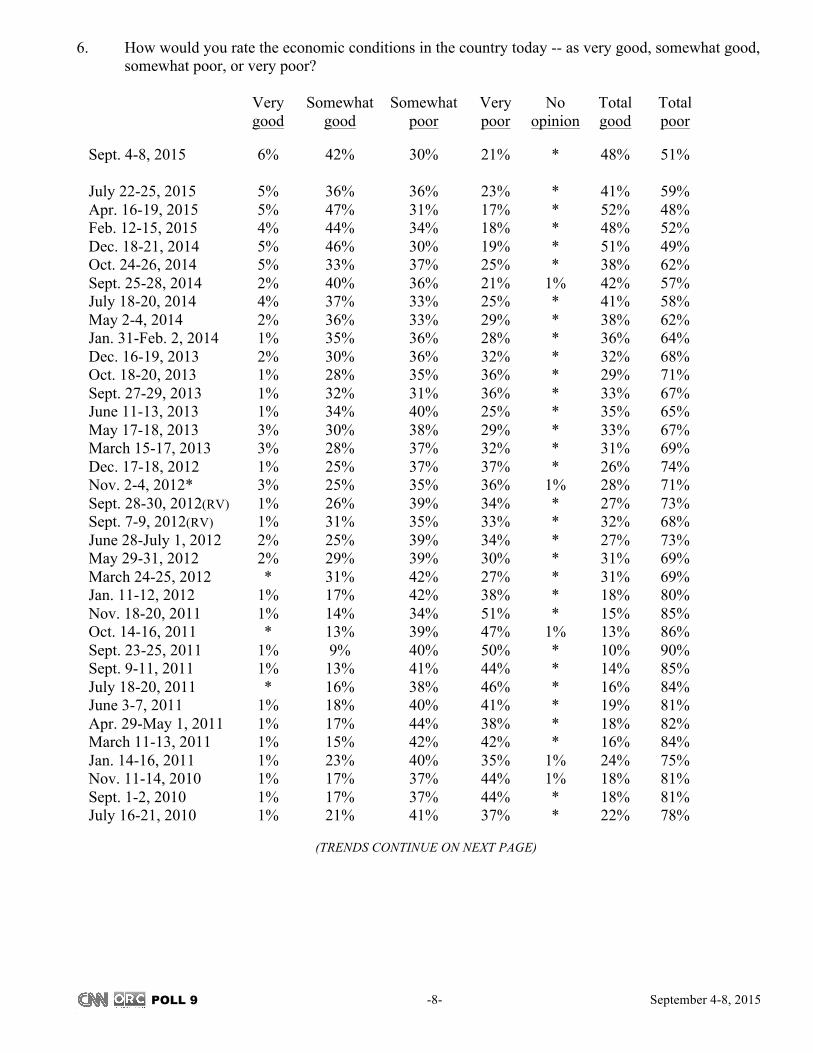
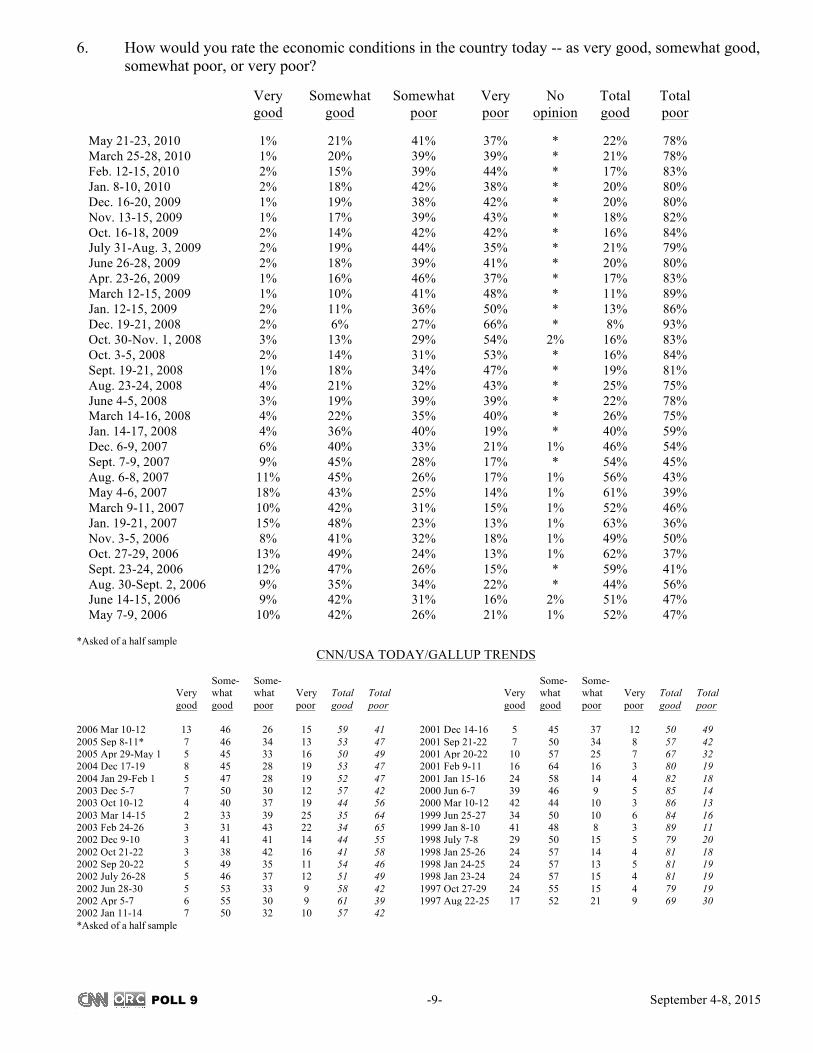
6. How would you rate the economic conditions in the country today -- as very good, somewhat good, somewhat poor, or very poor?
Very Somewhat Somewhat Very No Total Total good good poor poor opinion good poor Sept. 4-8, 2015 6% 42% 30% 21% * 48% 51% July 22-25, 2015 5% 36% 36% 23% * 41% 59% Apr. 16-19, 2015 5% 47% 31% 17% * 52% 48% Feb. 12-15, 2015 4% 44% 34% 18% * 48% 52% Dec. 18-21, 2014 5% 46% 30% 19% * 51% 49% Oct. 24-26, 2014 5% 33% 37% 25% * 38% 62% Sept. 25-28, 2014 2% 40% 36% 21% 1% 42% 57% July 18-20, 2014 4% 37% 33% 25% * 41% 58% May 2-4, 2014 2% 36% 33% 29% * 38% 62% Jan. 31-Feb. 2, 2014 1% 35% 36% 28% * 36% 64% Dec. 16-19, 2013 2% 30% 36% 32% * 32% 68% Oct. 18-20, 2013 1% 28% 35% 36% * 29% 71% Sept. 27-29, 2013 1% 32% 31% 36% * 33% 67% June 11-13, 2013 1% 34% 40% 25% * 35% 65% May 17-18, 2013 3% 30% 38% 29% * 33% 67% March 15-17, 2013 3% 28% 37% 32% * 31% 69% Dec. 17-18, 2012 1% 25% 37% 37% * 26% 74% Nov. 2-4, 2012* 3% 25% 35% 36% 1% 28% 71% Sept. 28-30, 2012(RV) 1% 26% 39% 34% * 27% 73% Sept. 7-9, 2012(RV) 1% 31% 35% 33% * 32% 68% June 28-July 1, 2012 2% 25% 39% 34% * 27% 73% May 29-31, 2012 2% 29% 39% 30% * 31% 69% March 24-25, 2012 * 31% 42% 27% * 31% 69% Jan. 11-12, 2012 1% 17% 42% 38% * 18% 80% Nov. 18-20, 2011 1% 14% 34% 51% * 15% 85% Oct. 14-16, 2011 * 13% 39% 47% 1% 13% 86% Sept. 23-25, 2011 1% 9% 40% 50% * 10% 90% Sept. 9-11, 2011 1% 13% 41% 44% * 14% 85% July 18-20, 2011 * 16% 38% 46% * 16% 84% June 3-7, 2011 1% 18% 40% 41% * 19% 81% Apr. 29-May 1, 2011 1% 17% 44% 38% * 18% 82% March 11-13, 2011 1% 15% 42% 42% * 16% 84% Jan. 14-16, 2011 1% 23% 40% 35% 1% 24% 75% Nov. 11-14, 2010 1% 17% 37% 44% 1% 18% 81% Sept. 1-2, 2010 1% 17% 37% 44% * 18% 81% July 16-21, 2010 1% 21% 41% 37% * 22% 78%
(TRENDS CONTINUE ON NEXT PAGE)
POLL 9 -9- September 4-8, 2015
3
6. How would you rate the economic conditions in the country today -- as very good, somewhat good, somewhat poor, or very poor?
Very Somewhat Somewhat Very No Total Total good good poor poor opinion good poor May 21-23, 2010 1% 21% 41% 37% * 22% 78% March 25-28, 2010 1% 20% 39% 39% * 21% 78% Feb. 12-15, 2010 2% 15% 39% 44% * 17% 83% Jan. 8-10, 2010 2% 18% 42% 38% * 20% 80% Dec. 16-20, 2009 1% 19% 38% 42% * 20% 80% Nov. 13-15, 2009 1% 17% 39% 43% * 18% 82% Oct. 16-18, 2009 2% 14% 42% 42% * 16% 84% July 31-Aug. 3, 2009 2% 19% 44% 35% * 21% 79% June 26-28, 2009 2% 18% 39% 41% * 20% 80% Apr. 23-26, 2009 1% 16% 46% 37% * 17% 83% March 12-15, 2009 1% 10% 41% 48% * 11% 89% Jan. 12-15, 2009 2% 11% 36% 50% * 13% 86% Dec. 19-21, 2008 2% 6% 27% 66% * 8% 93% Oct. 30-Nov. 1, 2008 3% 13% 29% 54% 2% 16% 83% Oct. 3-5, 2008 2% 14% 31% 53% * 16% 84% Sept. 19-21, 2008 1% 18% 34% 47% * 19% 81% Aug. 23-24, 2008 4% 21% 32% 43% * 25% 75% June 4-5, 2008 3% 19% 39% 39% * 22% 78% March 14-16, 2008 4% 22% 35% 40% * 26% 75% Jan. 14-17, 2008 4% 36% 40% 19% * 40% 59% Dec. 6-9, 2007 6% 40% 33% 21% 1% 46% 54% Sept. 7-9, 2007 9% 45% 28% 17% * 54% 45% Aug. 6-8, 2007 11% 45% 26% 17% 1% 56% 43% May 4-6, 2007 18% 43% 25% 14% 1% 61% 39% March 9-11, 2007 10% 42% 31% 15% 1% 52% 46% Jan. 19-21, 2007 15% 48% 23% 13% 1% 63% 36% Nov. 3-5, 2006 8% 41% 32% 18% 1% 49% 50% Oct. 27-29, 2006 13% 49% 24% 13% 1% 62% 37% Sept. 23-24, 2006 12% 47% 26% 15% * 59% 41% Aug. 30-Sept. 2, 2006 9% 35% 34% 22% * 44% 56% June 14-15, 2006 9% 42% 31% 16% 2% 51% 47% May 7-9, 2006 10% 42% 26% 21% 1% 52% 47% *Asked of a half sample
CNN/USA TODAY/GALLUP TRENDS
Very good
Some- what good
Some- what poor
Very poor
Total good
Total poor
Very good
Some- what good
Some- what poor
Very poor
Total good
Total poor
2006 Mar 10-12 13 46 26 15 59 41 2001 Dec 14-16 5 45 37 12 50 49 2005 Sep 8-11* 7 46 34 13 53 47 2001 Sep 21-22 7 50 34 8 57 42 2005 Apr 29-May 1 5 45 33 16 50 49 2001 Apr 20-22 10 57 25 7 67 32 2004 Dec 17-19 8 45 28 19 53 47 2001 Feb 9-11 16 64 16 3 80 19 2004 Jan 29-Feb 1 5 47 28 19 52 47 2001 Jan 15-16 24 58 14 4 82 18 2003 Dec 5-7 7 50 30 12 57 42 2000 Jun 6-7 39 46 9 5 85 14 2003 Oct 10-12 4 40 37 19 44 56 2000 Mar 10-12 42 44 10 3 86 13 2003 Mar 14-15 2 33 39 25 35 64 1999 Jun 25-27 34 50 10 6 84 16 2003 Feb 24-26 3 31 43 22 34 65 1999 Jan 8-10 41 48 8 3 89 11 2002 Dec 9-10 3 41 41 14 44 55 1998 July 7-8 29 50 15 5 79 20 2002 Oct 21-22 3 38 42 16 41 58 1998 Jan 25-26 24 57 14 4 81 18 2002 Sep 20-22 5 49 35 11 54 46 1998 Jan 24-25 24 57 13 5 81 19 2002 July 26-28 5 46 37 12 51 49 1998 Jan 23-24 24 57 15 4 81 19 2002 Jun 28-30 5 53 33 9 58 42 1997 Oct 27-29 24 55 15 4 79 19 2002 Apr 5-7 6 55 30 9 61 39 1997 Aug 22-25 17 52 21 9 69 30 2002 Jan 11-14 7 50 32 10 57 42
*Asked of a half sample
POLL 9 -10- September 4-8, 2015
3
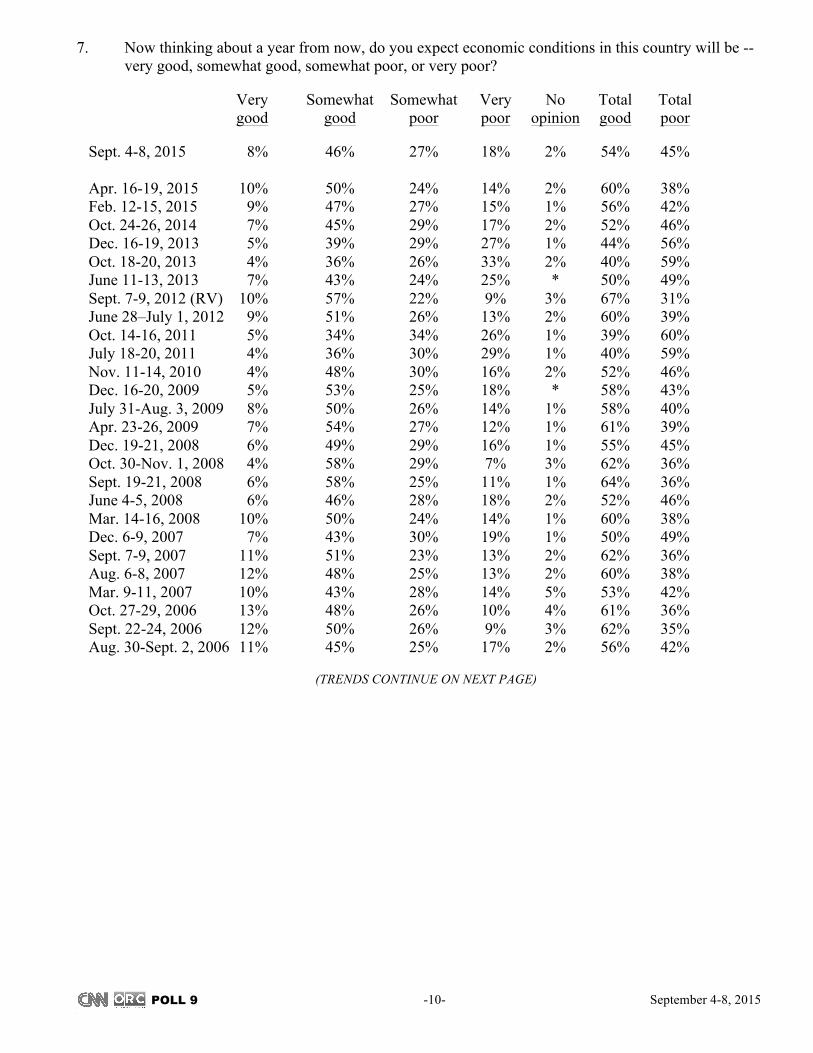
7. Now thinking about a year from now, do you expect economic conditions in this country will be -- very good, somewhat good, somewhat poor, or very poor?
Very Somewhat Somewhat Very No Total Total good good poor poor opinion good poor Sept. 4-8, 2015 8% 46% 27% 18% 2% 54% 45% Apr. 16-19, 2015 10% 50% 24% 14% 2% 60% 38% Feb. 12-15, 2015 9% 47% 27% 15% 1% 56% 42% Oct. 24-26, 2014 7% 45% 29% 17% 2% 52% 46% Dec. 16-19, 2013 5% 39% 29% 27% 1% 44% 56% Oct. 18-20, 2013 4% 36% 26% 33% 2% 40% 59% June 11-13, 2013 7% 43% 24% 25% * 50% 49% Sept. 7-9, 2012 (RV) 10% 57% 22% 9% 3% 67% 31% June 28–July 1, 2012 9% 51% 26% 13% 2% 60% 39% Oct. 14-16, 2011 5% 34% 34% 26% 1% 39% 60% July 18-20, 2011 4% 36% 30% 29% 1% 40% 59% Nov. 11-14, 2010 4% 48% 30% 16% 2% 52% 46% Dec. 16-20, 2009 5% 53% 25% 18% * 58% 43% July 31-Aug. 3, 2009 8% 50% 26% 14% 1% 58% 40% Apr. 23-26, 2009 7% 54% 27% 12% 1% 61% 39% Dec. 19-21, 2008 6% 49% 29% 16% 1% 55% 45% Oct. 30-Nov. 1, 2008 4% 58% 29% 7% 3% 62% 36% Sept. 19-21, 2008 6% 58% 25% 11% 1% 64% 36% June 4-5, 2008 6% 46% 28% 18% 2% 52% 46% Mar. 14-16, 2008 10% 50% 24% 14% 1% 60% 38% Dec. 6-9, 2007 7% 43% 30% 19% 1% 50% 49% Sept. 7-9, 2007 11% 51% 23% 13% 2% 62% 36% Aug. 6-8, 2007 12% 48% 25% 13% 2% 60% 38% Mar. 9-11, 2007 10% 43% 28% 14% 5% 53% 42% Oct. 27-29, 2006 13% 48% 26% 10% 4% 61% 36% Sept. 22-24, 2006 12% 50% 26% 9% 3% 62% 35% Aug. 30-Sept. 2, 2006 11% 45% 25% 17% 2% 56% 42%
(TRENDS CONTINUE ON NEXT PAGE)
POLL 9 -11- September 4-8, 2015
3
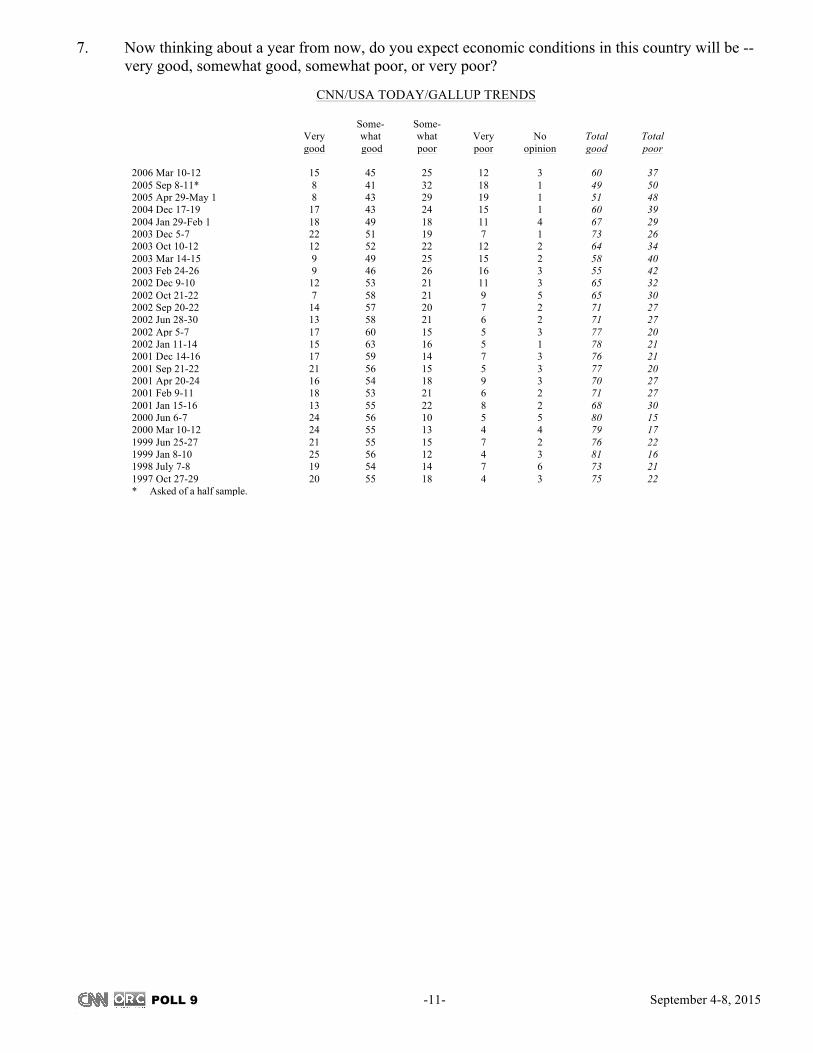
7. Now thinking about a year from now, do you expect economic conditions in this country will be -- very good, somewhat good, somewhat poor, or very poor?
CNN/USA TODAY/GALLUP TRENDS
Very good
Some-what good
Some-what poor
Very poor
No
opinion
Total good
Total poor
2006 Mar 10-12 15 45 25 12 3 60 37 2005 Sep 8-11* 8 41 32 18 1 49 50 2005 Apr 29-May 1 8 43 29 19 1 51 48 2004 Dec 17-19 17 43 24 15 1 60 39 2004 Jan 29-Feb 1 18 49 18 11 4 67 29 2003 Dec 5-7 22 51 19 7 1 73 26 2003 Oct 10-12 12 52 22 12 2 64 34 2003 Mar 14-15 9 49 25 15 2 58 40 2003 Feb 24-26 9 46 26 16 3 55 42 2002 Dec 9-10 12 53 21 11 3 65 32 2002 Oct 21-22 7 58 21 9 5 65 30 2002 Sep 20-22 14 57 20 7 2 71 27 2002 Jun 28-30 13 58 21 6 2 71 27 2002 Apr 5-7 17 60 15 5 3 77 20 2002 Jan 11-14 15 63 16 5 1 78 21 2001 Dec 14-16 17 59 14 7 3 76 21 2001 Sep 21-22 21 56 15 5 3 77 20 2001 Apr 20-24 16 54 18 9 3 70 27 2001 Feb 9-11 18 53 21 6 2 71 27 2001 Jan 15-16 13 55 22 8 2 68 30 2000 Jun 6-7 24 56 10 5 5 80 15 2000 Mar 10-12 24 55 13 4 4 79 17 1999 Jun 25-27 21 55 15 7 2 76 22 1999 Jan 8-10 25 56 12 4 3 81 16 1998 July 7-8 19 54 14 7 6 73 21 1997 Oct 27-29 20 55 18 4 3 75 22 * Asked of a half sample.
POLL 9 -12- September 4-8, 2015
3
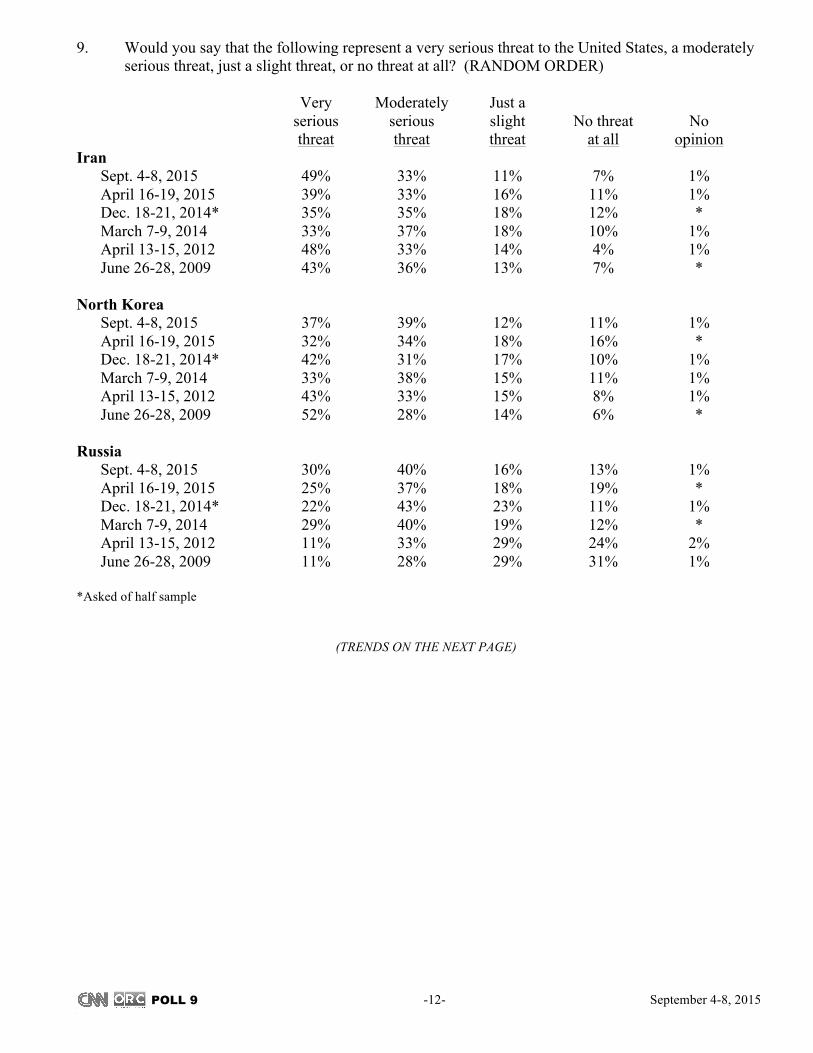
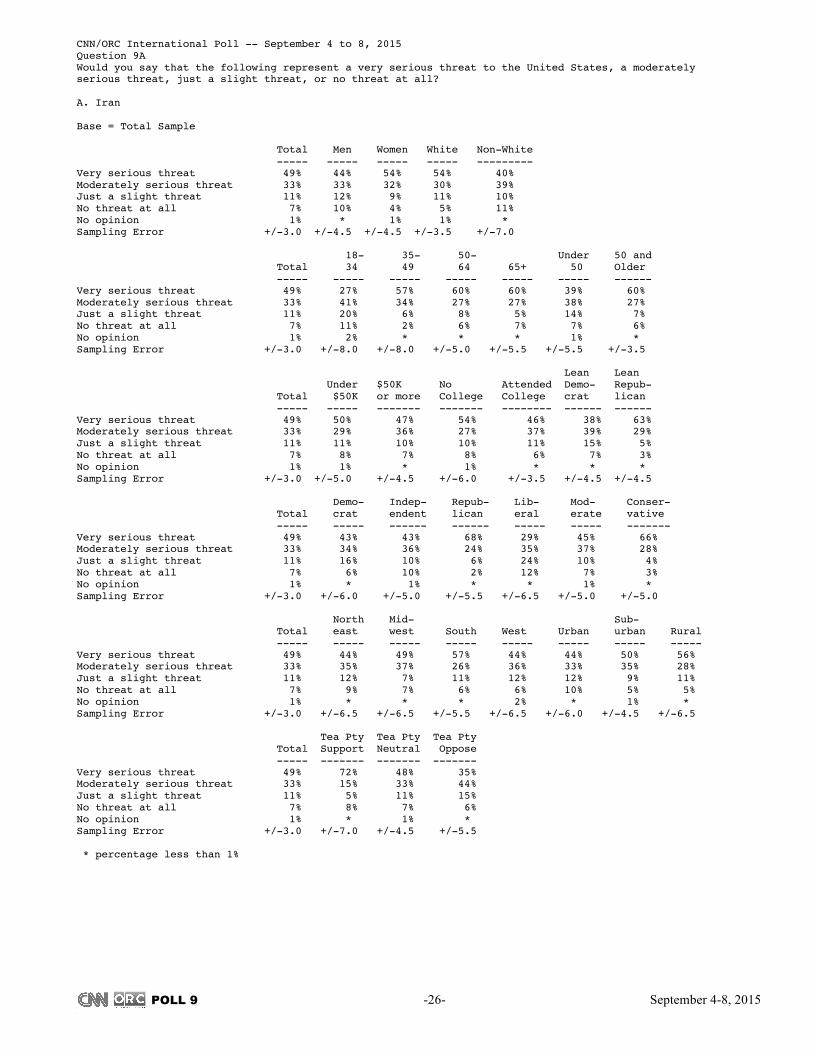
9. Would you say that the following represent a very serious threat to the United States, a moderately serious threat, just a slight threat, or no threat at all? (RANDOM ORDER)
Very Moderately Just a serious serious slight No threat No threat threat threat at all opinion Iran
Sept. 4-8, 2015 49% 33% 11% 7% 1% April 16-19, 2015 39% 33% 16% 11% 1% Dec. 18-21, 2014* 35% 35% 18% 12% * March 7-9, 2014 33% 37% 18% 10% 1% April 13-15, 2012 48% 33% 14% 4% 1% June 26-28, 2009 43% 36% 13% 7% *
North Korea
Sept. 4-8, 2015 37% 39% 12% 11% 1% April 16-19, 2015 32% 34% 18% 16% * Dec. 18-21, 2014* 42% 31% 17% 10% 1% March 7-9, 2014 33% 38% 15% 11% 1% April 13-15, 2012 43% 33% 15% 8% 1% June 26-28, 2009 52% 28% 14% 6% *
Russia
Sept. 4-8, 2015 30% 40% 16% 13% 1% April 16-19, 2015 25% 37% 18% 19% * Dec. 18-21, 2014* 22% 43% 23% 11% 1% March 7-9, 2014 29% 40% 19% 12% * April 13-15, 2012 11% 33% 29% 24% 2% June 26-28, 2009 11% 28% 29% 31% 1%
*Asked of half sample
(TRENDS ON THE NEXT PAGE)
POLL 9 -13- September 4-8, 2015
3
CNN/TIME TRENDS
Very
serious Moderately
serious Slight threat
Not a threat
No opinion
Iran January 15-16, 2003 35 31 19 13 2 May 22-23, 2002 50 30 10 8 2 June 14-15, 2000 29 36 18 11 6 May 26-27, 1999 27 32 20 15 6 May 8-9, 1996 29 36 19 10 6
North Korea
January 15-16, 2003 45 31 13 9 2 May 22-23, 2002 19 27 23 26 5 June 14-15, 2000 17 29 23 20 11
Russia January 15-16, 2003 11 25 27 34 3 May 22-23, 2002 7 24 25 41 3 June 14-15, 2000 19 33 24 18 6 May 26-27, 1999 24 33 20 20 3 May 8-9, 1996 14 36 23 24 3 November, 1989* 19 36 23 18 4 November, 1985* 32 44 17 5 2 December, 1983* 49 39 7 3 2 September, 1983* 52 35 10 2 1 June, 1983* 65 25 6 3 1
* Russia was asked as the "Soviet Union" from 1983 to 1989. ** China was asked as "Communist China" in 1983
POLL 9 -14- September 4-8, 2015
3
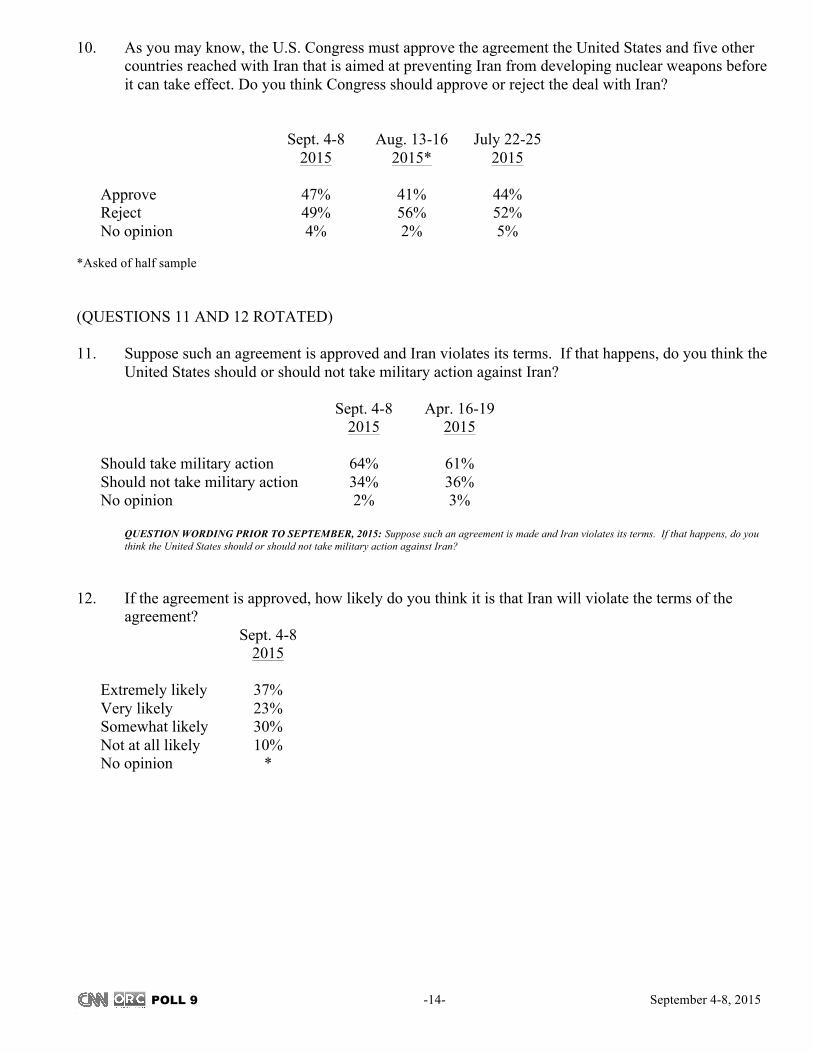
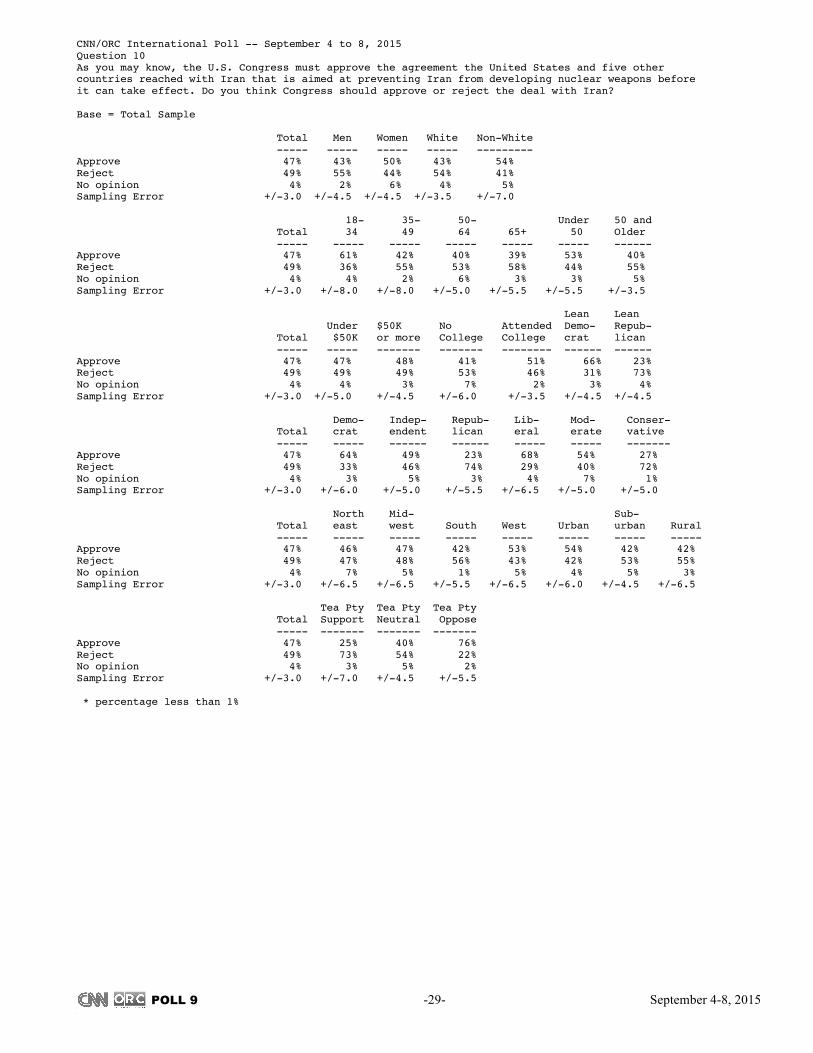
10. As you may know, the U.S. Congress must approve the agreement the United States and five other countries reached with Iran that is aimed at preventing Iran from developing nuclear weapons before it can take effect. Do you think Congress should approve or reject the deal with Iran?
Sept. 4-8 Aug. 13-16 July 22-25 2015 2015* 2015 Approve 47% 41% 44% Reject 49% 56% 52% No opinion 4% 2% 5%
*Asked of half sample
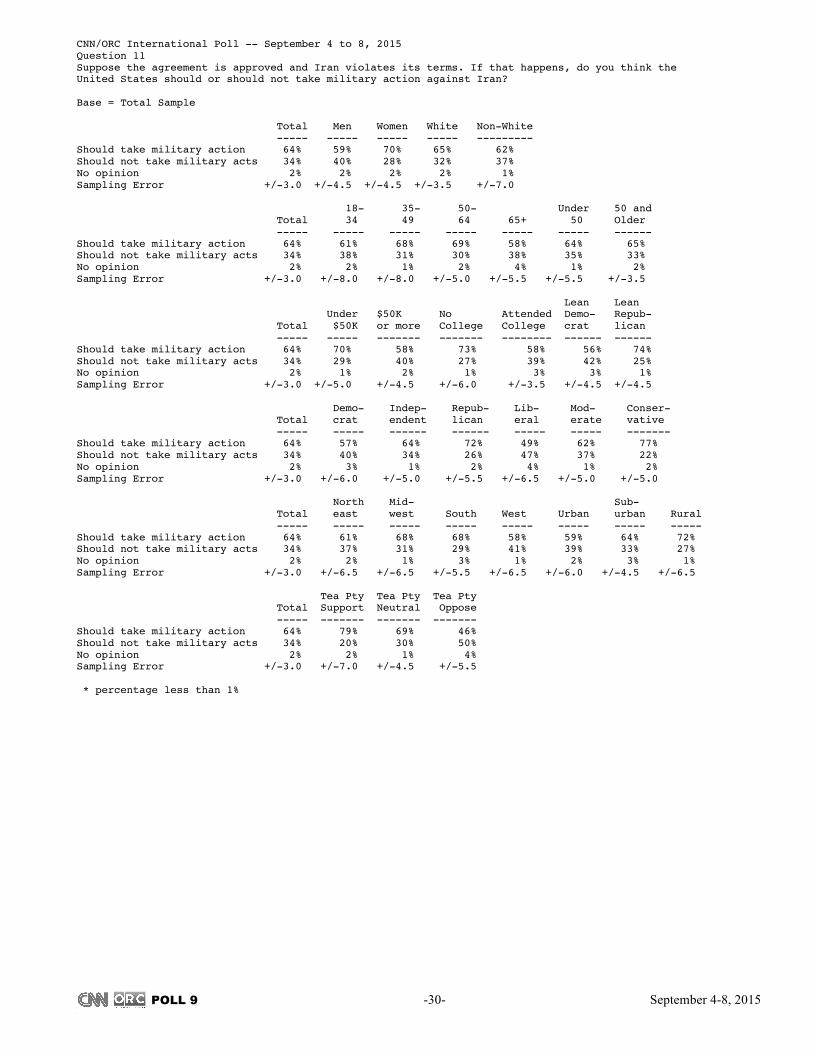
(QUESTIONS 11 AND 12 ROTATED) 11. Suppose such an agreement is approved and Iran violates its terms. If that happens, do you think the
United States should or should not take military action against Iran? Sept. 4-8 Apr. 16-19 2015 2015 Should take military action 64% 61% Should not take military action 34% 36% No opinion 2% 3% QUESTION WORDING PRIOR TO SEPTEMBER, 2015: Suppose such an agreement is made and Iran violates its terms. If that happens, do you
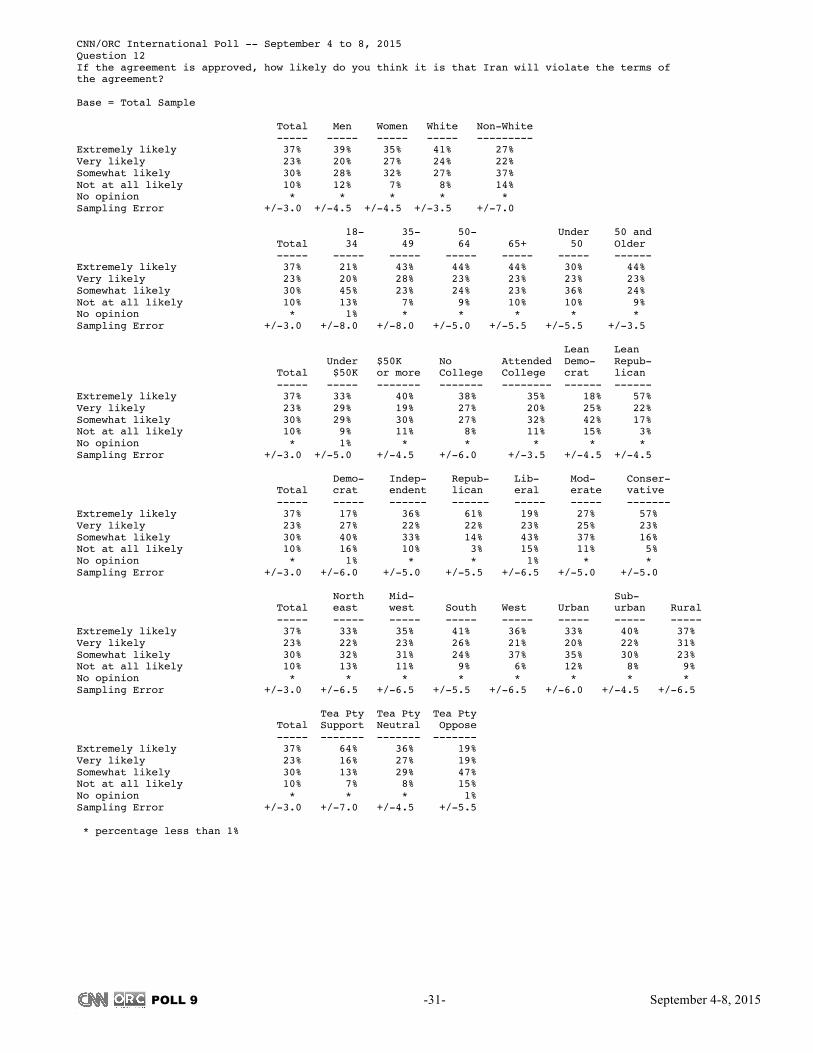
think the United States should or should not take military action against Iran? 12. If the agreement is approved, how likely do you think it is that Iran will violate the terms of the
agreement? Sept. 4-8 2015 Extremely likely 37% Very likely 23% Somewhat likely 30% Not at all likely 10% No opinion *
POLL 9 -15- September 4-8, 2015
3
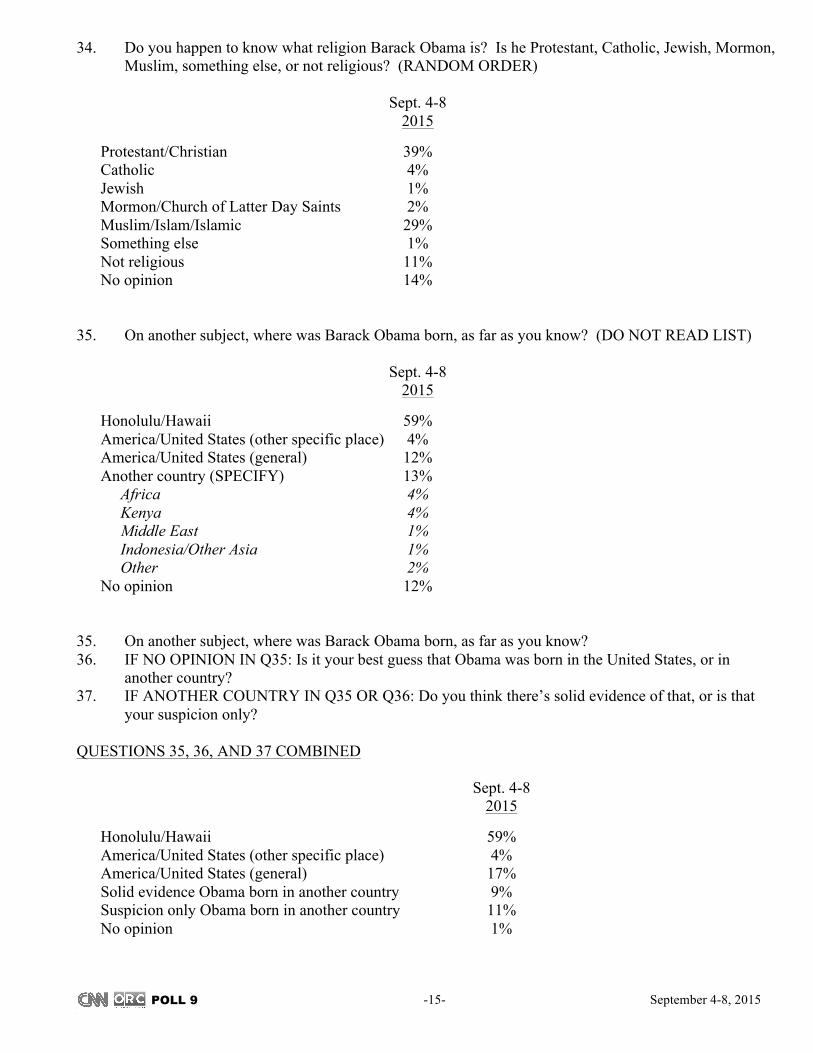
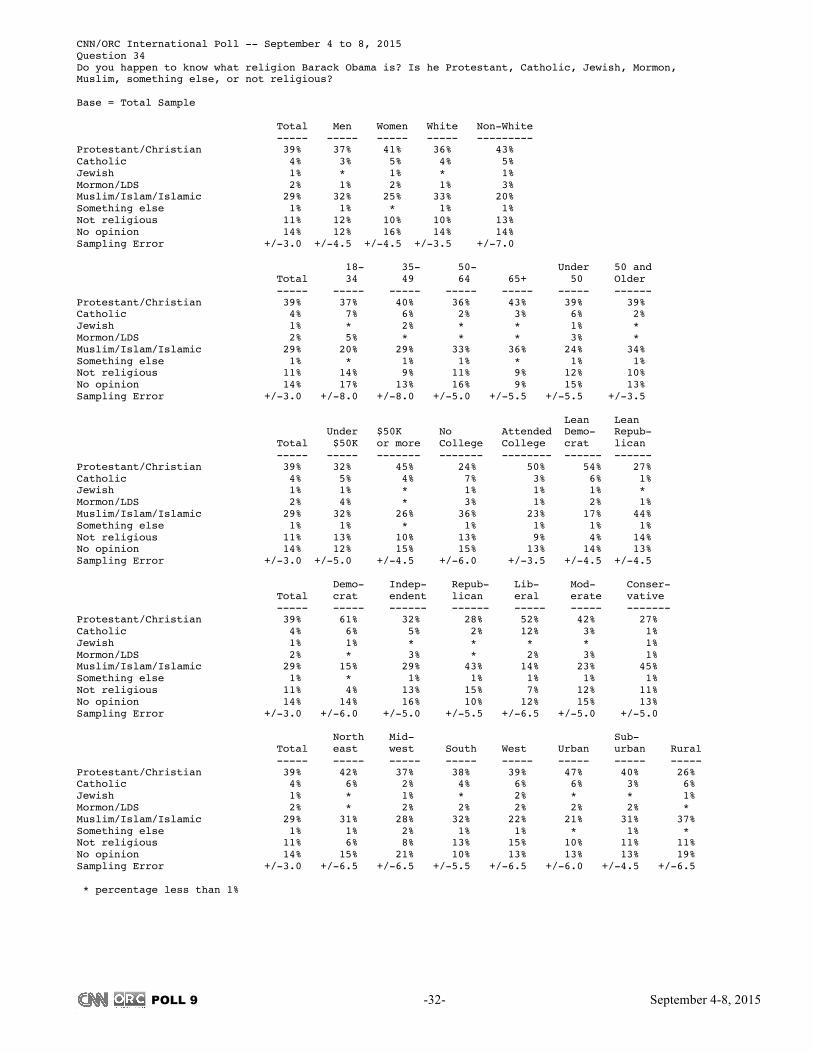
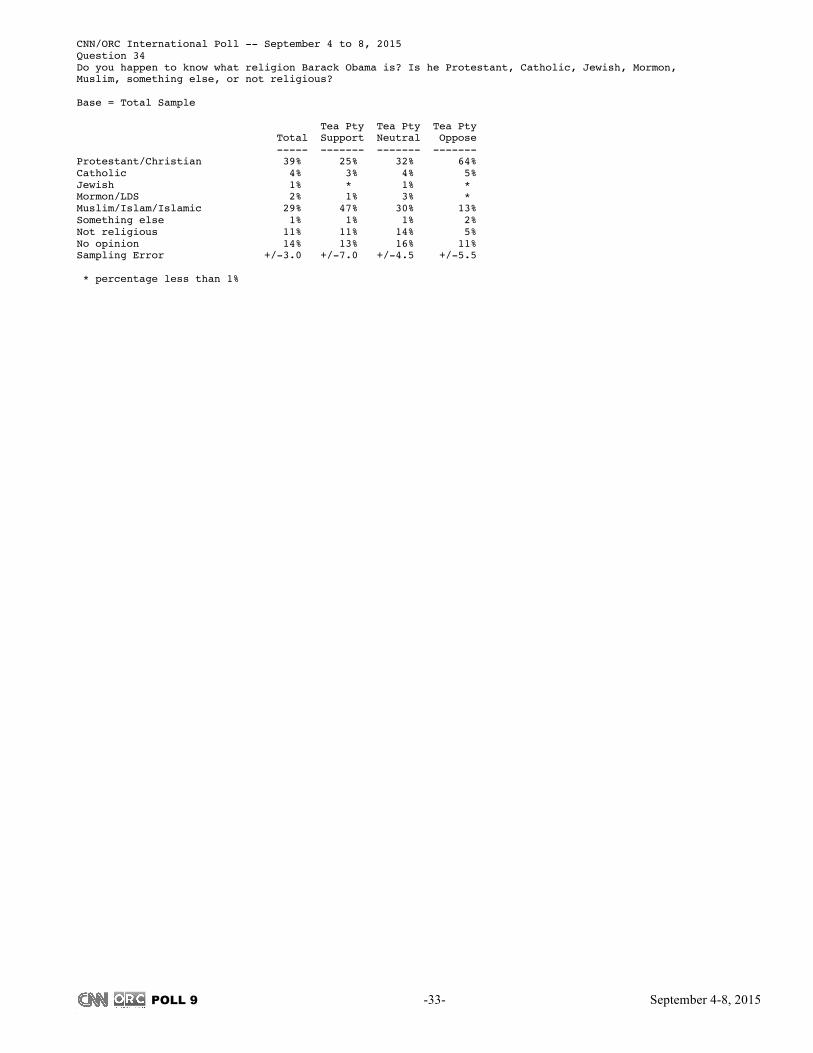
34. Do you happen to know what religion Barack Obama is? Is he Protestant, Catholic, Jewish, Mormon, Muslim, something else, or not religious? (RANDOM ORDER)
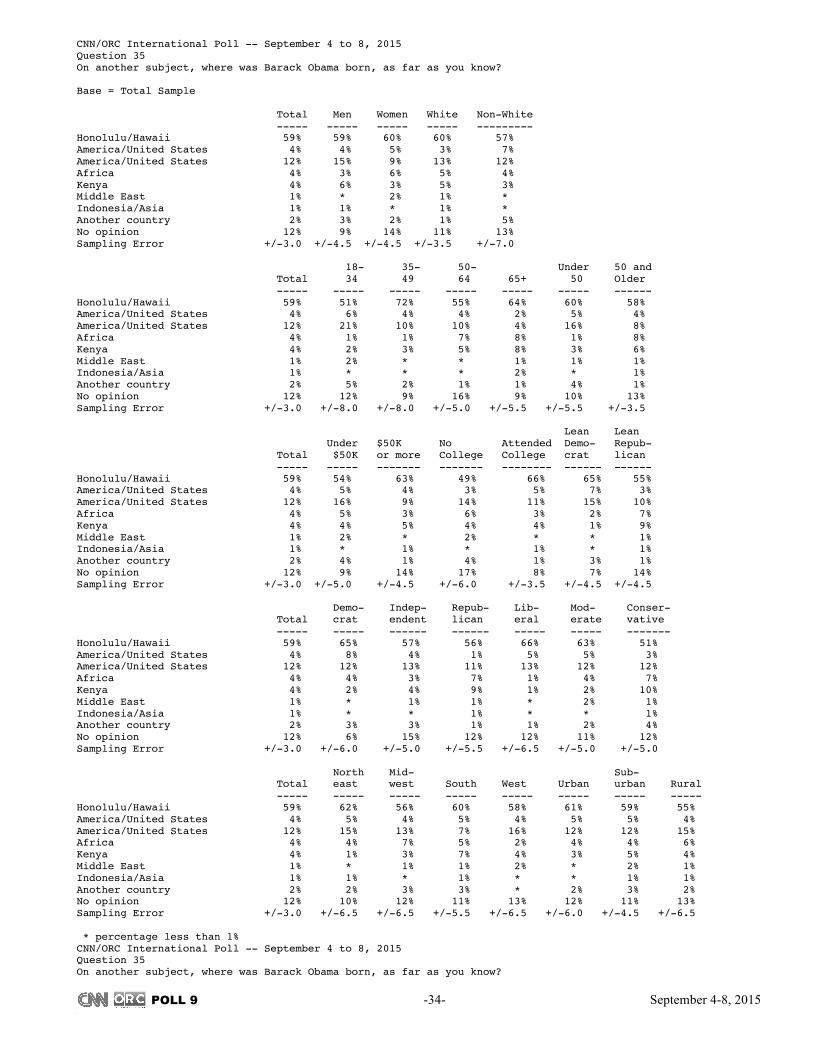
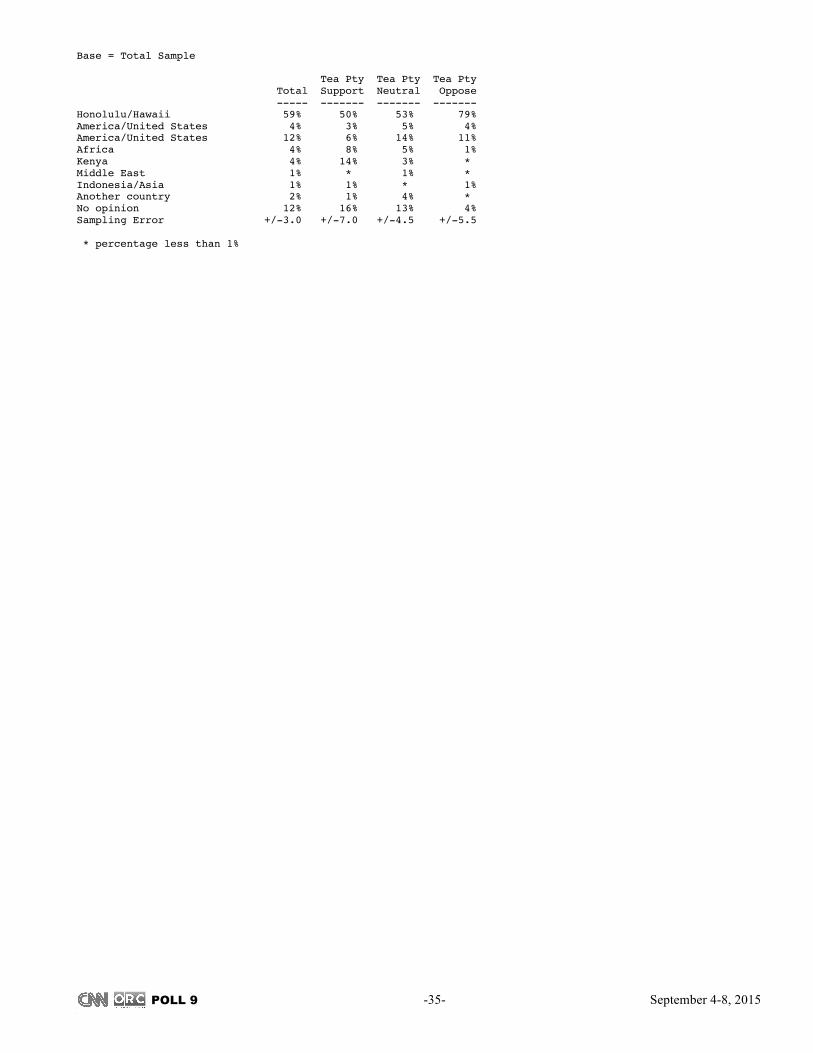
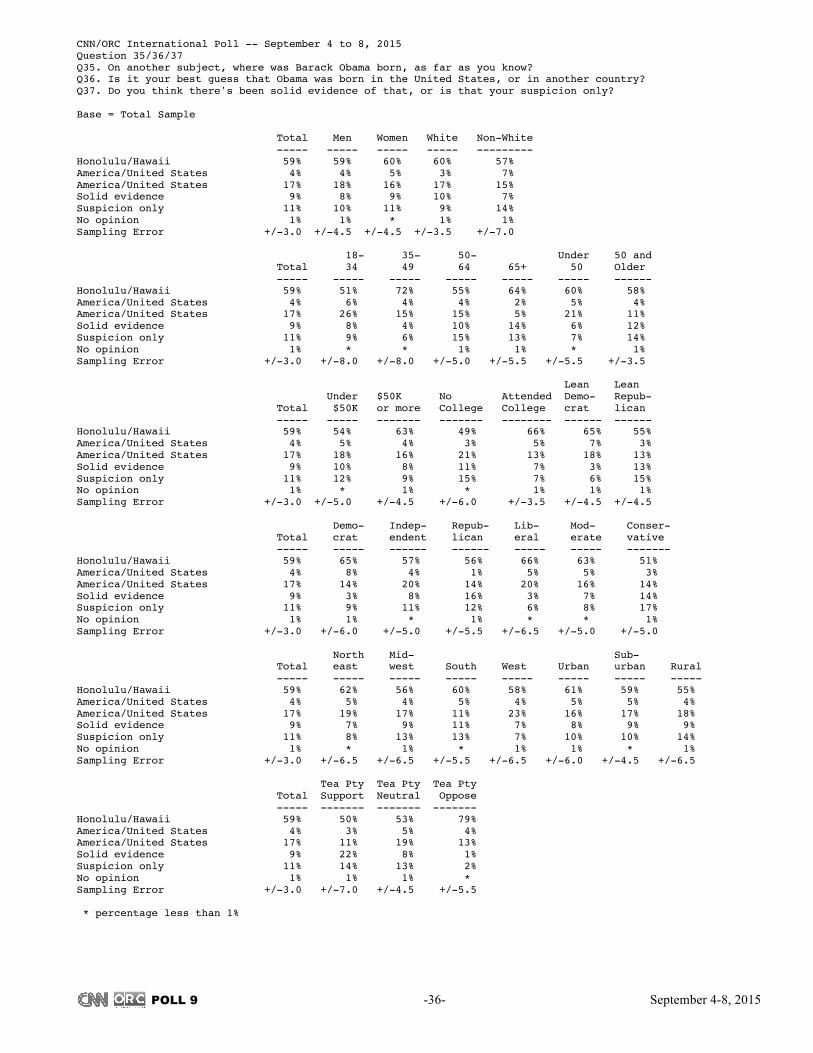
Sept. 4-8 2015 Protestant/Christian 39% Catholic 4% Jewish 1% Mormon/Church of Latter Day Saints 2% Muslim/Islam/Islamic 29% Something else 1% Not religious 11% No opinion 14% 35. On another subject, where was Barack Obama born, as far as you know? (DO NOT READ LIST) Sept. 4-8 2015 Honolulu/Hawaii 59% America/United States (other specific place) 4% America/United States (general) 12% Another country (SPECIFY) 13% Africa 4% Kenya 4% Middle East 1% Indonesia/Other Asia 1% Other 2% No opinion 12% 35. On another subject, where was Barack Obama born, as far as you know? 36. IF NO OPINION IN Q35: Is it your best guess that Obama was born in the United States, or in
another country? 37. IF ANOTHER COUNTRY IN Q35 OR Q36: Do you think there’s solid evidence of that, or is that
your suspicion only? QUESTIONS 35, 36, AND 37 COMBINED Sept. 4-8 2015 Honolulu/Hawaii 59% America/United States (other specific place) 4% America/United States (general) 17% Solid evidence Obama born in another country 9% Suspicion only Obama born in another country 11% No opinion 1%
POLL 9 -16- September 4-8, 2015
3
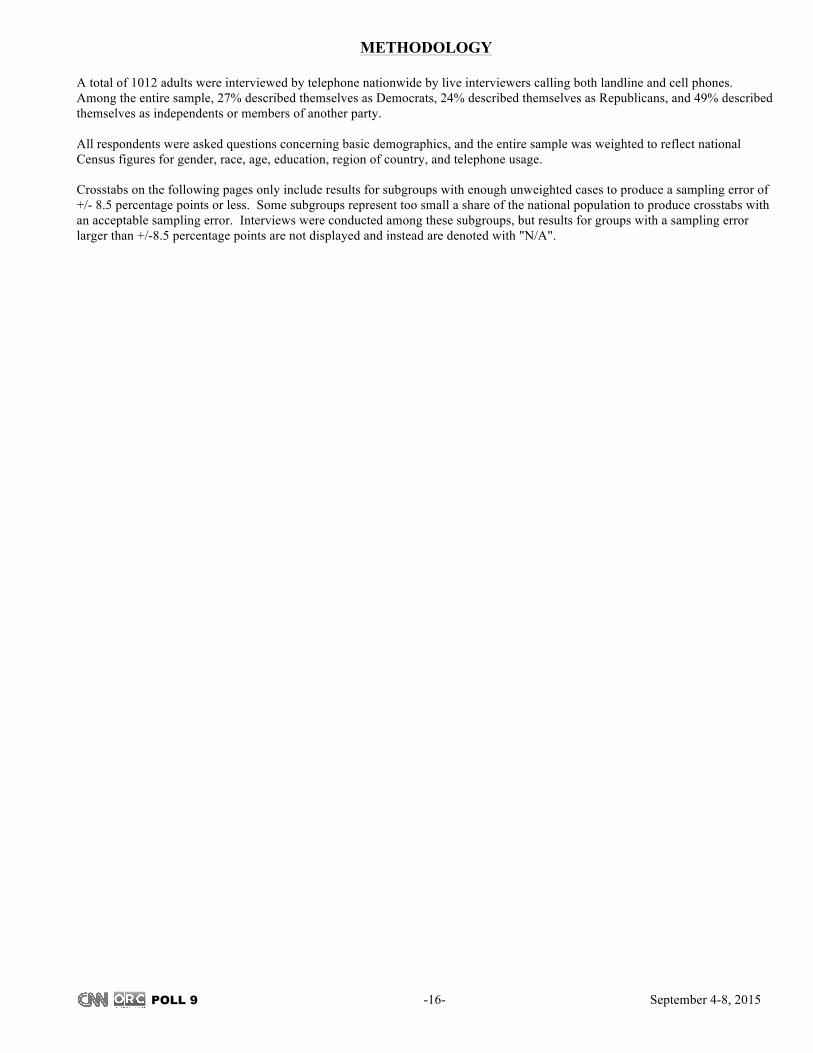
METHODOLOGY A total of 1012 adults were interviewed by telephone nationwide by live interviewers calling both landline and cell phones. Among the entire sample, 27% described themselves as Democrats, 24% described themselves as Republicans, and 49% described themselves as independents or members of another party. All respondents were asked questions concerning basic demographics, and the entire sample was weighted to reflect national Census figures for gender, race, age, education, region of country, and telephone usage. Crosstabs on the following pages only include results for subgroups with enough unweighted cases to produce a sampling error of +/- 8.5 percentage points or less. Some subgroups represent too small a share of the national population to produce crosstabs with an acceptable sampling error. Interviews were conducted among these subgroups, but results for groups with a sampling error larger than +/-8.5 percentage points are not displayed and instead are denoted with "N/A".
POLL 9 -17- September 4-8, 2015
3
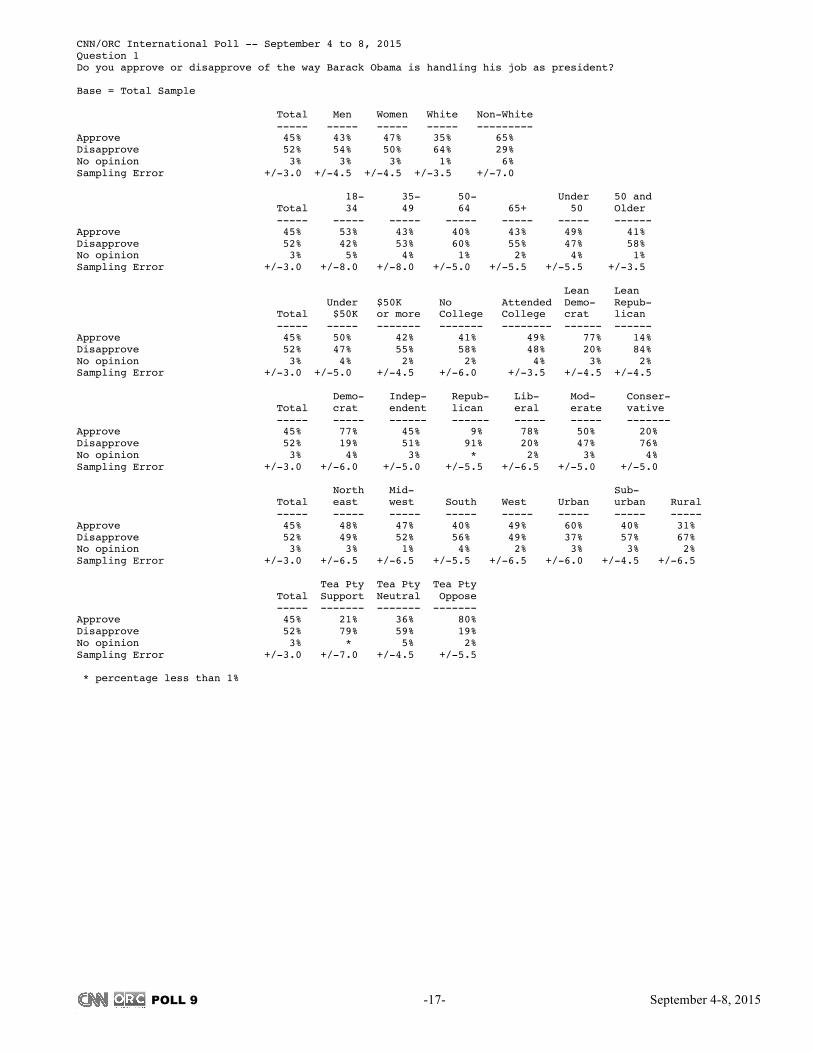
CNN/ORC International Poll -- September 4 to 8, 2015 Question 1 Do you approve or disapprove of the way Barack Obama is handling his job as president? Base = Total Sample Total Men Women White Non-White ----- ----- ----- ----- --------- Approve 45% 43% 47% 35% 65% Disapprove 52% 54% 50% 64% 29% No opinion 3% 3% 3% 1% 6% Sampling Error +/-3.0 +/-4.5 +/-4.5 +/-3.5 +/-7.0 18- 35- 50- Under 50 and Total 34 49 64 65+ 50 Older ----- ----- ----- ----- ----- ----- ------ Approve 45% 53% 43% 40% 43% 49% 41% Disapprove 52% 42% 53% 60% 55% 47% 58% No opinion 3% 5% 4% 1% 2% 4% 1% Sampling Error +/-3.0 +/-8.0 +/-8.0 +/-5.0 +/-5.5 +/-5.5 +/-3.5 Lean Lean Under $50K No Attended Demo- Repub- Total $50K or more College College crat lican ----- ----- ------- ------- -------- ------ ------ Approve 45% 50% 42% 41% 49% 77% 14% Disapprove 52% 47% 55% 58% 48% 20% 84% No opinion 3% 4% 2% 2% 4% 3% 2% Sampling Error +/-3.0 +/-5.0 +/-4.5 +/-6.0 +/-3.5 +/-4.5 +/-4.5 Demo- Indep- Repub- Lib- Mod- Conser- Total crat endent lican eral erate vative ----- ----- ------ ------ ----- ----- ------- Approve 45% 77% 45% 9% 78% 50% 20% Disapprove 52% 19% 51% 91% 20% 47% 76% No opinion 3% 4% 3% * 2% 3% 4% Sampling Error +/-3.0 +/-6.0 +/-5.0 +/-5.5 +/-6.5 +/-5.0 +/-5.0 North Mid- Sub- Total east west South West Urban urban Rural ----- ----- ----- ----- ----- ----- ----- ----- Approve 45% 48% 47% 40% 49% 60% 40% 31% Disapprove 52% 49% 52% 56% 49% 37% 57% 67% No opinion 3% 3% 1% 4% 2% 3% 3% 2% Sampling Error +/-3.0 +/-6.5 +/-6.5 +/-5.5 +/-6.5 +/-6.0 +/-4.5 +/-6.5 Tea Pty Tea Pty Tea Pty Total Support Neutral Oppose ----- ------- ------- ------- Approve 45% 21% 36% 80% Disapprove 52% 79% 59% 19% No opinion 3% * 5% 2% Sampling Error +/-3.0 +/-7.0 +/-4.5 +/-5.5 * percentage less than 1%
POLL 9 -18- September 4-8, 2015
3
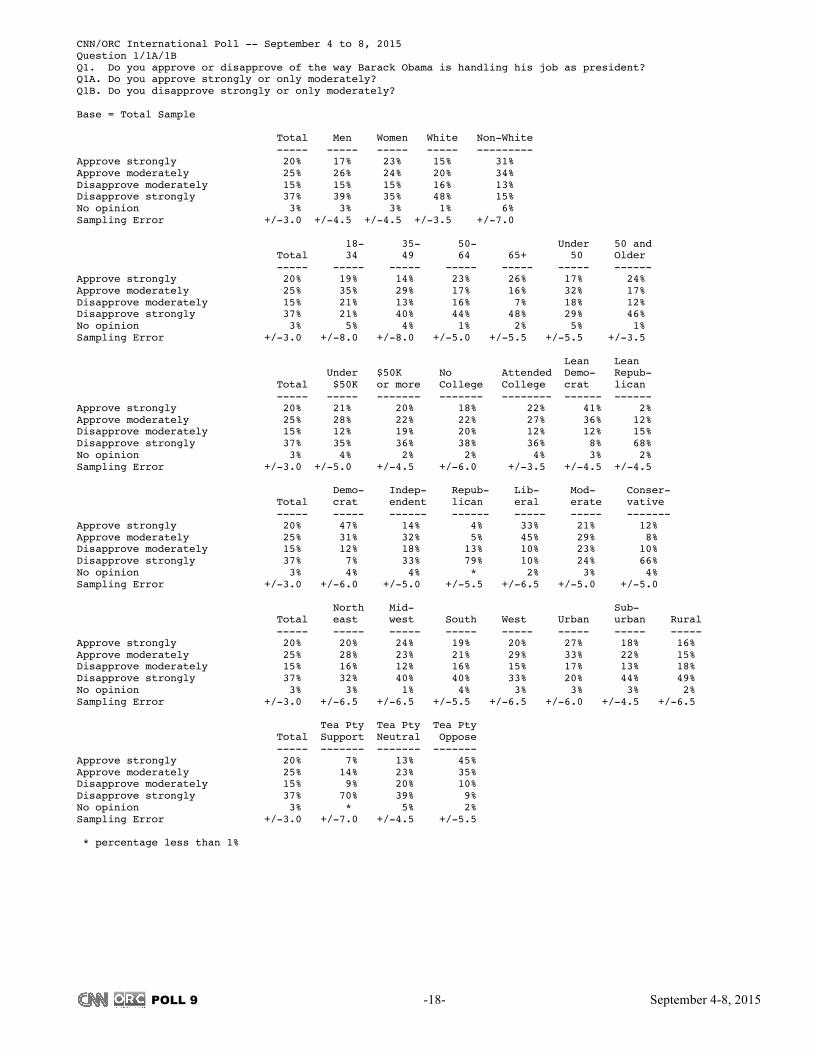
CNN/ORC International Poll -- September 4 to 8, 2015 Question 1/1A/1B Q1. Do you approve or disapprove of the way Barack Obama is handling his job as president? Q1A. Do you approve strongly or only moderately? Q1B. Do you disapprove strongly or only moderately? Base = Total Sample Total Men Women White Non-White ----- ----- ----- ----- --------- Approve strongly 20% 17% 23% 15% 31% Approve moderately 25% 26% 24% 20% 34% Disapprove moderately 15% 15% 15% 16% 13% Disapprove strongly 37% 39% 35% 48% 15% No opinion 3% 3% 3% 1% 6% Sampling Error +/-3.0 +/-4.5 +/-4.5 +/-3.5 +/-7.0 18- 35- 50- Under 50 and Total 34 49 64 65+ 50 Older ----- ----- ----- ----- ----- ----- ------ Approve strongly 20% 19% 14% 23% 26% 17% 24% Approve moderately 25% 35% 29% 17% 16% 32% 17% Disapprove moderately 15% 21% 13% 16% 7% 18% 12% Disapprove strongly 37% 21% 40% 44% 48% 29% 46% No opinion 3% 5% 4% 1% 2% 5% 1% Sampling Error +/-3.0 +/-8.0 +/-8.0 +/-5.0 +/-5.5 +/-5.5 +/-3.5 Lean Lean Under $50K No Attended Demo- Repub- Total $50K or more College College crat lican ----- ----- ------- ------- -------- ------ ------ Approve strongly 20% 21% 20% 18% 22% 41% 2% Approve moderately 25% 28% 22% 22% 27% 36% 12% Disapprove moderately 15% 12% 19% 20% 12% 12% 15% Disapprove strongly 37% 35% 36% 38% 36% 8% 68% No opinion 3% 4% 2% 2% 4% 3% 2% Sampling Error +/-3.0 +/-5.0 +/-4.5 +/-6.0 +/-3.5 +/-4.5 +/-4.5 Demo- Indep- Repub- Lib- Mod- Conser- Total crat endent lican eral erate vative ----- ----- ------ ------ ----- ----- ------- Approve strongly 20% 47% 14% 4% 33% 21% 12% Approve moderately 25% 31% 32% 5% 45% 29% 8% Disapprove moderately 15% 12% 18% 13% 10% 23% 10% Disapprove strongly 37% 7% 33% 79% 10% 24% 66% No opinion 3% 4% 4% * 2% 3% 4% Sampling Error +/-3.0 +/-6.0 +/-5.0 +/-5.5 +/-6.5 +/-5.0 +/-5.0 North Mid- Sub- Total east west South West Urban urban Rural ----- ----- ----- ----- ----- ----- ----- ----- Approve strongly 20% 20% 24% 19% 20% 27% 18% 16% Approve moderately 25% 28% 23% 21% 29% 33% 22% 15% Disapprove moderately 15% 16% 12% 16% 15% 17% 13% 18% Disapprove strongly 37% 32% 40% 40% 33% 20% 44% 49% No opinion 3% 3% 1% 4% 3% 3% 3% 2% Sampling Error +/-3.0 +/-6.5 +/-6.5 +/-5.5 +/-6.5 +/-6.0 +/-4.5 +/-6.5 Tea Pty Tea Pty Tea Pty Total Support Neutral Oppose ----- ------- ------- ------- Approve strongly 20% 7% 13% 45% Approve moderately 25% 14% 23% 35% Disapprove moderately 15% 9% 20% 10% Disapprove strongly 37% 70% 39% 9% No opinion 3% * 5% 2% Sampling Error +/-3.0 +/-7.0 +/-4.5 +/-5.5 * percentage less than 1%
POLL 9 -19- September 4-8, 2015
3
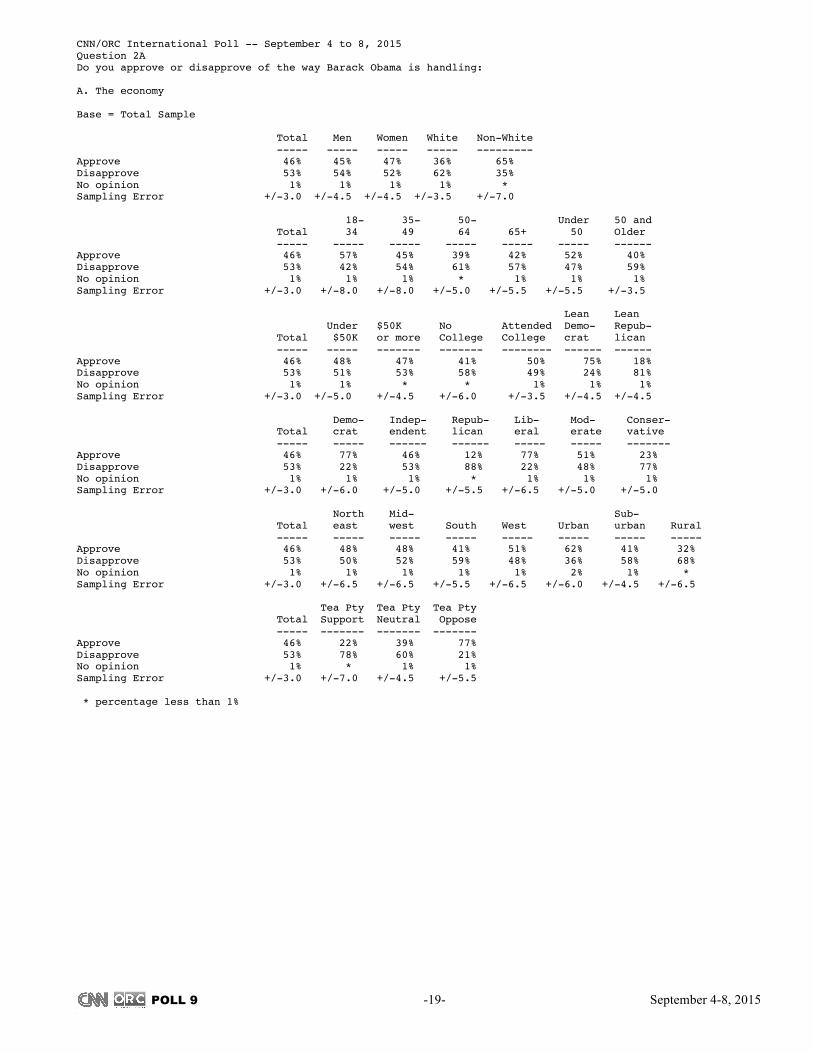
CNN/ORC International Poll -- September 4 to 8, 2015 Question 2A Do you approve or disapprove of the way Barack Obama is handling: A. The economy Base = Total Sample Total Men Women White Non-White ----- ----- ----- ----- --------- Approve 46% 45% 47% 36% 65% Disapprove 53% 54% 52% 62% 35% No opinion 1% 1% 1% 1% * Sampling Error +/-3.0 +/-4.5 +/-4.5 +/-3.5 +/-7.0 18- 35- 50- Under 50 and Total 34 49 64 65+ 50 Older ----- ----- ----- ----- ----- ----- ------ Approve 46% 57% 45% 39% 42% 52% 40% Disapprove 53% 42% 54% 61% 57% 47% 59% No opinion 1% 1% 1% * 1% 1% 1% Sampling Error +/-3.0 +/-8.0 +/-8.0 +/-5.0 +/-5.5 +/-5.5 +/-3.5 Lean Lean Under $50K No Attended Demo- Repub- Total $50K or more College College crat lican ----- ----- ------- ------- -------- ------ ------ Approve 46% 48% 47% 41% 50% 75% 18% Disapprove 53% 51% 53% 58% 49% 24% 81% No opinion 1% 1% * * 1% 1% 1% Sampling Error +/-3.0 +/-5.0 +/-4.5 +/-6.0 +/-3.5 +/-4.5 +/-4.5 Demo- Indep- Repub- Lib- Mod- Conser- Total crat endent lican eral erate vative ----- ----- ------ ------ ----- ----- ------- Approve 46% 77% 46% 12% 77% 51% 23% Disapprove 53% 22% 53% 88% 22% 48% 77% No opinion 1% 1% 1% * 1% 1% 1% Sampling Error +/-3.0 +/-6.0 +/-5.0 +/-5.5 +/-6.5 +/-5.0 +/-5.0 North Mid- Sub- Total east west South West Urban urban Rural ----- ----- ----- ----- ----- ----- ----- ----- Approve 46% 48% 48% 41% 51% 62% 41% 32% Disapprove 53% 50% 52% 59% 48% 36% 58% 68% No opinion 1% 1% 1% 1% 1% 2% 1% * Sampling Error +/-3.0 +/-6.5 +/-6.5 +/-5.5 +/-6.5 +/-6.0 +/-4.5 +/-6.5 Tea Pty Tea Pty Tea Pty Total Support Neutral Oppose ----- ------- ------- ------- Approve 46% 22% 39% 77% Disapprove 53% 78% 60% 21% No opinion 1% * 1% 1% Sampling Error +/-3.0 +/-7.0 +/-4.5 +/-5.5 * percentage less than 1%
POLL 9 -20- September 4-8, 2015
3
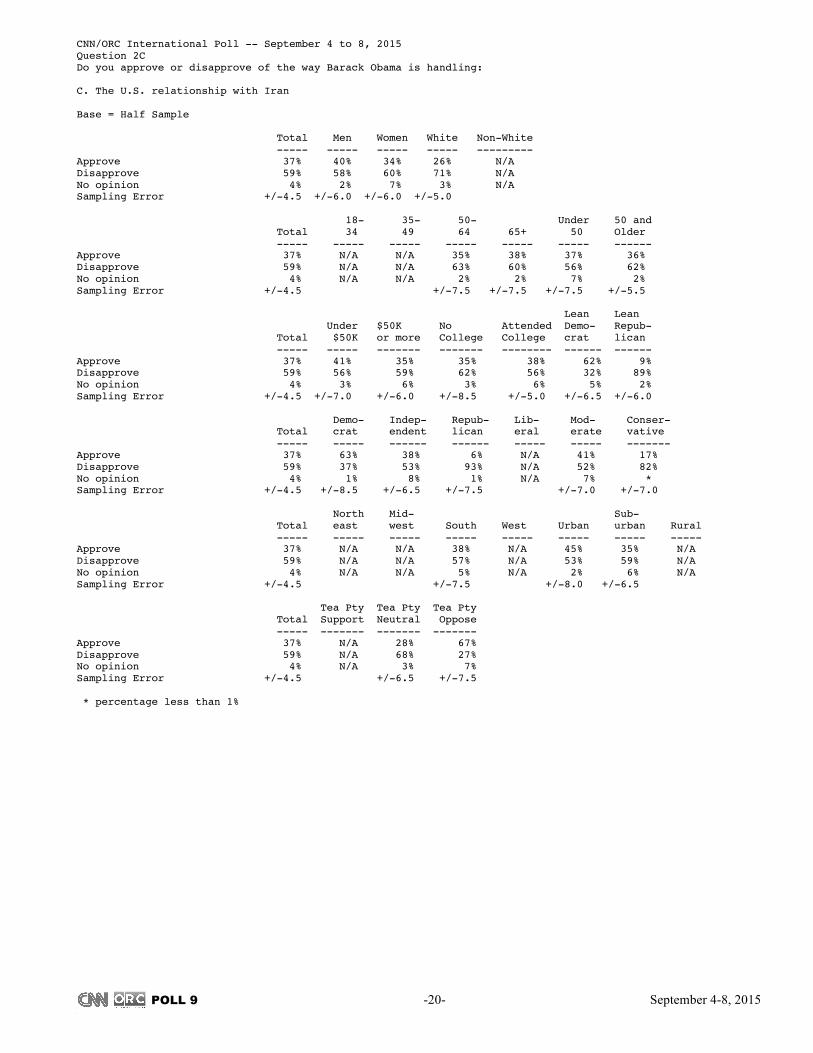
CNN/ORC International Poll -- September 4 to 8, 2015 Question 2C Do you approve or disapprove of the way Barack Obama is handling: C. The U.S. relationship with Iran Base = Half Sample Total Men Women White Non-White ----- ----- ----- ----- --------- Approve 37% 40% 34% 26% N/A Disapprove 59% 58% 60% 71% N/A No opinion 4% 2% 7% 3% N/A Sampling Error +/-4.5 +/-6.0 +/-6.0 +/-5.0 18- 35- 50- Under 50 and Total 34 49 64 65+ 50 Older ----- ----- ----- ----- ----- ----- ------ Approve 37% N/A N/A 35% 38% 37% 36% Disapprove 59% N/A N/A 63% 60% 56% 62% No opinion 4% N/A N/A 2% 2% 7% 2% Sampling Error +/-4.5 +/-7.5 +/-7.5 +/-7.5 +/-5.5 Lean Lean Under $50K No Attended Demo- Repub- Total $50K or more College College crat lican ----- ----- ------- ------- -------- ------ ------ Approve 37% 41% 35% 35% 38% 62% 9% Disapprove 59% 56% 59% 62% 56% 32% 89% No opinion 4% 3% 6% 3% 6% 5% 2% Sampling Error +/-4.5 +/-7.0 +/-6.0 +/-8.5 +/-5.0 +/-6.5 +/-6.0 Demo- Indep- Repub- Lib- Mod- Conser- Total crat endent lican eral erate vative ----- ----- ------ ------ ----- ----- ------- Approve 37% 63% 38% 6% N/A 41% 17% Disapprove 59% 37% 53% 93% N/A 52% 82% No opinion 4% 1% 8% 1% N/A 7% * Sampling Error +/-4.5 +/-8.5 +/-6.5 +/-7.5 +/-7.0 +/-7.0 North Mid- Sub- Total east west South West Urban urban Rural ----- ----- ----- ----- ----- ----- ----- ----- Approve 37% N/A N/A 38% N/A 45% 35% N/A Disapprove 59% N/A N/A 57% N/A 53% 59% N/A No opinion 4% N/A N/A 5% N/A 2% 6% N/A Sampling Error +/-4.5 +/-7.5 +/-8.0 +/-6.5 Tea Pty Tea Pty Tea Pty Total Support Neutral Oppose ----- ------- ------- ------- Approve 37% N/A 28% 67% Disapprove 59% N/A 68% 27% No opinion 4% N/A 3% 7% Sampling Error +/-4.5 +/-6.5 +/-7.5 * percentage less than 1%
POLL 9 -21- September 4-8, 2015
3
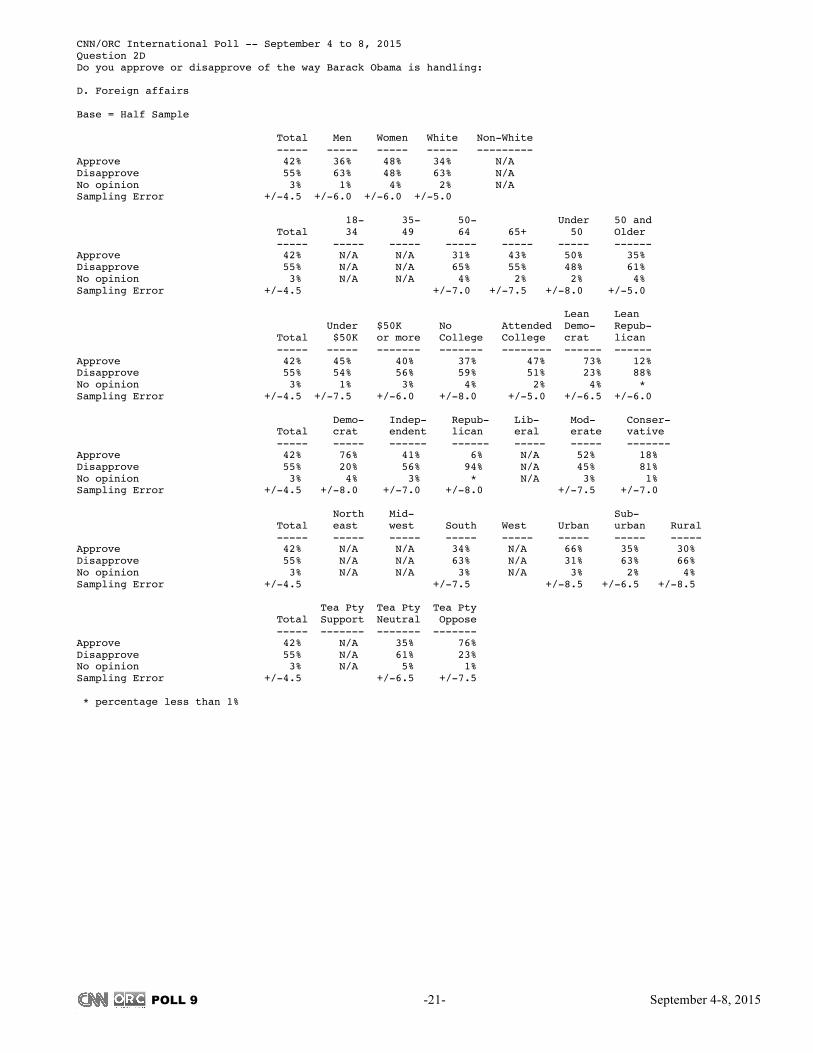
CNN/ORC International Poll -- September 4 to 8, 2015 Question 2D Do you approve or disapprove of the way Barack Obama is handling: D. Foreign affairs Base = Half Sample Total Men Women White Non-White ----- ----- ----- ----- --------- Approve 42% 36% 48% 34% N/A Disapprove 55% 63% 48% 63% N/A No opinion 3% 1% 4% 2% N/A Sampling Error +/-4.5 +/-6.0 +/-6.0 +/-5.0 18- 35- 50- Under 50 and Total 34 49 64 65+ 50 Older ----- ----- ----- ----- ----- ----- ------ Approve 42% N/A N/A 31% 43% 50% 35% Disapprove 55% N/A N/A 65% 55% 48% 61% No opinion 3% N/A N/A 4% 2% 2% 4% Sampling Error +/-4.5 +/-7.0 +/-7.5 +/-8.0 +/-5.0 Lean Lean Under $50K No Attended Demo- Repub- Total $50K or more College College crat lican ----- ----- ------- ------- -------- ------ ------ Approve 42% 45% 40% 37% 47% 73% 12% Disapprove 55% 54% 56% 59% 51% 23% 88% No opinion 3% 1% 3% 4% 2% 4% * Sampling Error +/-4.5 +/-7.5 +/-6.0 +/-8.0 +/-5.0 +/-6.5 +/-6.0 Demo- Indep- Repub- Lib- Mod- Conser- Total crat endent lican eral erate vative ----- ----- ------ ------ ----- ----- ------- Approve 42% 76% 41% 6% N/A 52% 18% Disapprove 55% 20% 56% 94% N/A 45% 81% No opinion 3% 4% 3% * N/A 3% 1% Sampling Error +/-4.5 +/-8.0 +/-7.0 +/-8.0 +/-7.5 +/-7.0 North Mid- Sub- Total east west South West Urban urban Rural ----- ----- ----- ----- ----- ----- ----- ----- Approve 42% N/A N/A 34% N/A 66% 35% 30% Disapprove 55% N/A N/A 63% N/A 31% 63% 66% No opinion 3% N/A N/A 3% N/A 3% 2% 4% Sampling Error +/-4.5 +/-7.5 +/-8.5 +/-6.5 +/-8.5 Tea Pty Tea Pty Tea Pty Total Support Neutral Oppose ----- ------- ------- ------- Approve 42% N/A 35% 76% Disapprove 55% N/A 61% 23% No opinion 3% N/A 5% 1% Sampling Error +/-4.5 +/-6.5 +/-7.5 * percentage less than 1%
POLL 9 -22- September 4-8, 2015
3
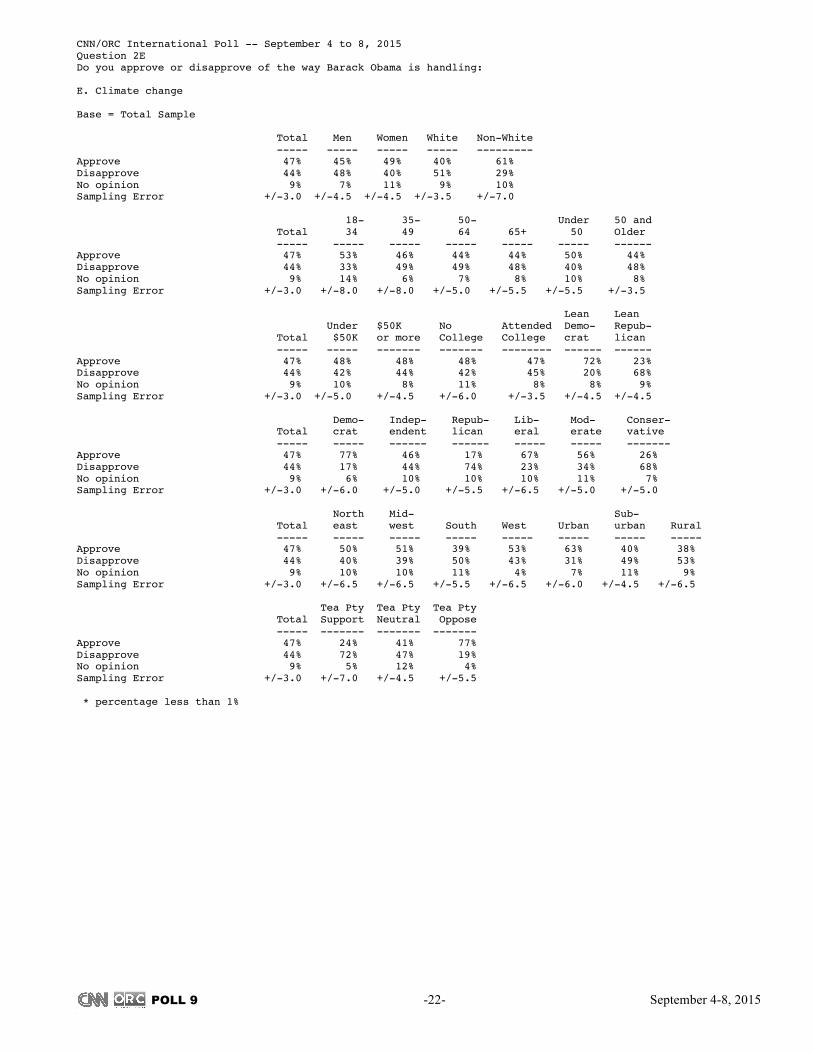
CNN/ORC International Poll -- September 4 to 8, 2015 Question 2E Do you approve or disapprove of the way Barack Obama is handling: E. Climate change Base = Total Sample Total Men Women White Non-White ----- ----- ----- ----- --------- Approve 47% 45% 49% 40% 61% Disapprove 44% 48% 40% 51% 29% No opinion 9% 7% 11% 9% 10% Sampling Error +/-3.0 +/-4.5 +/-4.5 +/-3.5 +/-7.0 18- 35- 50- Under 50 and Total 34 49 64 65+ 50 Older ----- ----- ----- ----- ----- ----- ------ Approve 47% 53% 46% 44% 44% 50% 44% Disapprove 44% 33% 49% 49% 48% 40% 48% No opinion 9% 14% 6% 7% 8% 10% 8% Sampling Error +/-3.0 +/-8.0 +/-8.0 +/-5.0 +/-5.5 +/-5.5 +/-3.5 Lean Lean Under $50K No Attended Demo- Repub- Total $50K or more College College crat lican ----- ----- ------- ------- -------- ------ ------ Approve 47% 48% 48% 48% 47% 72% 23% Disapprove 44% 42% 44% 42% 45% 20% 68% No opinion 9% 10% 8% 11% 8% 8% 9% Sampling Error +/-3.0 +/-5.0 +/-4.5 +/-6.0 +/-3.5 +/-4.5 +/-4.5 Demo- Indep- Repub- Lib- Mod- Conser- Total crat endent lican eral erate vative ----- ----- ------ ------ ----- ----- ------- Approve 47% 77% 46% 17% 67% 56% 26% Disapprove 44% 17% 44% 74% 23% 34% 68% No opinion 9% 6% 10% 10% 10% 11% 7% Sampling Error +/-3.0 +/-6.0 +/-5.0 +/-5.5 +/-6.5 +/-5.0 +/-5.0 North Mid- Sub- Total east west South West Urban urban Rural ----- ----- ----- ----- ----- ----- ----- ----- Approve 47% 50% 51% 39% 53% 63% 40% 38% Disapprove 44% 40% 39% 50% 43% 31% 49% 53% No opinion 9% 10% 10% 11% 4% 7% 11% 9% Sampling Error +/-3.0 +/-6.5 +/-6.5 +/-5.5 +/-6.5 +/-6.0 +/-4.5 +/-6.5 Tea Pty Tea Pty Tea Pty Total Support Neutral Oppose ----- ------- ------- ------- Approve 47% 24% 41% 77% Disapprove 44% 72% 47% 19% No opinion 9% 5% 12% 4% Sampling Error +/-3.0 +/-7.0 +/-4.5 +/-5.5 * percentage less than 1%
POLL 9 -23- September 4-8, 2015
3
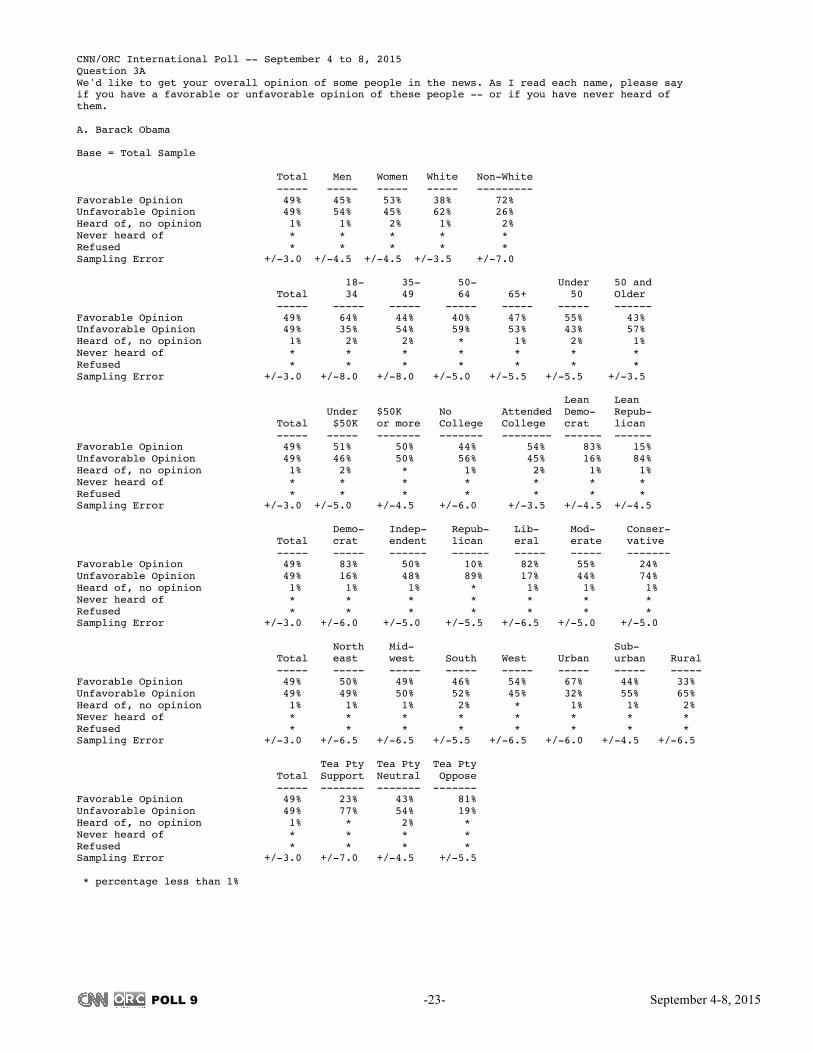
CNN/ORC International Poll -- September 4 to 8, 2015 Question 3A We'd like to get your overall opinion of some people in the news. As I read each name, please say if you have a favorable or unfavorable opinion of these people -- or if you have never heard of them. A. Barack Obama Base = Total Sample Total Men Women White Non-White ----- ----- ----- ----- --------- Favorable Opinion 49% 45% 53% 38% 72% Unfavorable Opinion 49% 54% 45% 62% 26% Heard of, no opinion 1% 1% 2% 1% 2% Never heard of * * * * * Refused * * * * * Sampling Error +/-3.0 +/-4.5 +/-4.5 +/-3.5 +/-7.0 18- 35- 50- Under 50 and Total 34 49 64 65+ 50 Older ----- ----- ----- ----- ----- ----- ------ Favorable Opinion 49% 64% 44% 40% 47% 55% 43% Unfavorable Opinion 49% 35% 54% 59% 53% 43% 57% Heard of, no opinion 1% 2% 2% * 1% 2% 1% Never heard of * * * * * * * Refused * * * * * * * Sampling Error +/-3.0 +/-8.0 +/-8.0 +/-5.0 +/-5.5 +/-5.5 +/-3.5 Lean Lean Under $50K No Attended Demo- Repub- Total $50K or more College College crat lican ----- ----- ------- ------- -------- ------ ------ Favorable Opinion 49% 51% 50% 44% 54% 83% 15% Unfavorable Opinion 49% 46% 50% 56% 45% 16% 84% Heard of, no opinion 1% 2% * 1% 2% 1% 1% Never heard of * * * * * * * Refused * * * * * * * Sampling Error +/-3.0 +/-5.0 +/-4.5 +/-6.0 +/-3.5 +/-4.5 +/-4.5 Demo- Indep- Repub- Lib- Mod- Conser- Total crat endent lican eral erate vative ----- ----- ------ ------ ----- ----- ------- Favorable Opinion 49% 83% 50% 10% 82% 55% 24% Unfavorable Opinion 49% 16% 48% 89% 17% 44% 74% Heard of, no opinion 1% 1% 1% * 1% 1% 1% Never heard of * * * * * * * Refused * * * * * * * Sampling Error +/-3.0 +/-6.0 +/-5.0 +/-5.5 +/-6.5 +/-5.0 +/-5.0 North Mid- Sub- Total east west South West Urban urban Rural ----- ----- ----- ----- ----- ----- ----- ----- Favorable Opinion 49% 50% 49% 46% 54% 67% 44% 33% Unfavorable Opinion 49% 49% 50% 52% 45% 32% 55% 65% Heard of, no opinion 1% 1% 1% 2% * 1% 1% 2% Never heard of * * * * * * * * Refused * * * * * * * * Sampling Error +/-3.0 +/-6.5 +/-6.5 +/-5.5 +/-6.5 +/-6.0 +/-4.5 +/-6.5 Tea Pty Tea Pty Tea Pty Total Support Neutral Oppose ----- ------- ------- ------- Favorable Opinion 49% 23% 43% 81% Unfavorable Opinion 49% 77% 54% 19% Heard of, no opinion 1% * 2% * Never heard of * * * * Refused * * * * Sampling Error +/-3.0 +/-7.0 +/-4.5 +/-5.5 * percentage less than 1%
POLL 9 -24- September 4-8, 2015
3
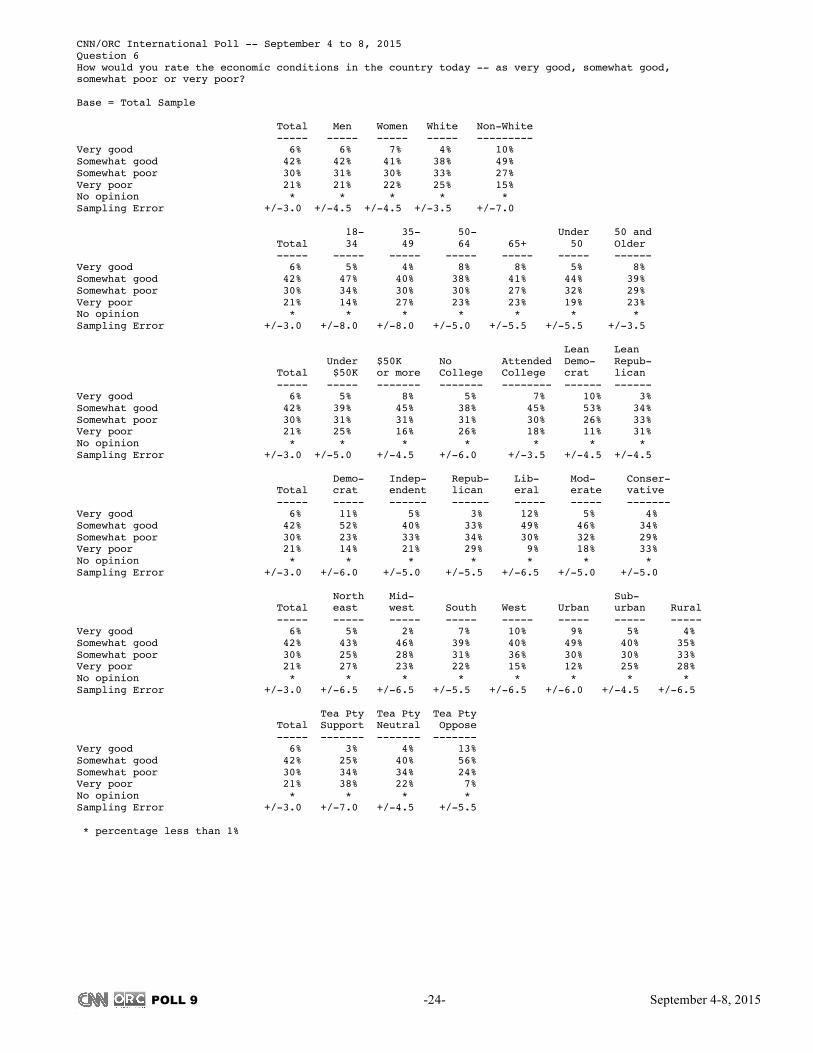
CNN/ORC International Poll -- September 4 to 8, 2015 Question 6 How would you rate the economic conditions in the country today -- as very good, somewhat good, somewhat poor or very poor? Base = Total Sample Total Men Women White Non-White ----- ----- ----- ----- --------- Very good 6% 6% 7% 4% 10% Somewhat good 42% 42% 41% 38% 49% Somewhat poor 30% 31% 30% 33% 27% Very poor 21% 21% 22% 25% 15% No opinion * * * * * Sampling Error +/-3.0 +/-4.5 +/-4.5 +/-3.5 +/-7.0 18- 35- 50- Under 50 and Total 34 49 64 65+ 50 Older ----- ----- ----- ----- ----- ----- ------ Very good 6% 5% 4% 8% 8% 5% 8% Somewhat good 42% 47% 40% 38% 41% 44% 39% Somewhat poor 30% 34% 30% 30% 27% 32% 29% Very poor 21% 14% 27% 23% 23% 19% 23% No opinion * * * * * * * Sampling Error +/-3.0 +/-8.0 +/-8.0 +/-5.0 +/-5.5 +/-5.5 +/-3.5 Lean Lean Under $50K No Attended Demo- Repub- Total $50K or more College College crat lican ----- ----- ------- ------- -------- ------ ------ Very good 6% 5% 8% 5% 7% 10% 3% Somewhat good 42% 39% 45% 38% 45% 53% 34% Somewhat poor 30% 31% 31% 31% 30% 26% 33% Very poor 21% 25% 16% 26% 18% 11% 31% No opinion * * * * * * * Sampling Error +/-3.0 +/-5.0 +/-4.5 +/-6.0 +/-3.5 +/-4.5 +/-4.5 Demo- Indep- Repub- Lib- Mod- Conser- Total crat endent lican eral erate vative ----- ----- ------ ------ ----- ----- ------- Very good 6% 11% 5% 3% 12% 5% 4% Somewhat good 42% 52% 40% 33% 49% 46% 34% Somewhat poor 30% 23% 33% 34% 30% 32% 29% Very poor 21% 14% 21% 29% 9% 18% 33% No opinion * * * * * * * Sampling Error +/-3.0 +/-6.0 +/-5.0 +/-5.5 +/-6.5 +/-5.0 +/-5.0 North Mid- Sub- Total east west South West Urban urban Rural ----- ----- ----- ----- ----- ----- ----- ----- Very good 6% 5% 2% 7% 10% 9% 5% 4% Somewhat good 42% 43% 46% 39% 40% 49% 40% 35% Somewhat poor 30% 25% 28% 31% 36% 30% 30% 33% Very poor 21% 27% 23% 22% 15% 12% 25% 28% No opinion * * * * * * * * Sampling Error +/-3.0 +/-6.5 +/-6.5 +/-5.5 +/-6.5 +/-6.0 +/-4.5 +/-6.5 Tea Pty Tea Pty Tea Pty Total Support Neutral Oppose ----- ------- ------- ------- Very good 6% 3% 4% 13% Somewhat good 42% 25% 40% 56% Somewhat poor 30% 34% 34% 24% Very poor 21% 38% 22% 7% No opinion * * * * Sampling Error +/-3.0 +/-7.0 +/-4.5 +/-5.5 * percentage less than 1%
POLL 9 -25- September 4-8, 2015
3
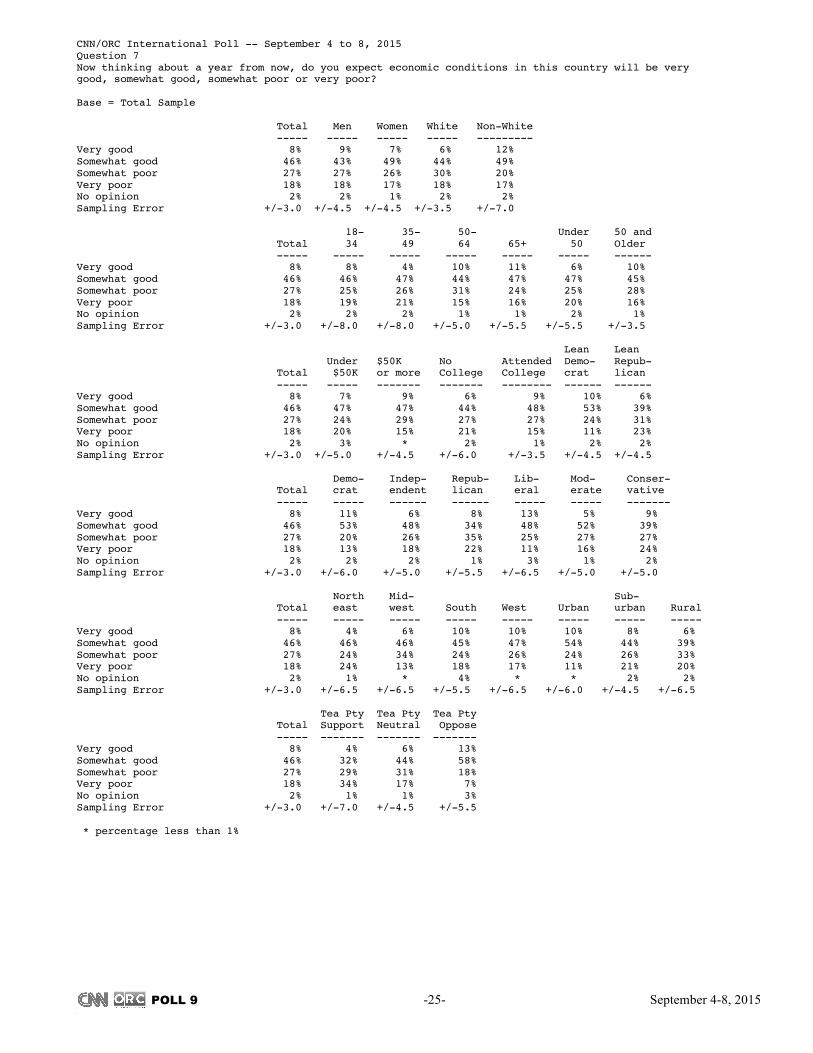
CNN/ORC International Poll -- September 4 to 8, 2015 Question 7 Now thinking about a year from now, do you expect economic conditions in this country will be very good, somewhat good, somewhat poor or very poor? Base = Total Sample Total Men Women White Non-White ----- ----- ----- ----- --------- Very good 8% 9% 7% 6% 12% Somewhat good 46% 43% 49% 44% 49% Somewhat poor 27% 27% 26% 30% 20% Very poor 18% 18% 17% 18% 17% No opinion 2% 2% 1% 2% 2% Sampling Error +/-3.0 +/-4.5 +/-4.5 +/-3.5 +/-7.0 18- 35- 50- Under 50 and Total 34 49 64 65+ 50 Older ----- ----- ----- ----- ----- ----- ------ Very good 8% 8% 4% 10% 11% 6% 10% Somewhat good 46% 46% 47% 44% 47% 47% 45% Somewhat poor 27% 25% 26% 31% 24% 25% 28% Very poor 18% 19% 21% 15% 16% 20% 16% No opinion 2% 2% 2% 1% 1% 2% 1% Sampling Error +/-3.0 +/-8.0 +/-8.0 +/-5.0 +/-5.5 +/-5.5 +/-3.5 Lean Lean Under $50K No Attended Demo- Repub- Total $50K or more College College crat lican ----- ----- ------- ------- -------- ------ ------ Very good 8% 7% 9% 6% 9% 10% 6% Somewhat good 46% 47% 47% 44% 48% 53% 39% Somewhat poor 27% 24% 29% 27% 27% 24% 31% Very poor 18% 20% 15% 21% 15% 11% 23% No opinion 2% 3% * 2% 1% 2% 2% Sampling Error +/-3.0 +/-5.0 +/-4.5 +/-6.0 +/-3.5 +/-4.5 +/-4.5 Demo- Indep- Repub- Lib- Mod- Conser- Total crat endent lican eral erate vative ----- ----- ------ ------ ----- ----- ------- Very good 8% 11% 6% 8% 13% 5% 9% Somewhat good 46% 53% 48% 34% 48% 52% 39% Somewhat poor 27% 20% 26% 35% 25% 27% 27% Very poor 18% 13% 18% 22% 11% 16% 24% No opinion 2% 2% 2% 1% 3% 1% 2% Sampling Error +/-3.0 +/-6.0 +/-5.0 +/-5.5 +/-6.5 +/-5.0 +/-5.0 North Mid- Sub- Total east west South West Urban urban Rural ----- ----- ----- ----- ----- ----- ----- ----- Very good 8% 4% 6% 10% 10% 10% 8% 6% Somewhat good 46% 46% 46% 45% 47% 54% 44% 39% Somewhat poor 27% 24% 34% 24% 26% 24% 26% 33% Very poor 18% 24% 13% 18% 17% 11% 21% 20% No opinion 2% 1% * 4% * * 2% 2% Sampling Error +/-3.0 +/-6.5 +/-6.5 +/-5.5 +/-6.5 +/-6.0 +/-4.5 +/-6.5 Tea Pty Tea Pty Tea Pty Total Support Neutral Oppose ----- ------- ------- ------- Very good 8% 4% 6% 13% Somewhat good 46% 32% 44% 58% Somewhat poor 27% 29% 31% 18% Very poor 18% 34% 17% 7% No opinion 2% 1% 1% 3% Sampling Error +/-3.0 +/-7.0 +/-4.5 +/-5.5 * percentage less than 1%
POLL 9 -26- September 4-8, 2015
3
CNN/ORC International Poll -- September 4 to 8, 2015 Question 9A Would you say that the following represent a very serious threat to the United States, a moderately serious threat, just a slight threat, or no threat at all? A. Iran Base = Total Sample Total Men Women White Non-White ----- ----- ----- ----- --------- Very serious threat 49% 44% 54% 54% 40% Moderately serious threat 33% 33% 32% 30% 39% Just a slight threat 11% 12% 9% 11% 10% No threat at all 7% 10% 4% 5% 11% No opinion 1% * 1% 1% * Sampling Error +/-3.0 +/-4.5 +/-4.5 +/-3.5 +/-7.0 18- 35- 50- Under 50 and Total 34 49 64 65+ 50 Older ----- ----- ----- ----- ----- ----- ------ Very serious threat 49% 27% 57% 60% 60% 39% 60% Moderately serious threat 33% 41% 34% 27% 27% 38% 27% Just a slight threat 11% 20% 6% 8% 5% 14% 7% No threat at all 7% 11% 2% 6% 7% 7% 6% No opinion 1% 2% * * * 1% * Sampling Error +/-3.0 +/-8.0 +/-8.0 +/-5.0 +/-5.5 +/-5.5 +/-3.5 Lean Lean Under $50K No Attended Demo- Repub- Total $50K or more College College crat lican ----- ----- ------- ------- -------- ------ ------ Very serious threat 49% 50% 47% 54% 46% 38% 63% Moderately serious threat 33% 29% 36% 27% 37% 39% 29% Just a slight threat 11% 11% 10% 10% 11% 15% 5% No threat at all 7% 8% 7% 8% 6% 7% 3% No opinion 1% 1% * 1% * * * Sampling Error +/-3.0 +/-5.0 +/-4.5 +/-6.0 +/-3.5 +/-4.5 +/-4.5 Demo- Indep- Repub- Lib- Mod- Conser- Total crat endent lican eral erate vative ----- ----- ------ ------ ----- ----- ------- Very serious threat 49% 43% 43% 68% 29% 45% 66% Moderately serious threat 33% 34% 36% 24% 35% 37% 28% Just a slight threat 11% 16% 10% 6% 24% 10% 4% No threat at all 7% 6% 10% 2% 12% 7% 3% No opinion 1% * 1% * * 1% * Sampling Error +/-3.0 +/-6.0 +/-5.0 +/-5.5 +/-6.5 +/-5.0 +/-5.0 North Mid- Sub- Total east west South West Urban urban Rural ----- ----- ----- ----- ----- ----- ----- ----- Very serious threat 49% 44% 49% 57% 44% 44% 50% 56% Moderately serious threat 33% 35% 37% 26% 36% 33% 35% 28% Just a slight threat 11% 12% 7% 11% 12% 12% 9% 11% No threat at all 7% 9% 7% 6% 6% 10% 5% 5% No opinion 1% * * * 2% * 1% * Sampling Error +/-3.0 +/-6.5 +/-6.5 +/-5.5 +/-6.5 +/-6.0 +/-4.5 +/-6.5 Tea Pty Tea Pty Tea Pty Total Support Neutral Oppose ----- ------- ------- ------- Very serious threat 49% 72% 48% 35% Moderately serious threat 33% 15% 33% 44% Just a slight threat 11% 5% 11% 15% No threat at all 7% 8% 7% 6% No opinion 1% * 1% * Sampling Error +/-3.0 +/-7.0 +/-4.5 +/-5.5 * percentage less than 1%

POLL 9 -27- September 4-8, 2015
3
CNN/ORC International Poll -- September 4 to 8, 2015 Question 9C Would you say that the following represent a very serious threat to the United States, a moderately serious threat, just a slight threat, or no threat at all? C. North Korea Base = Total Sample Total Men Women White Non-White ----- ----- ----- ----- --------- Very serious threat 37% 33% 41% 38% 37% Moderately serious threat 39% 38% 40% 39% 38% Just a slight threat 12% 14% 9% 12% 11% No threat at all 11% 14% 8% 9% 14% No opinion 1% 1% 2% 2% * Sampling Error +/-3.0 +/-4.5 +/-4.5 +/-3.5 +/-7.0 18- 35- 50- Under 50 and Total 34 49 64 65+ 50 Older ----- ----- ----- ----- ----- ----- ------ Very serious threat 37% 27% 39% 43% 43% 32% 43% Moderately serious threat 39% 36% 45% 37% 39% 40% 38% Just a slight threat 12% 16% 9% 9% 12% 13% 10% No threat at all 11% 19% 7% 9% 6% 14% 8% No opinion 1% 3% 1% 1% 1% 2% 1% Sampling Error +/-3.0 +/-8.0 +/-8.0 +/-5.0 +/-5.5 +/-5.5 +/-3.5 Lean Lean Under $50K No Attended Demo- Repub- Total $50K or more College College crat lican ----- ----- ------- ------- -------- ------ ------ Very serious threat 37% 41% 33% 40% 35% 35% 40% Moderately serious threat 39% 36% 42% 38% 40% 39% 41% Just a slight threat 12% 10% 14% 10% 13% 11% 12% No threat at all 11% 10% 11% 9% 13% 13% 6% No opinion 1% 3% * 3% * 1% 1% Sampling Error +/-3.0 +/-5.0 +/-4.5 +/-6.0 +/-3.5 +/-4.5 +/-4.5 Demo- Indep- Repub- Lib- Mod- Conser- Total crat endent lican eral erate vative ----- ----- ------ ------ ----- ----- ------- Very serious threat 37% 43% 32% 41% 28% 35% 45% Moderately serious threat 39% 33% 42% 40% 40% 40% 38% Just a slight threat 12% 8% 13% 13% 13% 12% 10% No threat at all 11% 14% 11% 6% 19% 11% 6% No opinion 1% 1% 2% 1% * 3% 1% Sampling Error +/-3.0 +/-6.0 +/-5.0 +/-5.5 +/-6.5 +/-5.0 +/-5.0 North Mid- Sub- Total east west South West Urban urban Rural ----- ----- ----- ----- ----- ----- ----- ----- Very serious threat 37% 41% 33% 41% 33% 35% 38% 40% Moderately serious threat 39% 37% 48% 35% 38% 37% 42% 35% Just a slight threat 12% 8% 10% 15% 11% 13% 11% 11% No threat at all 11% 12% 9% 9% 14% 15% 7% 12% No opinion 1% 2% * 1% 3% * 2% 2% Sampling Error +/-3.0 +/-6.5 +/-6.5 +/-5.5 +/-6.5 +/-6.0 +/-4.5 +/-6.5 Tea Pty Tea Pty Tea Pty Total Support Neutral Oppose ----- ------- ------- ------- Very serious threat 37% 45% 38% 30% Moderately serious threat 39% 32% 38% 45% Just a slight threat 12% 12% 13% 11% No threat at all 11% 11% 9% 15% No opinion 1% * 2% * Sampling Error +/-3.0 +/-7.0 +/-4.5 +/-5.5 * percentage less than 1%

POLL 9 -28- September 4-8, 2015
3
CNN/ORC International Poll -- September 4 to 8, 2015 Question 9E Would you say that the following represent a very serious threat to the United States, a moderately serious threat, just a slight threat, or no threat at all? E. Russia Base = Total Sample Total Men Women White Non-White ----- ----- ----- ----- --------- Very serious threat 30% 26% 33% 30% 28% Moderately serious threat 40% 44% 35% 41% 38% Just a slight threat 16% 16% 17% 16% 17% No threat at all 13% 14% 12% 11% 17% No opinion 1% * 1% 1% * Sampling Error +/-3.0 +/-4.5 +/-4.5 +/-3.5 +/-7.0 18- 35- 50- Under 50 and Total 34 49 64 65+ 50 Older ----- ----- ----- ----- ----- ----- ------ Very serious threat 30% 21% 30% 35% 38% 25% 36% Moderately serious threat 40% 29% 42% 44% 47% 35% 45% Just a slight threat 16% 24% 15% 14% 8% 20% 12% No threat at all 13% 24% 12% 7% 7% 19% 7% No opinion 1% 2% * * * 1% * Sampling Error +/-3.0 +/-8.0 +/-8.0 +/-5.0 +/-5.5 +/-5.5 +/-3.5 Lean Lean Under $50K No Attended Demo- Repub- Total $50K or more College College crat lican ----- ----- ------- ------- -------- ------ ------ Very serious threat 30% 32% 28% 34% 27% 24% 37% Moderately serious threat 40% 38% 42% 39% 40% 39% 39% Just a slight threat 16% 12% 19% 15% 18% 21% 14% No threat at all 13% 17% 11% 11% 15% 15% 9% No opinion 1% 2% * 2% * * * Sampling Error +/-3.0 +/-5.0 +/-4.5 +/-6.0 +/-3.5 +/-4.5 +/-4.5 Demo- Indep- Repub- Lib- Mod- Conser- Total crat endent lican eral erate vative ----- ----- ------ ------ ----- ----- ------- Very serious threat 30% 28% 27% 37% 18% 26% 41% Moderately serious threat 40% 41% 38% 41% 37% 45% 36% Just a slight threat 16% 15% 18% 13% 24% 16% 12% No threat at all 13% 15% 15% 8% 21% 12% 11% No opinion 1% 1% 1% * 1% 1% * Sampling Error +/-3.0 +/-6.0 +/-5.0 +/-5.5 +/-6.5 +/-5.0 +/-5.0 North Mid- Sub- Total east west South West Urban urban Rural ----- ----- ----- ----- ----- ----- ----- ----- Very serious threat 30% 30% 25% 37% 24% 30% 30% 32% Moderately serious threat 40% 42% 40% 38% 40% 37% 40% 43% Just a slight threat 16% 12% 19% 14% 20% 17% 18% 11% No threat at all 13% 15% 16% 10% 14% 16% 11% 13% No opinion 1% 1% * * 2% * 1% 1% Sampling Error +/-3.0 +/-6.5 +/-6.5 +/-5.5 +/-6.5 +/-6.0 +/-4.5 +/-6.5 Tea Pty Tea Pty Tea Pty Total Support Neutral Oppose ----- ------- ------- ------- Very serious threat 30% 39% 29% 23% Moderately serious threat 40% 42% 36% 43% Just a slight threat 16% 9% 17% 21% No threat at all 13% 10% 16% 12% No opinion 1% * 1% * Sampling Error +/-3.0 +/-7.0 +/-4.5 +/-5.5 * percentage less than 1%
POLL 9 -29- September 4-8, 2015
3
CNN/ORC International Poll -- September 4 to 8, 2015 Question 10 As you may know, the U.S. Congress must approve the agreement the United States and five other countries reached with Iran that is aimed at preventing Iran from developing nuclear weapons before it can take effect. Do you think Congress should approve or reject the deal with Iran? Base = Total Sample Total Men Women White Non-White ----- ----- ----- ----- --------- Approve 47% 43% 50% 43% 54% Reject 49% 55% 44% 54% 41% No opinion 4% 2% 6% 4% 5% Sampling Error +/-3.0 +/-4.5 +/-4.5 +/-3.5 +/-7.0 18- 35- 50- Under 50 and Total 34 49 64 65+ 50 Older ----- ----- ----- ----- ----- ----- ------ Approve 47% 61% 42% 40% 39% 53% 40% Reject 49% 36% 55% 53% 58% 44% 55% No opinion 4% 4% 2% 6% 3% 3% 5% Sampling Error +/-3.0 +/-8.0 +/-8.0 +/-5.0 +/-5.5 +/-5.5 +/-3.5 Lean Lean Under $50K No Attended Demo- Repub- Total $50K or more College College crat lican ----- ----- ------- ------- -------- ------ ------ Approve 47% 47% 48% 41% 51% 66% 23% Reject 49% 49% 49% 53% 46% 31% 73% No opinion 4% 4% 3% 7% 2% 3% 4% Sampling Error +/-3.0 +/-5.0 +/-4.5 +/-6.0 +/-3.5 +/-4.5 +/-4.5 Demo- Indep- Repub- Lib- Mod- Conser- Total crat endent lican eral erate vative ----- ----- ------ ------ ----- ----- ------- Approve 47% 64% 49% 23% 68% 54% 27% Reject 49% 33% 46% 74% 29% 40% 72% No opinion 4% 3% 5% 3% 4% 7% 1% Sampling Error +/-3.0 +/-6.0 +/-5.0 +/-5.5 +/-6.5 +/-5.0 +/-5.0 North Mid- Sub- Total east west South West Urban urban Rural ----- ----- ----- ----- ----- ----- ----- ----- Approve 47% 46% 47% 42% 53% 54% 42% 42% Reject 49% 47% 48% 56% 43% 42% 53% 55% No opinion 4% 7% 5% 1% 5% 4% 5% 3% Sampling Error +/-3.0 +/-6.5 +/-6.5 +/-5.5 +/-6.5 +/-6.0 +/-4.5 +/-6.5 Tea Pty Tea Pty Tea Pty Total Support Neutral Oppose ----- ------- ------- ------- Approve 47% 25% 40% 76% Reject 49% 73% 54% 22% No opinion 4% 3% 5% 2% Sampling Error +/-3.0 +/-7.0 +/-4.5 +/-5.5 * percentage less than 1%
POLL 9 -30- September 4-8, 2015
3
CNN/ORC International Poll -- September 4 to 8, 2015 Question 11 Suppose the agreement is approved and Iran violates its terms. If that happens, do you think the United States should or should not take military action against Iran? Base = Total Sample Total Men Women White Non-White ----- ----- ----- ----- --------- Should take military action 64% 59% 70% 65% 62% Should not take military acts 34% 40% 28% 32% 37% No opinion 2% 2% 2% 2% 1% Sampling Error +/-3.0 +/-4.5 +/-4.5 +/-3.5 +/-7.0 18- 35- 50- Under 50 and Total 34 49 64 65+ 50 Older ----- ----- ----- ----- ----- ----- ------ Should take military action 64% 61% 68% 69% 58% 64% 65% Should not take military acts 34% 38% 31% 30% 38% 35% 33% No opinion 2% 2% 1% 2% 4% 1% 2% Sampling Error +/-3.0 +/-8.0 +/-8.0 +/-5.0 +/-5.5 +/-5.5 +/-3.5 Lean Lean Under $50K No Attended Demo- Repub- Total $50K or more College College crat lican ----- ----- ------- ------- -------- ------ ------ Should take military action 64% 70% 58% 73% 58% 56% 74% Should not take military acts 34% 29% 40% 27% 39% 42% 25% No opinion 2% 1% 2% 1% 3% 3% 1% Sampling Error +/-3.0 +/-5.0 +/-4.5 +/-6.0 +/-3.5 +/-4.5 +/-4.5 Demo- Indep- Repub- Lib- Mod- Conser- Total crat endent lican eral erate vative ----- ----- ------ ------ ----- ----- ------- Should take military action 64% 57% 64% 72% 49% 62% 77% Should not take military acts 34% 40% 34% 26% 47% 37% 22% No opinion 2% 3% 1% 2% 4% 1% 2% Sampling Error +/-3.0 +/-6.0 +/-5.0 +/-5.5 +/-6.5 +/-5.0 +/-5.0 North Mid- Sub- Total east west South West Urban urban Rural ----- ----- ----- ----- ----- ----- ----- ----- Should take military action 64% 61% 68% 68% 58% 59% 64% 72% Should not take military acts 34% 37% 31% 29% 41% 39% 33% 27% No opinion 2% 2% 1% 3% 1% 2% 3% 1% Sampling Error +/-3.0 +/-6.5 +/-6.5 +/-5.5 +/-6.5 +/-6.0 +/-4.5 +/-6.5 Tea Pty Tea Pty Tea Pty Total Support Neutral Oppose ----- ------- ------- ------- Should take military action 64% 79% 69% 46% Should not take military acts 34% 20% 30% 50% No opinion 2% 2% 1% 4% Sampling Error +/-3.0 +/-7.0 +/-4.5 +/-5.5 * percentage less than 1%
POLL 9 -31- September 4-8, 2015
3
CNN/ORC International Poll -- September 4 to 8, 2015 Question 12 If the agreement is approved, how likely do you think it is that Iran will violate the terms of the agreement? Base = Total Sample Total Men Women White Non-White ----- ----- ----- ----- --------- Extremely likely 37% 39% 35% 41% 27% Very likely 23% 20% 27% 24% 22% Somewhat likely 30% 28% 32% 27% 37% Not at all likely 10% 12% 7% 8% 14% No opinion * * * * * Sampling Error +/-3.0 +/-4.5 +/-4.5 +/-3.5 +/-7.0 18- 35- 50- Under 50 and Total 34 49 64 65+ 50 Older ----- ----- ----- ----- ----- ----- ------ Extremely likely 37% 21% 43% 44% 44% 30% 44% Very likely 23% 20% 28% 23% 23% 23% 23% Somewhat likely 30% 45% 23% 24% 23% 36% 24% Not at all likely 10% 13% 7% 9% 10% 10% 9% No opinion * 1% * * * * * Sampling Error +/-3.0 +/-8.0 +/-8.0 +/-5.0 +/-5.5 +/-5.5 +/-3.5 Lean Lean Under $50K No Attended Demo- Repub- Total $50K or more College College crat lican ----- ----- ------- ------- -------- ------ ------ Extremely likely 37% 33% 40% 38% 35% 18% 57% Very likely 23% 29% 19% 27% 20% 25% 22% Somewhat likely 30% 29% 30% 27% 32% 42% 17% Not at all likely 10% 9% 11% 8% 11% 15% 3% No opinion * 1% * * * * * Sampling Error +/-3.0 +/-5.0 +/-4.5 +/-6.0 +/-3.5 +/-4.5 +/-4.5 Demo- Indep- Repub- Lib- Mod- Conser- Total crat endent lican eral erate vative ----- ----- ------ ------ ----- ----- ------- Extremely likely 37% 17% 36% 61% 19% 27% 57% Very likely 23% 27% 22% 22% 23% 25% 23% Somewhat likely 30% 40% 33% 14% 43% 37% 16% Not at all likely 10% 16% 10% 3% 15% 11% 5% No opinion * 1% * * 1% * * Sampling Error +/-3.0 +/-6.0 +/-5.0 +/-5.5 +/-6.5 +/-5.0 +/-5.0 North Mid- Sub- Total east west South West Urban urban Rural ----- ----- ----- ----- ----- ----- ----- ----- Extremely likely 37% 33% 35% 41% 36% 33% 40% 37% Very likely 23% 22% 23% 26% 21% 20% 22% 31% Somewhat likely 30% 32% 31% 24% 37% 35% 30% 23% Not at all likely 10% 13% 11% 9% 6% 12% 8% 9% No opinion * * * * * * * * Sampling Error +/-3.0 +/-6.5 +/-6.5 +/-5.5 +/-6.5 +/-6.0 +/-4.5 +/-6.5 Tea Pty Tea Pty Tea Pty Total Support Neutral Oppose ----- ------- ------- ------- Extremely likely 37% 64% 36% 19% Very likely 23% 16% 27% 19% Somewhat likely 30% 13% 29% 47% Not at all likely 10% 7% 8% 15% No opinion * * * 1% Sampling Error +/-3.0 +/-7.0 +/-4.5 +/-5.5 * percentage less than 1%
POLL 9 -32- September 4-8, 2015
3
CNN/ORC International Poll -- September 4 to 8, 2015 Question 34 Do you happen to know what religion Barack Obama is? Is he Protestant, Catholic, Jewish, Mormon, Muslim, something else, or not religious? Base = Total Sample Total Men Women White Non-White ----- ----- ----- ----- --------- Protestant/Christian 39% 37% 41% 36% 43% Catholic 4% 3% 5% 4% 5% Jewish 1% * 1% * 1% Mormon/LDS 2% 1% 2% 1% 3% Muslim/Islam/Islamic 29% 32% 25% 33% 20% Something else 1% 1% * 1% 1% Not religious 11% 12% 10% 10% 13% No opinion 14% 12% 16% 14% 14% Sampling Error +/-3.0 +/-4.5 +/-4.5 +/-3.5 +/-7.0 18- 35- 50- Under 50 and Total 34 49 64 65+ 50 Older ----- ----- ----- ----- ----- ----- ------ Protestant/Christian 39% 37% 40% 36% 43% 39% 39% Catholic 4% 7% 6% 2% 3% 6% 2% Jewish 1% * 2% * * 1% * Mormon/LDS 2% 5% * * * 3% * Muslim/Islam/Islamic 29% 20% 29% 33% 36% 24% 34% Something else 1% * 1% 1% * 1% 1% Not religious 11% 14% 9% 11% 9% 12% 10% No opinion 14% 17% 13% 16% 9% 15% 13% Sampling Error +/-3.0 +/-8.0 +/-8.0 +/-5.0 +/-5.5 +/-5.5 +/-3.5 Lean Lean Under $50K No Attended Demo- Repub- Total $50K or more College College crat lican ----- ----- ------- ------- -------- ------ ------ Protestant/Christian 39% 32% 45% 24% 50% 54% 27% Catholic 4% 5% 4% 7% 3% 6% 1% Jewish 1% 1% * 1% 1% 1% * Mormon/LDS 2% 4% * 3% 1% 2% 1% Muslim/Islam/Islamic 29% 32% 26% 36% 23% 17% 44% Something else 1% 1% * 1% 1% 1% 1% Not religious 11% 13% 10% 13% 9% 4% 14% No opinion 14% 12% 15% 15% 13% 14% 13% Sampling Error +/-3.0 +/-5.0 +/-4.5 +/-6.0 +/-3.5 +/-4.5 +/-4.5 Demo- Indep- Repub- Lib- Mod- Conser- Total crat endent lican eral erate vative ----- ----- ------ ------ ----- ----- ------- Protestant/Christian 39% 61% 32% 28% 52% 42% 27% Catholic 4% 6% 5% 2% 12% 3% 1% Jewish 1% 1% * * * * 1% Mormon/LDS 2% * 3% * 2% 3% 1% Muslim/Islam/Islamic 29% 15% 29% 43% 14% 23% 45% Something else 1% * 1% 1% 1% 1% 1% Not religious 11% 4% 13% 15% 7% 12% 11% No opinion 14% 14% 16% 10% 12% 15% 13% Sampling Error +/-3.0 +/-6.0 +/-5.0 +/-5.5 +/-6.5 +/-5.0 +/-5.0 North Mid- Sub- Total east west South West Urban urban Rural ----- ----- ----- ----- ----- ----- ----- ----- Protestant/Christian 39% 42% 37% 38% 39% 47% 40% 26% Catholic 4% 6% 2% 4% 6% 6% 3% 6% Jewish 1% * 1% * 2% * * 1% Mormon/LDS 2% * 2% 2% 2% 2% 2% * Muslim/Islam/Islamic 29% 31% 28% 32% 22% 21% 31% 37% Something else 1% 1% 2% 1% 1% * 1% * Not religious 11% 6% 8% 13% 15% 10% 11% 11% No opinion 14% 15% 21% 10% 13% 13% 13% 19% Sampling Error +/-3.0 +/-6.5 +/-6.5 +/-5.5 +/-6.5 +/-6.0 +/-4.5 +/-6.5 * percentage less than 1%
POLL 9 -33- September 4-8, 2015
3
CNN/ORC International Poll -- September 4 to 8, 2015 Question 34 Do you happen to know what religion Barack Obama is? Is he Protestant, Catholic, Jewish, Mormon, Muslim, something else, or not religious? Base = Total Sample Tea Pty Tea Pty Tea Pty Total Support Neutral Oppose ----- ------- ------- ------- Protestant/Christian 39% 25% 32% 64% Catholic 4% 3% 4% 5% Jewish 1% * 1% * Mormon/LDS 2% 1% 3% * Muslim/Islam/Islamic 29% 47% 30% 13% Something else 1% 1% 1% 2% Not religious 11% 11% 14% 5% No opinion 14% 13% 16% 11% Sampling Error +/-3.0 +/-7.0 +/-4.5 +/-5.5 * percentage less than 1%
POLL 9 -34- September 4-8, 2015
3
CNN/ORC International Poll -- September 4 to 8, 2015 Question 35 On another subject, where was Barack Obama born, as far as you know? Base = Total Sample Total Men Women White Non-White ----- ----- ----- ----- --------- Honolulu/Hawaii 59% 59% 60% 60% 57% America/United States 4% 4% 5% 3% 7% America/United States 12% 15% 9% 13% 12% Africa 4% 3% 6% 5% 4% Kenya 4% 6% 3% 5% 3% Middle East 1% * 2% 1% * Indonesia/Asia 1% 1% * 1% * Another country 2% 3% 2% 1% 5% No opinion 12% 9% 14% 11% 13% Sampling Error +/-3.0 +/-4.5 +/-4.5 +/-3.5 +/-7.0 18- 35- 50- Under 50 and Total 34 49 64 65+ 50 Older ----- ----- ----- ----- ----- ----- ------ Honolulu/Hawaii 59% 51% 72% 55% 64% 60% 58% America/United States 4% 6% 4% 4% 2% 5% 4% America/United States 12% 21% 10% 10% 4% 16% 8% Africa 4% 1% 1% 7% 8% 1% 8% Kenya 4% 2% 3% 5% 8% 3% 6% Middle East 1% 2% * * 1% 1% 1% Indonesia/Asia 1% * * * 2% * 1% Another country 2% 5% 2% 1% 1% 4% 1% No opinion 12% 12% 9% 16% 9% 10% 13% Sampling Error +/-3.0 +/-8.0 +/-8.0 +/-5.0 +/-5.5 +/-5.5 +/-3.5 Lean Lean Under $50K No Attended Demo- Repub- Total $50K or more College College crat lican ----- ----- ------- ------- -------- ------ ------ Honolulu/Hawaii 59% 54% 63% 49% 66% 65% 55% America/United States 4% 5% 4% 3% 5% 7% 3% America/United States 12% 16% 9% 14% 11% 15% 10% Africa 4% 5% 3% 6% 3% 2% 7% Kenya 4% 4% 5% 4% 4% 1% 9% Middle East 1% 2% * 2% * * 1% Indonesia/Asia 1% * 1% * 1% * 1% Another country 2% 4% 1% 4% 1% 3% 1% No opinion 12% 9% 14% 17% 8% 7% 14% Sampling Error +/-3.0 +/-5.0 +/-4.5 +/-6.0 +/-3.5 +/-4.5 +/-4.5 Demo- Indep- Repub- Lib- Mod- Conser- Total crat endent lican eral erate vative ----- ----- ------ ------ ----- ----- ------- Honolulu/Hawaii 59% 65% 57% 56% 66% 63% 51% America/United States 4% 8% 4% 1% 5% 5% 3% America/United States 12% 12% 13% 11% 13% 12% 12% Africa 4% 4% 3% 7% 1% 4% 7% Kenya 4% 2% 4% 9% 1% 2% 10% Middle East 1% * 1% 1% * 2% 1% Indonesia/Asia 1% * * 1% * * 1% Another country 2% 3% 3% 1% 1% 2% 4% No opinion 12% 6% 15% 12% 12% 11% 12% Sampling Error +/-3.0 +/-6.0 +/-5.0 +/-5.5 +/-6.5 +/-5.0 +/-5.0 North Mid- Sub- Total east west South West Urban urban Rural ----- ----- ----- ----- ----- ----- ----- ----- Honolulu/Hawaii 59% 62% 56% 60% 58% 61% 59% 55% America/United States 4% 5% 4% 5% 4% 5% 5% 4% America/United States 12% 15% 13% 7% 16% 12% 12% 15% Africa 4% 4% 7% 5% 2% 4% 4% 6% Kenya 4% 1% 3% 7% 4% 3% 5% 4% Middle East 1% * 1% 1% 2% * 2% 1% Indonesia/Asia 1% 1% * 1% * * 1% 1% Another country 2% 2% 3% 3% * 2% 3% 2% No opinion 12% 10% 12% 11% 13% 12% 11% 13% Sampling Error +/-3.0 +/-6.5 +/-6.5 +/-5.5 +/-6.5 +/-6.0 +/-4.5 +/-6.5 * percentage less than 1% CNN/ORC International Poll -- September 4 to 8, 2015 Question 35 On another subject, where was Barack Obama born, as far as you know?
POLL 9 -35- September 4-8, 2015
3
Base = Total Sample Tea Pty Tea Pty Tea Pty Total Support Neutral Oppose ----- ------- ------- ------- Honolulu/Hawaii 59% 50% 53% 79% America/United States 4% 3% 5% 4% America/United States 12% 6% 14% 11% Africa 4% 8% 5% 1% Kenya 4% 14% 3% * Middle East 1% * 1% * Indonesia/Asia 1% 1% * 1% Another country 2% 1% 4% * No opinion 12% 16% 13% 4% Sampling Error +/-3.0 +/-7.0 +/-4.5 +/-5.5 * percentage less than 1%
POLL 9 -36- September 4-8, 2015
3
CNN/ORC International Poll -- September 4 to 8, 2015 Question 35/36/37 Q35. On another subject, where was Barack Obama born, as far as you know? Q36. Is it your best guess that Obama was born in the United States, or in another country? Q37. Do you think there's been solid evidence of that, or is that your suspicion only? Base = Total Sample Total Men Women White Non-White ----- ----- ----- ----- --------- Honolulu/Hawaii 59% 59% 60% 60% 57% America/United States 4% 4% 5% 3% 7% America/United States 17% 18% 16% 17% 15% Solid evidence 9% 8% 9% 10% 7% Suspicion only 11% 10% 11% 9% 14% No opinion 1% 1% * 1% 1% Sampling Error +/-3.0 +/-4.5 +/-4.5 +/-3.5 +/-7.0 18- 35- 50- Under 50 and Total 34 49 64 65+ 50 Older ----- ----- ----- ----- ----- ----- ------ Honolulu/Hawaii 59% 51% 72% 55% 64% 60% 58% America/United States 4% 6% 4% 4% 2% 5% 4% America/United States 17% 26% 15% 15% 5% 21% 11% Solid evidence 9% 8% 4% 10% 14% 6% 12% Suspicion only 11% 9% 6% 15% 13% 7% 14% No opinion 1% * * 1% 1% * 1% Sampling Error +/-3.0 +/-8.0 +/-8.0 +/-5.0 +/-5.5 +/-5.5 +/-3.5 Lean Lean Under $50K No Attended Demo- Repub- Total $50K or more College College crat lican ----- ----- ------- ------- -------- ------ ------ Honolulu/Hawaii 59% 54% 63% 49% 66% 65% 55% America/United States 4% 5% 4% 3% 5% 7% 3% America/United States 17% 18% 16% 21% 13% 18% 13% Solid evidence 9% 10% 8% 11% 7% 3% 13% Suspicion only 11% 12% 9% 15% 7% 6% 15% No opinion 1% * 1% * 1% 1% 1% Sampling Error +/-3.0 +/-5.0 +/-4.5 +/-6.0 +/-3.5 +/-4.5 +/-4.5 Demo- Indep- Repub- Lib- Mod- Conser- Total crat endent lican eral erate vative ----- ----- ------ ------ ----- ----- ------- Honolulu/Hawaii 59% 65% 57% 56% 66% 63% 51% America/United States 4% 8% 4% 1% 5% 5% 3% America/United States 17% 14% 20% 14% 20% 16% 14% Solid evidence 9% 3% 8% 16% 3% 7% 14% Suspicion only 11% 9% 11% 12% 6% 8% 17% No opinion 1% 1% * 1% * * 1% Sampling Error +/-3.0 +/-6.0 +/-5.0 +/-5.5 +/-6.5 +/-5.0 +/-5.0 North Mid- Sub- Total east west South West Urban urban Rural ----- ----- ----- ----- ----- ----- ----- ----- Honolulu/Hawaii 59% 62% 56% 60% 58% 61% 59% 55% America/United States 4% 5% 4% 5% 4% 5% 5% 4% America/United States 17% 19% 17% 11% 23% 16% 17% 18% Solid evidence 9% 7% 9% 11% 7% 8% 9% 9% Suspicion only 11% 8% 13% 13% 7% 10% 10% 14% No opinion 1% * 1% * 1% 1% * 1% Sampling Error +/-3.0 +/-6.5 +/-6.5 +/-5.5 +/-6.5 +/-6.0 +/-4.5 +/-6.5 Tea Pty Tea Pty Tea Pty Total Support Neutral Oppose ----- ------- ------- ------- Honolulu/Hawaii 59% 50% 53% 79% America/United States 4% 3% 5% 4% America/United States 17% 11% 19% 13% Solid evidence 9% 22% 8% 1% Suspicion only 11% 14% 13% 2% No opinion 1% 1% 1% * Sampling Error +/-3.0 +/-7.0 +/-4.5 +/-5.5 * percentage less than 1%


![f'ku dh frifg;k lkbfdy - Turner Broadcasting Systemi2.cdn.turner.com/cnn/2015/images/07/31/shin.pdff'ku dh eka us mlds da/s ij gYds ls gkFk j[kk vkSj mlls dgk] ^f'ku gesa ekiQ dj nksA](https://img.pdfslide.net/doc/110x75/5ea98abfa6115c267d1b63c4/fku-dh-frifgk-lkbfdy-turner-broadcasting-fku-dh-eka-us-mlds-das-ij-gyds-ls.jpg)