Embed Size (px)
Citation preview

September 2016

2
• Design Capacity : 89.7 mt
• Production Capacity : 75.5 mit
• Domestic Growth : 5.5%
• Domestic Utilization: 87%
•Supply
Domestic : 65 mt
Export : 4.0 mt
Import : 1.5 mt
Domestic Capacity (2016)
2016F
Cement companies in Indonesia
1. Semen Indonesia 30 mt
2. Semen Andalas 1.6 mt
3. Semen Baturaja 2.0 mt
4. Indocement TP 25.9 mt
5. Holcim Indonesia 12.1 mt
6. Semen Bosowa 6.0 mt
7. Semen Kupang 0.5 mt
8. Semen Jui Shin 2.0 mt
9. Semen Puger 0.3 mt
10. Semen Merah Putih 4.0 mt
11. Semen Anhui Conch 1.7 mt
12. Siam Cement 1.8 mt
13. Semen Pan Asia 1.8 mt
TOTAL 89.7 mio ton
New Players 2016

3
Opportunity Regional Cement Market

4Source: Company data
Sales volume
Million tonnes Aug-16 Aug-15 Change (%) 8M16 8M15 Change (%)
Indonesia
Semen Indonesia 1.38 1.28 8.1% 8.78 8.61 2.0%
Semen Padang 0.63 0.56 13.8% 3.95 3.87 2.3%
Semen Tonasa 0.50 0.47 6.9% 3.49 3.29 5.9%
Total domestic 2.51 2.30 9.2% 16.22 15.77 2.9%
Exports 0.09 0.03 187.9% 0.36 0.35 4.1%
Total volume from Indonesia 2.60 2.33 11.6% 16.58 16.11 2.9%
Vietnam
Domestic Vietnam 0.13 0.12 7.5% 1.15 1.05 9.8%
Exports 0.04 0.04 10.6% 0.50 0.51 -3.5%
Total volume from Vietnam 0.17 0.16 8.2% 1.64 1.56 5.4%
Total volume 2.77 2.49 11.3% 18.23 17.67 3.1%

5
Source: Company data, Indonesia Cement Association
Indonesia sales volume
Semen Indonesia:• Bag 76.4%• Bulk 23.6%
Industry:• Bag 76.8%• Bulk 23.2%
Domestic consumption (million tons)
Area Aug-16 Aug-15 Change (%) 8M16 8M15 Change (%)
Jakarta 0.45 0.44 4.4 3.08 3.42 (9.9)
Banten 0.28 0.30 (7.6) 1.89 2.09 (9.7)
West Java 0.83 0.81 1.8 5.55 5.56 (0.2)
Central Java 0.80 0.70 14.3 4.85 4.34 11.6
Yogyakarta 0.10 0.09 8.9 0.60 0.60 0.8
East Java 0.79 0.78 1.4 5.32 5.00 6.3
Total Java 3.25 3.12 4.1 21.29 21.02 1.3
Sumatera 1.36 1.15 17.6 8.40 7.72 8.8
Kalimantan 0.42 0.39 5.8 2.69 3.05 (11.8)
Sulawesi 0.47 0.41 14.6 3.39 2.79 21.5
Nusa Tenggara 0.36 0.31 17.0 2.32 2.18 6.6
Maluku & Papua 0.12 0.11 9.9 0.98 0.86 13.6
Total outside Java 2.72 2.37 14.7 17.78 16.60 7.1
Total Indonesia 5.97 5.49 8.7 39.07 37.62 3.9
Export
Cement 0.04 0.03 34.7 0.30 0.37 (17.7)
Clinker 0.15 0.13 14.2 0.72 0.30 139.7
Total export 0.19 0.16 18.2 1.02 0.67 52.8
Grand total 6.16 5.65 9.0 40.09 38.29 4.7

6
Retail (residential) sector is the largest consumer of cement in Indonesia
Bag77%
Bulk
23%
• Ready-mix (infrastructure):± 60%
• Fabricator (pre-cast, fiber cement, cement based industry):± 35%
• Projects (mortar, render):± 5%
• Housing:± 90%
• Cement based industry:± 10%
±
±
Source: Internal Research
Domestic market consumption

7
Market by Geography
Source: Company data, Central Bureau of Statistics
Domestic Market ShareSemen Indonesia’ market destinations
National cement distribution Population distribution

8
Current overcapacity condition
Source: Internal Research, Indonesia Cement Association

9
Source: Company data, Indonesian Cement Association & BPS Statistic
Long-term demand growth 6% pa
10
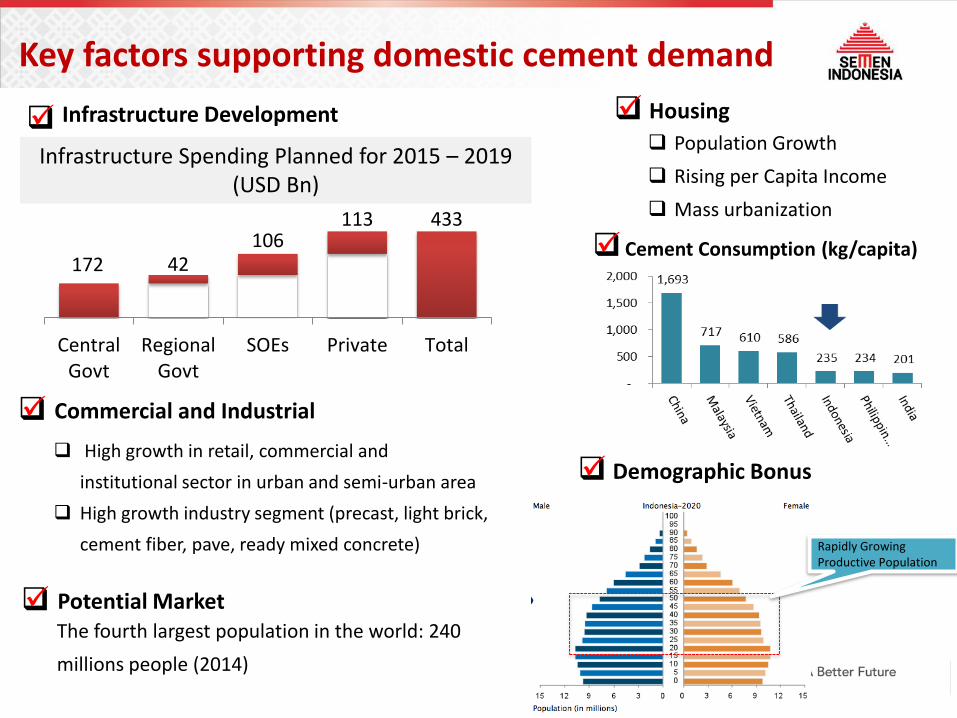
Infrastructure Spending Planned for 2015 – 2019 (USD Bn)
Infrastructure Development
Commercial and Industrial
High growth in retail, commercial and
institutional sector in urban and semi-urban area
High growth industry segment (precast, light brick,
cement fiber, pave, ready mixed concrete)
Housing
Population Growth
Rising per Capita Income
Mass urbanization
Cement Consumption (kg/capita)
Rapidly Growing Productive Population
Key factors supporting domestic cement demand
172 42106
113 433
CentralGovt
RegionalGovt
SOEs Private Total
Potential Market
The fourth largest population in the world: 240
millions people (2014)
Demographic Bonus

11
Arising infrastructure activities
Source: Company data, Indonesia Cement Association

12
Strategic Projects
These strategic projects are to ensure the Company’ position as the market leader.
Strategic Projects CapacityInvestment
(US$mn)
Construction
Start Completion
Indarung VI-
Sumatera Barat
3.0
Mt352 Q2-2013 Q4-2016
Rembang –
Jawa Tengah
3.0
Mt403 Q2-2013 Q4-2016
Grinding mill
Jawa Barat
2.0
Mt61.1 Q2-2015 Q4-2016
Waste Heat
Recovery Power
Generation
30.6 MW 49.3 Q4-2014 Q4-2016
Projects completed in 2015:
• Packing Plant Pontianak
• Packing Plant Balikpapan
• Packing Plant Lampung
• Grinding Plant Dumai
• New Coal Mill Tonasa
Rembang Project – Central Java
Pre-heater area
Indarung Project – West Sumatra
Clinker Storage

13
Integrated Cement Plant 4 location
Kiln 13 Unit
Cement Mill 22 Unit
Grinding Plant 2 location
Cement Mill 4 Unit
Warehouse 30 location
Packing Plant 25 location
Sea Port 12 location
Kiln 1 unit
Cement Mill1 unit
Kiln 4 unit
Cement Mill 6 unit
Kiln 4 unit
Cement Mill 9 unit
Grinding Plant
1 unit Cement Mill
Kiln 4 unit
Cement Mill 6 unitGrinding Plant
3 unit Cement Mill
Our facilities

14
Financial Summary – First half 2016
EBITDA
Net profit
In Rpbn 6M16 6M15 Change
Revenue 12,470 12,640 -1.3%
Cost revenue 7,483 7,635 -2.0%
Gross profit 4,988 5,006 -0.4%
Operating expenses 2,373 2,212 7.3%
Operating income 2,615 2,794 -6.4%
EBITDA 3,405 3,515 -3.1%
Pre-tax profit 2,574 2,798 -8.0%
Net profit 1,965 2,185 -10.1%
EPS (Rp) 331 368 -10.1%
Ratio
EBITDA margin 27% 28% 0%
Gross margin 40% 40% 0%
Interest coverage - x 21 20 1
Cost ratio 79% 78% 1%
Net debt to equity 0.09 0.04 5%
Debt to equity 0.18 0.16 1%
Debt to EBITDA 0.68 0.56 12%
Receivable turnover - days 53 48 5

15
Balance Sheet
Cash balance (Rpbn) Total debt (Rpbn)
Debt/EBITDA (x) Net Debt/Equity

16
Margin & Returns
Return on Equity (%) Return on Assets (%)
EBITDA/t (US$/t) Receivables Turnover (days)

17
Cost structure
Energy prices in US$/unit
Cash COGS Rp000/tRp000/t 6M16 6M15 Change
Raw materials 35 37 -6%
Fuel 111 117 -5%
Electricity 97 106 -8%
Labor 57 52 9%
Maintenance 53 54 -3%
Depreciation 54 49 10%
GA,tax,insurance 20 21 -5%
Packaging 29 27 7%
Transportation 71 84 -15%
Others 22 48 -55%
Cost of goods sold 548 595 -8%
Selling expense 103 93 11%
G&A 74 73 1%
Total cost 580 607 -5%

18
EBITDA margin vs utilisation rate
Source: Company data

19
EBITDA margin vs oil and coal prices
Source: Company data

20
Development New Industrial Estates is a catalyst for cement demand
Semen Indonesia Packing PlantNew Industrial Estate Area

21
Infrastructure Projects (2015 – 2019)
If 1% from total project value were spent for cement, we estimate cement requirement for these projects of around 10-12 mt per annum.
Infrastructure budget cut Rp7tn for 2016, but not affecting main trans road in Papua and Java.
Sector Amount % of total
(Rptn)
Road infrastructure 733 15%
Railway infrastructure 226 5%
Sea transportation 591 12%
Air transportation 144 3%
Land transportation 47 1%
Urban transportation 86 2%
Electricity infrastructure 1,000 21%
Oil & gas infrastructure 507 11%
Telecommunication and Information infrastructure 280 6%
Water resources 451 9%
Drinking and waste water 403 8%
Housing 328 7%
Total 4,796 100%
Annual spending 959 20%
APBN-P 2016 2,083
APBN-P for infrastructure 2016 314 33%
Private portion 645 67%
Source: Bappenas

22
Infrastructure Spending in State Budget
Source: Ministry of Finance
Amount in Rp trillion 2017 2015
APBN APBN-P APBN APBN-P
Economic infrastructure 336.9 307.1 302.3 280.0
Ministrial spending 161.0 151.2 165.5 196.4
Ministry of Public Work and Public Housing 102.9 94.7 101.7 111.1
Ministry of Transportation 44.9 39.9 45.5 59.1
Ministry of Agriculture 2.9 4.1 5.3 8.9
Ministry of Energy and Mineral Resoures 3.8 3.7 4.6 8.1
Non-ministrial spending 2.7 5.9 5.3 6.8
Transfer to Region and Village Fund 133.7 88.0 83.4 41.0
Payment Funding 39.5 62.1 48.3 35.7
Social infrastructure 5.5 5.7 6.5 6.5
Infrastructure support 4.2 4.2 4.4 3.9
Ministry of Agrarian & Spatial Planning 0.2 0.3 0.3 1.3
Ministry of Industry 0.6 0.4 0.5 0.3
Total 346.6 317.1 313.5 290.3
2016

23
Instrastructure funding is priority
The infrastructure is the government’ priority
Gets funding priority despite tax revenue not achieving target
Key risks are more on the project risks such as land acquisition.
Increasing government’ debt to around US$137bn by end of 2015
Government’s securities also increased to around Rp1.37tn by end of 2015

24
Projection of Toll Road Development (2015 – 2019)

25
BRIEF HISTORY SMGR CAPACITY BUILD-OUT (MM TONS)
31,8 mn tons
Semen Indonesia highlights
1957 : Inauguration of Gresik I, installed capacity of
250,000 ton cement per annum
1991 : Initial Public Offering, Market Cap.: IDR0.63tn,
resulting shareholding structure post IPO:
●Government of Republic of Indonesia: 73%
●Public: 27%
1995 : Acquisition of PT Semen Padang (Persero) and
PT Semen Tonasa (Persero)
1998 : Cemex became a strategic partner, Market Cap.:
IDR4.9tn
2006 : Blue Valley Holdings bought Cemex’s 24.9%
stake in SMGR, Market Cap.: IDR21.5tn
2010 : In March 31, Blue Valley Holdings sold all of its
stake ownership in SMGR, Market Cap per April 30,
2010: IDR72.1tn
2011 : Total installed capacity of 20.00mm tons, Market
Cap per June 29, 2012: IDR67.0tn
2012 : Acquisition of Thang Long Cement Vietnam, Total
installed capacity of 2.3mm tons, Market Cap Dec 19th,
2012: IDR91.9tn
2013: Transformed to PT Semen Indonesia (Persero)
Tbk as strategic holding co.
0,0
5,0
10,0
15,0
20,0
25,0
30,0
35,0
1957
1970
1980
1984
1985
1986
1990
1995
1997
1998
2006
2007
2008
2009
2010
2011
2012
2013
2014
2015

26
Semen Indonesia as strategic holding company
99,9% 99,9% 70,0%55,0%
SP ST TLCC
PT United Tractors Semen Gresik
97,0%PT SGG Energi Prima
60,0%PT Industri KemasanSemen Gresik
65,0%PT Kawasan IndustriGresik
99,99% PT SGG Prima Beton
24,95% PT Varia Usaha
25% PT Swadaya Graha
17,6%
99,9%
SG
NO
N C
EMEN
T C
OM
PAN
Y
50,0%PT Krakatau SemenIndonesia
CEMENT COMPANY
Komposisi Pemegang Saham Per 31 Desember 2015
85%
PT Eternit Gresik
PT SISI
No Shareholders %
1 Government RI 51.01
2 Foreign Institution 36.94
3 Foreign Individual 0.03
4 Domestic Institution 10.58
5 Domestic Individual 1.43

27
IMPORTANT NOTICE
THIS PRESENTATION IS NOT AND DOES NOT CONSTITUTE OR FORM PART OF, AND IS NOT MADE IN CONNECTION WITH, ANY OFFER FOR SALE OR SUBSCRIPTION OF OR SOLICITATION,RECOMMENDATION OR INVITATION OF ANY OFFER TO BUY OR SUBSCRIBE FOR ANY SECURITIES NOR SHALL IT OR ANY PART OF IT FORM THE BASIS OF OR BE RELIED ON IN CONNECTIONWITH ANY CONTRACT, COMMITMENT OR INVESTMENT DECISION WHATSOEVER.
THE SLIDES USED IN THIS PRESENTATION ARE STRICTLY CONFIDENTIAL AND HAVE BEEN PREPARED AS A SUPPORT FOR ORAL DISCUSSIONS ONLY. THE INFORMATION CONTAINED INTHIS PRESENTATION IS BEING PRESENTED TO YOU SOLELY FOR YOUR INFORMATION AND MAY NOT BE REPRODUCED OR REDISTRIBUTED TO ANY OTHER PERSON, IN WHOLE OR INPART.
This presentation includes forward-looking statements, which are based on current expectations and forecast about future events. Such statements involve known / unknown risks uncertainties and other factors,which could cause actual results to differ materially from historical results or those anticipated. Such factors include, among others:
● economic, social and political conditions in Indonesia, and the impact such conditions have on construction and infrastructure spending in Indonesia;
● the effects of competition;
● the effects of changes in laws, regulations, taxation or accounting standards or practices;
● acquisitions, divestitures and various business opportunities that we may pursue;
● changes or volatility in inflation, interest rates and foreign exchange rates;
● accidents, natural disasters or outbreaks of infectious diseases, such as avian influenza, in our markets;
● labor unrest or other similar situations; and
● the outcome of pending or threatened litigation.
We can give no assurance that our expectations will be attained.
DISCLAIMER
The information contained in this report has been taken from sources which we deem reliable. However, none of PT Semen Indonesia (Persero) Tbk and/or its affiliated companies and/or their respective employees and/or agents make any representation or warranty (express or implied) or accepts any responsibility or liability as to, or in relation to, the accuracy or completeness of the information and opinions contained in this report or as to any information contained in this report or any other such information or opinions remaining unchanged after the issue thereof.
We expressly disclaim any responsibility or liability (express or implied) of PT Semen Indonesia (Persero) Tbk, its affiliated companies and their respective employees and agents whatsoever and howsoever arising (including, without limitation for any claim, proceedings, action, suits, losses, expenses, damages or costs) which may be brought against or suffered by any person as a result of acting in reliance upon the whole or any part of the contents of this report and neither PT Semen Indonesia (Persero) Tbk, its affiliated companies or their respective employees or agents accepts liability for any errors, omission or mis-statements, negligent or otherwise, in the report and any liability in respect of the report or any inaccuracy therein or omission therefrom which might otherwise arise is hereby expresses disclaimed.
Thank You
Main Office:
Main Building of Semen GresikJln. Veteran Gresik 61122 – IndonesiaPhone: (62-31) 3981731 -2, 3981745
Fax: (62-31) 3983209, 3972264
Representative Office:
The East Building, 18 floorJl. Lingkar Mega Kuningan Blok E 3.2 No. 1,JAKARTA – 12950Telp.: 021 – 5261174, 5261175; Faks : 021 – 5261176
www.semenindonesia.com