Embed Size (px)
Citation preview

Company OverviewSeptember 2017

Forward-Looking Statements
This presentation contains forward-looking statements within the meaning of Section 27A of the Securities Act of 1933 and Section 21E of the Securities Exchange Act of 1934. All statements, other than statements of historical facts, included in this presentation that address activities, events or developments that Antero Resources Corporation and its subsidiaries (collectively, the “Company” or “Antero”) expects, believes or anticipates will or may occur in the future are forward-looking statements. The words “believe,” “expect,” “anticipate,” “plan,” “intend,” “estimate,” “project,” “foresee,” “should,” “would,” “could,” or other similar expressions are intended to identify forward-looking statements. However, the absence of these words does not mean that the statements are not forward-looking. Without limiting the generality of the foregoing, forward-looking statements contained in this presentation specifically include estimates of the Company’s reserves, expectations of plans, strategies, objectives and anticipated financial and operating results of the Company, including as to the Company’s drilling program, production, hedging activities, capital expenditure levels and other guidance included in this presentation. These statements are based on certain assumptions made by the Company based on management’s experience and perception of historical trends, current conditions, anticipated future developments and other factors believed to be appropriate. Such statements are subject to a number of assumptions, risks and uncertainties, many of which are beyond the control of the Company, which may cause actual results to differ materially from those implied or expressed by the forward-looking statements. These include the factors discussed or referenced under the heading “Item 1A. Risk Factors” in our Annual Report on Form 10-K for the year ended December 31, 2016 and in the Company’s subsequent filings with the SEC.
The Company cautions you that these forward-looking statements are subject to all of the risks and uncertainties, most of which are difficult to predict and many of which are beyond our control, incident to the exploration for and development, production, gathering and sale of natural gas and oil. These risks include, but are not limited to, commodity price volatility, inflation, lack of availability of drilling and production equipment and services, environmental risks, drilling and other operating risks, regulatory changes, the uncertainty inherent in estimating natural gas and oil reserves and in projecting future rates of production, cash flow and access to capital, the timing of development expenditures, and the other risks described under the heading “Risk Factors” in our Annual Report on Form 10-K for the year ended December 31, 2016 and in the Company’s subsequent filings with the SEC.
Any forward-looking statement speaks only as of the date on which such statement is made and the Company undertakes no obligation to correct or update any forward-looking statement, whether as a result of new information, future events or otherwise, except as required by applicable law.
1
Antero Resources Corporation is denoted as “AR” in the presentation, Antero Midstream Partners LP is denotedas “AM” and Antero Midstream GP LP is denoted as “AMGP”, which are their respective
New York Stock Exchange ticker symbols.

2
Changes Since August 2017 Presentation
New AR slide highlighting midstream value creation and contribution to AR value growth Slide 27
New AR slide highlighting propane fundamentals and strong pricing performance Slide 6
Updated AR slide showing increasing EUR performance from advanced Marcellus well completions
Slide 19
New AR slide highlighting Marcellus single well economics benefit from longer laterals Slide 18
New AR slide highlighting standalone Antero Resources EBITDAX reconciliation Slide 55

3
Market Cap(1)……….……....
Enterprise Value(1)(2)…......…...
LTM EBITDAX………...……
Corporate Debt Ratings……
Net Production (2Q 2017)…
% Liquids.........................
3P Reserves(3)………..…....
% Natural Gas………......
Net Acres(4)………….…...…
1. Based on market cap as of 6/30/2017 plus net debt excluding minority interest ($0.6 billion) on a consolidated basis as of 6/30/2017. 2. Pro forma for AR sale of 10.0 million AM units for $315 million gross proceeds on 9/6/2017. 3. 3P reserves as of 6/30/2017, assuming ethane rejection of which 96% represent 2P reserves. 4. Net acres as of 6/30/2017.
$6.8 billion
$11.8 billion
$1.5 billion
Ba2 / BB
2,200 MMcfe/d
28%
53.0 Tcfe
71%
636,000
Antero Profile

4
Antero has grown its acreage position by over 200,000 net acres since its IPO in October 2013
Since the beginning of 2016, Antero has acquired over 111,000 net acres in the core of the Marcellus and Utica Shale plays
Virtually all of the acquired acreage is now dedicated to Antero Midstream
Closed on 10,300 net acre Marcellus acquisition in early June (Doddridge & Wetzel Counties)
– Includes 17 MMcfe/d of net production, 15 drilled but uncompleted wells and one drilling pad
– Undeveloped properties included an estimated 418 Bcfe and 958 Bcfe of unaudited proved reserves and 3P reserves, respectively
Consolidated acreage position drives efficiencies:
– Longer laterals– More wells per pad– Higher utilization of gathering, compression and
freshwater infrastructure– Facilitates central water treatment avoiding
injection
Activity Acquisitions and Antero Footprint
2016 Acquired Acreage
2017 Acquired Acreage (1)
1. Either acquired or under purchase and sale agreement to be acquired.
A Leading Consolidator in Appalachia

Mariner West (50 Mbbl/d C2)
Mariner East (70 Mbbl/d)
5
61,500 MBbl/dMariner East 2
Antero / MPLX Joint Venture (1)
1. Represents processing and fractionation joint venture between Antero Midstream and MPLX LP that was announced 2/6/2017.
Utopia (50 Mbbl/d C2)(1Q 2018)
The Northeast NGL infrastructure buildout
potentially presents additional investment opportunities
NGL Infrastructure Buildout in the Northeast

26%
66%
0%10%20%30%40%50%60%70%80%
0
20,000
40,000
60,000
80,000
100,000
120,000
MB
bls
2015 2016 2017
1,500
1,600
1,700
1,800
1,900
2,000
2,100
MB
bl/d
Source: EIA and Bentek.
Antero is favorably positioned to take advantage of an improving propane market with low inventories, increasing demand and tightening of Mont Belvieu pricing relative to WTI
6
Significant Tightening in Propane Markets Has Led to Increased Pricing Relative to WTI
Propane Demand is IncreasingPropane Inventories Are Short
26% and 37% reduction from 2015 and 2016
trough levels, respectively
$0.37/GallonPropane
$0.76/GallonPropane
Strong Propane Fundamentals

19,500
42,500
72,884
96,000
0
20,000
40,000
60,000
80,000
100,000
120,000
140,000
160,000
2014 2015 2016 2017EGuidance
2018ETarget
2019ETarget
2020ETarget
1. Excludes condensate.2. Assumes midpoint of 20 – 22% year-over-year equivalent production growth in 2018-2020 (from original 2017E midpoint guidance of 2,205 MMcfe/d). For illustrative purposes C3+ production growth assumed
at same rate.
(1)
Total(Bbl/d)
C5+
iC4
nC4
C3C2 Ethane
17,476
C2Ethane26,500
Antero NGL Production Growth by Purity Product (Bbl/d)
Antero is the largest NGL producer in the Northeast
(2) (2) (2)
20–22% Y-O-Y Long-Term
Growth Target
7
Ethane (C2)C3+ ProductionPropane (C3)Normal Butane (nC4)IsoButane (iC4)Natural Gasoline (C5+) C2
Rapidly Growing NGL Production…

Historical Guidance / Targets($/Bbl) 2015A 2016A 2017 Guidance
(Excl. ME2)2018E+
(Incl. ME2)
WTI Crude Oil(1) $48.63 $43.14 $49.95 $50.50
Mont Belvieu NGL Price(2) $25.24 $25.49 $31.70 $31.65
% of WTI (Prior to Local Differentials) 52% 59% 63% 63%
Local Differentials
Local Differential to Mont Belvieu(3) $(8.23) $(6.75) $(4.00) - $(7.00) $(1.00) - $(4.00)
Antero Realized C3+ NGL Price(3) $17.01 $18.74 $24.70 - $27.70 $30.65 - $27.65
% of WTI(2) 35% 43% 50% - 55% 55% - 60%
1. Based on 7/31/2017 strip pricing.2. Weighted average by product and assumes 1225 BTU gas.3. Based on unhedged contracted differentials for C4+ NGL products, guidance from midstream providers and strip pricing as of 7/31/2017.
An increase in Mont Belvieu pricing combined with an improvement in local differentials has resulted in meaningful upside to Antero’s
realized C3+ NGL pricing
~40% Increase in Mont BelvieuNGL Pricing (1)
~45% to 60% Increase in Realized C3+ NGL Pricing (1)
8
… And Rising Liquids Price Environment

$197
$385
$612
$122
$294
$503
$271
$475
$721
$0
$100
$200
$300
$400
$500
$600
$700
$800
201881,675 Bbl/d
201998,827 Bbl/d
2020119,580 Bbl/d 9
Assuming a flat $50 oil price, 60% of WTI NGL realizations and 82,000 Bbl/d C3+ volumes, Antero is forecasted to realize ~$200 million of incremental unhedged EBITDAX in 2018
Incremental Liquids-Driven EBITDAX to 2017E
1. Represents midpoint of 20% - 22% long-term production growth targets. Based on midpoint of 2017 C3+ NGL production guidance of 68 MBbl/d to 71 MBbl/d and NGL pricing guidance of 50% to 55% of WTI.
Incr
emen
tal A
nnua
l EB
ITD
AX
vs. 2
017
($M
M)
65% of WTI / $50 Oil$1.5 Bn
Incremental EBITDAX
60% of WTI / $50 Oil$1.2 Bn
Incremental EBITDAX
55% of WTI / $50 Oil$0.9 Bn
Incremental EBITDAX
(1)C3+ NGL Guidance / Targets: 82,000 Bbl/d 99,000 Bbl/d 120,000 Bbl/d
(1) (1)
Current Forecast
Antero has virtually no liquids hedged in
2018 and beyond
Powerful Liquids Pricing Upside Exposure

1. Assuming 12/31/2016 4-year strip pricing averaging $3.12/MMBtu for natural gas and $56.23/Bbl for oil. Consolidated cash flow from operations includes realized hedge gains. 2. Represents midpoint of 20% - 22% long-term production growth targets based off previous 2017 guidance range of 2,160 – 2,250 MMcfe/d.
1.82.3
2.7
3.2
3.9
0.0
0.5
1.0
1.5
2.0
2.5
3.0
3.5
4.0
2016A 2017E 2018E 2019E 2020E
Net
Dai
ly P
rodu
ctio
n
2017 Guidance
10
D&C Capital:$1.3 Billion
Flat with prior yearModest annual increases within
Cash Flow from Operations
Production Growth:
In line with D&C capital Doubling by 2020Consolidated Cash Flow from Operations(1):
3.0x to 3.5x Declining to mid-2s by 2018Leverage(1):
~95% Hedged at $3.52/Mcfe 59% Hedged at $3.76/McfeHedging:
2018 - 2020 Long Term Targets
(Bcfe/d)
$3.52$3.91
$3.70
$3.63
Hedged Volume (Bcfe)Hedged Price ($/Mcfe)
GuidanceLong-Term Targets
$
(2) (2) (2)
2017 Guidance and Long Term Outlook
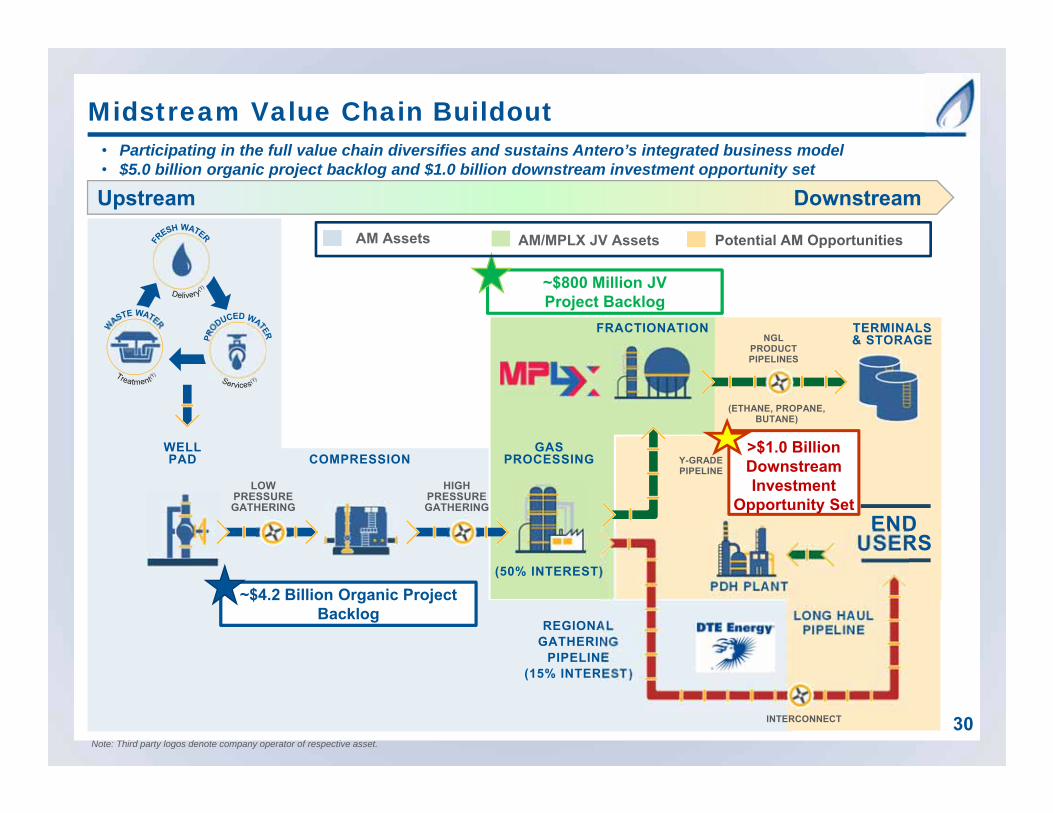
Key Drivers Behind Long Term Outlook
Deep Drilling Inventory
Improving Capital Efficiencies
Strong Well Performance
Visible, Attractive Price Realizations
Significant Cash Flow Growth and Declining Leverage Profile
11
Drilling Inventory
Capital Efficiency
Well Performance
Price Realizations
Cash Flow Growth
Solid Balance Sheet with Abundant Liquidity
Balance Sheet

604
464 458
366
238 226 221 216 186 177 167 155
-
100
200
300
400
500
600
700Core - NE Pennsylvania Dry Net Acres
Core - SW Marcellus & Utica Dry Net Acres
Core - Marcellus & Utica Liquids Rich Net Acres
Cor
e N
et A
cres
(000
s)Largest Core Acreage Position in Appalachia (1)
Source: Core outlines based upon Antero geologic interpretation, well control and peer acreage positions based on investor presentations, news releases, 10-K/10-Qs and various other sources. Pro forma for all acquisitions announced to date including EQT/RICE. Rig information per RigData as of 8/25/2017. 1. Peers include CHK, CNX, COG, CVX, EQT, GPOR, NBL RICE, RRC, STO and SWN.
Antero has the largest core acreage position in Appalachia and the largest liquids-rich position
35 SW Marcellus Rigs
28 Utica Rigs
10 NE Marcellus Rigs
73 Total Rigs
12
Drilling Inventory – Largest Core Acreage Position in Appalachia
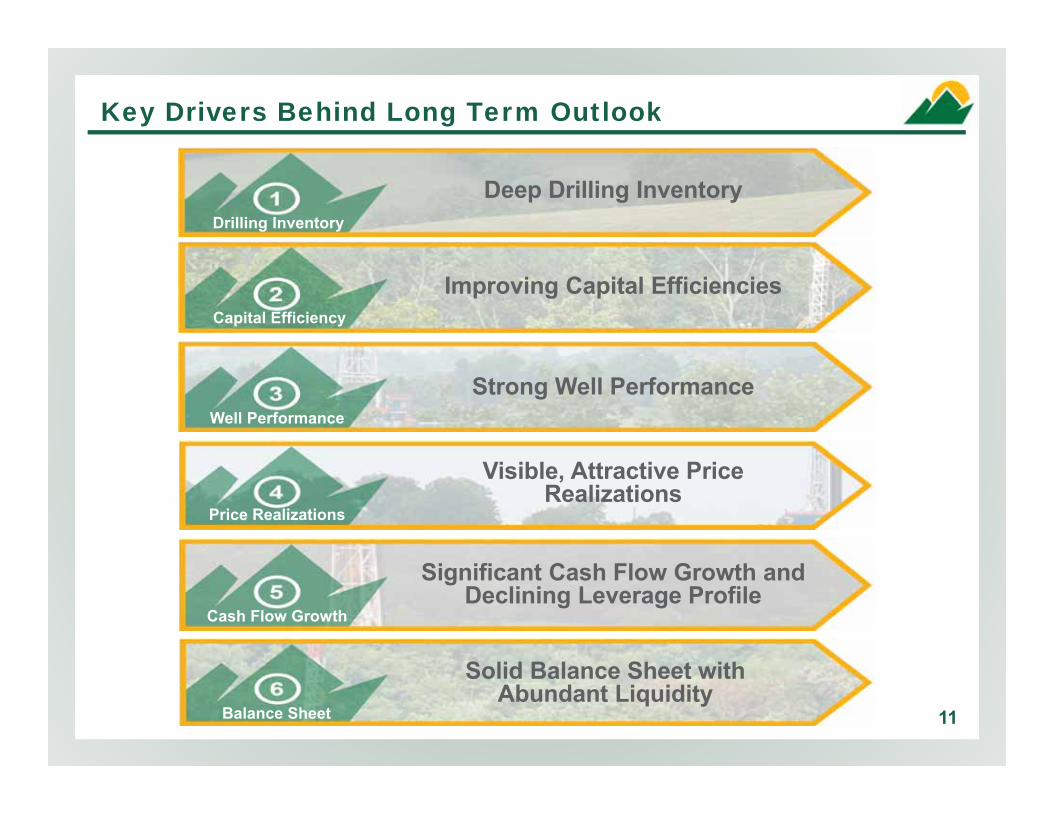
3,890
1,967 1,937
1,161 913 867 824 736 692 683 635 548
-
500
1,000
1,500
2,000
2,500
3,000
3,500
4,000
4,500
AR A B C D E F G H I J K
Und
rille
d Lo
catio
ns
Core - NE Pennsylvania Dry Locations
Core - SW Marcellus & Utica Dry Locations
Core - Marcellus & Utica Liquids Rich Locations
1. Location count determined by Antero technical review of geology and well control to delineate core areas and peer acreage positions both drilled and undrilled..2. Peers include Ascent, CHK, CNX, COG, CVX, EQT, GPOR, NBL, RICE, RRC and SWN.* Undrilled location count net of acreage allocated to publicly disclosed joint ventures.
Undrilled Core Marcellus and Utica 3P Locations (1)(2)
Large, repeatable core drilling inventory that averages over 7,800’ in lateral length and includes 44% of all liquids-rich undrilled locations in Appalachia
Core Liquids-Rich Appalachia Undrilled Locations (1)
*
**
Avg. Lateral Length 7,812’ 6,429’ 6,355’ 8,601’ 5,758’ 8,594’ 9,262’ 7,085’7,550’ 8,880’6,225’
AR44%
B13%
C10%
H8%
E6%
I5%
A4%
D3%
J3%
G2%
K2%
13
*
7,762’
Drilling Inventory – Largest Core Drilling Inventory in Southwest Appalachia

211
1,049
1,728
2,684
3,481
3,828
4,121
0
500
1,000
1,500
2,000
2,500
3,000
3,500
4,000
4,500
$1.50 $2.00 $2.50 $3.00 $3.50 $4.00 $4.00
Loca
tions
Marcellus Rich Gas Marcellus Dry Gas Ohio Utica Rich Gas Ohio Utica Dry Gas
1. Marcellus and Utica 3P locations as of 6/30/2017. Categorized by breakeven price solving for a 20% BTAX ROR and assuming 50% of AM fees due to AR ownership of AM. Assumes $55.00/Bbl WTI over the next five years and strip pricing for C3+ NGLs, which is ~53% of WTI.
2. Includes 3,890 total core locations plus 231 non-core 3P locations.14
Cumulative 3P Drilling Inventory – Breakeven Prices at 20% ROR (1)(2)
Marcellus Rich Gas
Marcellus Dry Gas
Ohio Utica Rich Gas
< << << <
<
Antero has a 16-year drilling inventory that generates a 20% rate of return at $3.00/MMbtu NYMEX or less, assuming the 2017 development pace (170 completions)
~65% of total locations generate a 20% rate of return at
$3.00/MMbtu NYMEX or less
~25% of total locations generate a 20% rate of return at
$2.00/MMbtu NYMEX or less
7,733’7,935’8,236’8,683’8,785’9,2719,111’
Average Lateral Length
Ohio Utica Dry Gas
NYMEX Natural Gas Price ($/MMBtu)
Drilling Inventory – Low Breakeven Prices

170 190 190
255
0
50
100
150
200
250
300
2017E 2018E 2019E 2020E
Marcellus Rich Gas Marcellus Dry Gas Utica Rich Gas Ohio Utica Dry Gas
Drilling Inventory – Multi-Year Growth Engine
4,121 Locations 3,385 Locations
Expect to place >700 new Marcellus and Ohio Utica wells to sales by YE 2020
1. Marcellus and Utica 3P locations as of 6/30/2017. Excludes WV/PA Utica Dry locations.2. Adjusted for 64 Marcellus wells and 5 Utica wells placed online in 1H 2017.
Average Lateral Length ~8,998 feet
15
CURRENT UNDRILLED 3P LOCATIONS BY BTU REGIME(1) ESTIMATED YE 2020 UNDRILLED 3P LOCATIONS(2)
Antero plans to develop over 700 horizontal locations in the Marcellus and Ohio Utica by the end of the decade while utilizing less than 18% of its current 3P drilling inventory
Planned Antero Well Completions by Year
Marcellus Rich Gas
Ohio Utica Rich GasOhio Utica Dry Gas
Marcellus Dry Gas
5%Ohio Utica Dry Gas
174 Locations
10%Utica Rich Gas 334 Locations
25% Marcellus Dry Gas
845 Locations 60%Marcellus Rich Gas
2,032 Locations
15%Marcellus Dry Gas
855 Locations65%
Marcellus Rich Gas 2,516 Locations
13%Utica Rich Gas 495 Locations
7%Ohio Utica Dry Gas
255 Locations
9,000’

3.2 3.5 4.0 4.0
3.2 3.7
4.8 4.8
0.0
1.0
2.0
3.0
4.0
5.0
6.0
7.0
2014 2015 2016 Q2 2017 Record
Day
s$1.34
$1.18
$0.90 $0.90
$1.55 $1.36
$1.05 $1.00
0.0
0.5
1.0
1.5
2.0
2014 2015 2016 Q2 2017
Proc
esse
d EU
R p
er 1
,000
' of
Late
ral (
Bcf
e)8,052 8,910 9,196 9,410 8,543
8,575 9,250
11,222
0
2,000
4,000
6,000
8,000
10,000
12,000
2014 2015 2016 Q2 2017 Record
Late
ral L
engt
h (fe
et)
29 24
15 12
8
29 31
17 19
05
1015202530354045
2014 2015 2016 Q2 2017 Record
Dril
ling
Day
s
16
Capital Efficiency – Continuous Operating Improvement
Increasing Completion Stages per Day
Drilling Longer Laterals
Dramatic Decrease in Drilling Days
Declining Well Costs per 1,000’
Drilling longer laterals while reducing drilling days by 59% in the
Marcellus and 35% in the Utica
More efficient completions (“zipper fracs”) are increasing stages per day
Reducing well costs by ~33% since 2014 Continuing to be an industry leader in drilling longer laterals
Driving drilling and completion efficiencies which continues to lower well costs
Record
17,400
Record
10.0
Record

$0.88$0.73
$0.56 $0.46
$1.28
$0.94 $0.73
N/A $0.00
$0.50
$1.00
$1.50
$2.00
2014 2015 2016 Q2 2017
Proc
esse
d EU
R p
er 1
,000
' of
Lat
eral
(Bcf
e)
1.8 1.92.3 2.3
3.0
1.51.8
1.6
N/A0.0
0.5
1.0
1.5
2.0
2.5
3.0
2014 2015 2016 Q2 2017 RecordProc
esse
d EU
R p
er 1
,000
' of
Lat
eral
(Bcf
e)
32 33
42 44
62
35 34 3745
0
10
20
30
40
50
60
70
2014 2015 2016 Q2 2017
Bar
rels
of W
ater
Per
Foo
t
1,165 1,163
1,702 2,083
2,757
1,267 1,298 1,648
2,500
-
500
1,000
1,500
2,000
2,500
3,000
2014 2015 2016 Q2 2017
Poun
ds o
f Pro
ppan
t Per
Foo
t
1. Based on statistics for wells completed within each respective period. 2. Ethane rejection assumed.3. Current D&C cost per 1,000’ lateral divided by net EUR per 1,000’ lateral assuming 85% NRI in Marcellus and 81% NRI in Utica.
17
Increasing Water Per Foot
Much Lower F&D Cost per Mcfe(2)(3)
Increasing Proppant Per Foot
Increasing EUR per 1,000’ (Bcfe)(1)(2)
Higher proppant concentration has contributed to higher recoveries
Higher proppant concentration requires increased water usage
Since 2014, Antero has increased EURs by 28% in the Marcellus
Bottom line: F&D costs per Mcfe have declined by 48% in the Marcellus
Enhanced completion designs have contributed to improved recoveries and capital efficiency
Record
Capital Efficiency – Dramatically Lower F&D Cost
Record Record

6,000 Foot Lateral 9,000 Foot Lateral
NOTE: Assumes 2.0 Bcf/1,000’ type curve for the Antero Marcellus Highly-Rich Gas/Condensate (1250 Btu) and 6/30/2017 strip pricing.1. All laterals rounded to the nearest thousand. 788 of the 894 wells have been completed
Antero has been a pioneer in drilling long laterals in Appalachia
12,000 Foot Lateral
Pre-Tax Economics
ROR (%) 36%
PV-10 ($MM) $5.0
Pre-Tax Economics
ROR (%) 46%
PV-10 ($MM) $8.8
Pre-Tax Economics
ROR (%) 55%
PV-10 ($MM) $12.6
8 3132
14
27
9 5 5 4
41
103
174185
171
110
78
16 7 6
020406080
100120140160180200
Wel
l Cou
nt
Lateral Length(1)
Antero Lateral Lengths To Date
2017 YTD Average
18
# of Wells
Avg. Lateral Length
Total DrillingProgram to date 894 8,250
2017 Drilling Program 135 10,000
Wells ≥10,000’ 220 10,750
Capital Efficiency – Longer Laterals Improve ROR

AR’s production from advanced completions is outperforming the 2.0 Bcf/1,000’ wellhead type curve – 2,500 lb/ft completions are 20% above type curve (First 184 days)
2,160
2,2502,2502,300
2,0502,1002,1502,2002,2502,3002,350
PreviousGuidance
UpdatedGuidance
MM
cfe/
d
2017 AR Production Guidance
1. 1,875 pounds per foot type curve represents 36 1,750 pounds per foot wells and 29 2,000 pounds per foot wells.2. Cumulative average production per well normalized to a 9,000’ lateral.
Raised 3%
19
0
500
1,000
1,500
2,000
2,500
3,000
3,500
0 30 60 90 120 150 180 210 240 270 300 330 360 390
Wel
lhea
d Pr
oduc
tion
(Cum
ulat
ive
MM
cf)
Days From Peak Gas
1.7 Bcf/1,000' Type Curve Cumulative
Production
2.0 Bcf/1,000' Type Curve Cumulative
Production
1,500 lb/ft38 wells
1,875 lb/ft65 wells
2,500 lb/ft18 wells
AR recently raised 2017 production guidance by 3% to 2,275 MMcfe/d midpoint driven by well outperformance
Well Performance – Optimizing Well Recoveries With Higher Intensity Completions

$6.1$8.8
$10.8
33%
46%
57%
0%
10%
20%
30%
40%
50%
60%
70%
80%
90%
100%
$0.0
$5.0
$10.0
$15.0
$20.0
1.72.1
2.02.5
2.32.8
Unh
edge
d Pr
e-Ta
x R
OR
Pre-
Tax
PV-1
0 ($
MM
)
Pre-Tax PV-10 Pre-Tax ROR
$11.0
$14.3
$17.7
69%
97%
130%
0%
20%
40%
60%
80%
100%
120%
140%
$0.0
$5.0
$10.0
$15.0
$20.0
1.72.3
2.02.7
2.33.1
Unh
edge
d Pr
e-Ta
x R
OR
Pre-
Tax
PV-1
0 ($
MM
)
Pre-Tax PV-10 Pre-Tax ROR
201. Assumes ethane rejection. Based on commodity pricing as of 6/30/2017. Assumes 9,000’ lateral length. See appendix for further assumptions.
Highly-Rich Gas/Condensate (6/30/17 Pricing) (1)
Wellhead Bcf/1,000’:Processed Bcfe/1,000’:
Integrated platform yields attractive well economics and sustainable growth
2.02.7
2.02.5
632 Undrilled Locations
Wellhead Bcf/1,000’:Processed Bcfe/1,000’:
Highly-Rich Gas (6/30/17 Pricing) (1)
1,211 Undrilled Locations
2016 Advanced Completion
Results
1313 Btu 1250 Btu
Well Performance – Improving Marcellus Returns

1. Shell announced final investment decision (FID) on 6/7/2016.2. Lake Charles LNG 150 MMcf/d commitment subject to Shell FID.
Antero transportation commitments yield NYMEX-plus pricing for natural gas and are expected to yield Mont Belvieu-plus pricing for NGLs
Antero Long Term Firm Processing & Takeaway Position (YE 2018) – Accessing Favorable Markets
Antero 2.8 Bcf/d Marcellus & Utica Firm Processing
1,400 MMcf/dTo Midwest800 MMcf/d
To TCO Pool 689 MMcf/d
4.85 Bcf/dFirm GasTakeaway
By YE 2018
YE 2018 Gas Market MixAntero 4.85 Bcf/d FT
44%Gulf Coast
17%Midwest
13%Atlantic
Seaboard
13%Regional
(PA)
13%TCO
Expect NYMEX-
plus pricing per Mcf in aggregate
To Atlantic Seaboard
630 MMcf/d
625 MMcf/d30 MBbl/d Ethane
Local Petchem
Mariner East 2 (4Q 2017)62 MBbl/d Commitment
Marcus Hook ExportShell (2021)30 MBbl/d Commitment
Beaver County, PA Cracker (1)
Sabine Pass (Trains 1-4)50 MMcf/d per Train
(T1, T2 and T3 in-service)Freeport LNG (3Q 2018)
70 MMcf/dLake Charles LNG(2)
150 MMcf/d
Cove Point LNG (4Q 2017)330 MMcf/d
420 MMcf/d LNG Export
330 MMcf/d LNG Export
62 MBbl/d NGL Export
MidwestMarkets
Regional Markets
Gulf Coast Markets
Antero CommitmentsFirm Processing: = 2.8 Bcf/dFirm Gas Takeaway: = 4.85 Bcf/dLNG Firm Sales: (2) = 750 MMcf/dFirm Ethane Takeaway: = 20 MBbl/d Ethane Cracker: = 30 MBbl/d Firm NGL Takeaway: = 62 MBbl/d
21
Price Realizations – Largest FT portfolio in Northeast

1. Based on management forecast of net production, BTU of future production and the 2017 through 2020 futures strip as of 06/30/17 for various indices that Antero can access with its firm transport portfolio. 2. Assumes 50/50 DOM S and TETCO M2 split, from ICE futures as of 06/30/2017.
Antero Expected Pricing: 2017-2020 ($/MMBtu)
Forecasted Realized Natural Gas Price (1) Nymex + ~$0.10
- Average FT Expense (operating expense) $(0.46)
- Average Net Marketing Expense $(0.10)
= Net Natural Gas Price vs. Nymex $(0.46)
Dom South and Tetco M2 Realized Natural Gas Strip (2) Nymex - $(0.57)
Antero Pricing Relative to Northeast Differential +$0.11
22
Even with the relative tightening of local basis indicated in the futures market, Antero’s expected netback through the end of the decade (after deducting FT and marketing
costs) is $0.11 per MMBtu higher than the local Dominion South and TETCO M2 indices
Price Realizations – Antero Firm Transport Mitigates Northeast Basis Risk

($/Mcf)2017E
2018-2020Target
(1)$3.10 $2.90
Basis Differential to NYMEX(1) $(0.24) $(0.15) - $(0.20)
BTU Upgrade(2) $0.29 $0.25
Realized Gas Price $3.15 $2.95 - $3.00
Premium to Nymex without Hedges +$0.05 +$0.05 - $0.10
Estimated Realized Hedge Gains $0.47 $0.67
Realized Gas Price with Hedges $3.62 $3.62 - $3.67
Premium to NYMEX with Hedges +$0.52 +$0.72 - +$0.77
231. Based on 06/30/2017 strip pricing.2. Based on BTU content of residue sales gas.
Antero expects to realize a premium to NYMEX gas prices before hedges through 2020
Price Realizations – Favorable Price Indices

Gas $2.89
Gas $2.80
Gas $2.80
Gas $2.80
$0.14 Condensate
$0.18 Condensate
$0.21
NGLs (C3+) $0.89
NGLs (C3+) $1.12
NGLs (C3+) $1.36
$0.00
$0.50
$1.00
$1.50
$2.00
$2.50
$3.00
$3.50
$4.00
$4.50
$5.00
1050 BTU 1250 BTU /$55 WTI
1250 BTU /$65 WTI
1250 BTU /$75 WTI
Price Realizations – Liquids Pricing Upgradein the Marcellus
1. Assumes $2.75/MMBtu NYMEX, $55/Bbl to $75/Bbl WTI and NGL prices equal to 52.5% of WTI (midpoint of 2017 guidance). 45 Bbl/MMcf (ethane rejection) recovery for NGLs and 3 Bbl/MMcf for condensate, processing shrink included.
Assuming Ethane Rejection
(1100 BTU Tailgate)8% shrink
$/Wellhead Mcf(1)
($/Mcf)
24
+$0.94Upgrade
+$1.21Upgrade
Rich GasDry Gas
$3.83$4.10
$2.75/MMBtu NYMEX
Antero realizes a significant upgrade to NYMEX gas prices by producing liquids-rich gas and condensate
+$1.48Upgrade
$4.37
$2.89

$2,080
$1,600
$294
$186
$800$1,000$1,200$1,400$1,600$1,800$2,000$2,200
AR Stand-Alone Cash Flow
Total D&C CapitalStandalone
Cash Surplus
$ M
M
$1,660
$1,300
$276
$84 $800
$1,000
$1,200
$1,400
$1,600
$1,800
$2,000
AR Stand-Alone Cash Flow
Total D&C CapitalStandalone
Cash Surplus
$ M
M
Antero Resources plans to grow its production 20% to 22% through 2020 while spending within cash flow and deleveraging its balance sheet
2018 Consensus Wall Street Research Estimates
2019 Consensus Wall Street Research Estimates
$1,894
(1)
(1)
(2)
1. Represents Wall Street consensus EBITDAX for AR (consolidated), less Wall Street gathering and compression EBITDA for AM, less Wall Street consensus interest expense for AR (stand-alone), plus $170 million and $219 million in target distributions from AR’s ownership of 98.9 million AM units for 2018 and 2019, respectively. 2019 calculation includes $125 million earn out payment received at AR from AM.
2. Represents Company target for 2018 and 2019 D&C capital (both consolidated), plus AM water EBITDA per Wall Street estimates (proxy for AR water cost which is capitalized).
Consolidated D&C Target
Deconsolidated (Includes water
fees to AM)
ConsolidatedD&C Target
Deconsolidated (Includes water
fees to AM)
Implied 2018 Consensus Standalone Leverage ($Bn)
AR Consensus Standalone Net Debt (12/31/17) $4.6
Less: 2018 Cash Surplus (0.1)
2018 Implied AR Standalone Net Debt $4.5
AR Standalone Consensus EBITDAX 1.7
2018 Implied Standalone Leverage 2.6x
$1,576
Implied 2019 Consensus Standalone Leverage ($Bn)
2018 Implied AR Standalone Net Debt $4.5
Less: 2019 Cash Surplus (0.2)
2019 Implied AR Standalone Net Debt $4.3
AR Standalone Consensus EBITDAX 2.0
2019 Implied Standalone Leverage 2.2x
(2)
25
Significant Cash Flow Growth – Capital Efficiency Drives Cash Flow Growth While Deleveraging

Liquid “non-E&P assets” of $5.4 Bnsignificantly exceeds total debt of $4.1 billion
Liquidity
Antero Resources (NYSE:AR) Antero Midstream (NYSE:AM)Pro Forma 6/30/2017 Debt(1) Liquid Non-E&P Assets 6/30/2017 Debt (1) Liquid Assets
Debt Type $MMCredit facility $615
5.375% senior notes due 2021 1,000
5.125% senior notes due 2022 1,100
5.625% senior notes due 2023 750
5.00% senior notes due 2025 600
Total $4,065
Asset Type $MMCommodity derivatives(2) $2,049
AM equity ownership(3) 3,281
Cash 22
Total $5,352
Asset Type $MMCash $22
Credit facility – commitments(4) 4,000
Credit facility – drawn (615)
Credit facility – letters of credit (706)
Total $2,701
Debt Type $MMCredit facility $305
5.375% senior notes due 2024 650
Total $955
Asset Type $MMCash $18
Total $18
Pro Forma Liquidity
Asset Type $MMCash $18
Credit facility – capacity 1,500
Credit facility – drawn (305)
Credit facility – letters of credit -
Total $1,213
Approximately $2.4 billion of liquidity at AR plus an additional $3.6 billion of AM units
Approximately $1.2 billion of liquidity at AM following recent equity offering
26
Only 20% of AM credit facility capacity drawn
1. AR balance sheet data as of 6/30/2017. AR pro forma for AR sale of 10.0 million AM units for $315 million gross proceeds on 9/6/2017. AM balance sheet data as of 6/30/2017.2. Mark-to-market as of 6/30/2017.3. Based on AR ownership of AM units and closing price as of 6/30/2017. AM units pro forma for 10.0 million unit sale on 9/6/2017.4. AR credit facility commitments of $4.0 billion, borrowing base of $4.75 billion.
Balance Sheet – Strong Balance Sheet and High Flexibility

$89 $112
$-
$50
$100
$150
$200
$250
$300
2015A 2016A 2017E 2018E 2019E 2020E
$1,150
$2,724
$6,061
$795 $179 $315 $285 $250
$3,087
$0$1,000$2,000$3,000$4,000$5,000$6,000$7,000
AM IPO (2014) Sale of WaterBusiness (2015)
Sale of AMUnits (2016)
Sale of AMUnits (9/6/17)
AMDistributions
Received as of6/30/17
Total Proceedsto Date
ExpectedEarnout
Payments(2019E-2020E)
Pre-tax Value ofAM Units Held
by AR @$31.21 (9/8/17)
Pre-taxCumulative
Value of AnteroMidstream
Cas
h Pr
ocee
ds (S
MM
)Midstream Driving Value for AR Since Inception
Midstream integration has provided tremendous value to AR shareholders and the go-forward upside is very attractive
Cash Flow to AR from AM Distribution Growth(1)
Antero Midstream Return on Investment (Pre-tax)(2)
Note: Represents distributions declared during fiscal year ended December 31 based on Antero Midstream guidance and long-term distribution growth targets. 1. Represents distribution growth targets for AR owned units through 2020. As of 9/6/2017, AR owns 98.9 AM units.2. Midstream proceeds received by AR to date plus market value of AR’s 53% ownership of AM divided by the approximate $1.3 billion of AR capital invested at time of AM IPO.3. After-tax using 38% federal and state tax rate and $1.5 billion of AR NOLs.
AM price per unit
After-tax value of AM units held by AR ($Billion) (3)
Value per AR share
$29 $2.3 $7
$32 $2.5 $8
$35 $2.7 $9
$38 $2.9 $9
$41 $3.1 $10
Consensus AM Price Target: $41
4.7x ROI
AM Share Price Value
27
(2)

Antero Midstream (NYSE: AM)Asset Overview
28

Midstream Infrastructure (In Service)
Gathering Pipelines (Miles) 307
Compression Capacity (MMcf/d) 1,135Condensate Pipelines (Miles) 19
Processing Plant (MMcf/d) 400
Fractionation Plant (Bbl/d) 20,000
Fresh Water Pipelines (Miles) 286
Fresh Water Impoundments 36
Regional Pipeline Capacity (Bcf/d) 1.4
Antero Clearwater Facility (Bbl/d)(1) 60,000
29
CompressorStation
Antero Clearwater FacilitySherwood Processing Facility
Note: Infrastructure in service as of year-end 2016. 1. The Antero Clearwater Facility is scheduled to be placed into service in the fourth quarter of 2017.
Antero Midstream Asset Overview
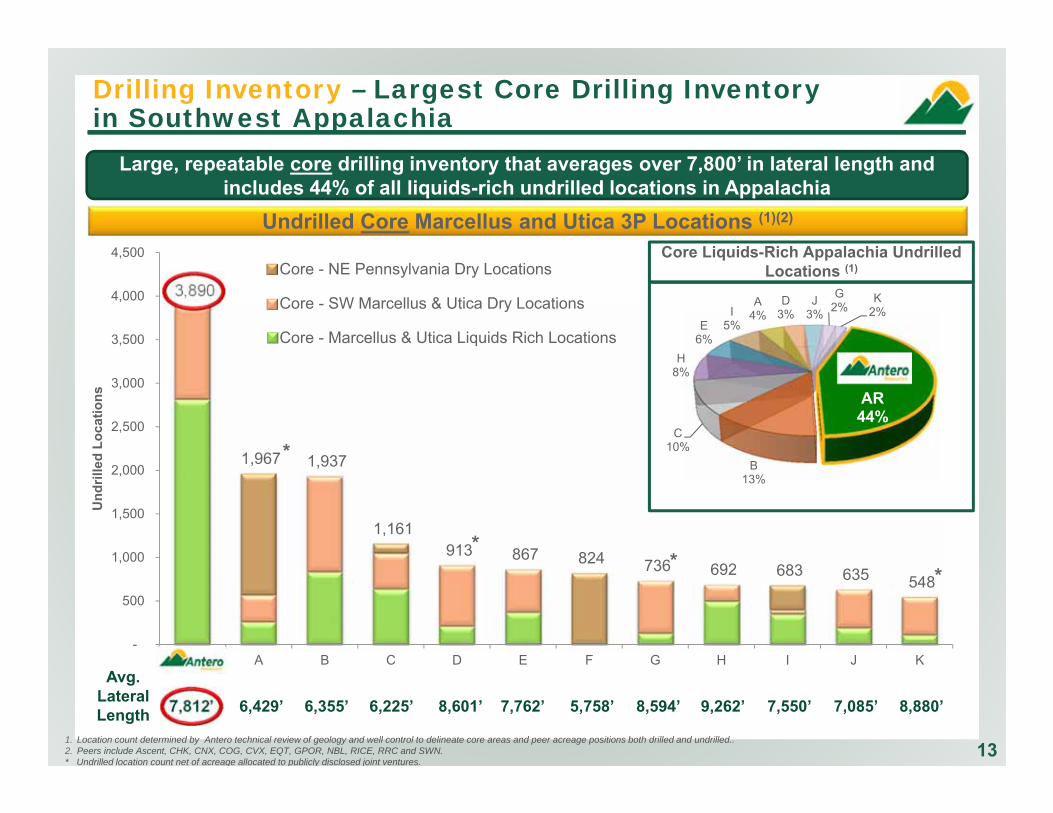
Upstream Downstream
~$4.2 Billion Organic Project Backlog
~$800 Million JV Project Backlog
WELL PAD
LOWPRESSUREGATHERING
HIGHPRESSUREGATHERING
COMPRESSIONGAS
PROCESSING
(50% INTEREST)
REGIONALGATHERING
PIPELINE(15% INTEREST)
FRACTIONATION TERMINALS& STORAGE
Y-GRADEPIPELINE
(ETHANE, PROPANE,BUTANE)
NGLPRODUCTPIPELINES
LONG HAULPIPELINE
INTERCONNECT
ENDUSERS
PDH PLANT
30
• Participating in the full value chain diversifies and sustains Antero’s integrated business model• $5.0 billion organic project backlog and $1.0 billion downstream investment opportunity set
>$1.0 Billion Downstream Investment
Opportunity Set
Note: Third party logos denote company operator of respective asset.
AM Assets AM/MPLX JV Assets Potential AM Opportunities
Midstream Value Chain Buildout

Processing and Fractionation JV Momentum
31
Antero Midstream (NYSE: AM) and MPLX (NYSE: MPLX) formed a joint venture for processing and fractionation infrastructure in the core of the liquids-rich Marcellus and Utica Shales in February 2017
Strategic Rationale
• Further aligns the largest core liquids-rich resource base with the largest processing and fractionation footprint in Appalachia
• Fits with AM’s “full value chain organic growth” strategy
• Improved visibility throughout vertical value chain and ability to deploy “just-in-time” capital supporting Antero Resources’ rich gas development
Note: RigData as of 7/28/17. Rigs drilling in rich gas areas only.1. New West Virginia site location still to be determined.
MarkWest / Antero Midstream Hopedale Fractionation Complex
C3+ Fractionation 1 & 2: 120 MBbl/d In ServiceC3+ Fractionation 3: 60 MBbl/d In Service
20 MBbl/d In Service, net to JV
MarkWest / Antero Midstream Sherwood Complex: 11 x 200 MMcf/dSherwood 1 – 6: 1.2 Bcf/d In ServiceSherwood 7: 200 MMcf/d In ServiceSherwood 8: 200 MMcf/d In ServiceSherwood 9: 200 MMcf/d 1Q 2018Sherwood 10: 200 MMcf/d 3Q 2018Sherwood 11: 200 MMcf/d 4Q 2018De-ethanization: 40 MBbl/d In Service
Future Processing ComplexTBD 1 – 6 – Potential – 1,200 MMcf/d (1)
Achievements Since Announcement• Successfully placed in service two
processing plants with 400 MMcf/d of combined capacity
‒ Sherwood 7: Fully Utilized‒ Sherwood 8: Fully Utilized‒ Sherwood 9: Due 1Q18
• Announced additional commitments for Sherwood Plants 10 and 11

32
Gathering and Compression Assets
Antero Midstream Gathering and Compression Asset Overview
1. As of 12/31/2016.2. Includes both expansion capital and maintenance capital.
• Gathering and compression assets in core of rapidly growing Marcellus and Utica Shale plays
– Acreage dedication of ~562,000 gross leasehold acres for gathering and compression services
– Additional stacked pay potential with dedication on ~288,000 gross acres of Utica deep rights underlying the Marcellus in WV and PA
– 100% fixed fee long term contracts
Projected Gathering and Compression InfrastructureMarcellus
ShaleUtica Shale Total
YE 2016 Cumulative Gathering/ Compression Capex ($MM)(1) $1,236 $470 $1,706
Gathering Pipelines(Miles) 213 94 307
Compression Capacity(MMcf/d) 1,015 120 1,135
Condensate Gathering Pipelines (Miles) - 19 19
2017E Gathering/Compression Capex Budget ($MM)(2) $255 $95 $350
Gathering Pipelines (Miles) 30 5 35
Compression Capacity(MMcf/d) 490 - 490

Antero Midstream Water Business Overview
33
Water Business Assets
AM acquired AR’s integrated water business for $1.05 billion plus earn out payments of $125 million at year-end in each of 2019 and 2020− The acquired business includes Antero’s Marcellus and Utica freshwater delivery business, the fully-contracted future advanced wastewater
treatment complex and all fluid handling and disposal services for Antero
• Fresh water delivery assets provide fresh water to support Marcellus and Utica well completions– Year-round water supply sources: Clearwater Facility, Ohio
River, local rivers & reservoirs(2)
– 100% fixed fee long term contracts
Note: Antero acreage position reflects tax districts in which greater than 3,000 net acres are owned.1. All Antero water withdrawal sites are fully permitted under long-term state regulatory permits both in WV and OH. 2. As of 12/31/2016.3. Marcellus assumes fee of $3.69 per barrel subject to annual inflation and 40 barrels of water per lateral foot that utilize the fresh water delivery system based on 9,000 foot lateral. Operating margin
excludes G&A. Utica assumes fee of $3.64 per barrel subject to annual inflation and 37 barrels of water per lateral foot that utilize the fresh water delivery system based on 9,000 foot lateral. Water volumes assume 5% recycling. Operating margin excludes G&A.
Antero Clearwater advanced wastewater treatment facility currently under construction – connects to
Antero freshwater delivery system
Projected Water Business Infrastructure(1)
Marcellus Shale
Utica Shale Total
YE 2016 Cumulative Fresh WaterDelivery Capex ($MM) (2) $610 $135 $745
Water Pipelines(Miles) 203 83 286
Fresh Water StorageImpoundments 23 13 36
2017E Fresh Water Delivery Capex Budget ($MM) $50 $25 $75
Water Pipelines(Miles) 28 9 37
Fresh Water StorageImpoundments 3 1 4
Cash Operating Margin per Well(3)
$1.0MM -$1.1MM
$925k -$975k
2017E Advanced Waste Water Treatment Budget ($MM) $100
2017E Total Water Business Budget ($MM) $175

High Growth Year-Over-Year Midstream Throughput
34
1,253
1,734
- 200 400 600 800
1,000 1,200 1,400 1,600 1,800 2,000
2Q 2016 2Q 2017
105
173
-
50
100
150
200
2Q 2016 2Q 2017
658
1,192
-
200
400
600
800
1,000
1,200
1,400
2Q 2016 2Q 2017
1,353
1,683
- 200 400 600 800
1,000 1,200 1,400 1,600 1,800 2,000
2Q 2016 2Q 2017
Note: All fees are as of year end 2016.Marcellus Utica
Fixed Fee: $0.31/Mcf Fixed Fee: $0.19/Mcf
Fixed Fee: $0.19/Mcf Fixed Fee: $3.68/Bbl
Low Pressure Gathering (MMcf/d) Compression (MMcf/d)
High Pressure Gathering (MMcf/d) Fresh Water Delivery (MBbl/d)

1.9x
0.0x0.5x1.0x1.5x2.0x2.5x3.0x3.5x4.0x4.5x5.0x
Peer 1 Peer 2 Peer 3 Peer 4 Peer 5 Peer 6 Peer 7
Net
Deb
t / L
TM E
BIT
DA
• $1.5 billion revolver in place to fund future growth capital (5.0x Debt/EBITDA Cap)
• Liquidity of $1,213 million at 6/30/2017 based off $1,500 million revolver
• Sponsor (NYSE: AR) has Ba2/BB corporate debt ratings
• AM corporate debt ratings also Ba2/BB
AM Liquidity (6/30/2017)
AM Peer Leverage Comparison(1)
($ in millions)
Revolver Capacity $1,500Less: Borrowings (305)Plus: Cash 18Liquidity $1,213
1. As of 3/31/2017. Peers include TEP, EQM, WES, RMP, SHLX, DM, and CNNX.2. Antero Midstream leverage as of 6/30/2017.
Financial Flexibility
35
(2)
Significant Financial Flexibility

2017 – 2020 Outlook
36
Macro • Significant natural gas demand growth through 2020
• Continued oil and NGL price recovery
• 25% to 28% revised production growth guidance for 2017
• 20% to 22% production growth CAGR targets for 2018 – 2020
‒ Forecast a $0.05 to $0.15/Mcf premium to NYMEX natural gas prices through 2020
‒ 59% of production targets hedged through 2020 at $3.76/MMBtu
• 24% to 26% liquids contribution to production
• Maintaining D&C spending within consolidated cash flow from operations through 2020
• Declining leverage profile to “mid – 2s”
• Strong commitment to health, safety and environment
• Investing $5.0 billion in midstream project inventory with AM through 2026, with upside exposure to full value chain opportunities

37
APPENDIX
37

Antero Simplified Organizational Structure
38Note: Enterprise Value as of 6/30/2017. AR enterprise value excludes minority interest.
100%Incentive
Distribution Rights(IDRs)
Public
(NYSE: AMGP)Enterprise Value : $4.1 Bn
(NYSE: AM)Enterprise Value : $7.1 Bn
(NYSE: AR)Enterprise Value: $10.9 Bn
80% 20%
AffiliatesAffiliates
53%
32%
Public
68%
47%Public
The combined enterprise value of the Antero complex is over $18 billion

Antero Resources – Increased 2017 Guidance
Key VariableUpdated
2017 Guidance(1)Previous
2017 Guidance(1)
Net Daily Production (MMcfe/d) 2,250 – 2,300 2,160 – 2,250
Net Residue Natural Gas Production (MMcf/d) 1,650 – 1,675 1,625 – 1,675
Net C3+ NGL Production (Bbl/d) 68,000 – 71,000 65,000 – 70,000
Net Ethane Production (Bbl/d) 26,000 – 27,000 18,000 – 20,000
Net Oil Production (Bbl/d) 6,000 – 7,000 5,500 – 6,500
Net Liquids Production (Bbl/d) 100,000 – 105,000 88,500 – 96,500
Natural Gas Realized Price Premium to NYMEX Henry Hub Before Hedging ($/Mcf)(2)(3) +$0.00 – $0.10
Oil Realized Price Differential to NYMEX WTI Oil Before Hedging ($/Bbl) $(7.00) – $(9.00)
C3+ NGL Realized Price (% of NYMEX WTI)(2) 50% – 55%
Ethane Realized Price (Differential to Mont Belvieu) ($/Gal) $0.00
Operating:Cash Production Expense ($/Mcfe)(4) $1.55 – $1.65
Marketing Expense, Net of Marketing Revenue ($/Mcfe) $0.075 – $0.125
G&A Expense ($/Mcfe) $0.15 – $0.20
Operated Wells Completed 170
Drilled Uncompleted Wells 30
Capital Expenditures ($MM):Drilling & Completion $1,300
Land $200
Total Capital Expenditures ($MM) $1,500
Key Operating & Financial Assumptions
3. Includes Btu upgrade as Antero’s processed tailgate and unprocessed dry gas production is greater than 1000 Btu on average. 4. Includes lease operating expenses, gathering, compression and transportation expenses and production taxes.
1. Updated guidance per press release dated 08/02/2017. 2. Based on strip pricing as of 2/24/2017.
39

Note: 6/30/2017 SEC prices were $2.88/MMBtu for natural gas and $43.33/Bbl for oil on a weighted average Appalachian index basis. 1. SEC reserves as of 6/30/2017. 2. 3P reserve pre-tax PV-10 based on annual strip pricing for first 10-years and flat thereafter as of 6/30/2017. Excludes hedge value of $1.7 billion.3. Incremental net unrisked resource of 15 Tcfe supported by over 2,000 locations, including 600 Marcellus, 1,000 Upper Devonian and 400 deep Utica. 4. Net acres and locations as of 6/30/2017.
40
3P Reserves & Resource
AR Marcellus Acreage
AR Ohio Utica AcreageOHIO UTICA SHALE
Net Proved Reserves 1.9 TcfeNet 3P Reserves 7.2 TcfeStrip Pre-Tax 3P PV-10(2) $2.6 BnNet Acres 151,000Undrilled 3P Locations(4) 750
MARCELLUS SHALE
Net Proved Reserves 14.6 TcfeNet 3P Reserves(1) 45.7 TcfeStrip Pre-Tax 3P PV-10(2) $12.7 BnNet Acres(4) 485,000Undrilled 3P Locations(4) 3,371
AR COMBINED TOTAL – 6/30/17 RESERVESAssumes Ethane RejectionNet Proved Reserves 16.5 TcfeNet 3P Reserves(1) 53.0 TcfeStrip Pre-Tax 3P PV-10(2) $15.3 BnAdditional Unbooked Resource(3) 15 TcfeNet Acres(4) 636,000Undrilled 3P Locations(4) 4,121
Deep Utica / Upper Devonian ResourceNet Unrisked resource ~15.0 TcfeUndrilled Locations(3) ~2,000

0.1 0.40.9
1.8
3.5
5.66.6
7.6
0.00.51.01.52.02.53.03.54.04.55.0
0.01.02.03.04.05.06.07.08.09.0
10.0
2010 2011 2012 2013 2014 2015 2016 6/30/17
Marcellus Utica Borrowing Base
16.5 TcfeProved
34.4 TcfeProbable
2.1 TcfePossible
Proved
ProbablePossible
53.0 Tcfe 3P
96% 2P Reserves
Outstanding 6/30/2017 Reserve Growth
1. 2012, 2013, 2014 and 2015 reserves assuming ethane rejection. In 2016, 554 MMBbls of ethane assumed recovered to meet ethane contract. In 6/30/2017, 656 MMBbls of ethane assumed recovered to meet ethane contract. 6/30/2017 SEC prices were $2.88/MMBtu for natural gas and $43.33/Bbl for oil on a weighted average Appalachian index basis. 6/30/2017 10-year average strip prices are NYMEX $3.00/Mcf, WTI $52.06/Bbl, propane $0.69/gal and ethane $0.32/gal.
41
3P RESERVES BY VOLUME – 6/30/2017(1)NET PDP RESERVES (Tcfe)(1)
NET PROVED RESERVES (Tcfe)(1) 6/30/2017 RESERVE ADDITIONS• Proved reserves increased 7% to 16.5 Tcfe
− Proved pre-tax PV-10 at SEC pricing of $9.3 billion, including $1.3 billion of hedge value
− Proved pre-tax PV-10 at strip pricing of $10.1 billion, including $1.7 billion of hedge value
− Increased Marcellus wellhead type curve to 2.0 Bcf/1,000’ of lateral for additional 199 PUD locations
• 3P reserves increased 14% to 53.0 Tcfe− 3P PV-10 at strip pricing of $17.0 billion, including $1.7 billion of
hedge value− Increased Marcellus wellhead type curve to 2.0 Bcf/1,000’ of
lateral for additional 398 Probable locations
• All-in F&D cost of $0.48/Mcfe for 6/30/20170.02.04.06.08.0
10.012.014.0
2010 2011 2012 2013 2014 2015 2016 6/30/17
Marcellus Utica
0.7
2.84.3
7.6
12.7
(Tcfe)
13.215.4 16.5
(Tcfe) $Bn
$550 MM
$4.75 Bn

Gas – 36.0 Tcf
Oil – 126 MMBbls
NGLs – 3,403 MMBbls
Gas – 37.5 Tcf
Oil – 126 MMBbls
NGLs – 2,449 MMBbls
Considerable Reserve Base With Ethane Optionality 23 year proved reserve life based on 2016 production annualized Reserve base provides significant exposure to liquids-rich projects
– 3P reserves of over 3.5 BBbl of NGLs and condensate in ethane recovery mode; 37% liquids– Incudes 2.1 BBbl of ethane
1. Ethane rejection occurs when ethane is left in the wellhead gas stream as the gas is processed, rather than being separated out and sold as a liquid after fractionation. When ethane is left in the gas stream, the BTU content of the residue gas at the outlet of the processing plant is higher. Producers will elect to “reject” ethane when the price received for the higher BTU residue gas is greater than the price received for the ethane being sold as a liquid after fractionation. When ethane is recovered, the BTU content of the residue gas is lower, but a producer is then able to recover the value of the ethane sold as a separate NGL product.
2. 7.0 Tcfe of ethane reserves (1,170 million barrels) was included in 6/30/2017 reserves from the Marcellus Shale as the first de-ethanizer was placed online at the MarkWest Sherwood facility in December 2015 and Antero’s first ethane sales contract is expected to commence in 2017 upon the completion of Mariner East 2.
ETHANE REJECTION(1)(2) ETHANE RECOVERY(1)
42
Marcellus – 45.8 Tcfe
Utica – 7.2 Tcfe
53.0Tcfe
Marcellus – 49.1 Tcfe
Utica – 8.1 Tcfe
57.2Tcfe
29%Liquids
37%Liquids

$5.3 $4.6 $5.3 $4.7 $4.7 $4.7 $4.0 $3.9 $3.6 $3.6 $3.3
$8.7 $7.8 $7.6
$7.1 $7.1 $5.6
$5.4 $5.2 $5.5 $5.5 $5.4
$14.0$12.4 $12.9
$11.8 $11.8$10.3 $9.4
$9.1 $9.1 $9.1 $8.6
$-
$2.0
$4.0
$6.0
$8.0
$10.0
$12.0
$14.0
$16.0
Q4 2014 Q1 2015 Q2 2015 Q3 2015 Q4 2015 Q1 2016 Q2 2016 Q3 2016 Q4 2016 Q1 2017 Q2 2017
($M
M)
COMPLETION COST DRILLING COST
$4.0 $3.8 $3.4 $3.2 $3.2 $3.1 $2.8 $2.6 $2.6 $2.6 $2.6
$8.3 $7.3 $7.4 $7.0 $7.0 $5.4 $5.3 $5.2 $5.2 $5.2 $5.1
$12.3 $11.1 $10.8 $10.2 $10.2
$8.5 $8.1 $7.8 $7.8 $7.8 $7.7
$-
$2.0
$4.0
$6.0
$8.0
$10.0
$12.0
$14.0
Q4 2014 Q1 2015 Q2 2015 Q3 2015 Q4 2015 Q1 2016 Q2 2016 Q3 2016 Q4 2016 Q1 2017 Q2 2017
($M
M)
COMPLETION COST DRILLING COST
Well Cost Reductions
43NOTE: Based on statistics for drilled wells within each respective period.1. Based on 1,250 lbs/ft of proppant and 200 ft. stage spacing.2. Based on 1,300 lbs/ft of proppant and 175 ft. stage spacing.
35% Reduction in Utica well costs since
Q4 2014
37% Reduction in Marcellus well costs
since Q4 2014$0.86 / 1,000’
$1.00 / 1,000’
Marcellus Well Cost Reductions for a 9,000’ Lateral ($MM)(1)
Utica Well Cost Reductions for a 9,000’ Lateral ($MM)(2)

632
1,211
673855
145%
78%
26% 28%97%
46%11% 13% 0
2004006008001,0001,2001,400
0%20%40%60%80%
100%120%140%160%180%
Highly-Rich Gas/Condensate (4)
Highly-Rich Gas (4) Rich Gas (4) Dry Gas (4)
Tota
l 3P
Loca
tions
RO
RTotal 3P LocationsROR @ 6/30/2017 Strip Pricing - After HedgesROR @ 6/30/2017 Strip Pricing - Before Hedges
1. 6/30/2017 pre-tax well economics based on a 9,000’ lateral, 6/30/2017 natural gas and WTI strip pricing for 2017-2026, flat thereafter, NGLs at ~53% of WTI, and applicable firm transportation and operating costs including 50% of Antero Midstream fees. Well cost estimates include $1.2 million for road, pad and production facilities. NGL prices are forecast to increase in 2017 relative to WTI due to projected in-service date of Mariner East 2 project allowing for a significant increase in AR NGL exports via ship.
2. Pricing for a 1225 BTU y-grade ethane rejection barrel. 3. Undeveloped well locations as of 6/30/2017. 4. Assumes enhanced completions (1,750 lbs/ft of proppant).
DRY GAS LOCATIONS RICH GAS LOCATIONS
HIGHLY RICH GAS
LOCATIONS
Assumptions Natural Gas – 6/30/2017 strip Oil – 6/30/2017 strip NGLs – ~53% of Oil Price 2017+
NYMEX($/MMBtu)
WTI($/Bbl)
C3+ NGL(2)
($/Bbl)2017 $3.10 $47 $24
2018 $2.99 $48 $27
2019 $2.85 $49 $28
2020 $2.85 $51 $29
2021 $2.88 $52 $29
2022-26 $2.92-$3.23 $53-$56 $30-$32
Marcellus Well Economics and Total Gross Locations(1)
ClassificationHighly-Rich Gas/
Condensate(4)Highly-Rich
Gas(4) Rich Gas(4) Dry Gas(4)
Modeled BTU 1313 1250 1150 1050EUR (Bcfe): 24.4 22.1 19.7 18.0EUR (MMBoe): 4.1 3.7 3.3 3.0% Liquids: 33% 24% 11% 0%
Lateral Length (ft): 9,000 9,000 9,000 9,000Proppant (lbs/ft sand): 1,750 1,750 1,750 1,750Well Cost ($MM): $8.3 $8.3 $8.3 $8.3Bcfe/1,000’: 2.7 2.5 2.2 2.0Net F&D ($/Mcfe): $0.41 $0.42 $0.50 $0.55Direct Operating Expense ($/well/month): $1,353 $1,353 $1,353 $1,353Direct Operating Expense ($/Mcf): $0.96 $0.96 $1.20 $0.74Transportation Expense ($/Mcf): $0.44 $0.46 $0.44 $0.44Pre-Tax NPV10 ($MM): $14.3 $8.8 $0.29 $0.69Pre-Tax ROR: 97% 46% 11% 13%Payout (Years): 0.9 1.7 7.2 6.4Gross 3P Locations in BTU Regime(3): 632 1,211 673 855
2017Drilling
Plan
Marcellus Single Well Economics – In Ethane Rejection
44

222
59 86
128
255
25%
58%51%
41%47%
19%
39%28%
20% 23%050100150200250300
0%
20%
40%
60%
80%
Condensate (4) Highly-Rich Gas/Condensate (5)
Highly-Rich Gas(5)
Rich Gas (5) Dry Gas (4)
Tota
l 3P
Loca
tions
RO
R
Total 3P LocationsROR @ 6/30/2017 Strip Pricing - After HedgesROR @ 6/30/2017 Strip Pricing - Before Hedges
Utica Single Well Economics – In Ethane Rejection
DRY GAS LOCATIONS RICH GAS LOCATIONS
HIGHLY RICH GAS
LOCATIONS
Utica Well Economics and Gross Locations(1)
Classification Condensate(4)Highly-Rich Gas/
Condensate(5)Highly-Rich
Gas(5) Rich Gas(5) Dry Gas(4)
Modeled BTU 1275 1235 1215 1175 1050EUR (Bcfe): 9.9 18.8 21.5 20.6 18.0EUR (MMBoe): 1.7 3.1 3.6 3.4 3.0% Liquids 39% 30% 21% 17% 0%Lateral Length (ft): 9,000 9,000 9,000 9,000 9,000Proppant (lbs/ft sand): 1,300 1,500 1,500 1,500 1,300Well Cost ($MM): $8.6 $8.9 $9.6 $9.6 $9.3Bcfe/1,000’: 1.1 2.1 2.4 2.3 2.0Net F&D ($/Mcfe): $1.07 $0.59 $0.55 $0.58 $0.64Fixed Operating Expense ($/well/month): $3,011 $3,011 $3,011 $3,011 $1,353Direct Operating Expense ($/Mcf): $1.04 $1.04 $1.04 $1.04 $0.54Direct Operating Expense ($/Bbl): $0.30 $0.30 $0.30 - -Transportation Expense ($/Mcf): $0.53 $0.53 $0.53 $0.53 $0.65Pre-Tax NPV10 ($MM): $2.6 $7.5 $5.3 $3.2 $4.0Pre-Tax ROR: 19% 39% 28% 20% 23%Payout (Years): 4.0 1.9 2.7 3.9 3.3Gross 3P Locations in BTU Regime(3): 222 59 86 128 255
1. 6/30/2017 pre-tax well economics based on a 9,000’ lateral, 6/30/2017 natural gas and WTI strip pricing for 2017-2026, flat thereafter, NGLs at ~53% of WTI, and applicable firm transportation and operating costs including 50% of Antero Midstream fees. Well cost estimates include $1.2 million for road, pad and production facilities. NGL prices are forecast to increase in 2017 relative to WTI due to projected in-service date of Mariner East 2 project allowing for a significant increase in AR NGL exports via ship.
2. Pricing for a 1225 BTU y-grade ethane rejection barrel. 3. Undeveloped well locations as of 6/30/2017, pro forma for recent acreage acquisition. 3P locations representative of BTU regime; EUR and economics within regime will vary based on BTU content.4. Assumes standard completions (1,300 lbs/ft of proppant).5. Assumes enhanced completions (1,500 lbs/ft of proppant).
2017Drilling
Plan
Assumptions Natural Gas – 6/30/2017 strip Oil – 6/30/2017 strip NGLs – ~53% of Oil Price 2017+
NYMEX($/MMBtu)
WTI($/Bbl)
C3+ NGL(2)
($/Bbl)2017 $3.10 $47 $24
2018 $2.99 $48 $27
2019 $2.85 $49 $28
2020 $2.85 $51 $29
2021 $2.88 $52 $29
2022-26 $2.92-$3.23 $53-$56 $30-$32
45

Largest E&P Gas Hedge Position in U.S.
2,163 2,015 2,330 1,418 710 850 90
$3.52$3.91 $3.70 $3.63
$3.31 $3.16 $2.91
$3.10 $2.99 $2.85 $2.85 $2.88 $2.92 $2.98
$0.00
$1.00
$2.00
$3.00
$4.00
$5.00
0400800
1,2001,6002,0002,400
2017 2018 2019 2020 2021 2022 2023
BBtu/d $/McfeAverage Index Hedge Price(1)Hedged Volume Current NYMEX Strip(2)
Commodity Hedge Position
$149 MM $659 MM $692 MM $383 MM $102 MM
Mark-to-Market Value(2)
~ 95% of 2017 Guidance Hedged
461. Weighted average index price based on volumes hedged assuming 6:1 gas to liquids ratio; excludes impact of TCO basis hedges. 27,500 Bbl/d of propane hedged in 2017 and 2,000 Bbl/d hedged in 2018. 20,000 Bbl/d of ethane hedged in 2017 and 3,000 Bbl/d of oil hedged in 2017.
2. As of 6/30/2017.
$/Mcfe
$66 MM
~ 84% of 2018 Target Hedged
~$2.0 billion mark-to-market unrealized gain based on 6/30/2017 prices with3.1 Tcfe hedged from July 1, 2017 through year-end 2023 at $3.62 per MMBtu
• Hedging is a key component of Antero’s business model due to the large, repeatable drilling inventory• Antero has realized $2.8 billion of gains on commodity hedges since 2008 with gains realized in 36 of last 38 quarters
Quarterly Realized Gains/(Losses) – 1Q ‘08 - 2Q ‘17$MM
($2) MM
$4 $5 $25 $34 $29 $28 $26 $12 $16 $17 $28 $29 $19 $25 $43$80 $83
$59 $49 $48$14
$47 $54
$1
$58 $78
$185$196$206
$270
$324$293
$197$190
$45 $31
($2.00)($1.00)$0.00$1.00$2.00$3.00$4.00
$0.0
$70.0
$140.0
$210.0
$280.0
$350.0

$1,000 $1,100
$750 $650 $600
$0
$200
$400
$600
$800
$1,000
$1,200
2016 2017 2018 2019 2020 2021 2022 2023 2024 2025
($ in
Mill
ions
)
$1,500$1,213
($305)$0 $18
$0
$300
$600
$900
$1,200
$1,500
Credit Facility6/30/2017
Bank Debt6/30/2017
L/CsOutstanding6/30/2017
Cash6/30/2017
Liquidity6/30/2017
47
$4,000$2,701
($615)($706) $22
$0
$1,000
$2,000
$3,000
$4,000
Credit Facility6/30/2017
Bank Debt6/30/2017
L/CsOutstanding6/30/2017
Cash6/30/2017
Liquidity6/30/2017
PRO FORMA AR LIQUIDITY POSITION ($MM)(1) AM LIQUIDITY POSITION ($MM
AR Credit Facility AR Senior Notes
DEBT MATURITY PROFILE(1)
AM Credit Facility
$305
AM Senior Notes
Liquidity & Debt Term Structure - Approximately $3.9 billion of combined AR and AM financial liquidity as of 6/30/2017 pro forma for AM unit sale- No leverage covenant in AR bank facility, only interest coverage and working capital covenants
Recent credit facility increases, equity and high yield offerings have allowed Antero to reduce its cost of debt to 4.9% and significantly enhance liquidity with an average debt maturity of August 2022
$615
1. As of 6/30/2017. Pro forma for AR sale of 10.0 million AM units for $315 million gross proceeds on 9/6/2017.
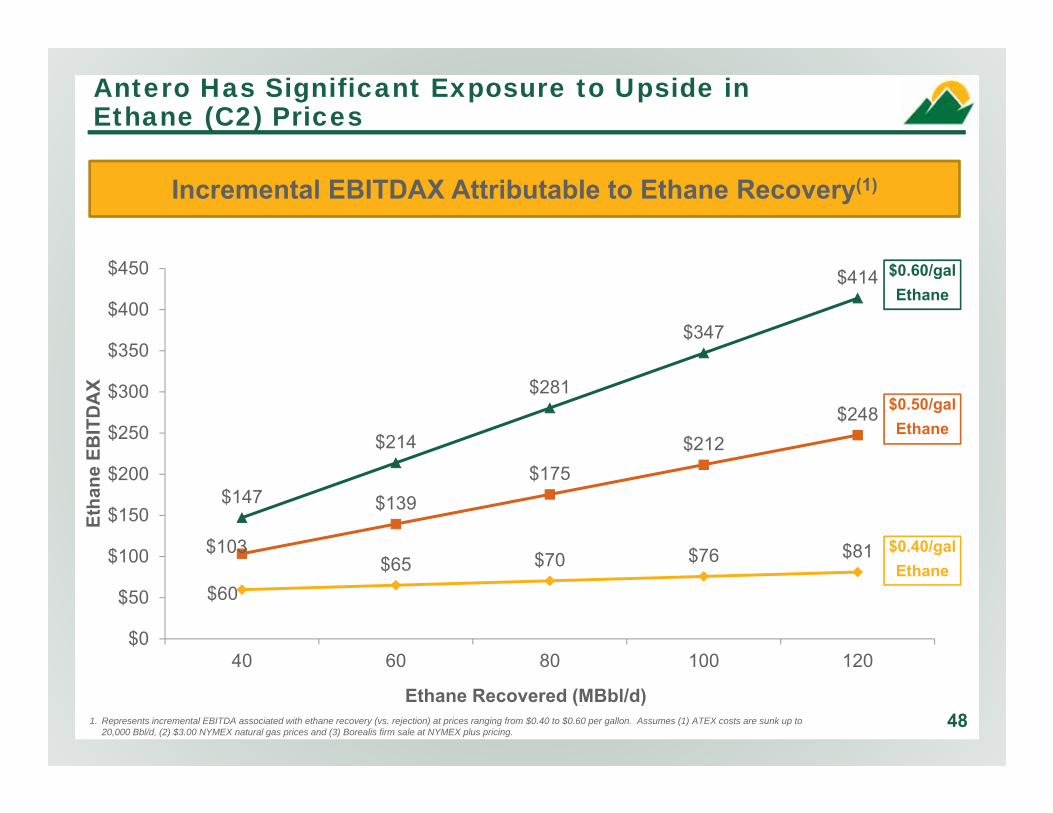
$60$65 $70 $76 $81$103
$139$175
$212$248
$147
$214
$281
$347
$414
$0
$50
$100
$150
$200
$250
$300
$350
$400
$450
40 60 80 100 120
Etha
ne E
BIT
DA
X
ATEX FT
Ethane Recovered (MBbl/d)
$0.60/galEthane
$0.50/galEthane
$0.40/galEthane
1. Represents incremental EBITDA associated with ethane recovery (vs. rejection) at prices ranging from $0.40 to $0.60 per gallon. Assumes (1) ATEX costs are sunk up to 20,000 Bbl/d, (2) $3.00 NYMEX natural gas prices and (3) Borealis firm sale at NYMEX plus pricing.
48
Incremental EBITDAX Attributable to Ethane Recovery(1)
Antero Has Significant Exposure to Upside in Ethane (C2) Prices
49
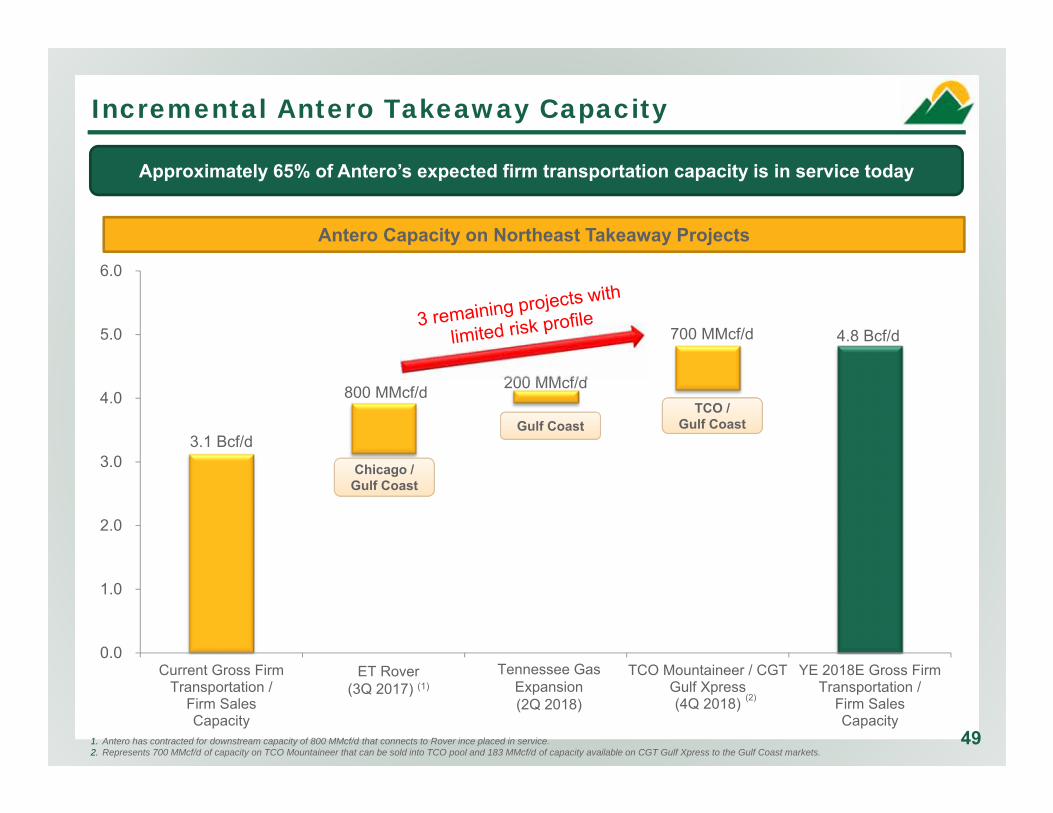
Incremental Antero Takeaway Capacity
1. Antero has contracted for downstream capacity of 800 MMcf/d that connects to Rover ince placed in service. 2. Represents 700 MMcf/d of capacity on TCO Mountaineer that can be sold into TCO pool and 183 MMcf/d of capacity available on CGT Gulf Xpress to the Gulf Coast markets.
3.1 Bcf/d
4.8 Bcf/d
800 MMcf/d 200 MMcf/d
700 MMcf/d
0.0
1.0
2.0
3.0
4.0
5.0
6.0
Current Gross FirmTransportation /
Firm SalesCapacity
ET Rover(2Q 2017)
TGP Expansion(2Q 2018)
TCO Mountaineer / CGTGulf Xpress(4Q 2018)
YE 2018E Gross FirmTransportation /
Firm SalesCapacity
(2)
Approximately 65% of Antero’s expected firm transportation capacity is in service today
Antero Capacity on Northeast Takeaway Projects
Chicago / Gulf Coast
Gulf CoastTCO /
Gulf Coast
Tennessee Gas Expansion(2Q 2018)
ET Rover(3Q 2017) (1)

Key Appalachian Natural Gas Takeaway Projects
Tran
sco
Atla
ntic
Sun
rise
–M
id-2
018
(1.7
Bcf
/d)
4.8 Bcf/d
4.2 Bcf/d
5.2 Bcf/d
1.8 Bcf/d
Antero Producing
Areas
Source: Public filings and press releases. Excludes TETCO expansions (972 MMcf/d) that are currently under construction. 1. 1.05 Bcf/d capacity available to move gas from Leach to the Gulf on CGT Rayne Xpress. 2. 860 MMcf/d of capacity available on CGT Gulf Xpress to move gas to the Gulf Coast markets.
Antero firm transportation commitment
Growth in natural gas infrastructure by the end of 2019, resulting in 16.8 Bcf/d of incremental capacity, will support expected supply growth
50

Moody's S&P
Positive Ratings Momentum
Moody’s / S&P Historical Corporate Credit Ratings
Corporate Credit Rating (Moody’s / S&P)
Ba3 / BB-
B1 / B+
B2 / B
B3 / B-
2/24/2011 10/21/2013 9/4/20145/31/2013
Ba2 / BB
Ba1 / BB+
Caa1 / CCC+
(1)
1. Represents corporate credit rating of Antero Resources Corporation / Antero Resources LLC.
Baa3 / BBB-
Moody’s Rating Rationale S&P Rating Rationale
51
3/31/2015
Ba2/BB
6/30/20179/1/2010
Ratings AffirmedFebruary 2017
Antero’s stable credit metrics through the commodity price crisis and improving leverage profile ensured its rating remained unchanged despite the downgrades experienced by many of its peers
Outlook Stable. “The outlook change reflects Moody's expectation oflower financial leverage and less negative free flow through 2018 relativeto our prior estimates. Facing weak industry conditions, Antero hastaken a number of measures over the past year to keep its leverage incheck, including issuing over $1 billion of equity, raising $170 millionfrom asset sales and reducing debt with those proceeds, while alsocutting operating and capital costs."
- S&P Credit Research, February 2017
“Outlook Stable. The affirmation reflects our expectation that Antero willbe able to maintain adequate liquidity and credit measures appropriatefor the rating over the next two years. We expect the company willcontinue to increase production and reserves while maintaining FFO todebt above 20%.”
- S&P Credit Research, March 2017

($ in millions) 6/30/2017 Cash $40
AR Senior Secured Revolving Credit Facility(1) 615AM Bank Credit Facility 3055.375% Senior Notes Due 2021 1,0005.125% Senior Notes Due 2022 1,1005.625% Senior Notes Due 2023 7505.00% Senior Notes Due 2025 6005.375% Senior Notes Due 2024 – AM 650Net Unamortized Premium 2Total Debt(1) $5,022Net Debt(1) $4,982
Financial & Operating StatisticsLTM EBITDAX(2) $1,535LTM Interest Expense(3) $253Proved Reserves (Bcfe) (6/30/2017) 16,514Proved Developed Reserves (Bcfe) (6/30/2017) 8,280
Credit Statistics
Net Debt / LTM EBITDAX 3.2xNet Debt / Net Book Capitalization 36%Net Debt / Proved Developed Reserves ($/Mcfe) $0.60Net Debt / Proved Reserves ($/Mcfe) $0.30
LiquidityCredit Facility Commitments(4) $5,500Less: Borrowings (920)Less: Letters of Credit (706)Plus: Cash 40
Liquidity (Credit Facility + Cash) $3,914
Antero Capitalization – Consolidated
1. Pro forma for AR sale of 10.0 million AM units for $315 million gross proceeds on 9/6/2017.2. 6/30/2017 EBITDAX reconciliation provided in Appendix.3. LTM interest expense adjusted for all capital market transactions since 1/1/2016.4. AR lender commitments at $4.0 billion and borrowing base capacity at $4.75 billion. AM credit facility capacity at $1,500 million.
52

Keys to Execution
Local Presence
Antero has more than 3,500 employees and contract personnel working full-time for Antero in West Virginia. 79% of these personnel are West Virginia residents.
District office in Marietta, OH District office in Bridgeport, WV 312 (53%) of Antero’s 587 employees are located in West Virginia and Ohio
Safety & Environmental
Five company safety representatives and 57 safety consultants cover all material field operations 24/7 including drilling, completion, construction and pipelining
37 person environmental staff plus outside consultants monitor all operations and perform baseline water well testing
Natural Gas Vehicles (NGV)
Antero supported the first natural gas fueling station in West Virginia Antero has 30 NGV trucks and plans to continue to convert its truck fleet to NGV
Pad Impact Mitigation Closed loop mud system – no mud pits Protective liners or mats on all well pads in addition to berms
Natural Gas PoweredFrac Equipment Two natural gas powered clean fleet frac crews operating
Green Completion Units All Antero well completions use green completion units for completion flowback,
essentially eliminating methane (CH4) emissions (full compliance with EPA 2015requirements)
Central Fresh Water System & Water Recycling
Numerous sources of water – built central water system to source fresh water for completions
Building state of the art wastewater treatment facility in WV (60,000 Bbl/d) Will recycle virtually all flowback and produced water when facility in-service
LEED Gold Headquarters Building Corporate headquarters in Denver, Colorado LEED Gold Certified
Health, Safety, Environment & CommunityAntero Core Values: Protect Our People, Communities And The Environment
Strong West Virginia Presence 79% of all Antero Marcellus
employees and contract workers are West Virginia residents
Antero named Business of the Year for 2013 in Harrison County, West Virginia “For outstanding corporate citizenship and community involvement”
Antero representatives recently participated in a ribbon cutting with the Governor of West Virginia for the grand opening of the first natural gas fueling station in the state; Antero supported the station with volume commitments for its NGV truck fleet
53
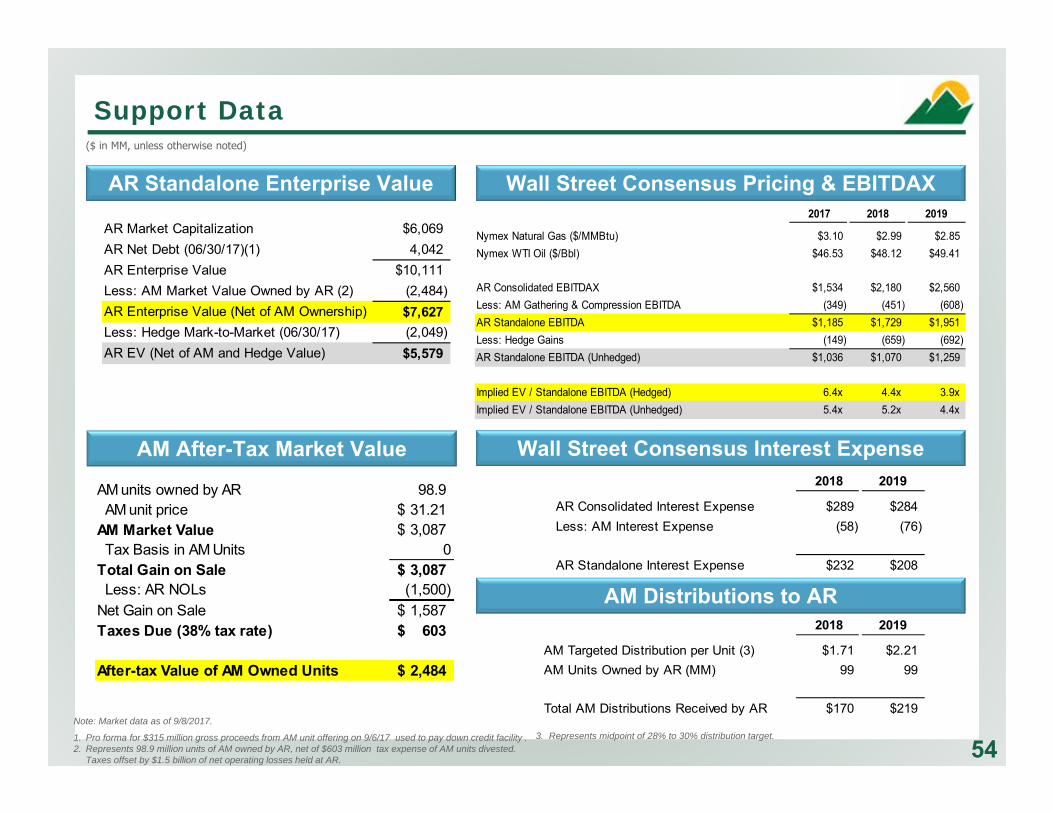
2018 2019
AM Targeted Distribution per Unit (3) $1.71 $2.21AM Units Owned by AR (MM) 99 99
Total AM Distributions Received by AR $170 $219
2018 2019
AR Consolidated Interest Expense $289 $284Less: AM Interest Expense (58) (76)
AR Standalone Interest Expense $232 $208
AR Market Capitalization $6,069AR Net Debt (06/30/17)(1) 4,042AR Enterprise Value $10,111Less: AM Market Value Owned by AR (2) (2,484)AR Enterprise Value (Net of AM Ownership) $7,627Less: Hedge Mark-to-Market (06/30/17) (2,049)AR EV (Net of AM and Hedge Value) $5,579
AM units owned by AR 98.9 AM unit price 31.21$ AM Market Value 3,087$ Tax Basis in AM Units 0Total Gain on Sale 3,087$ Less: AR NOLs (1,500) Net Gain on Sale 1,587$ Taxes Due (38% tax rate) 603$
After-tax Value of AM Owned Units 2,484$
54
Wall Street Consensus Pricing & EBITDAX
Wall Street Consensus Interest Expense
AM Distributions to AR
Note: Market data as of 9/8/2017.
1. Pro forma for $315 million gross proceeds from AM unit offering on 9/6/17 used to pay down credit facility .2. Represents 98.9 million units of AM owned by AR, net of $603 million tax expense of AM units divested.
Taxes offset by $1.5 billion of net operating losses held at AR.
AR Standalone Enterprise Value
AM After-Tax Market Value
($ in MM, unless otherwise noted)
3. Represents midpoint of 28% to 30% distribution target.
2017 2018 2019
Nymex Natural Gas ($/MMBtu) $3.10 $2.99 $2.85Nymex WTI Oil ($/Bbl) $46.53 $48.12 $49.41
AR Consolidated EBITDAX $1,534 $2,180 $2,560Less: AM Gathering & Compression EBITDA (349) (451) (608)AR Standalone EBITDA $1,185 $1,729 $1,951Less: Hedge Gains (149) (659) (692)AR Standalone EBITDA (Unhedged) $1,036 $1,070 $1,259
Implied EV / Standalone EBITDA (Hedged) 6.4x 4.4x 3.9xImplied EV / Standalone EBITDA (Unhedged) 5.4x 5.2x 4.4x
Support Data

Antero Resources Standalone EBITDAX Reconciliation
AR Standalone EBITDAX Reconciliation
($ in millions) Six Months Ended LTM Ended06/30/2017 06/30/2017
EBITDAX:Operating income $548.3 $315.2Commodity derivative fair value (gains) (524.4) (414.9)Net cash receipts on settled derivatives instruments 75.9 462.1Depreciation, depletion, amortization and accretion 346.7 716.5Impairment of unproved properties and accretion 42.1 169.6Exploration expense 3.9 8.7Change in fair value of contingent acquisitions consideration (7.1) (16.7)Equity-based compensation expense 39.2 79.0(Gains) on sale of assets - (93.8)State franchise taxes -Segment Adjusted EBITDAX $524.6 $1,225.7AM distributions net to AR ownership 63.1 119.2
55

Antero Resources EBITDAX Reconciliation
56
EBITDAX Reconciliation
($ in millions) Quarter Ended LTM Ended6/30/2017 6/30/2017
EBITDAX:Net income including noncontrolling interest $40.0 $160.9Commodity derivative fair value gains (85.6) (414.9)Net cash receipts on settled derivatives instruments 31.1 462.1Gain of sale on assets - (97.6)Interest expense 68.6 262.9Loss on early extinguishment of debt - 16.9Income tax expense 18.8 25.5Depreciation, depletion, amortization and accretion 201.7 827.4Impairment of unproved properties 15.2 169.6Exploration expense 1.8 8.7Equity-based compensation expense 27.0 105.6Equity in earnings of unconsolidated affiliate (3.6) (5.9)Distributions from unconsolidated affiliates 5.8 13.5Consolidated Adjusted EBITDAX $320.8 $1,534.7

Antero Midstream EBITDA Reconciliation
57
EBITDA and DCF Reconciliation
$ in thousandsThree months ended
June 30,2016 2017
Reconciliation of Net Income to Adjusted EBITDA and Distributable Cash Flow: Net income $49,912 $87,175
Interest expense 3,879 9,015Depreciation expense 24,140 30,512Accretion of contingent acquisition consideration 3,461 3,590Equity-based compensation 6,793 6,951Equity in earnings from unconsolidated affiliate (484) (3,623)
- 5,820Adjusted EBITDA $87,701 $139,440
Interest paid (4,264) (2,308)Cash reserved for payment of income tax withholding upon vesting of
Antero Midstream Partners LP equity-based compensation awards (1,000) (2,431)Cash to be received from unconsolidated affiliates 778 -Cash reserved for bond interest - (8,734)Maintenance capital expenditures (5,710) (16,422)
Distributable Cash Flow $77,505 $109,545

($MMs)
Exploration & Production
Gathering & Processing
Water Handling & Treatment Marketing
Elimination of Intersegment Transactions
Consolidated Total
Revenues: Third-Party $652 $8 $1 $50 - $711 Intersegment 0 96 94 - (191) - Gains on settled derivatives 31 - - - - 31Total Revenue $683 $105 $95 $50 (191) $742
Cash operating expenses:Lease operating $17 - $41 - ($42) $17Gathering, Processing & Transp. (3rd party) 257 - - - - 257Gathering, Processing & Transp. (AM fees) 96 10 - - (96) 10Production Taxes 22 - 1 - - 23G&A (before equity-based comp) 30 5 2 - (0) 37Marketing - - - 77 - 77
Total Cash Operating Expenses $422 $15 $45 $77 ($138) $421Segment Adjust EBITDAX $261 $89 $50 ($27) ($53) $321
Capital Expenditures: D&C (excluding water) $281 - - - - $281D&C (including water) 94 - - - (53) 41Land / Acquisitions 210 - - - - 210G&C / Water Infrastructure - 89 59 147
Total CapEx $585 $89 $59 $0 ($53) $680
2Q 2017 Segment EBITDAX and Capital Expenditures
58
2Q 2017 Segment EBITDAX and Capital Expenditures
1
2
Gathering and compression fees paid to Antero Midstream are included in Gathering, Processing & Transportation expense on stand-alone basis (eliminated on consolidated basis); Gathering and compression operating expenses borne by AM on stand-alone basis (included in GPT on consolidated basis)Water fees paid to Antero Midstream included in Drilling & Completion capital expenditures on stand-alone basis; water operating expenses borne by AM on stand-alone basis and AR on consolidated basis
On consolidated basis, water fees are eliminated from D&C capital, but water operating expenses are capitalized
Stand-alone EBITDAX: $234 Million: $139 Million

Cautionary Note
The SEC permits oil and gas companies, in their filings with the SEC, to disclose only proved, probable and possible reserve estimates (collectively, “3P”). Antero has provided internally generated estimates for proved, probable and possible reserves in this presentation in accordance with SEC guidelines and definitions. The estimates of proved, probable and possible reserves as of December 31, 2016 included in this presentation have been audited by Antero’s third-party engineers. Unless otherwise noted, reserve estimates as of December 31, 2016 assume ethane rejection and strip pricing.
Actual quantities that may be ultimately recovered from Antero’s interests may differ substantially from the estimates in this presentation. Factors affecting ultimate recovery include the scope of Antero’s ongoing drilling program, which will be directly affected by commodity prices, the availability of capital, drilling and production costs, availability of drilling services and equipment, drilling results, lease expirations, transportation constraints, regulatory approvals and other factors; and actual drilling results, including geological and mechanical factors affecting recovery rates.
In this presentation:
“3P reserves” refer to Antero’s estimated aggregate proved, probable and possible reserves as of December 31, 2016. The SEC prohibits companies from aggregating proved, probable and possible reserves in filings with the SEC due to the different levels of certainty associated with each reserve category.
“EUR,” or “Estimated Ultimate Recovery,” refers to Antero’s internal estimates of per well hydrocarbon quantities that may be potentially recovered from a hypothetical future well completed as a producer in the area. These quantities do not necessarily constitute or represent reserves within the meaning of the Society of Petroleum Engineer’s Petroleum Resource Management System or the SEC’s oil and natural gas disclosure rules.
“Condensate” refers to gas having a heat content between 1250 BTU and 1300 BTU in the Utica Shale.
“Highly-Rich Gas/Condensate” refers to gas having a heat content between 1275 BTU and 1350 BTU in the Marcellus Shale and 1225 BTU and 1250 BTU in the Utica Shale.
“Highly-Rich Gas” refers to gas having a heat content between 1200 BTU and 1275 BTU in the Marcellus Shale and 1200 BTU and 1225 BTU in the Utica Shale.
“Rich Gas” refers to gas having a heat content of between 1100 BTU and 1200 BTU.
“Dry Gas” refers to gas containing insufficient quantities of hydrocarbons heavier than methane to allow their commercial extraction or to require their removal in order to render the gas suitable for fuel use.
Regarding Hydrocarbon Quantities
59