Embed Size (px)
Citation preview

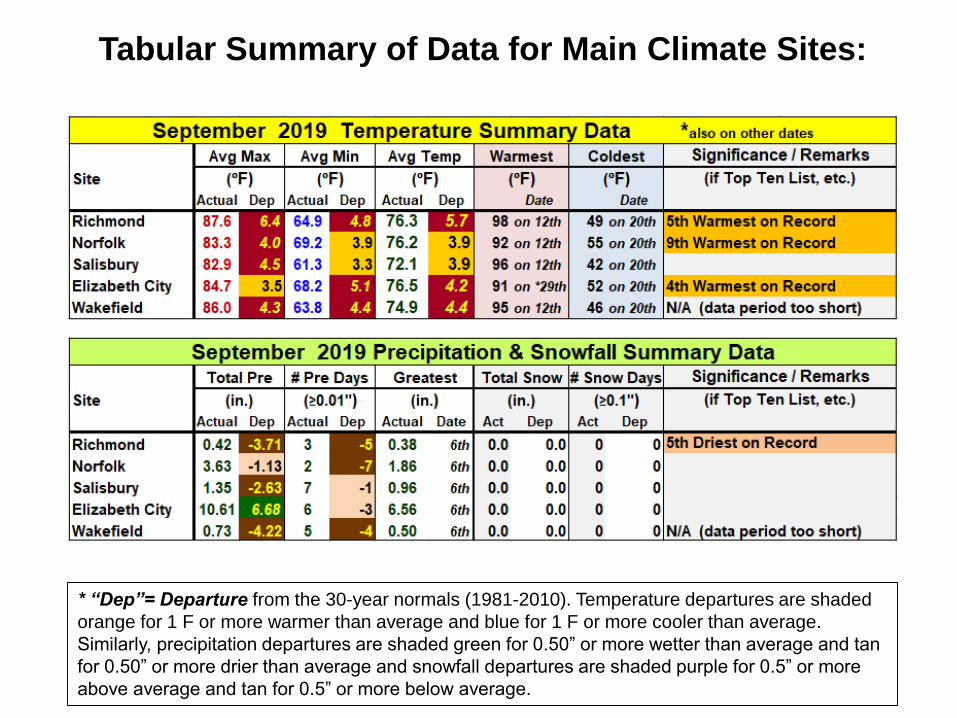
General Summary September 2019 was very warm to hot and aside from locally heavy rainfall associated
with Hurricane Dorian across far southeast VA and northeast NC, much drier than normal.
Monthly average temperature departures primarily ranged from 3 to 6 degrees above the long
term means. Most days of the month had above normal temperatures throughout the region,
with the last week in the month seeing well above normal values with some daily record highs
and record high mins set. Richmond recorded 12 days with highs in the 90s which is the most
in September since 1980 (normal is 3 days and the most on record is 15 days in 1970). Due to
an onshore flow near the coast much of the time, temperatures were not nearly as hot; Norfolk
and Elizabeth City had 3 days in the 90s and Salisbury had 2 days.
Precipitation was almost everywhere well below normal, with Richmond recording its 5th
driest September on record with a total of just 0.42” for the entire month. The coop site in
Clarksville, VA ended up with just a trace. The only exception to the dry conditions was near
the coast in northeast NC where Hurricane Dorian brought in excess of 5” of rainfall on the 6th.
Elizabeth City received 6.56”: easily a daily record for the date and the 4th highest single day
rain total on record. For the entire month, Elizabeth City recorded over 10 inches of rain but it
fell on just 6 days of the month (normal is 9 days). Norfolk’s total monthly rainfall of 3.63” was
only marginally drier than average, but the rain fell on just 2 days (tied with 1884 for the fewest
number of days on record in September). Richmond had just 3 days of measureable rain
(normal is 8 and the only month with fewer days was 2 in 1922), Salisbury had 7 days which was
near the normal (8 days) but the monthly total was just 1.35” (14th driest).
The series of pages that follow show various statistics for September 2019, with a look
ahead at October Climatology on the final slide.
September 2019 Review

Daily High Temperature Departures
at Richmond & Norfolk

Regional Temperature & Precipitation Maps
Departures from the 30-year normals (1981-2010) are shown for both average temperature and
total precipitation. For temperature, the departures are shaded orange for 1 F or more warmer
than average and blue for 1 F or more cooler than average (green shading indicates values within
one degree of normal). Similarly, precipitation departures are shaded green for 1.00” or more
wetter than average and tan for 1.00” or more drier than normal (near normal values are shaded
the same color as the precipitation amount box).
Tabular Summary of Data for Main Climate Sites:
* “Dep”= Departure from the 30-year normals (1981-2010). Temperature departures are shaded
orange for 1 F or more warmer than average and blue for 1 F or more cooler than average.
Similarly, precipitation departures are shaded green for 0.50” or more wetter than average and tan
for 0.50” or more drier than average and snowfall departures are shaded purple for 0.5” or more
above average and tan for 0.5” or more below average.

Norfolk, VA Records (Period of Record 146 yrs./1874-2019) *tie
Record Highs: 90 (28th)
Record Low Maximums: none set.
Record Lows: none set.
Record High Minimums: 77 (5th), 75 (28th).
Daily Precipitation: none set.
Daily Snowfall: none set.
Richmond, VA Daily Records (Period of Record 123 yrs./1897-2019) *tie
Record Highs: 98 F (12th), 93 (28th), 94 (29th).
Record Low Maximums: none set.
Record Lows: none set.
Record High Minimums: *70 (28th).
Daily Precipitation: none set.
Daily Snowfall: none set.
Daily Records for Long Term Climate Sites:

October Climatology
October is the “middle” month of meteorological Fall and on average sees a significant drop in temperature from the beginning to
the end of the month. Daily normal highs average in the upper 70s over interior southern VA and NE NC during the first week of
the month, falling to the mid to upper 60s by the end of the month. Near the coastal areas and over the northern interior, daily
highs average in the mid 70s early in the month, falling to the lower to mid 60s by month’s end. Daily normal lows generally
range from the mid to upper 50s along the SE VA and NE NC coast, falling to the upper 40s by month’s end. Inland, daily lows
average in the low to mid 50s early in the month, falling to the low to mid 40s by the end of the month (over much of the central and
northern Piedmont, lows are a little cooler, generally close to 50F early, falling to near 40F by late in the month). Climatologically,
October is among the driest months of the year at most of our climate and co-op sites, and in terms of the number of days with
measurable rainfall, it averages the fewest of all months. The following graphics depict the long term means for temperature and
precipitation at various locations across the CWA. For temperature, the number shown in the orange circle is the mean number of
days with a high of 80F or higher. Similarly for precipitation, the value in the green circle represents the mean number of days
with measurable precipitation.