Embed Size (px)
Citation preview
September 5, 2017
IPO Review
ICICI Securities Ltd | Retail Equity Research
Incorporated in 1993, Dixon Technologies (India) Ltd (DTL) is engaged in
the manufacture of consumer durables, lightings and mobile phones for
major brands like Panasonic, Phillips and Gionee. DTL has a fully
integrated end-to-end product and solution suite for original equipment
manufacturers (OEMs) ranging from global sourcing, manufacturing,
quality testing and packaging to logistics. The company is also a leading
original design manufacturer (ODM) of lighting products, LED TVs and
semi-automatic washing machines in India. The company has six
manufacturing plants in north India and is starting a new facility in South
India by Q2FY18. Further, DTL has reported revenue, PAT CAGR of 34%,
78%, respectively, in FY13-17. The company aims to raise ~| 599 crore
through a fresh issue (3.4 lakh shares) and offer for sale of shares (30.5
lakh shares) at a price band of | 1760-1766 per share.
Investment concerns
Leading market position in key verticals…
DTL’s experience in manufacturing, successful backward integration and
design capabilities, strong relationships with global suppliers and anchor
customers has led to gain market share in the EMS/ODM segments (i.e.
electronic manufacturing services/ODM). According to a Frost & Sullivan
report, DTL enjoyed market leadership in manufacturing flat panel
displays (FPD) TVs, washing machines, LED and CFL lights in India in
FY16. Leading position helps DTL buy critical components at competitive
prices, achieving operational efficiencies, helping it to continue expanding
its customer base and further strengthening relationships with customers.
Expansion of industrial footprint into new geographies…
DTL is seeking to expand its geographical footprint by enhancing current
manufacturing capacities and setting up new manufacturing facilities in
Tirupati (Andhra Pradesh). The company along with its 50% JV partner
Aditya Infotech Ltd has agreed to manufacture CCTVs and DVRs in the
Tirupati facility. As the Tirupati facility is subject to certain capital
subsidies/tax exemptions, we believe a gradual increase in volume would
benefit the company in terms of accretive return on investment as DTL is
confident of achieving break-even points in its first year of operation.
Concerns
1. DTL’s top five customers contribute ~83% to the topline. Dependency
on a limited number of customers for business, may generally involve
several risks. These risks may include reduction, delay or cancellation of
orders, failure to renew sales contracts, etc
2. The company has been in the contract manufacturing business since
1993. However, it has not entered into long-term contracts with any big
brands to sell its consumer durable products. This is a major drawback as
the contract manufacturing market is highly competitive
3. Home appliances category is highly skewed towards one product i.e.
SA washing machines that are considered to be a low margin product for
OEMs
Fairly valued at ~40x FY17 P/E
At the higher end of the IPO price band of | 1766, the stock is valued at
~40x FY17 P/E (post issue), which appears to be fairly valued considering
its presence in mass products categories, high dependency on a few
clients and low EBITDA margin profile. Additionally, increasing focus
towards the mobile segment (EBITDA margin of 0.6%) would further
dilute the profit margin.
Dixon Technologies (India) Ltd
Price band | 1760-1766
Rating matrix
Rating : Unrated
Issue Details
Issue Opens 6-Sep-17
Issue Closes 8-Sep-17
Issue Size (| Crore) 597-599
Fresh Issue (| crore) 60
Offer for Sale (| crore) 539
Price Band (|) 1760-1766
No of Shares on Offer (crore) 0.34
QIB (%) 50%
Non-Institutional (%) 15%
Retail (%) 35%
Commencement of Trading 18-Sep-17
Objects of issue
Objects of the Issue Amount (| crore)
Repayment/prepayment of certain indebtedness22.0
Setting up a unit for manufacturing of LED TVs
at the Tirupati Facility7.6
Enhancement of backward integration
capabilities in the lighting products vertical at
Dehradun facility
8.9
Upgradation of the IT infrastructure 10.6
General corporate purposes 10.9
Total 60.0
Shareholding Pattern
Pre-Issue Post-Issue
Promoter & promoter group 46.2% 39.2%
Public & Others 53.8% 60.8%
Financial Summary
| Crore FY13 FY14 FY15 FY16 FY17
Total Revenue 766.9 1093.7 1201.3 1389.4 2456.8
EBITDA 20.1 26.0 32.2 58.7 90.7
EBITDA Margin (%) 2.6 2.4 2.7 4.2 3.7
PAT 5.0 13.5 11.9 42.6 50.4
Valuation Summary (at | 1766; Post issue)
(x) FY13 FY14 FY15 FY16 FY17
EV/EBITDA 100.8 78.0 63.0 34.5 22.3
P/BV 32.5 27.1 23.5 16.3 10.1
P/E 402 148 169 47 40
Research Analyst
Sanjay Manyal
sanjay,[email protected]
Hitesh Taunk

Page 2 ICICI Securities Ltd | Retail Equity Research
Company Background
Commencing in 1993, Dixon Technologies (India) Ltd (DTL) is a home-
grown design-focused and solutions company engaged in manufacturing
products in the consumer durables, lighting and mobile phones markets
in India. DTL’s diversified product portfolio includes (i) consumer
electronics like LED TVs; (ii) home appliances like washing machines; (iii)
lighting products like LED bulbs and tubelights, downlighters and CFL
bulbs and (iv) mobile phones. It also provides solutions in reverse
logistics i.e. repair and refurbishment services of set top boxes, mobile
phones and LED TV panels. DTL is a fully integrated end-to-end product
and solution suite to original equipment manufacturers (OEMs) ranging
from global sourcing, manufacturing, quality testing and packaging to
logistics. It is also a leading original design manufacturer (ODM) of
lighting products, LED TVs and semi-automatic washing machines in
India. As an ODM, DTL develop and design products in-house at its own
R&D centre. Further, it manufactures and supplies these products to well-
known companies in India who, in turn, distribute these products under
their own brands. Currently, it has six manufacturing unit in North India.
Key customers include Panasonic India Pvt Ltd, Philips Lighting India Ltd,
Haier Appliance (I) Pvt Ltd, Gionee, Surya Roshni Ltd, Reliance Retail Ltd,
Intex Technologies (I) Ltd, Mitashi Edutainment Pvt Ltd and Dish Infra
Services Pvt Ltd.
Exhibit 1: Key Milestones
Commencement of manufacture of
colour televisions
-Entered the lighting products vertical with
manufacture of CFL products
-Commencement of reverse logistics
operations
Establishment of Noida FacilityCommencement of manfacturing of
Semi Automatic washing machines
Entered into a JV agreement with
Aditya Infotech Limited for the
manufacture of security systems
including CCTVs and DVRs,
through our joint venture
company, ADTPL
19961993-94 2008 2010 2016 2017
Commencement of manufacture
of mobile phones through our
joint venture, PEPL
Source: RHP, ICICIdirect.com Research
Exhibit 2: Product offerings within verticals
Consumer Electronics LEG TVs - 19" to 65" anG 4K2K tecnology
Lighting ProGucts CFL, Lamps, Ballast,Tube Lights, Batten, CFL, PCB, Gownlighters, CFL/LEG Grivers
Home appliances Semi automatic washing machine ranging from 6.2kg to 8.2kg
Mobile Phones Smart phones
Reverse Logistics
1.Repair anG refurbishment- Set top boxes
2. Repair- mobile phones, LCG/LEG TVs, LEG panels etc
Source: RHP, ICICIdirect.com Research
Page 3 ICICI Securities Ltd | Retail Equity Research
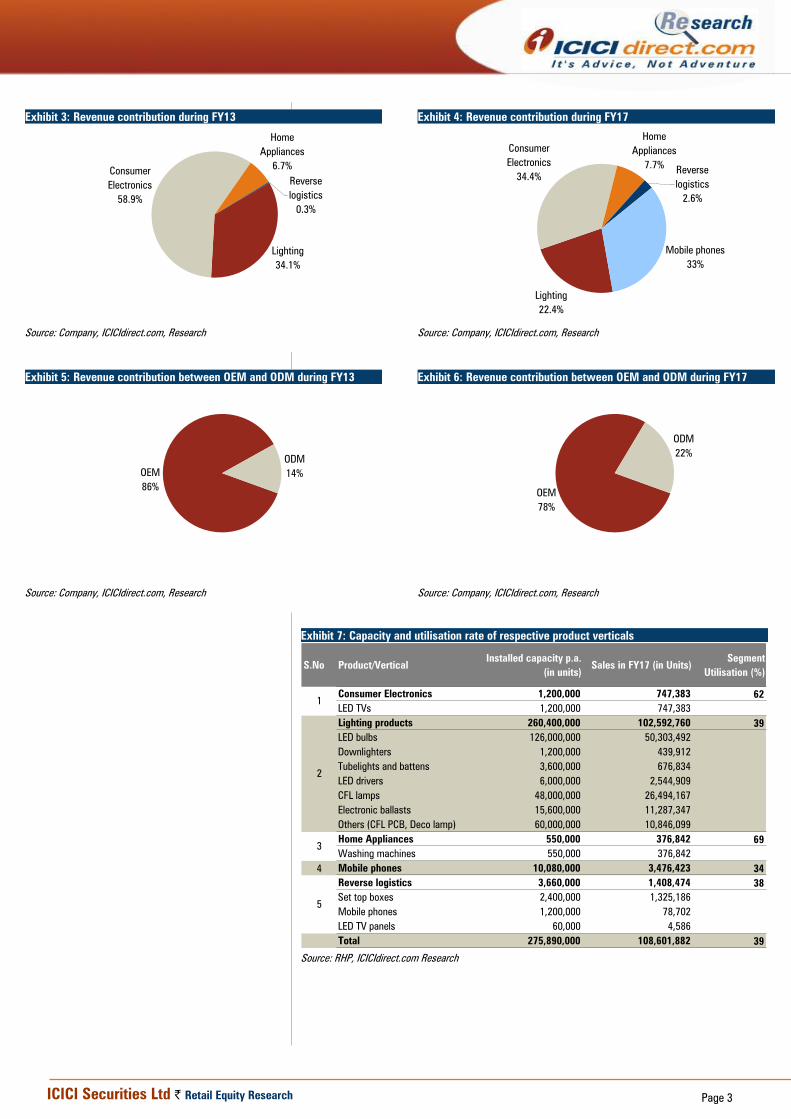
Exhibit 3: Revenue contribution during FY13
Lighting
34.1%
Consumer
Electronics
58.9%
Home
Appliances
6.7%
Reverse
logistics
0.3%
Source: Company, ICICIdirect.com, Research
Exhibit 4: Revenue contribution during FY17
Mobile phones
33%
Reverse
logistics
2.6%
Home
Appliances
7.7%
Consumer
Electronics
34.4%
Lighting
22.4%
Source: Company, ICICIdirect.com, Research
Exhibit 5: Revenue contribution between OEM and ODM during FY13
OEM
86%
ODM
14%
Source: Company, ICICIdirect.com, Research
Exhibit 6: Revenue contribution between OEM and ODM during FY17
OEM
78%
ODM
22%
Source: Company, ICICIdirect.com, Research
Exhibit 7: Capacity and utilisation rate of respective product verticals
S.No Product/Vertical
Installed capacity p.a.
(in units)
Sales in FY17 (in Units)
Segment
Utilisation (%)
Consumer Electronics 1,200,000 747,383 62
LED TVs 1,200,000 747,383
Lighting products 260,400,000 102,592,760 39
LED bulbs 126,000,000 50,303,492
Downlighters 1,200,000 439,912
Tubelights and battens 3,600,000 676,834
LED drivers 6,000,000 2,544,909
CFL lamps 48,000,000 26,494,167
Electronic ballasts 15,600,000 11,287,347
Others (CFL PCB, Deco lamp) 60,000,000 10,846,099
Home Appliances 550,000 376,842 69
Washing machines 550,000 376,842
4 Mobile phones 10,080,000 3,476,423 34
Reverse logistics 3,660,000 1,408,474 38
Set top boxes 2,400,000 1,325,186
Mobile phones 1,200,000 78,702
LED TV panels 60,000 4,586
Total 275,890,000 108,601,882 39
1
2
3
5
Source: RHP, ICICIdirect.com Research

Page 4 ICICI Securities Ltd | Retail Equity Research
Investment Rationale
Leading market position in key verticals…
DTL’s experience in manufacturing, successful backward integration and
design capabilities, strong relationships with global suppliers and anchor
customers have enabled it to gain market share in the EMS/ODM
segments (i.e. electronic manufacturing services/original design
manufacturing). According to a Frost & Sullivan report, DTL enjoyed
market leadership in manufacturing of flat panel displays (FPD) TVs,
washing machines, LED and CFL lights in India in FY16. Its leading
position helps DTL buy critical components at competitive prices,
achieving operational efficiencies and helps the company to continue to
expand its customer base and further strengthens its relationship with
anchor customers. It further enhances its ability to diversify into related
products and enter new geographies.
Exhibit 8: Market leader in EMS/ODM business segment
Source: Company, ICICIdirect.com Research
Continue to focus on ODM model…
While OEM sales continue to be a major source of DTL revenue (78% of
FY17 revenue), the company has gradually increased the proportion of
ODM manufacturing from 14% in FY13 to 22% in FY17. As an ODM, DTL
controls the entire manufacturing cycle of a product from the initial stage
of designing and is responsible for all aspects of manufacturing, including
planning & sourcing of raw materials and components. Under ODM, DTL
directly sells products to companies who, in turn, distribute these
products under their own brand to end users. However, DTL provides
warranties with respect to defects in raw materials and workmanship
affecting the normal use of products. The ODM model of business
requires additional investment in R&D as well as working capital but
provides higher margins compared to the OEM mode. Currently, the
company is doing 100% ODM under the home appliances category
(mainly semi automatic washing machines) while ODM under lighting &

Page 5 ICICI Securities Ltd | Retail Equity Research
consumer electronics is at ~45% and ~12%, respectively. All three
segments witnessed an improvement in margin from FY15 to FY17.
Further, the company’s strategy to move towards the ODM model is to
service all major customer requirements across the industry and product
verticals. This would help the company improve the overall profitability
(as it will be able to control all aspects of the manufacturing cycle).
According to the management, there is a trend in certain product verticals
wherein regional and private labels have been gaining market share while
the ODM model allows DTL to service this market as well.
Exhibit 9: ODM business model key steps
Source: Company, ICICIdirect.com Research
Exhibit 10: Percentage of ODM revenue from business vertical
Product FY15 FY17
Home Appliacnes 100.0 100.0
Lighting products 12.4 45.4
Consumer Electronics 4.2 11.8
EBITDA margin*
Home Appliacnes 5.8 16.3
Lighting products 3.0 3.2
Consumer Electronics 1.7 3.0
Source: Company, ICICIdirect.com Research, * EBITDA margin calculated on total revenue (EMS+ODM)

Page 6 ICICI Securities Ltd | Retail Equity Research
Focus to increase service offerings through reverse logistics
The reverse logistics vertical is an extension of the company’s existing
skill set of manufacturing electronics. DTL acquired new customers in this
vertical as well as expanded the scope of offerings to its existing
customers. The company currently offers repair and refurbishment
services for STBs and repair of mobile phones, LCD and LED TVs, LED
panels, home theatres, printers, etc. With its focus on increasing expertise
as an end-to-end solutions provider, DTL plans to further expand reverse
logistics portfolio with support of its newly started R&D teams. For
example, DTL acquired technology for repair of LED panels of TVs and
mobile phones. As an extension of its value added services in the reverse
logistics vertical, it has also started spare parts management for a mobile
phone brand. We believe the reverse logistics vertical provides high
return on capital employed and has a high potential for growth. As per
Frost & Sullivan, average return rates in reverse logistics of electronics
items are: mobile phones (9%), set top box (16%), FPD TV (8%), washing
machines (8%) and computer peripherals (10%). Currently, DTL is
focused only on B2B reverse logistics and does not have consumer facing
service centres, which is in line with its strategy of building relationships
with brand owners and OEMs.
Exhibit 11: Reverse logistics not core competence of most OEMs, they outsource this completely
Source: Company, ICICIdirect.com Research
Exhibit 12: Strong revenue growth
2 3
18
39
63
0
10
20
30
40
50
60
70
FY13 FY14 FY15 FY16 FY17
(|
crore)
CAGR 126%
Source: Company, ICICIdirect.com, Research
Exhibit 13: Attractive EBITDA margin compared to total EBITDA margin
23
21
1918
20
0
5
10
15
20
25
FY13 FY14 FY15 FY16 FY17
(%
)
Source: Company, ICICIdirect.com, Research
Page 7 ICICI Securities Ltd | Retail Equity Research
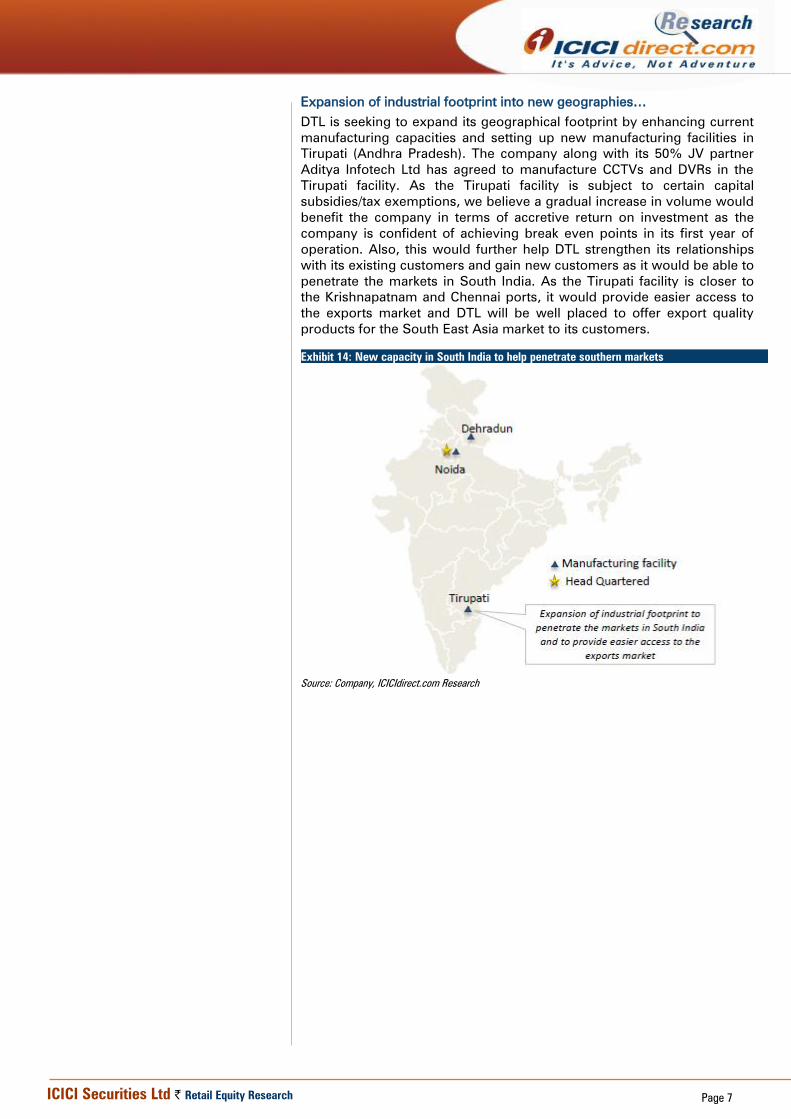
Expansion of industrial footprint into new geographies…
DTL is seeking to expand its geographical footprint by enhancing current
manufacturing capacities and setting up new manufacturing facilities in
Tirupati (Andhra Pradesh). The company along with its 50% JV partner
Aditya Infotech Ltd has agreed to manufacture CCTVs and DVRs in the
Tirupati facility. As the Tirupati facility is subject to certain capital
subsidies/tax exemptions, we believe a gradual increase in volume would
benefit the company in terms of accretive return on investment as the
company is confident of achieving break even points in its first year of
operation. Also, this would further help DTL strengthen its relationships
with its existing customers and gain new customers as it would be able to
penetrate the markets in South India. As the Tirupati facility is closer to
the Krishnapatnam and Chennai ports, it would provide easier access to
the exports market and DTL will be well placed to offer export quality
products for the South East Asia market to its customers.
Exhibit 14: New capacity in South India to help penetrate southern markets
Source: Company, ICICIdirect.com Research

Page 8 ICICI Securities Ltd | Retail Equity Research
Financial performance
At the consolidated level, the company recorded a revenue CAGR of 34%
mainly due to a sharp jump in sales of the mobile segment (from | 20
crore in FY16 to | 810 crore in FY17). Excluding the mobile segment, the
company has recorded revenue CAGR of 21%, led by sharp growth in
home appliances category (38% CAGR in FY13-17) and lighting products
(20% CAGR in FY13-17). However, the EBITDA margin remains volatile
owing to addition of low margin products and higher employee cost. DTL
recorded PAT CAGR of 78% in FY13-17 owing to sharp sales growth.
Lower capex requirement on assembling capacity has translated to higher
asset turnover, which, in turn, drives the return ratios of the company.
Exhibit 15: Revenues grow at 34% CAGR in FY13-17
766.9
1093.71201.3
1389.4
2456.8
0.0
500.0
1000.0
1500.0
2000.0
2500.0
3000.0
FY13 FY14 FY15 FY16 FY17
(|
crore)
CAGR 34%
Source: Company, ICICIdirect.com, Research
Exhibit 16: EBITDA margin trend highly dependent on product mix
20.126.0
32.2
58.7
90.7
2.62.4
2.7
4.2
3.7
0.0
20.0
40.0
60.0
80.0
100.0
FY13 FY14 FY15 FY16 FY17
(|
crore)
0.0
1.0
2.0
3.0
4.0
5.0
(%
)
EBITDA % margin
Source: Company, ICICIdirect.com, Research
Exhibit 17: PAT grows at 78% CAGR during FY13-17
5.0
13.511.9
42.6
50.4
0.0
10.0
20.0
30.0
40.0
50.0
60.0
FY13 FY14 FY15 FY16 FY17
(|
crore)
CAGR 78%
Source: Company, ICICIdirect.com, Research
Exhibit 18: Highest asset turnover drives return ratios
8.1
18.3
14.0
34.6
25.5
10.8
14.315.6
25.1
32.6
0.0
5.0
10.0
15.0
20.0
25.0
30.0
35.0
40.0
FY13 FY14 FY15 FY16 FY17
(%
)
RoE RoCE
Source: Company, ICICIdirect.com, Research
Page 9 ICICI Securities Ltd | Retail Equity Research
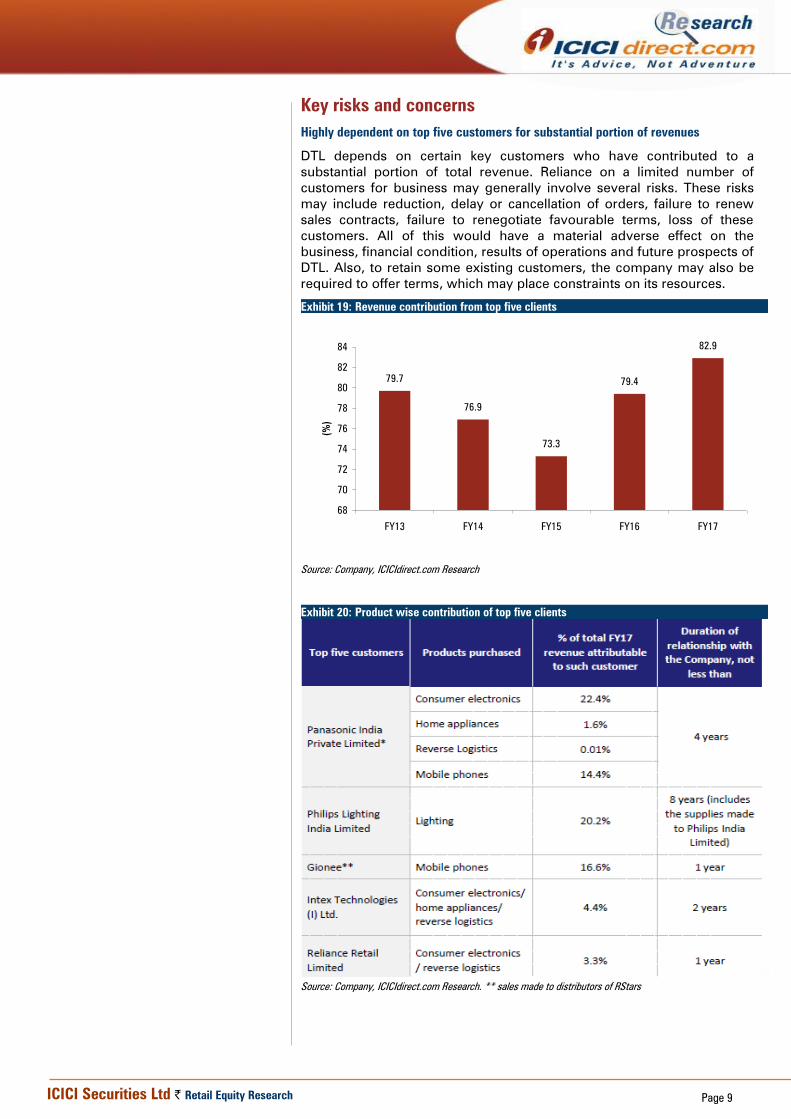
Key risks and concerns
Highly dependent on top five customers for substantial portion of revenues
DTL depends on certain key customers who have contributed to a
substantial portion of total revenue. Reliance on a limited number of
customers for business may generally involve several risks. These risks
may include reduction, delay or cancellation of orders, failure to renew
sales contracts, failure to renegotiate favourable terms, loss of these
customers. All of this would have a material adverse effect on the
business, financial condition, results of operations and future prospects of
DTL. Also, to retain some existing customers, the company may also be
required to offer terms, which may place constraints on its resources.
Exhibit 19: Revenue contribution from top five clients
79.7
76.9
73.3
79.4
82.9
68
70
72
74
76
78
80
82
84
FY13 FY14 FY15 FY16 FY17
(%
)
Source: Company, ICICIdirect.com Research
Exhibit 20: Product wise contribution of top five clients
Source: Company, ICICIdirect.com Research. ** sales made to distributors of RStars
Page 10 ICICI Securities Ltd | Retail Equity Research
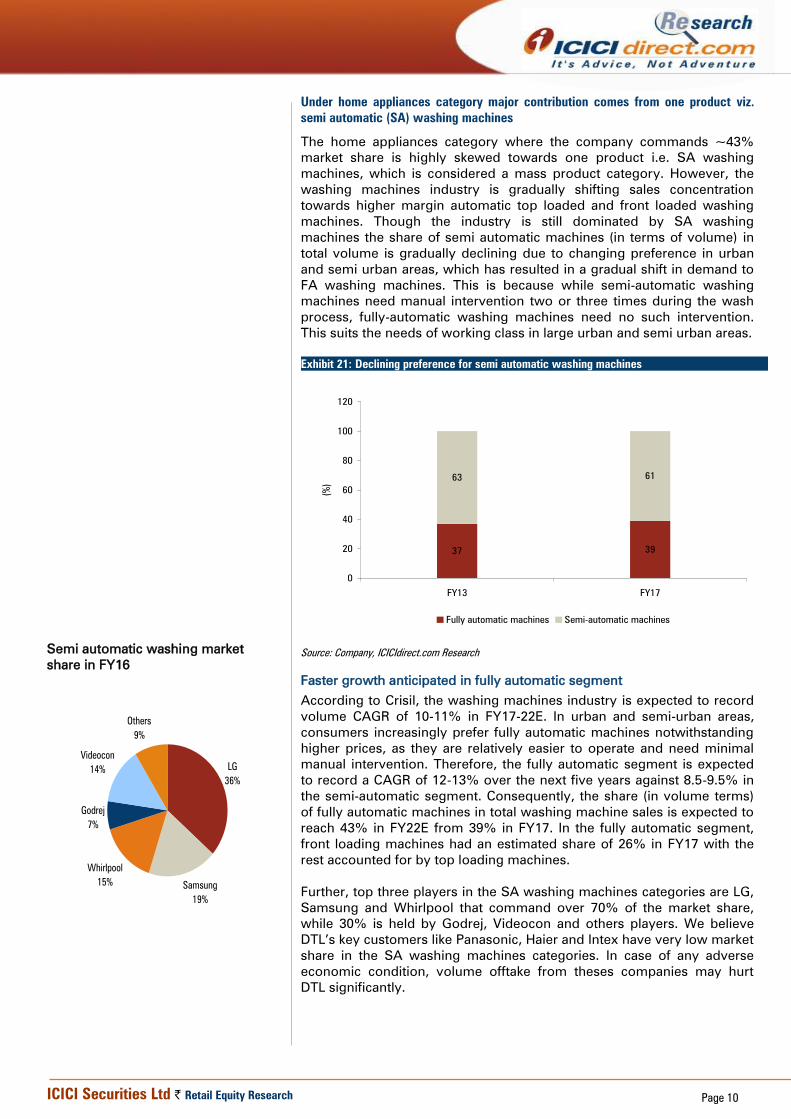
Under home appliances category major contribution comes from one product viz.
semi automatic (SA) washing machines
The home appliances category where the company commands ~43%
market share is highly skewed towards one product i.e. SA washing
machines, which is considered a mass product category. However, the
washing machines industry is gradually shifting sales concentration
towards higher margin automatic top loaded and front loaded washing
machines. Though the industry is still dominated by SA washing
machines the share of semi automatic machines (in terms of volume) in
total volume is gradually declining due to changing preference in urban
and semi urban areas, which has resulted in a gradual shift in demand to
FA washing machines. This is because while semi-automatic washing
machines need manual intervention two or three times during the wash
process, fully-automatic washing machines need no such intervention.
This suits the needs of working class in large urban and semi urban areas.
Exhibit 21: Declining preference for semi automatic washing machines
37 39
63 61
0
20
40
60
80
100
120
FY13 FY17
(%)
Fully automatic machines Semi-automatic machines
Source: Company, ICICIdirect.com Research
Faster growth anticipated in fully automatic segment
According to Crisil, the washing machines industry is expected to record
volume CAGR of 10-11% in FY17-22E. In urban and semi-urban areas,
consumers increasingly prefer fully automatic machines notwithstanding
higher prices, as they are relatively easier to operate and need minimal
manual intervention. Therefore, the fully automatic segment is expected
to record a CAGR of 12-13% over the next five years against 8.5-9.5% in
the semi-automatic segment. Consequently, the share (in volume terms)
of fully automatic machines in total washing machine sales is expected to
reach 43% in FY22E from 39% in FY17. In the fully automatic segment,
front loading machines had an estimated share of 26% in FY17 with the
rest accounted for by top loading machines.
Further, top three players in the SA washing machines categories are LG,
Samsung and Whirlpool that command over 70% of the market share,
while 30% is held by Godrej, Videocon and others players. We believe
DTL’s key customers like Panasonic, Haier and Intex have very low market
share in the SA washing machines categories. In case of any adverse
economic condition, volume offtake from theses companies may hurt
DTL significantly.
Others
9%
Videocon
14%
Godrej
7%
Whirlpool
15%Samsung
19%
LG
36%
Semi automatic washing market
share in FY16
Page 11 ICICI Securities Ltd | Retail Equity Research
Change in product mix may hurt EBITDA margin
Though companies have concentrated on increasing the ODM business
over the last five years, strong growth in mobile segment (that is purely
OEM) could further drag down EBITDA margin. DTL is already operating
at thin margin of 2-3%. Increase in concentration of low margin products
into sales would further hamper the quality of earnings.

Page 12 ICICI Securities Ltd | Retail Equity Research
Fairly valued at ~40x FY17 P/E
At the higher end of the IPO price band of | 1766, the stock is valued at
~40x FY17 P/E (post issue), which appears to be fairly valued considering
its presence in mass products categories, high dependency on a few
clients and low EBITDA margin profile. Additionally, increasing focus on
the mobile segment (EBITDA margin of 0.6%) would further dilute the
profit margin.
Page 13 ICICI Securities Ltd | Retail Equity Research
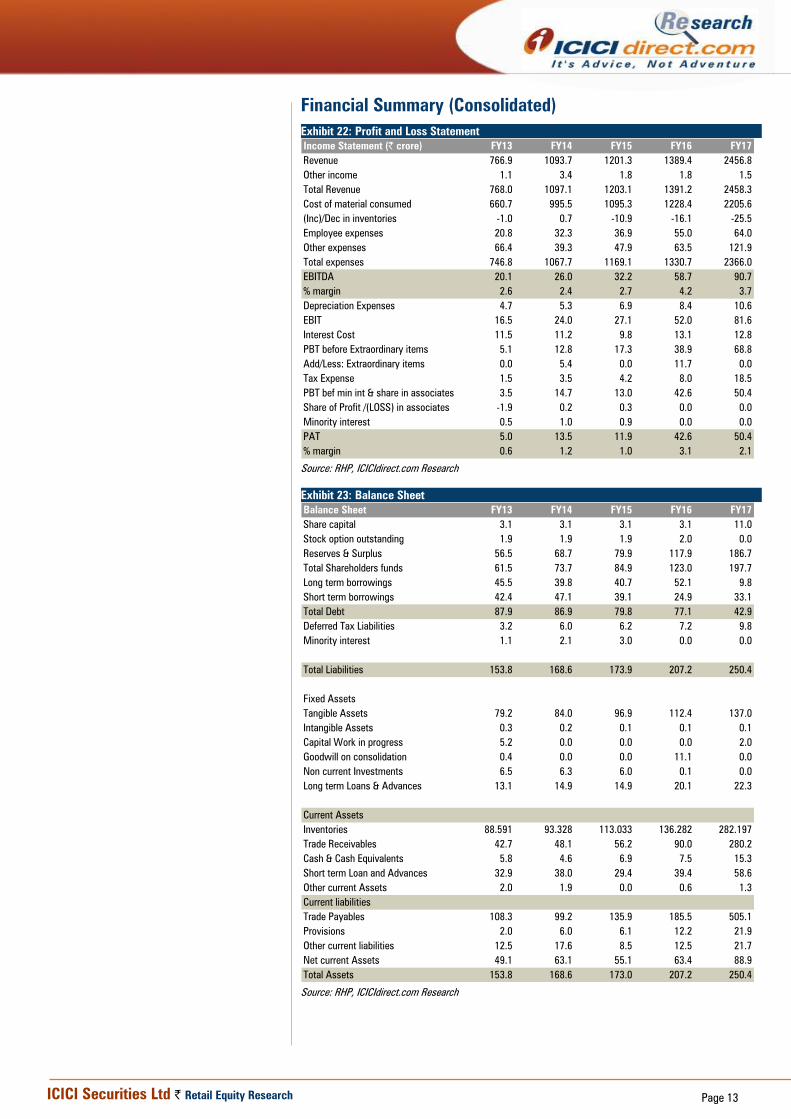
Financial Summary (Consolidated)
Exhibit 22: Profit and Loss Statement
Income Statement (| crore) FY13 FY14 FY15 FY16 FY17
Revenue 766.9 1093.7 1201.3 1389.4 2456.8
Other income 1.1 3.4 1.8 1.8 1.5
Total Revenue 768.0 1097.1 1203.1 1391.2 2458.3
Cost of material consumed 660.7 995.5 1095.3 1228.4 2205.6
(Inc)/Dec in inventories -1.0 0.7 -10.9 -16.1 -25.5
Employee expenses 20.8 32.3 36.9 55.0 64.0
Other expenses 66.4 39.3 47.9 63.5 121.9
Total expenses 746.8 1067.7 1169.1 1330.7 2366.0
EBITDA 20.1 26.0 32.2 58.7 90.7
% margin 2.6 2.4 2.7 4.2 3.7
Depreciation Expenses 4.7 5.3 6.9 8.4 10.6
EBIT 16.5 24.0 27.1 52.0 81.6
Interest Cost 11.5 11.2 9.8 13.1 12.8
PBT before Extraordinary items 5.1 12.8 17.3 38.9 68.8
Add/Less: Extraordinary items 0.0 5.4 0.0 11.7 0.0
Tax Expense 1.5 3.5 4.2 8.0 18.5
PBT bef min int & share in associates 3.5 14.7 13.0 42.6 50.4
Share of Profit /(LOSS) in associates -1.9 0.2 0.3 0.0 0.0
Minority interest 0.5 1.0 0.9 0.0 0.0
PAT 5.0 13.5 11.9 42.6 50.4
% margin 0.6 1.2 1.0 3.1 2.1
Source: RHP, ICICIdirect.com Research
Exhibit 23: Balance Sheet
Balance Sheet FY13 FY14 FY15 FY16 FY17
Share capital 3.1 3.1 3.1 3.1 11.0
Stock option outstanding 1.9 1.9 1.9 2.0 0.0
Reserves & Surplus 56.5 68.7 79.9 117.9 186.7
Total Shareholders funds 61.5 73.7 84.9 123.0 197.7
Long term borrowings 45.5 39.8 40.7 52.1 9.8
Short term borrowings 42.4 47.1 39.1 24.9 33.1
Total Debt 87.9 86.9 79.8 77.1 42.9
Deferred Tax Liabilities 3.2 6.0 6.2 7.2 9.8
Minority interest 1.1 2.1 3.0 0.0 0.0
Total Liabilities 153.8 168.6 173.9 207.2 250.4
Fixed Assets
Tangible Assets 79.2 84.0 96.9 112.4 137.0
Intangible Assets 0.3 0.2 0.1 0.1 0.1
Capital Work in progress 5.2 0.0 0.0 0.0 2.0
Goodwill on consolidation 0.4 0.0 0.0 11.1 0.0
Non current Investments 6.5 6.3 6.0 0.1 0.0
Long term Loans & Advances 13.1 14.9 14.9 20.1 22.3
Current Assets
Inventories 88.591 93.328 113.033 136.282 282.197
Trade Receivables 42.7 48.1 56.2 90.0 280.2
Cash & Cash Equivalents 5.8 4.6 6.9 7.5 15.3
Short term Loan and Advances 32.9 38.0 29.4 39.4 58.6
Other current Assets 2.0 1.9 0.0 0.6 1.3
Current liabilities
Trade Payables 108.3 99.2 135.9 185.5 505.1
Provisions 2.0 6.0 6.1 12.2 21.9
Other current liabilities 12.5 17.6 8.5 12.5 21.7
Net current Assets 49.1 63.1 55.1 63.4 88.9
Total Assets 153.8 168.6 173.0 207.2 250.4
Source: RHP, ICICIdirect.com Research
Page 14 ICICI Securities Ltd | Retail Equity Research
RATING RATIONALE
ICICIdirect.com endeavours to provide objective opinions and recommendations. ICICIdirect.com assigns ratings to its
stocks according to their notional target price vs. current market price and then categorises them as Strong Buy, Buy, Hold
and Sell. The performance horizon is two years unless specified and the notional target price is defined as the analysts'
valuation for a stock.
Strong Buy: >15%/20% for large caps/midcaps, respectively, with high conviction;
Buy: >10%/15% for large caps/midcaps, respectively;
Hold: Up to +/-10%;
Sell: -10% or more;
Pankaj Pandey Head – Research [email protected]
ICICIdirect.com Research Desk,
ICICI Securities Limited,
1st Floor, Akruti Trade Centre,
Road No 7, MIDC,
Andheri (East)
Mumbai – 400 093
Page 15 ICICI Securities Ltd | Retail Equity Research
ANALYST CERTIFICATION
We /I, Sanjay Manyal, MBA (Finance) and Hitesh Taunk, MBA (Finance) Research Analysts, authors and the names subscribed to this report, hereby certify that all of the views expressed in this research
report accurately reflect our views about the subject issuer(s) or securities. We also certify that no part of our compensation was, is, or will be directly or indirectly related to the specific recommendation(s)
or view(s) in this report.
Terms & conditions and other disclosures:
ICICI Securities Limited (ICICI Securities) is a full-service, integrated investment banking and is, inter alia, engaged in the business of stock brokering and distribution of financial products. ICICI Securities
Limited is a Sebi registered Research Analyst with Sebi Registration Number – INH000000990. ICICI Securities is a wholly-owned subsidiary of ICICI Bank which is India’s largest private sector bank and has
its various subsidiaries engaged in businesses of housing finance, asset management, life insurance, general insurance, venture capital fund management, etc. (“associates”), the details in respect of which
are available on www.icicibank.com.
ICICI Securities is one of the leading merchant bankers/ underwriters of securities and participate in virtually all securities trading markets in India. We and our associates might have investment banking
and other business relationship with a significant percentage of companies covered by our Investment Research Department. ICICI Securities generally prohibits its analysts, persons reporting to analysts
and their relatives from maintaining a financial interest in the securities or derivatives of any companies that the analysts cover.
The information and opinions in this report have been prepared by ICICI Securities and are subject to change without any notice. The report and information contained herein is strictly confidential and
meant solely for the selected recipient and may not be altered in any way, transmitted to, copied or distributed, in part or in whole, to any other person or to the media or reproduced in any form, without
prior written consent of ICICI Securities. While we would endeavour to update the information herein on a reasonable basis, ICICI Securities is under no obligation to update or keep the information current.
Also, there may be regulatory, compliance or other reasons that may prevent ICICI Securities from doing so. Non-rated securities indicate that rating on a particular security has been suspended
temporarily and such suspension is in compliance with applicable regulations and/or ICICI Securities policies, in circumstances where ICICI Securities might be acting in an advisory capacity to this
company, or in certain other circumstances.
This report is based on information obtained from public sources and sources believed to be reliable, but no independent verification has been made nor is its accuracy or completeness guaranteed. This
report and information herein is solely for informational purpose and shall not be used or considered as an offer document or solicitation of offer to buy or sell or subscribe for securities or other financial
instruments. Though disseminated to all the customers simultaneously, not all customers may receive this report at the same time. ICICI Securities will not treat recipients as customers by virtue of their
receiving this report. Nothing in this report constitutes investment, legal, accounting and tax advice or a representation that any investment or strategy is suitable or appropriate to your specific
circumstances. The securities discussed and opinions expressed in this report may not be suitable for all investors, who must make their own investment decisions, based on their own investment
objectives, financial positions and needs of specific recipient. This may not be taken in substitution for the exercise of independent judgment by any recipient. The recipient should independently evaluate
the investment risks. The value and return on investment may vary because of changes in interest rates, foreign exchange rates or any other reason. ICICI Securities accepts no liabilities whatsoever for any
loss or damage of any kind arising out of the use of this report. Past performance is not necessarily a guide to future performance. Investors are advised to see Risk Disclosure Document to understand the
risks associated before investing in the securities markets. Actual results may differ materially from those set forth in projections. Forward-looking statements are not predictions and may be subject to
change without notice.
ICICI Securities or its associates might have managed or co-managed public offering of securities for the subject company or might have been mandated by the subject company for any other assignment
in the past twelve months.
ICICI Securities or its associates might have received any compensation from the companies mentioned in the report during the period preceding twelve months from the date of this report for services in
respect of managing or co-managing public offerings, corporate finance, investment banking or merchant banking, brokerage services or other advisory service in a merger or specific transaction.
ICICI Securities or its associates might have received any compensation for products or services other than investment banking or merchant banking or brokerage services from the companies mentioned
in the report in the past twelve months.
ICICI Securities encourages independence in research report preparation and strives to minimize conflict in preparation of research report. ICICI Securities or its associates or its analysts did not receive any
compensation or other benefits from the companies mentioned in the report or third party in connection with preparation of the research report. Accordingly, neither ICICI Securities nor Research Analysts
and their relatives have any material conflict of interest at the time of publication of this report.
It is confirmed that Sanjay Manyal, MBA (Finance) and Hitesh Taunk, MBA (Finance) Research Analysts of this report have not received any compensation from the companies mentioned in the report in
the preceding twelve months.
Compensation of our Research Analysts is not based on any specific merchant banking, investment banking or brokerage service transactions.
ICICI Securities or its subsidiaries collectively or Research Analysts or their relatives do not own 1% or more of the equity securities of the Company mentioned in the report as of the last day of the month
preceding the publication of the research report.
Since associates of ICICI Securities are engaged in various financial service businesses, they might have financial interests or beneficial ownership in various companies including the subject
company/companies mentioned in this report.
It is confirmed that Sanjay Manyal, MBA (Finance) and Hitesh Taunk, MBA (Finance) Research Analysts do not serve as an officer, director or employee of the companies mentioned in the report.
ICICI Securities may have issued other reports that are inconsistent with and reach different conclusion from the information presented in this report.
Neither the Research Analysts nor ICICI Securities have been engaged in market making activity for the companies mentioned in the report.
We submit that no material disciplinary action has been taken on ICICI Securities by any Regulatory Authority impacting Equity Research Analysis activities.
This report is not directed or intended for distribution to, or use by, any person or entity who is a citizen or resident of or located in any locality, state, country or other jurisdiction, where such distribution,
publication, availability or use would be contrary to law, regulation or which would subject ICICI Securities and affiliates to any registration or licensing requirement within such jurisdiction. The securities
described herein may or may not be eligible for sale in all jurisdictions or to certain category of investors. Persons in whose possession this document may come are required to inform themselves of and
to observe such restriction