Embed Size (px)
Citation preview
Takemura et al. Earth, Planets and Space (2017) 69:38 DOI 10.1186/s40623-017-0625-3
LETTER
Sequence of deep-focus earthquakes beneath the Bonin Islands identified by the NIED nationwide dense seismic networks Hi-net and F-netShunsuke Takemura* , Tatsuhiko Saito and Katsuhiko Shiomi
Abstract
An M 6.8 (Mw 6.5) deep-focus earthquake occurred beneath the Bonin Islands at 21:18 (JST) on June 23, 2015. Observed high-frequency (>1 Hz) seismograms across Japan, which contain several sets of P- and S-wave arrivals for the 10 min after the origin time, indicate that moderate-to-large earthquakes occurred sequentially around Japan. Snapshots of the seismic energy propagation illustrate that after one deep-focus earthquake occurred beneath the Sea of Japan, two deep-focus earthquakes occurred sequentially after the first (Mw 6.5) event beneath the Bonin Islands in the next 4 min. The United States Geological Survey catalog includes three Bonin deep-focus earthquakes with similar hypocenter locations, but their estimated magnitudes are inconsistent with seismograms from across Japan. The maximum-amplitude patterns of the latter two earthquakes were similar to that of the first Bonin earth-quake, which indicates similar locations and mechanisms. Furthermore, based on the ratios of the S-wave amplitudes to that of the first event, the magnitudes of the latter events are estimated as M 6.5 ± 0.02 and M 5.8 ± 0.02, respec-tively. Three magnitude-6-class earthquakes occurred sequentially within 4 min in the Pacific slab at 480 km depth, where complex heterogeneities exist within the slab.
Keywords: Deep-focus earthquake, Earthquake sequence, High-frequency seismic wave, Izu–Bonin subduction zone
© The Author(s) 2017. This article is distributed under the terms of the Creative Commons Attribution 4.0 International License (http://creativecommons.org/licenses/by/4.0/), which permits unrestricted use, distribution, and reproduction in any medium, provided you give appropriate credit to the original author(s) and the source, provide a link to the Creative Commons license, and indicate if changes were made.
IntroductionIn Japan (Fig. 1), because two oceanic plates are subduct-ing, the seismic velocity structure of the region is com-plex and the seismicity is high. Therefore, to reveal the detailed characteristics of the seismicity and subsurface structure beneath the Japanese Islands, various seismic networks have been developed (e.g., Okada et al. 2004; Obara et al. 2005; Baba et al. 2013). Through the devel-opment of instruments and observation networks, detec-tion capabilities for small earthquakes have improved significantly (e.g., Obara et al. 2005; Shiomi et al. 2009). Nevertheless, misdetection of earthquakes occurs fre-quently because of emergent arrivals, overlapping larger events, earthquake swarms, and low signal-to-noise
ratios (for smaller or distant earthquakes). To overcome these difficulties, several methods, such as the matched filter technique (e.g., Kato et al. 2012) and high-frequency seismogram analysis (e.g., Miyazawa 2011; Sawazaki and Enescu 2014), have been developed. These techniques enable detection of smaller, local earthquakes hidden in noisy waveforms or the overlapping coda waves of larger earthquakes, and the catalogs updated with the resulting newly detected events have revealed new insights into earthquake occurrences, such as triggering mechanisms, migration processes, and stress changes after large earth-quakes. These approaches can be applied to regional-scale seismic arrays in a specific target region.
At 21:18 (JST) on June 23, 2015, an M 6.8 (Mw 6.5) deep-focus earthquake (focal sphere shown in Fig. 1a) occurred beneath the Ogasawara (Bonin) Islands, where high seismicity of deep-focus earthquakes is caused by the subduction of the Pacific slab along the Izu–Bonin
Open Access
*Correspondence: [email protected] National Research Institute for Earth Science and Disaster Resilience, 3-1 Tennodai, Tsukuba, Ibaraki 305-0006, Japan
Page 2 of 10Takemura et al. Earth, Planets and Space (2017) 69:38
arc (Fig. 1b, c). A deep-focus earthquake is defined as an earthquake with a hypocenter depth greater than 300 km (summarized in Frohlich 2010). The observed continu-ous waveform records of Hi-net, which is high-sensitivity seismograph network operated by the National Research Institute for Earth Science and Disaster Resilience (NIED) (Okada et al. 2004), contain several sets of P- and S-wave
arrivals with fast apparent velocities (approximately 10.5 and 6 km/s, respectively) for the 10 min following the earthquake origin time (Fig. 2a). These data indicate that several moderate-to-large deep-focus earthquakes, which may have had magnitudes smaller than that of the Mw 6.5 event, occurred sequentially around Japan. However, the signals of these events were considerably contaminated
136˚E 138˚E 140˚E 142˚E 144˚E26˚N
28˚N
30˚N
32˚N
Izu−
Boni
n tre
nch
Nankai trough
480 km, Mw 6.5
100 200 300 400 500 600 700
Source Depth [km]
0
1
2
3
4
5
6
7
8
9
10
Bat
hym
etric
dep
th [k
m]
130˚E 135˚E 140˚E 145˚E
30˚N
35˚N
40˚N
45˚N
Japa
n tre
nch
Izu−
Boni
n tre
nch
Sagami trough
Nankai trough
Boni
n Is
land
sHonshu
Hokkaido
Kyushu
Mw 6.5
F-netHi-net
a b
c
J F M A M J J A S O N D J F M A M J J A S O N D2014 2015
N = 422
2
3
4
5
6
7
8
9
Mag
nitu
de
0
50
100
150
200
250
300
350
400
Cum
ulat
ive
num
ber
2010 2011 2012 2013 2014 2015
N = 1344
100
200
300
400
500
600
700
Sou
rce
dept
h [k
m]
2
3
4
5
6
7
8
9
Mag
nitu
de
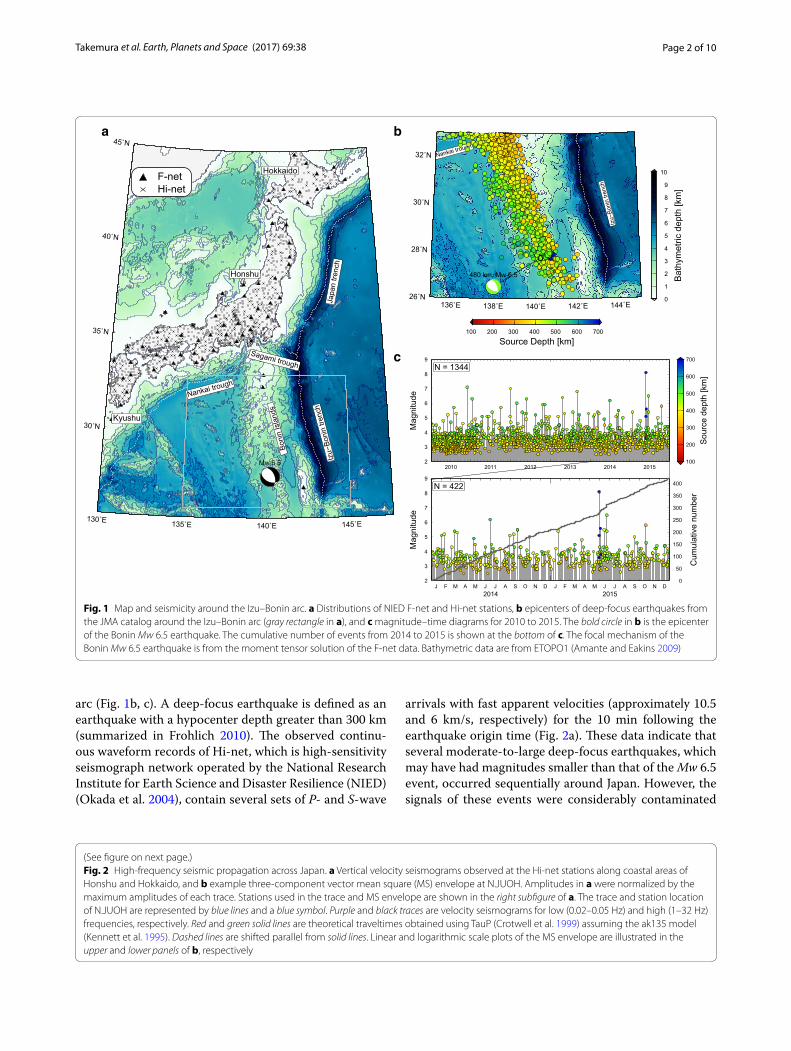
Fig. 1 Map and seismicity around the Izu–Bonin arc. a Distributions of NIED F-net and Hi-net stations, b epicenters of deep-focus earthquakes from the JMA catalog around the Izu–Bonin arc (gray rectangle in a), and c magnitude–time diagrams for 2010 to 2015. The bold circle in b is the epicenter of the Bonin Mw 6.5 earthquake. The cumulative number of events from 2014 to 2015 is shown at the bottom of c. The focal mechanism of the Bonin Mw 6.5 earthquake is from the moment tensor solution of the F-net data. Bathymetric data are from ETOPO1 (Amante and Eakins 2009)
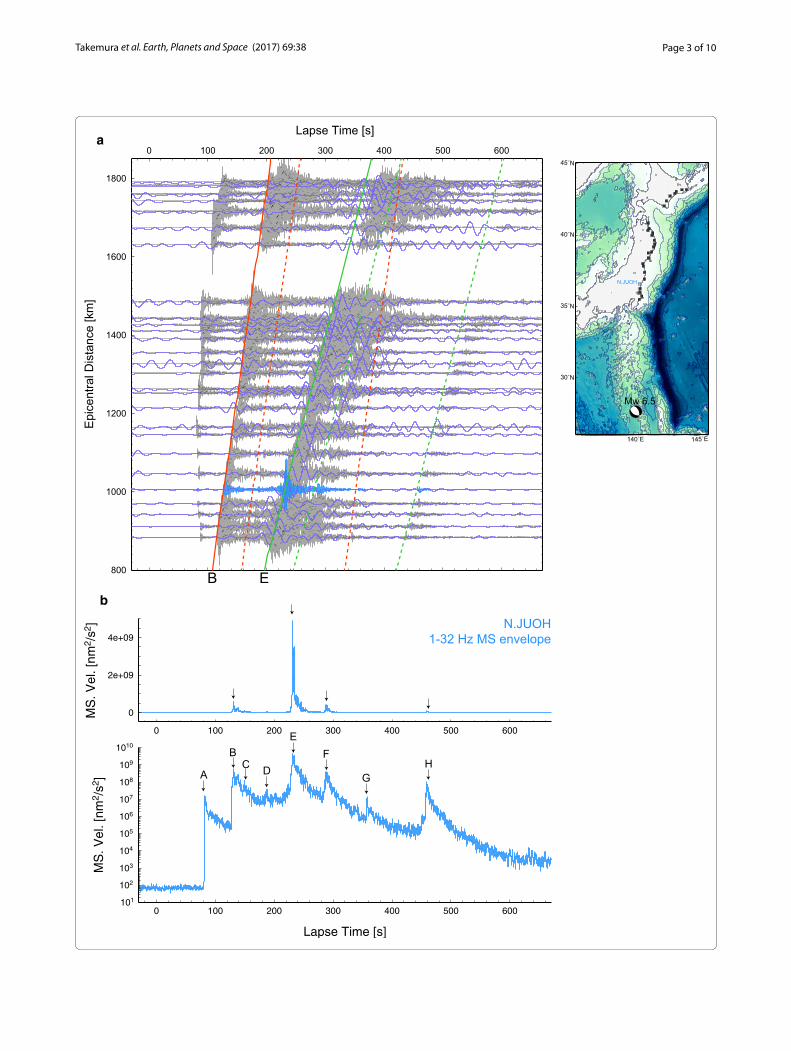
(See figure on next page.) Fig. 2 High-frequency seismic propagation across Japan. a Vertical velocity seismograms observed at the Hi-net stations along coastal areas of Honshu and Hokkaido, and b example three-component vector mean square (MS) envelope at N.JUOH. Amplitudes in a were normalized by the maximum amplitudes of each trace. Stations used in the trace and MS envelope are shown in the right subfigure of a. The trace and station location of N.JUOH are represented by blue lines and a blue symbol. Purple and black traces are velocity seismograms for low (0.02–0.05 Hz) and high (1–32 Hz) frequencies, respectively. Red and green solid lines are theoretical traveltimes obtained using TauP (Crotwell et al. 1999) assuming the ak135 model (Kennett et al. 1995). Dashed lines are shifted parallel from solid lines. Linear and logarithmic scale plots of the MS envelope are illustrated in the upper and lower panels of b, respectively
Page 3 of 10Takemura et al. Earth, Planets and Space (2017) 69:38
a
b
101
102
103
104
105
106
107
108
109
1010
MS
. Vel
. [nm
2 /s2 ]
0 100 200 300 400 500 600
Lapse Time [s]
0
2e+09
4e+09
MS
. Vel
. [nm
2 /s2 ]
0 100 200 300 400 500 600
N.JUOH1-32 Hz MS envelope
B
AC D
EF
GH
140˚E 145˚E
30˚N
35˚N
40˚N
45˚N
N.JUOH
Mw 6.5
800
1000
1200
1400
1600
1800
Epi
cent
ral D
ista
nce
[km
]
0 100 200 300 400 500 600
Lapse Time [s]
B E
Page 4 of 10Takemura et al. Earth, Planets and Space (2017) 69:38
by coda waves of the largest event. In this situation, it is difficult to determine the number of subsequent events and to estimate the magnitude of each event precisely. Although the unified hypocenter catalog provided by the Japan Meteorological Agency (JMA) includes three deep-focus earthquakes, including the Mw 6.5 event, we expect that more earthquakes may have occurred. The catalog of the United States Geological Survey, National Earthquake Information Center (USGS-NEIC) includes one deep-focus earthquake beneath the Sea of Japan and a sequence of three deep-focus earthquakes with simi-lar hypocenter locations beneath the Bonin Islands, but the estimated magnitudes of the Bonin earthquakes are inconsistent with seismogram data from across Japan (Fig. 2). Earthquake magnitude data are necessary for evaluating seismicity and are also important for estimat-ing stress accumulation within the subducting slab. To investigate the details of the sequential occurrence of earthquakes around Japan, we revisited this earthquake sequence by analyzing high-frequency seismograms and the maximum-amplitude patterns detected by nation-wide seismic networks across Japan.
Observed seismic energy propagation during deep‑focus earthquakesFigure 2a shows vertical velocity seismograms for fre-quencies of 0.02–0.05 Hz (purple line) and 1–32 Hz (black line) recorded at Hi-net stations located near the Pacific coasts of Honshu and Hokkaido. Solid red and blue lines indicate the theoretical traveltimes of P- and S-waves, respectively. In the low-frequency seis-mograms, which are typically used in moment tensor analysis, a set of P- and S-wave propagations during the Mw 6.5 earthquake was observed, and we could not confirm occurrence of other earthquakes. However, observed high-frequency P- and S-wave seismograms showed spindle-shaped seismogram envelopes with delay of peaks and long-duration coda waves caused by the waveguide effect within the heterogeneous Pacific slab (e.g., Furumura and Kennett 2005; Takemura et al. 2016). Slight delays of P- and S-wave arrivals, which were caused by the low-velocity anomaly (Kita et al. 2010), were recorded in the Hokkaido region. In the high-fre-quency seismograms, coherent signals aside from those of the Mw 6.5 earthquake appear several times. Some of these signals (shown as dashed lines, parallel shifted from the solid lines) show apparent velocities similar to those of the P- and S-waves of the Mw 6.5 earthquake.
To investigate the sets of high-frequency P- and S-wave propagations, we calculated mean square (MS) seis-mogram envelopes of the sum of the three-component filtered seismograms, for frequencies of 1–32 Hz. An example MS envelope recorded at N.JUOH is shown in
Fig. 2b. Although the typical coda amplitude during a sin-gle earthquake decays smoothly and monotonically with elapsed time (summarized in Sato et al. 2012, Ch. 2–3), the coda amplitude at N.JUOH does not show monotonic decay, but instead shows several sudden increases in amplitude within the coda envelope. Eight seismic phases can easily be identified in the logarithmic MS envelope (bottom of Fig. 2b) that are not apparent in a linear plot (upper part of Fig. 2b). Logarithmic plots of the high-frequency MS envelope enable detection of small earth-quakes hidden in the coda waves of larger earthquakes. The time intervals and amplitude ratios for the phase pairs B–E, D–F, and G–H are very similar, which indi-cates the occurrence of a sequence of large-to-moderate earthquakes at similar hypocenter locations. We note that phases B and E, respectively, represent the P- and S-waves during the Bonin Mw 6.5 earthquake.
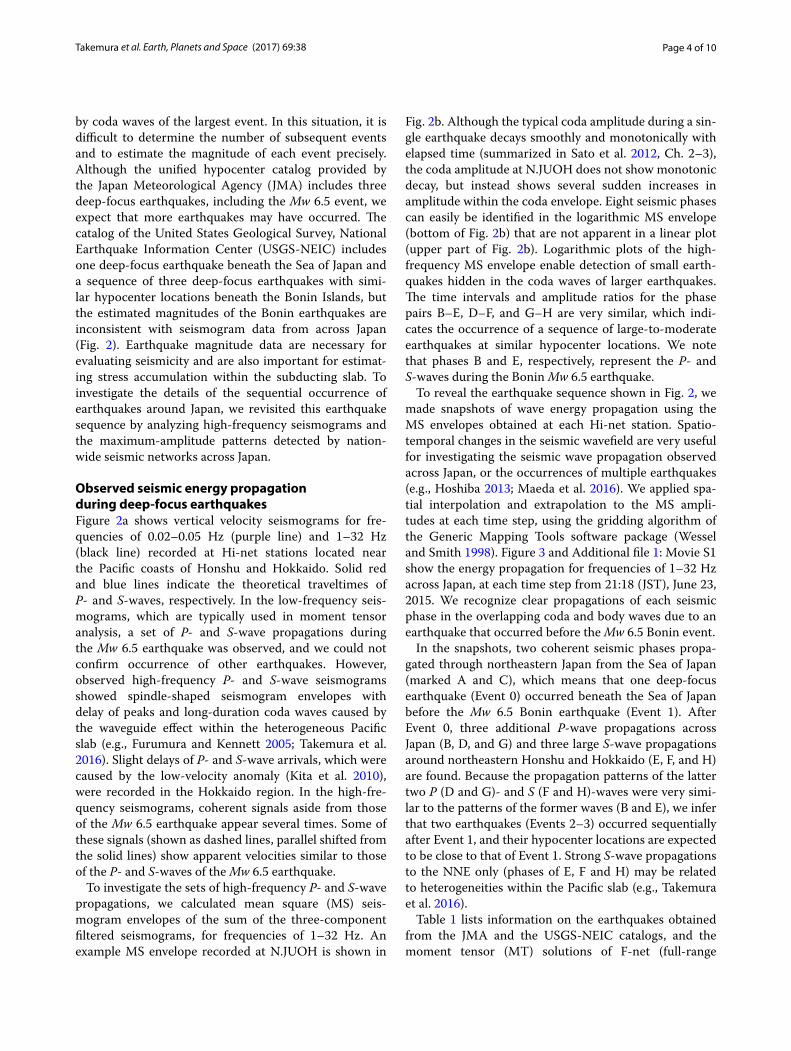
To reveal the earthquake sequence shown in Fig. 2, we made snapshots of wave energy propagation using the MS envelopes obtained at each Hi-net station. Spatio-temporal changes in the seismic wavefield are very useful for investigating the seismic wave propagation observed across Japan, or the occurrences of multiple earthquakes (e.g., Hoshiba 2013; Maeda et al. 2016). We applied spa-tial interpolation and extrapolation to the MS ampli-tudes at each time step, using the gridding algorithm of the Generic Mapping Tools software package (Wessel and Smith 1998). Figure 3 and Additional file 1: Movie S1 show the energy propagation for frequencies of 1–32 Hz across Japan, at each time step from 21:18 (JST), June 23, 2015. We recognize clear propagations of each seismic phase in the overlapping coda and body waves due to an earthquake that occurred before the Mw 6.5 Bonin event.
In the snapshots, two coherent seismic phases propa-gated through northeastern Japan from the Sea of Japan (marked A and C), which means that one deep-focus earthquake (Event 0) occurred beneath the Sea of Japan before the Mw 6.5 Bonin earthquake (Event 1). After Event 0, three additional P-wave propagations across Japan (B, D, and G) and three large S-wave propagations around northeastern Honshu and Hokkaido (E, F, and H) are found. Because the propagation patterns of the latter two P (D and G)- and S (F and H)-waves were very simi-lar to the patterns of the former waves (B and E), we infer that two earthquakes (Events 2–3) occurred sequentially after Event 1, and their hypocenter locations are expected to be close to that of Event 1. Strong S-wave propagations to the NNE only (phases of E, F and H) may be related to heterogeneities within the Pacific slab (e.g., Takemura et al. 2016).
Table 1 lists information on the earthquakes obtained from the JMA and the USGS-NEIC catalogs, and the moment tensor (MT) solutions of F-net (full-range
Page 5 of 10Takemura et al. Earth, Planets and Space (2017) 69:38
130E̊ 135˚E 140˚E 145E̊30̊ N
35N̊
40N̊
45˚N
Time : 110 s
130E̊ 135˚E 140˚E 145E̊30̊ N
35N̊
40N̊
45˚N
Time : 160 s
130E̊ 135˚E 140˚E 145E̊30̊ N
35N̊
40N̊
45˚N
Time : 180 s
130E̊ 135˚E 140˚E 145E̊30̊ N
35N̊
40N̊
45˚N
Time : 220 s
130E̊ 135˚E 140˚E 145E̊30̊ N
35N̊
40N̊
45˚N
Time : 260 s
130E̊ 135˚E 140˚E 145E̊30̊ N
35N̊
40N̊
45˚N
Time : 315 s
130E̊ 135˚E 140˚E 145E̊30̊ N
35N̊
40N̊
45˚N
Time : 390 s
130E̊ 135˚E 140˚E 145E̊30̊ N
35N̊
40N̊
45˚N
4
5
6
7
8
9
Log 1
0(MS
. Am
p.)
Time : 490 s
D
B
A
C
BB
E
GH
E
F
Fig. 3 Snapshots of seismic energy propagation derived from MS envelopes at the Hi-net stations. Marks A–H in each subfigure are the seismic phases corresponding to the MS envelope in Fig. 2b. Dashed lines represent isodistance lines from the epicenter of the Bonin Mw 6.5 earthquake with intervals of 200 km
Page 6 of 10Takemura et al. Earth, Planets and Space (2017) 69:38
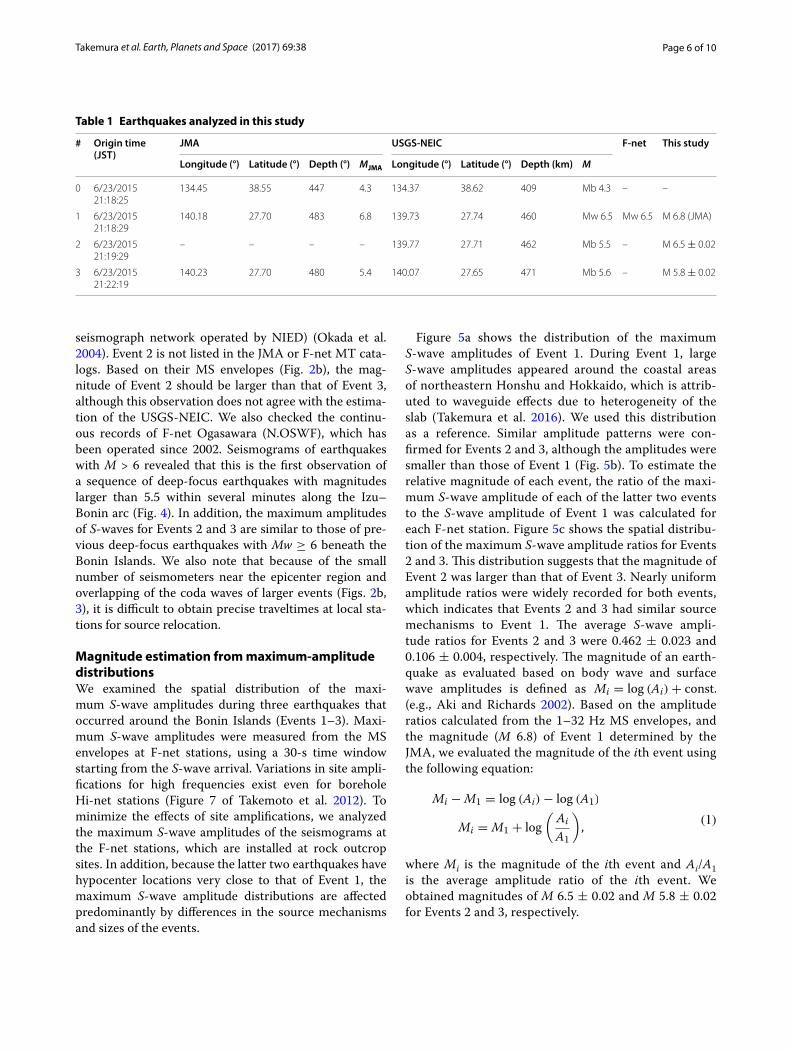
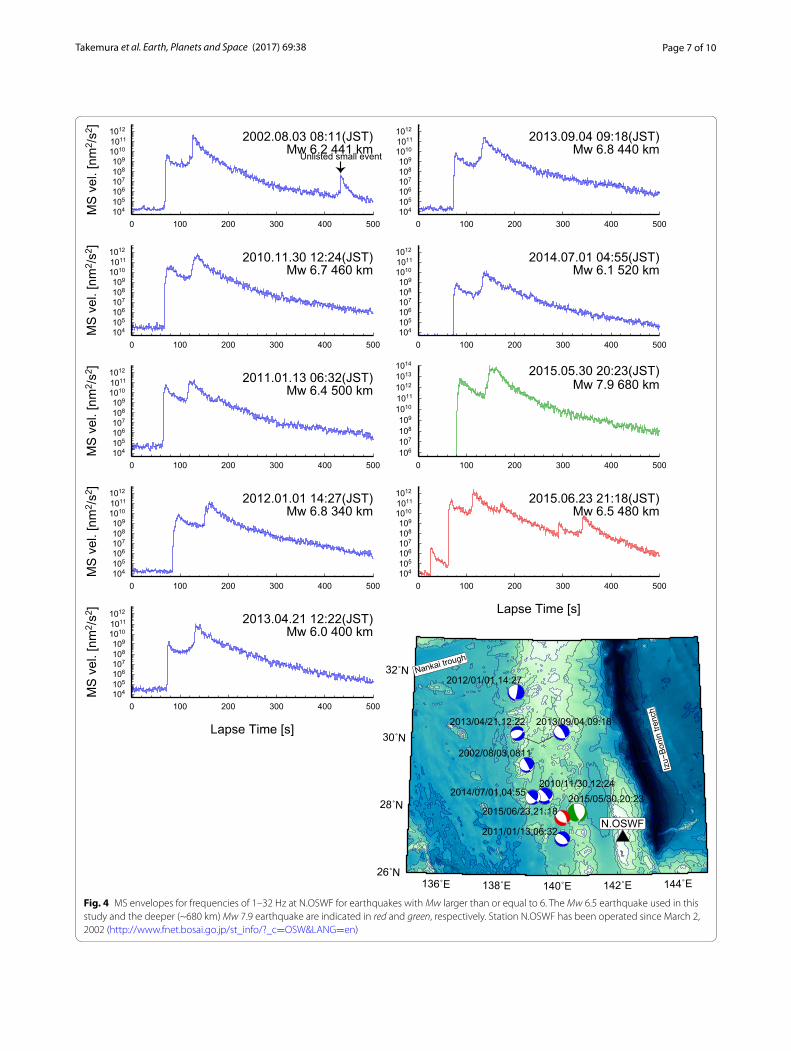
seismograph network operated by NIED) (Okada et al. 2004). Event 2 is not listed in the JMA or F-net MT cata-logs. Based on their MS envelopes (Fig. 2b), the mag-nitude of Event 2 should be larger than that of Event 3, although this observation does not agree with the estima-tion of the USGS-NEIC. We also checked the continu-ous records of F-net Ogasawara (N.OSWF), which has been operated since 2002. Seismograms of earthquakes with M > 6 revealed that this is the first observation of a sequence of deep-focus earthquakes with magnitudes larger than 5.5 within several minutes along the Izu–Bonin arc (Fig. 4). In addition, the maximum amplitudes of S-waves for Events 2 and 3 are similar to those of pre-vious deep-focus earthquakes with Mw ≥ 6 beneath the Bonin Islands. We also note that because of the small number of seismometers near the epicenter region and overlapping of the coda waves of larger events (Figs. 2b, 3), it is difficult to obtain precise traveltimes at local sta-tions for source relocation.
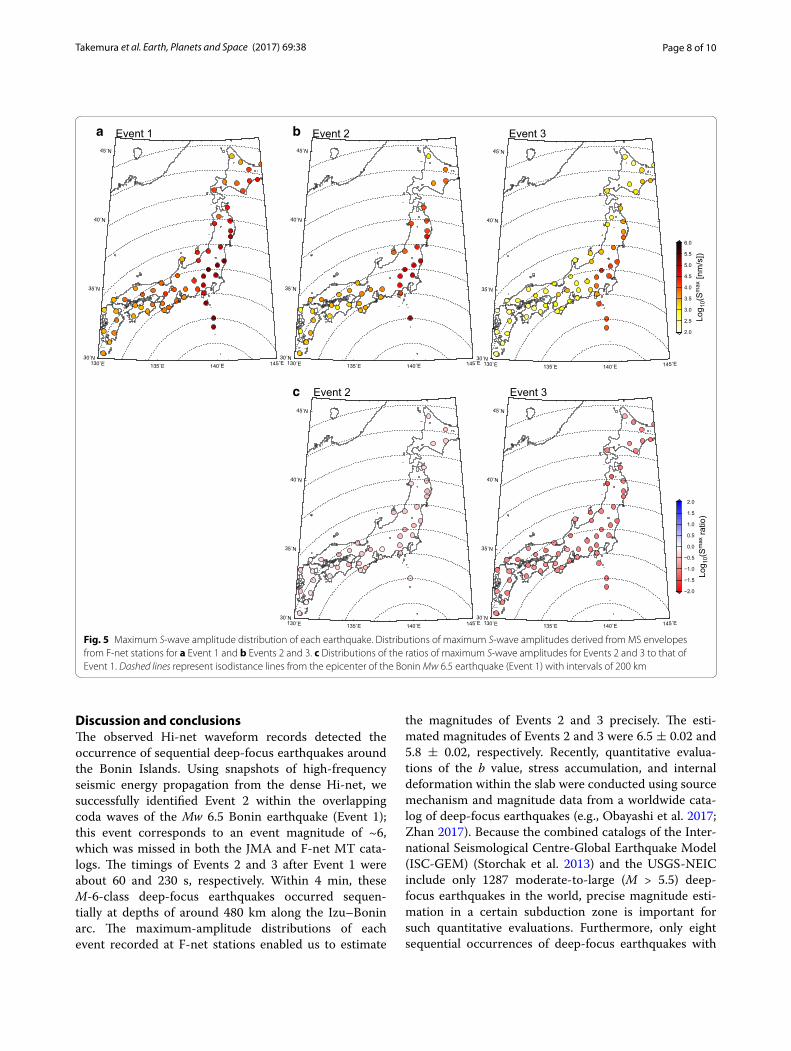
Magnitude estimation from maximum‑amplitude distributionsWe examined the spatial distribution of the maxi-mum S-wave amplitudes during three earthquakes that occurred around the Bonin Islands (Events 1–3). Maxi-mum S-wave amplitudes were measured from the MS envelopes at F-net stations, using a 30-s time window starting from the S-wave arrival. Variations in site ampli-fications for high frequencies exist even for borehole Hi-net stations (Figure 7 of Takemoto et al. 2012). To minimize the effects of site amplifications, we analyzed the maximum S-wave amplitudes of the seismograms at the F-net stations, which are installed at rock outcrop sites. In addition, because the latter two earthquakes have hypocenter locations very close to that of Event 1, the maximum S-wave amplitude distributions are affected predominantly by differences in the source mechanisms and sizes of the events.
Figure 5a shows the distribution of the maximum S-wave amplitudes of Event 1. During Event 1, large S-wave amplitudes appeared around the coastal areas of northeastern Honshu and Hokkaido, which is attrib-uted to waveguide effects due to heterogeneity of the slab (Takemura et al. 2016). We used this distribution as a reference. Similar amplitude patterns were con-firmed for Events 2 and 3, although the amplitudes were smaller than those of Event 1 (Fig. 5b). To estimate the relative magnitude of each event, the ratio of the maxi-mum S-wave amplitude of each of the latter two events to the S-wave amplitude of Event 1 was calculated for each F-net station. Figure 5c shows the spatial distribu-tion of the maximum S-wave amplitude ratios for Events 2 and 3. This distribution suggests that the magnitude of Event 2 was larger than that of Event 3. Nearly uniform amplitude ratios were widely recorded for both events, which indicates that Events 2 and 3 had similar source mechanisms to Event 1. The average S-wave ampli-tude ratios for Events 2 and 3 were 0.462 ± 0.023 and 0.106 ± 0.004, respectively. The magnitude of an earth-quake as evaluated based on body wave and surface wave amplitudes is defined as Mi = log (Ai)+ const. (e.g., Aki and Richards 2002). Based on the amplitude ratios calculated from the 1–32 Hz MS envelopes, and the magnitude (M 6.8) of Event 1 determined by the JMA, we evaluated the magnitude of the ith event using the following equation:
where Mi is the magnitude of the ith event and Ai/A1 is the average amplitude ratio of the ith event. We obtained magnitudes of M 6.5 ± 0.02 and M 5.8 ± 0.02 for Events 2 and 3, respectively.
(1)
Mi −M1 = log (Ai)− log (A1)
Mi = M1 + log
(
Ai
A1
)
,
Table 1 Earthquakes analyzed in this study
# Origin time (JST)
JMA USGS-NEIC F-net This study
Longitude (°) Latitude (°) Depth (°) MJMA Longitude (°) Latitude (°) Depth (km) M
0 6/23/201521:18:25
134.45 38.55 447 4.3 134.37 38.62 409 Mb 4.3 – –
1 6/23/201521:18:29
140.18 27.70 483 6.8 139.73 27.74 460 Mw 6.5 Mw 6.5 M 6.8 (JMA)
2 6/23/201521:19:29
– – – – 139.77 27.71 462 Mb 5.5 – M 6.5 ± 0.02
3 6/23/201521:22:19
140.23 27.70 480 5.4 140.07 27.65 471 Mb 5.6 – M 5.8 ± 0.02
Page 7 of 10Takemura et al. Earth, Planets and Space (2017) 69:38
104105106107108109
101010111012
0 100 200 300 400 500
Lapse Time [s]
2015.06.23 21:18(JST)Mw 6.5 480 km
106107108109
10101011101210131014
0 100 200 300 400 500
2015.05.30 20:23(JST)Mw 7.9 680 km
104105106107108109
101010111012
0 100 200 300 400 500
2014.07.01 04:55(JST)Mw 6.1 520 km
104105106107108109
101010111012
0 100 200 300 400 500
2013.09.04 09:18(JST)Mw 6.8 440 km
104105106107108109
101010111012
MS
vel
. [nm
2 /s2 ]
0 100 200 300 400 500
Lapse Time [s]
2013.04.21 12:22(JST)Mw 6.0 400 km
104105106107108109
101010111012
MS
vel
. [nm
2 /s2 ]
0 100 200 300 400 500
2012.01.01 14:27(JST)Mw 6.8 340 km
104105106107108109
101010111012
MS
vel
. [nm
2 /s2 ]
0 100 200 300 400 500
2011.01.13 06:32(JST)Mw 6.4 500 km
104105106107108109
101010111012
MS
vel
. [nm
2 /s2 ]
0 100 200 300 400 500
2010.11.30 12:24(JST)Mw 6.7 460 km
104105106107108109
101010111012
MS
vel
. [nm
2 /s2 ]
0 100 200 300 400 500
2002.08.03 08:11(JST)Mw 6.2 441 km
136˚E 138˚E 140˚E 142˚E 144˚E26˚N
28˚N
30˚N
32˚NIz
u−Bo
nin
trenc
h
Nankai trough
N.OSWF
2002/08/03,0811
2010/11/30,12:24
2011/01/13,06:32
2012/01/01,14:27
2013/04/21,12:22 2013/09/04,09:18
2014/07/01,04:552015/05/30,20:23
2015/06/23,21:18
Unlisted small event
Fig. 4 MS envelopes for frequencies of 1–32 Hz at N.OSWF for earthquakes with Mw larger than or equal to 6. The Mw 6.5 earthquake used in this study and the deeper (~680 km) Mw 7.9 earthquake are indicated in red and green, respectively. Station N.OSWF has been operated since March 2, 2002 (http://www.fnet.bosai.go.jp/st_info/?_c=OSW&LANG=en)
Page 8 of 10Takemura et al. Earth, Planets and Space (2017) 69:38
Discussion and conclusionsThe observed Hi-net waveform records detected the occurrence of sequential deep-focus earthquakes around the Bonin Islands. Using snapshots of high-frequency seismic energy propagation from the dense Hi-net, we successfully identified Event 2 within the overlapping coda waves of the Mw 6.5 Bonin earthquake (Event 1); this event corresponds to an event magnitude of ~6, which was missed in both the JMA and F-net MT cata-logs. The timings of Events 2 and 3 after Event 1 were about 60 and 230 s, respectively. Within 4 min, these M-6-class deep-focus earthquakes occurred sequen-tially at depths of around 480 km along the Izu–Bonin arc. The maximum-amplitude distributions of each event recorded at F-net stations enabled us to estimate
the magnitudes of Events 2 and 3 precisely. The esti-mated magnitudes of Events 2 and 3 were 6.5 ± 0.02 and 5.8 ± 0.02, respectively. Recently, quantitative evalua-tions of the b value, stress accumulation, and internal deformation within the slab were conducted using source mechanism and magnitude data from a worldwide cata-log of deep-focus earthquakes (e.g., Obayashi et al. 2017; Zhan 2017). Because the combined catalogs of the Inter-national Seismological Centre-Global Earthquake Model (ISC-GEM) (Storchak et al. 2013) and the USGS-NEIC include only 1287 moderate-to-large (M > 5.5) deep-focus earthquakes in the world, precise magnitude esti-mation in a certain subduction zone is important for such quantitative evaluations. Furthermore, only eight sequential occurrences of deep-focus earthquakes with
130˚E 135˚E 140˚E 145˚E30˚N
35˚N
40˚N
45˚N
130˚E 135˚E 140˚E 145˚E30˚N
35˚N
40˚N
45˚N
−2.0
−1.5
−1.0
−0.5
0.0
0.5
1.0
1.5
2.0
Log 1
0(S
max
ratio
)
Event 2 Event 3
a b
c
Event 2 Event 3Event 1
130˚E 135˚E 140˚E 145˚E30˚N
35˚N
40˚N
45˚N
2.0
2.5
3.0
3.5
4.0
4.5
5.0
5.5
6.0
Log 1
0(S
max
[nm
/s])
130˚E 135˚E 140˚E 145˚E30˚N
35˚N
40˚N
45˚N
130˚E 135˚E 140˚E 145˚E30˚N
35˚N
40˚N
45˚N
Fig. 5 Maximum S-wave amplitude distribution of each earthquake. Distributions of maximum S-wave amplitudes derived from MS envelopes from F-net stations for a Event 1 and b Events 2 and 3. c Distributions of the ratios of maximum S-wave amplitudes for Events 2 and 3 to that of Event 1. Dashed lines represent isodistance lines from the epicenter of the Bonin Mw 6.5 earthquake (Event 1) with intervals of 200 km
Page 9 of 10Takemura et al. Earth, Planets and Space (2017) 69:38
M > 6 are listed in this catalog, and no sequence of three M-6-class deep-focus earthquakes has been listed.
According to the USGS catalog, the hypocenters of the target earthquakes show westward shifts of approxi-mately 40 km and slight deepening over the 4 min in which this sequence occurred. Assuming a rupture veloc-ity of 4 km/s, and a duration referred from the scaling relation (Figure 6.3 of Frohlich 2010), the spatial distri-bution of the rupture area associated with this sequence reaches 50 km in width, which corresponds well with the horizontal width of the metastable olivine wedge (MOW) at this depth within the Pacific slab (e.g., Jian et al. 2008; Furumura et al. 2016). Therefore, the target earthquakes may be interpreted as caused by transformational fault-ing within the MOW.
The detected sequence of M-6-class deep-focus earth-quakes occurred after a large (Mw 7.9) deep-focus earth-quake that occurred on May 30, 2015, at a depth of 680 km beneath the same region (e.g., Takemura et al. 2016; Ye et al. 2016). Although the hypocenter depth of the Mw 7.9 earthquake was approximately 150 km deeper than those of typical deep-focus earthquakes (400–520 km), the seismicity of typical earthquakes increased after this earthquake (bottom subfigure of Fig. 1c). The relation between the detected earthquake sequence and the large (Mw 7.9) deep-focus earthquake, which may provide key information about the cause of deep-focus earthquakes and the complex subduction system along the Izu–Bonin arc, remains an open question.
The mechanisms of deep-focus earthquakes at depths of 400–500 km beneath the Izu–Bonin arc, including the detected earthquake sequence, are characterized by down-dip compression (e.g., Alpert et al. 2010). Recent seismic surveys have revealed the complex configuration and subduction system of the Pacific slab beneath the Izu–Bonin arc (e.g., Miller et al. 2004; Fukao and Obaya-hashi 2013; Wei et al. 2015; Porritt and Yoshioka 2016). Such lateral tension events are consistent with the pro-posed slab geometries (e.g., Fukao and Obayahashi 2013; Wei et al. 2015; Obayashi et al. 2017). The hypocenters of the earthquake sequence are located in the transition region from slab stagnation to penetration. Obayashi et al. (2017) evaluated the stress accumulation within the slab due to deep-focus earthquakes beneath the Bonin Islands and revealed that vertical compressional stress is accumulating in the bottom part of the subducting Pacific slab. They suggested that vertical compressional stress accumulation may have caused the Mw 7.9 Bonin earthquake and promoted slab penetration into the lower mantle (green line in Fig. 4). Referring to the receiver function of the F-net N.OSWF (see map in Fig. 4), Porritt and Yoshioka (2016) also proposed a complex folded slab model. The detected sequence of earthquakes occurred
just above the positive pulse of their receiver functions, which indicates a sudden change in the structural prop-erties of the slab near this depth. Although different interpretations have been proposed for the configuration and the subduction system of the Pacific slab around the Izu-Bonin arc, the subducting Pacific slab is expected to be complex at the depths in which the detected M-6-class sequence occurred. To provide better insight into the subduction process in this region and the causes of these deep-focus earthquakes, evaluating the detailed configu-ration of the subducting Pacific slab and the precise char-acteristics of the seismicity in this region should be high priorities for future study.
Authors’ contributionsST conducted the waveform analysis and drafted the manuscript. TS and KS participated in designing the study and interpreting the results, and helped draft the manuscript. All authors read and approved the final manuscript.
AcknowledgementsThe Hi-net and F-net waveform data, and the MT solutions of the F-net data, are available via the website of the National Research Institute for Earth Sci-ence and Disaster Resilience, Japan (last accessed May 30, 2016). The unified hypocenter catalog of the Japan Meteorological Agency (JMA) provides seis-micity data from 1923 to July 2015. We also used the Preliminary Determined Earthquake catalog provided by the JMA (last accessed May 30, 2016) and the earthquake catalog provided by the United States Geological Survey, National Earthquake Information Center (http://earthquake.usgs.gov/earthquakes/search/ (last accessed February 18, 2016). Bathymetric data are from ETOPO1 (Amante and Eakins 2009). The software by Maeda et al. (2011) for sensor response correction is available via Dr. Maeda’s website (https://github.com/takuto-maeda/hinet_decon/releases). Generic Mapping Tools (Wessel and Smith 1998) and Seismic Analysis Code (SAC) were used for drawing figures and signal processing, respectively. TauP (Crotwell et al. 1999) is available via the Incorporated Research Institute for Seismology website (http://ds.iris.edu/ds/nodes/dmc/software/downloads/taup/). We also thank Dr. S. Padhy, an anonymous reviewer, and the editor Dr. A. Nishizawa for their careful reading and constructive comments, which have helped improve the manuscript.
Competing interestsThe authors declare that they have no competing interests.
Received: 28 November 2016 Accepted: 2 March 2017
ReferencesAki K, Richards P (2002) Quantitative seismology, 2nd edn. University Science
Books, Freeman, San FranciscoAlpert LA, Becker TW, Bailey IW (2010) Global slab deformation and centroid
moment tensor constraints on viscosity. Geochem Geophys Geosyst 11:Q12006. doi:10.1029/2010GC003301
Amante C, Eakins BW (2009) ETOPO 1 arc-minute global relief model: procedure, data sources and analysis: NOAA technical memorandum
Additional file
Additional file 1: Movie S1.Snapshot movie of seismic energy propaga-tion derived from MS envelopes at Hi-net stations from 21:18 (JST) on June 23, 2015.
Page 10 of 10Takemura et al. Earth, Planets and Space (2017) 69:38
NESDIS NGDC-24. National Geophysical Data Center, NOAA. doi:10.7289/V5C8276M
Baba T, Takahashi N, Kaneda Y (2013) Near-filed tsunami amplification factors in the Kii Peninsula for Dense Oceanfloor Network for Earthquakes and Tsunamis (DONET). Mar Geophys Res 35:319–325. doi:10.1007/s11001-013-9189-1
Crotwell HP, Owens TJ, Ritsema J (1999) The TauP toolkit: flexible seismic travel-time and ray-path utilities. Seismol Res Lett 70(2):154–160. doi:10.1785/gssrl.70.2.154
Frohlich C (2010) Deep earthquakes. Cambridge University Press, CambridgeFukao Y, Obayahashi M (2013) Subducted slabs stagnant above, penetrating
through, and trapped below the 660 km discontinuity. J Geophys Res 118:5920–5938. doi:10.1002/2013JB010466
Furumura T, Kennett BLN (2005) Subduction zone guided waves and the heterogeneity structure of the subducted plate: intensity anomalies in northern Japan. J Geophys Res 110:B10302. doi:10.1029/2004JB003486
Furumura T, Kennett BLN, Padhy S (2016) Enhanced waveguide effect for deep-focus earthquakes in the subducting Pacific slab produced by a metastable olivine wedge. J Geophys Res 121:6779–6796. doi:10.1002/2016JB013300
Hoshiba M (2013) Real-time prediction of ground motion by Kirchhoff-Fresnel boundary integral equation method: extended front detection method for earthquake early warning. J Geophys Res 118:1–13. doi:10.1002/jgrb.50119
Jian G, Zhao D, Zhang G (2008) Seismic evidence for a metastable olivine wedge in the subducting Pacific slab under Japan Sea. Earth Planet Sci Lett 270:300–307. doi:10.1016/j.epsl.2008.03.037
Kato A, Obara K, Igarashi T, Tsuruoka H, Nakagawa S, Hirata N (2012) Propaga-tion of slow slip leading up to the 2011 Mw 9.0 Tohoku-oki earthquake. Science 335:705–708. doi:10.1126/sicence.1215141
Kennett BLN, Engdahl ER, Buland R (1995) Constraints on seismic velocities in the Earth from traveltimes. Geophys J Int 122:108–124. doi:10.1111/j.1365-246X.1995.tb03540.x
Kita S, Okada T, Hasegawa A, Nakajima J, Matsuzawa T (2010) Anomalous deepening of a seismic belt in the upper-plane of the double seismic zone in the Pacific slab beneath Hokkaido corner: possible evidence for thermal shielding caused by subducted forearc crust materials. Earth Planet Sci Lett 290:415–426. doi:10.1016/j.epsl.2009.12.038
Maeda T, Obara K, Furumura T, Saito T (2011) Interference of long-period seismic wavefield observed by the dense Hi-net array in Japan. J Geophys Res 116:B10303. doi:10.1029/JB008464
Maeda T, Nishida K, Takagi R, Obara K (2016) Reconstruction of a 2D seismic wavefield by seismic gradiometry. Prog Earth Planet Sci 3:31. doi:10.1186/s40645-016-0107-4
Miller MS, Kennett BLN, Lister GS (2004) Imaging changes in morphology geometry, and physical properties of the subducting Pacific plate along the Izu–Bonin–Mariana arc. Earth Planet Sci Lett 224:363–370. doi:10.1016/j.epsl.2004.05.018
Miyazawa M (2011) Propagation of an earthquake triggering front from the 2011 Tohoku-Oki earthquake. Geophys Res Lett 38:L23307. doi:10.1029/2011GL049795
Obara K, Kasahara K, Hori S, Okada Y (2005) A densely distributed high-sensitiv-ity seismograph network in Japan: Hi-net by National Research Institute for Earth Science and Disaster Prevention. Rev Sci Instrum 76:021301. doi:10.1063/1.1854197
Obayashi M, Fukao Y, Yoshimitsu J (2017) Unusually deep Bonin earthquake of 30 May 2015: a precursory signal to slab penetration? Earth Planet Sci Lett 459:221–226. doi:10.1016/j.epsl.2016.11.019
Okada Y, Kasahara K, Hori S, Obara K, Sekiguchi S, Fujiwara H, Yamamoto A (2004) Recent progress of seismic observation networks in Japan-Hi-net, F-net, K-NET and KiK-net-. Earth Planets Space 56:xv–xxviii. doi:10.1186/BF03353076
Porritt RW, Yoshioka S (2016) Slab pileup in the mantle transition zone and the 30 May 2015 Chichi-jima earthquake. Geophys Res Lett 43:4905–4912. doi:10.1002/2016GL068168
Sato H, Fehler M, Maeda T (2012) Seismic wave propagation and scattering in the heterogeneous earth structure, 2nd edn. Springer, New York
Sawazaki K, Enescu B (2014) Imaging the high-frequency energy radiation process of a main shock and its early aftershock sequence: the case of the 2008 Iwate-Miyagi Nairiku earthquake, Japan. J Geophys Res 119:4729–4746. doi:10.1002/2013JB010539
Shiomi K, Obara K, Haryu Y, Matsumura M (2009) Construction of NIED high sensitivity seismogram network (Hi-net) and its contribution. Zisin 61:1–7. doi:10.4294/zisin.61.1 (in Japanese with English abstract)
Storchak DA, Giacomo DD, Bondár I, Engdahl ER, Harris J, Lee WHK, Vil-laseñor A, Bormann P (2013) Public release of the ISC-GEM Global instrumental earthquake catalogue. Seism Res Lett 84:810–815. doi:10.1785/02200130034
Takemoto T, Furumura T, Saito T, Maeda T, Noguchi S (2012) Spatial- and frequency-dependent properties of site amplification factors in Japan derived by the coda normalization method. Bull Seismol Soc Am 102:1462–1476. doi:10.1785/0120110188
Takemura S, Maeda T, Furumura T, Obara K (2016) Constraining the depth of the Off Ogasawara deep-focus earthquake of 30 May 2015 (Mw = 7.9) from the seismogram envelope of high-frequency P wave: occurrence of deep-focus earthquake at the bottom of subducting slab. Geophys Res Lett 43:4297–4302. doi:10.1002/2016GL068437
Wei W, Zhao D, Xu J, Wei F, Liu G (2015) P and S wave tomography and ani-sotropy in Northwest Pacific and East Asia: constraints on stagnant slab and intraplate volcanism. J Geophys Res 120:1642–1666. doi:10.1002/2014JB011254
Wessel P, Smith WHF (1998) New, improved version of generic mapping tools released. EOS Trans Am Geophys Union 79:579. doi:10.1029/98EO00426
Ye L, Lay T, Zhan Z, Kanamori H, Hao JL (2016) The isolated ~680 km deep 30 May 2015 Mw 7.9 Ogasawara (Bonin) Islands earthquake. Earth Planet Sci Lett 433:169–179. doi:10.1016/j.epsl.2015.10.049
Zhan Z (2017) Gutenberg–Richter law for deep earthquakes revisited: a dual-mechanism hypothesis. Earth Planet Sci Lett 461:1–7. doi:10.1016/j.epsl.2016.12.030


![An overview of Izu-Bonin-Mariana subductionhome.ustc.edu.cn/.../homework/Izu-Bonin-Mariana_Trench.pdf · Izu‐Bonin‐Mariana subduction factory[J]. Inside the subduction factory,](https://img.pdfslide.net/doc/110x75/5f19a10e9604a42490532f20/an-overview-of-izu-bonin-mariana-izuaboninamariana-subduction-factoryj-inside.jpg)