Embed Size (px)
Citation preview
This article was downloaded by: [The University of Manchester Library]On: 09 October 2014, At: 16:02Publisher: Taylor & FrancisInforma Ltd Registered in England and Wales Registered Number:1072954 Registered office: Mortimer House, 37-41 Mortimer Street,London W1T 3JH, UK
Journal of AppliedStatisticsPublication details, including instructions forauthors and subscription information:http://www.tandfonline.com/loi/cjas20
Sequential-typenonparametric test usingMann-Whitney statisticsUttam Bandyopadhyay & Atanu BiswasPublished online: 02 Aug 2010.
To cite this article: Uttam Bandyopadhyay & Atanu Biswas (1999) Sequential-type nonparametric test using Mann-Whitney statistics, Journal of AppliedStatistics, 26:3, 301-308, DOI: 10.1080/02664769922412
To link to this article: http://dx.doi.org/10.1080/02664769922412
PLEASE SCROLL DOWN FOR ARTICLE
Taylor & Francis makes every effort to ensure the accuracy of allthe information (the “Content”) contained in the publications on ourplatform. However, Taylor & Francis, our agents, and our licensorsmake no representations or warranties whatsoever as to the accuracy,completeness, or suitability for any purpose of the Content. Anyopinions and views expressed in this publication are the opinions andviews of the authors, and are not the views of or endorsed by Taylor& Francis. The accuracy of the Content should not be relied upon andshould be independently verified with primary sources of information.Taylor and Francis shall not be liable for any losses, actions, claims,proceedings, demands, costs, expenses, damages, and other liabilitieswhatsoever or howsoever caused arising directly or indirectly inconnection with, in relation to or arising out of the use of the Content.
This article may be used for research, teaching, and private studypurposes. Any substantial or systematic reproduction, redistribution,reselling, loan, sub-licensing, systematic supply, or distribution in any

form to anyone is expressly forbidden. Terms & Conditions of accessand use can be found at http://www.tandfonline.com/page/terms-and-conditions
Dow
nloa
ded
by [
The
Uni
vers
ity o
f M
anch
este
r L
ibra
ry]
at 1
6:02
09
Oct
ober
201
4
Journal of Applied Statistics, Vol. 26, No. 3, 1999, 301± 308
Sequential-type nonparametric test usingMann± Whitney statistics
UTTAM BANDYOPADHYAY1
& ATANU BISWAS2,
1Department of Statistics,
University of Calcutta, India and2Applied Statistics Unit, Indian Statistical Institute,
Calcutta, India
ABSTRACT The paper provides a nonparametric test for the identity of two continuous
univariate distribution functions when observations are drawn in pairs from the popula-
tions, by adopting a sampling scheme which, using Mann± Whitney scores, generalizes the
existing inverse binomial sampling technique. Some exact performance characteristics of
the proposed test are formulated and compared numerically with existing competitors of
the proposed test. The applicability of the proposed test is illustrated using real-life data.
1 Introduction
The problem of testing the identity of two treatment eþ ects has been considered by
many authors in recent years (see, for example, Jennison & Turnbull, 1989, 1991,
1993; Kim & DeMets, 1987; Lan & DeMets, 1983; Pocock, 1977), by taking obser-
vations in pairs. In the present paper, we consider the problem under a univariate
set-up. The problem may be described as follows: Let F1 and F2 be two unknown
continuous univariate distribution functions. Then, by drawing independent obser-
vations from F1 and F2 in pairs, our object is to test the null hypothesis
H : F1 5 F2 (1)
against a class of one-sided alternatives
H a : F2> F1 (2)
when F2> F1 means F2(x) > F1(x) for all x with at least one strict inequality. In
particular, if we take F1 5 F(x) and F2 5 F(x 2 d ), 2 ` < x, d < ` , or F1 5 F(x)
and F2 5 F(x exp 2 ( d )), x> 0, 2 ` < d < ` , we have expressions (1) and (2) as
H : d 5 0 against H a : d > 0 (3)
Correspondence: U. Bandyopadhyay, Department of Statistics, University of Calcutta, 35 Ballygunge
Circular Road, Calcutta 700019, India.
0266-476 3/99/030301-0 8 $7.00 � 1999 Taylor & Francis Ltd
Dow
nloa
ded
by [
The
Uni
vers
ity o
f M
anch
este
r L
ibra
ry]
at 1
6:02
09
Oct
ober
201
4
302 U. B andyopadhyay & A. B iswas
For this problem, samples corresponding to F1 and F2 may be drawn by adopting
the following inverse scheme of sampling: Let X and Y denote the performance of
old and new treatments respectively. Suppose that X ~ F1 , Y ~ F2 and they are
independent. Here, X and Y are observed in pairs. Corresponding to the i th pair
(X i , Y i), a random variable Z i is de® ned by
Z i 5 {1, Y i> X i
0, Y i < X i
(4)
Obviously, the Z i terms are iid Bernoulli (p) random variables, where
p 5 p(F, d ) 5 ò F1 (x) dF2 (x)
This equals 12 under H and is greater than 1
2 under H a . Now, writing
Sn 5 Rn
i 5 1
Z i , n > 1
sampling is stopped at that n 5 N for which Sn 5 r is reached for the ® rst time,
where r is a predetermined positive integer. If
SÂ n 5 Rn
i 5 1
(1 2 Z i), n > 1
then SÂ N has the negative binomial (r, 12) distribution under H . Hence, given
a Î (0, 1), we can ® nd a non-negative integer c a that satis® es
PH {SÂ N < c a } < a < PH {SÂ N < c a + 1} (5)
Thus, a level a test rule that corresponds to the scheme of sampling mentioned
may be as follows: Stop sampling at the nth draw and accept H if
SÂ n> c a , 1 < n < N
Reject H if
SÂ N < c a (6)
This test is unbiased and consistent. The average sample number (ASN) of pairs
of the test is smaller than that of the test [SÂ N < c a ]. However, power functions of
the two tests will remain the same.
For the present problem, Bandyopadhyay & Biswas (1995) suggested some
nonparametric group-sequential-type tests using the inverse sampling scheme
mentioned here. A natural generalization of this sampling scheme is a scheme
which replaces {Sn } by Mann± Whitney statistics {Un }, and r by q(r), i.e. an integer-
valued quadratic function of r. In the next section, a test procedure is proposed
using this generalized inverse sampling scheme.
2 Proposed test procedure and its diþ erent performance characteristics
Here, the observations are drawn one by one and in pairs. After drawing the i th
pair, the diþ erences Y i 2 Xk (1 < j, k < i ) are observed instead of observing the
diþ erences Y i 2 X i . Then, an indicator variable Z ij is introduced as follows:
Dow
nloa
ded
by [
The
Uni
vers
ity o
f M
anch
este
r L
ibra
ry]
at 1
6:02
09
Oct
ober
201
4
Nonparametric test using Mann± Whitney statistics 303
Z i j 5 {1, Y j 2 X i> 0
0, Y j 2 X i < 0(7)
This leads to the following sequence of Mann± Whitney statistics:
Un 5 Rn
i 5 1Rn
j 5 1
Z i j , n > 1 (8)
The stopping variable N is then de® ned by
N 5 min{n: Un > q(r)} (9)
Now, writing
UÂ n 5 Rn
i 5 1Rn
j 5 1
(1 2 Z i j), n > 1 (10)
our proposed test is based on the random sequence
{UÂ n , 1 < n < N } (11)
Since UÂ n and N are both stochastically smaller under H a than under H , a level a
test is given by expressions (5) and (6) with SÂ n replaced by UÂ n , 1 < n < N , and c a
replaced by u a . Finally, to obtain an exactly size a test, the usual randomization
technique may be adopted. The test is based on Mann± Whitney statistics, so is
obviously exactly distribution free. The test can easily be shown to be unbiased
and consistent.
To obtain some exact performance characteristics of the proposed test, we
consider, for convenience, simply the non-randomized test. One of the character-
istics is measured by the power function of the test. To obtain such a function, we
take, for a given F, diþ erent d , and write h 5 (F, d ). The power function of the test
procedure is then
P ( h ) 5 P{UÂ N < u a ½ h } (12)
We also consider another characteristic which is the ASN function for the proce-
dure. This can be expressed as
A( h ) 5 R`
n 5 1
nPh (In e Jn ) (13)
where the events In and Jn are, respectively, given by
In 5 (U j< q(r), j 5 1, 2, . . . , n 2 1, Un > q(r)) (14)
Jn 5 (UÂ j < u a , j 5 1, 2, . . . , n 2 1, UÂ n > u a ) (15)
Note that equation (13) has an upper bound R t pN (t ½ h ), where pN (t ½ h ) is the
probability mass function (pmf ) of N.
Now, to ® nd the distribution of N , we start with the distribution of U t0 , where
t0 5 [(q(r))1/2] + 1 with [x] as the greatest integer contained in x, and write
U t0 + 1 5 U t0 + UÅ t0 + 1 (16)
where
UÅ t0 + 1 5 S t0 + 1 + SÂ t0 (17)
Dow
nloa
ded
by [
The
Uni
vers
ity o
f M
anch
este
r L
ibra
ry]
at 1
6:02
09
Oct
ober
201
4
304 U. B andyopadhyay & A. B iswas
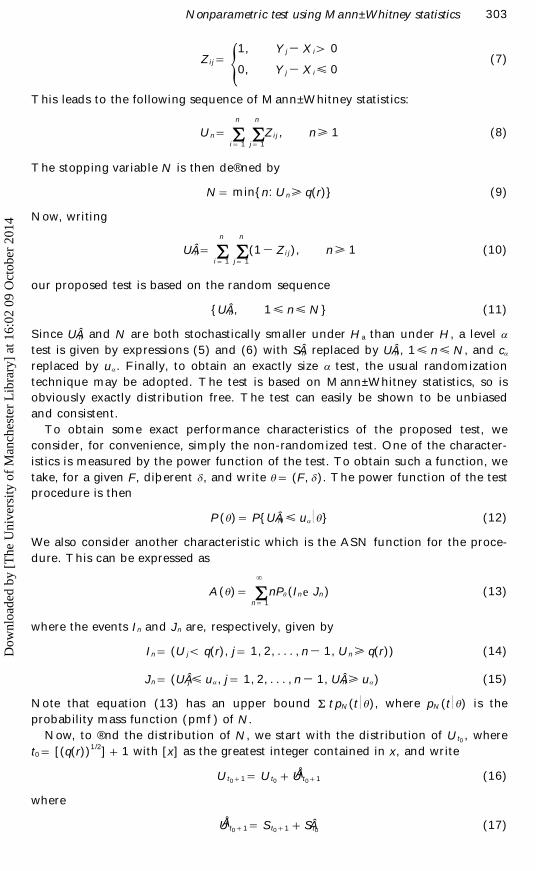
FIG. 1. Power curves for the proposed test and its two competitors.
S t0 + 1 is the additional score for the inclusion of the variable X t0 + 1 in the system
{(X i , Y i), i 5 1, 2, . . . , t0 }, and SÂ t0 + 1 is that for the variable Y t0 + 1 in the system
{(X i , Y i), i 5 1, 2, . . . , t0 ; X t0 + 1}. Using this breakdown, we can ® nd, for any j, the
conditional pmf of U j + 1 , given U j 5 u j . We denote the pmf by p j + 1 (u j + 1 ½ u j). Finally,
we obtain
pN (t ½ h ) 5 P{U l< q(r), l 5 1, 2, . . . , t 2 1, U t > q(r) ½ h }(18)
5 Rq(r) 2 1
ut0 5 0
. . . Rq(r) 2 1
ut 2 1 5 0
[Pt0 (u t0 )pt0 + 1 (u t0 + 1 ½ u t0 ). . . p t 2 1 (u t 2 1 ½ u t 2 2 )P{U t > q(r) ½ u t 2 1 }]
Finally, in an illustrative computation, we ® rst ® nd the cut-o þ point u a , taking
a 5 0.065 and q(r) 5 21. Then, at diþ erent values of h , we compute the powers
and ASNs of the procedure by simulation. These are shown in Figs 1 and 2. The
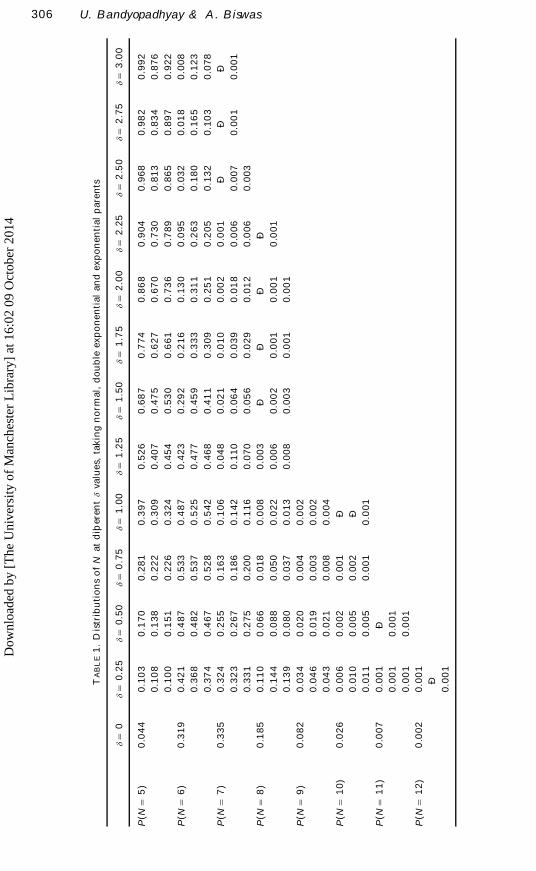
distributions of N at diþ erent d values are shown in Table 1, taking normal, double
exponential and exponential parents.
The three values in each cell are those of the three respective parents.
3 Comparison of the proposed test procedure with some existing
competitors
In this section, we consider the following competitors of the proposed test
procedure:
(i) the test procedure discussed in Section 1;
(ii) ® xed-sample-size test, corresponding to the proposed test.
For competitor (i), the power function is given by
Dow
nloa
ded
by [
The
Uni
vers
ity o
f M
anch
este
r L
ibra
ry]
at 1
6:02
09
Oct
ober
201
4
Nonparametric test using Mann± Whitney statistics 305
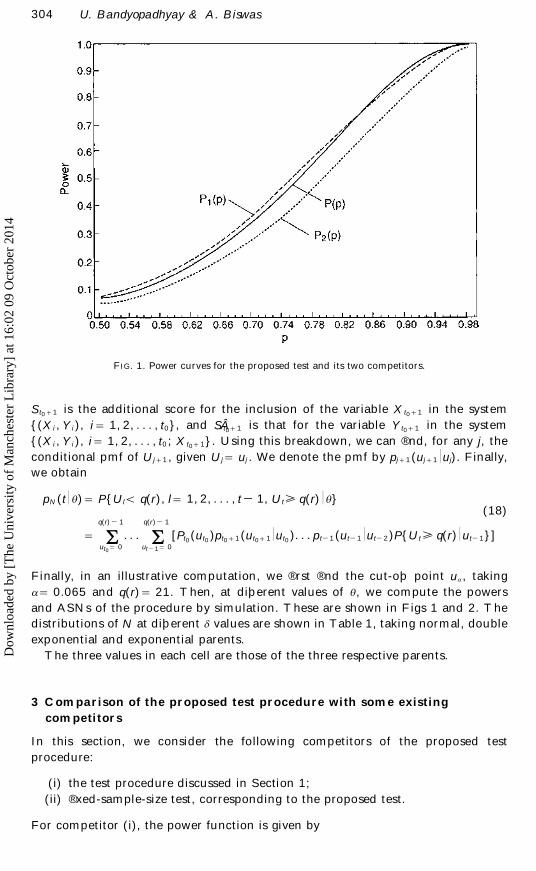
FIG. 2. ASN curves for the proposed test and competitor (i).
P1 ( h ) 5 Rc a
k 5 0 (r + k 2 1
r 2 1 ) pr(1 2 p)k (19)
To obtain the ASN function, let W m be a random variable that denotes the number
of successes up to m failures. Then, writing
w (m) 5 E(W m ½ Wm < r) 5 Rr 2 1
s 5 0
sg(s) (20)
where
g(s) 5 (m + s 2 1
m 2 1 )(1 2 p)mp
s/ Rr 2 1
k 5 0(m + k 2 1
m 2 1 )(1 2 p)mp
k (21)
we have the expression for the ASN function as
A1 ( h ) 5 Rc a
u 5 0
(u + r) p h (u) + Ra
u 5 c a + 1
[c a + 1 + w (c a + 1)]p h (u) (22)
where p h (u) is the pmf of the negative binomial (r, p) distribution. Note that r /p is
an upper bound of A1( h ).
For competitor (ii), a level a test that corresponds to the proposed test is to
reject H if
UÂ n0 < n20 2 q(r) (23)
where
n0 5 á [(u a + q(r))1/2] ñ (24)
Dow
nloa
ded
by [
The
Uni
vers
ity o
f M
anch
este
r L
ibra
ry]
at 1
6:02
09
Oct
ober
201
4
306 U. B andyopadhyay & A. B iswas
TA
BL
E1
.D
istr
ibu
tio
ns
of
Nat
diþ
eren
td
valu
es,
tak
ing
no
rmal,
do
ub
leexp
on
en
tial
an
dexp
on
en
tial
pare
nts
d5
0d
50
.25
d5
0.5
0d
50
.75
d5
1.0
0d
51
.25
d5
1.5
0d
51
.75
d5
2.0
0d
52
.25
d5
2.5
0d
52
.75
d5
3.0
0
P( N
55
)0
.04
40
.10
30
.17
00
.28
10
.39
70
.52
60
.68
70
.77
40
.86
80
.90
40
.96
80
.98
20
.99
2
0.1
08
0.1
38
0.2
22
0.3
09
0.4
07
0.4
75
0.6
27
0.6
70
0.7
30
0.8
13
0.8
34
0.8
76
0.1
00
0.1
51
0.2
26
0.3
24
0.4
54
0.5
30
0.6
61
0.7
36
0.7
89
0.8
65
0.8
97
0.9
22
P( N
56
)0
.31
90
.42
10
.48
70
.53
30
.48
70
.42
30
.29
20
.21
60
.13
00
.09
50
.03
20
.01
80
.00
8
0.3
68
0.4
82
0.5
37
0.5
25
0.4
77
0.4
59
0.3
33
0.3
11
0.2
63
0.1
80
0.1
65
0.1
23
0.3
74
0.4
67
0.5
28
0.5
42
0.4
68
0.4
11
0.3
09
0.2
51
0.2
05
0.1
32
0.1
03
0.0
78
P( N
57
)0
.33
50
.32
40
.25
50
.16
30
.10
60
.04
80
.02
10
.01
00
.00
20
.00
1Ð
ÐÐ
0.3
23
0.2
67
0.1
86
0.1
42
0.1
10
0.0
64
0.0
39
0.0
18
0.0
06
0.0
07
0.0
01
0.0
01
0.3
31
0.2
75
0.2
00
0.1
16
0.0
70
0.0
56
0.0
29
0.0
12
0.0
06
0.0
03
P( N
58
)0
.18
50
.11
00
.06
60
.01
80
.00
80
.00
3Ð
ÐÐ
Ð
0.1
44
0.0
88
0.0
50
0.0
22
0.0
06
0.0
02
0.0
01
0.0
01
0.0
01
0.1
39
0.0
80
0.0
37
0.0
13
0.0
08
0.0
03
0.0
01
0.0
01
P( N
59
)0
.08
20
.03
40
.02
00
.00
40
.00
2
0.0
46
0.0
19
0.0
03
0.0
02
0.0
43
0.0
21
0.0
08
0.0
04
P( N
51
0)
0.0
26
0.0
06
0.0
02
0.0
01
Ð
0.0
10
0.0
05
0.0
02
Ð
0.0
11
0.0
05
0.0
01
0.0
01
P( N
51
1)
0.0
07
0.0
01
Ð
0.0
01
0.0
01
0.0
01
0.0
01
P( N
51
2)
0.0
02
0.0
01
Ð
0.0
01
Dow
nloa
ded
by [
The
Uni
vers
ity o
f M
anch
este
r L
ibra
ry]
at 1
6:02
09
Oct
ober
201
4
Nonparametric test using Mann± Whitney statistics 307
TABLE 2. Ovarian weight (grammes) of the soft-shelled turtle Lissemys punctata
punctata , using four treatments
A 1 : Control A2 : LH-treated A 3 : E-17 b -treated A4 : FSH-treated
28.0 30.0 30.0 50.0
27.4 26.7 26.7 43.4
32.4 27.2 27.2 44.9
25.4 28.0 28.0 45.0
32.2 51.3
Notes: LH, leutimizing hormone; E-17 b , estradiol-17 b ; FSH, follicle-stimulating
hormone. Dose, 15 l g per 100 g body weight for 15 days.
with á [x] ñ as the nearest integer to x. Let us denote the power function of the test
by P2( h ).
For competitors (i) and (ii), we have to take r 5 7 and n0 5 5 respectively. Each
test is suitably randomized to obtain the size 0.065. Powers and ASNs are computed
at diþ erent h values and are shown in Figs 1 and 2. Comparing the graphs, we
observe that the proposed test procedure is an improvement, in the sense that it
has almost the same power with a smaller ASN.
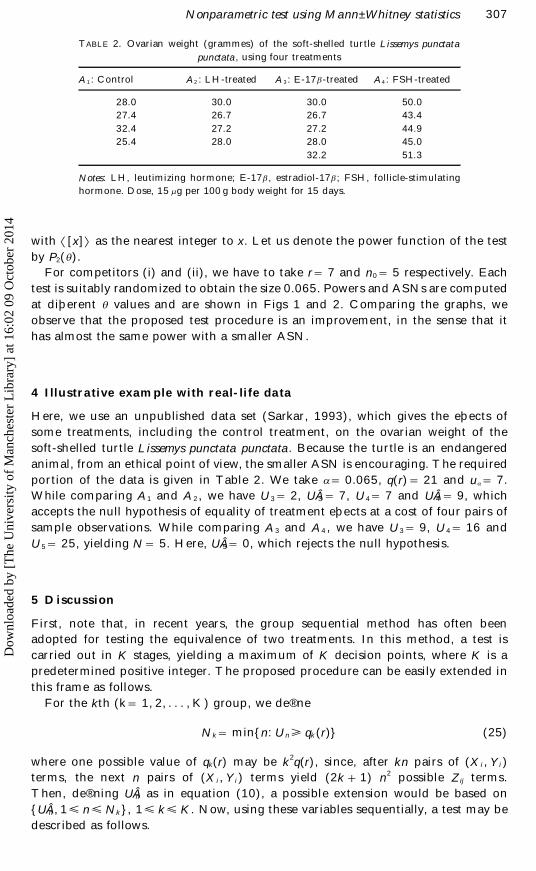
4 Illustrative example with real-life data
Here, we use an unpublished data set (Sarkar, 1993), which gives the eþ ects of
some treatments, including the control treatment, on the ovarian weight of the
soft-shelled turtle Lissemys punctata punctata. Because the turtle is an endangered
animal, from an ethical point of view, the smaller ASN is encouraging. The required
portion of the data is given in Table 2. We take a 5 0.065, q(r) 5 21 and u a 5 7.
While comparing A1 and A 2 , we have U3 5 2, UÂ 3 5 7, U4 5 7 and UÂ 4 5 9, which
accepts the null hypothesis of equality of treatment eþ ects at a cost of four pairs of
sample observations. While comparing A 3 and A4 , we have U3 5 9, U4 5 16 and
U5 5 25, yielding N 5 5. Here, UÂ 5 5 0, which rejects the null hypothesis.
5 Discussion
First, note that, in recent years, the group sequential method has often been
adopted for testing the equivalence of two treatments. In this method, a test is
carried out in K stages, yielding a maximum of K decision points, where K is a
predetermined positive integer. The proposed procedure can be easily extended in
this frame as follows.
For the kth (k 5 1, 2, . . . , K ) group, we de® ne
N k 5 min{n: Un > qk (r)} (25)
where one possible value of qk(r) may be k2q(r), since, after kn pairs of (X i , Y i )
terms, the next n pairs of (X i , Y i ) terms yield (2k + 1) n2 possible Z ij terms.
Then, de® ning UÂ n as in equation (10), a possible extension would be based on
{UÂ n , 1 < n < Nk }, 1 < k < K . Now, using these variables sequentially, a test may be
described as follows.
Dow
nloa
ded
by [
The
Uni
vers
ity o
f M
anch
este
r L
ibra
ry]
at 1
6:02
09
Oct
ober
201
4
308 U. B andyopadhyay & A. B iswas
Reject H at the kth stage (1 < k < K ) if
UÂ N l> c l , l 5 1, 2, . . . , k 2 1, UÂ Nk < ck
Accept H if
UÂ n > ck , for some n: 1 < n < N k , k 5 1, 2, . . . , K (26)
where {c1 , . . . , ck } are non-negative integers determined in such a way that the test
has overall level of signi® cance a . Diþ erent performance characteristics of the test
are under investigation.
Next, we indicate the applicability of the present approach to the following
decision-making problem:
d1 : d 5 0, d2 : d > 0, d3 : d < 0 (27)
Suppose that Z ij , Un and UÂ n are as in Section 2. Then, we set our stopping variables
N* as
N* 5 min{N *1 , N *2 } (28)
where
N *1 5 min{n: Un > q(r)}, N *2 5 min{n: UÂ n > q(r)} (29)
We stop sampling at the nth draw and accept d2 or d3 if UÂ n < a a or Un < a a , and
accept d1 if UÂ N * > a a and UN * > a a . Diþ erent performance characteristics of the
decision rule can be similarly set, and these are intended to be communicated in a
separate paper.
Acknowledgements
The work of the second author was supported by a Research Fellowship from the
Council of Scienti® c and Industrial Research (Sanction 9 /28(391) /94-EMR-I).
R EFERENCES
BANDYOPADHYAY , U. & BISWAS, A. (1995) Some nonparametric group sequential type tests for two
population problems, Calcutta Statistical Association Bulletin, 45, pp. 73 ± 91.
JENNISON, C. & TURNBULL, B. W. (1989) Interim analysis: The repeated con® dence interval approach
(with discussion), Journal of the Royal Statistical Society, Series B , 51, pp. 305 ± 361.
JENNISON, C. & TURNBULL, B. W. (1991) Group sequential tests and repeated con® dence intervals. In:
B. K. GHOSH & P. K. SEN (Eds), Handbook of Sequential Analysis, pp. 283 ± 311 (New York, Marcel
Dekker).
JENNISON, C. & TURNBULL, B. W. (1993) Sequential equivalence testing and repeated con® dence with
intervals with applications to normal and binary responses, B iometr ics, 49, pp. 31 ± 43.
K IM, K. & DEMETS, D. L. (1987) Design analysis of group sequential tests based on the type I error
spending rate function, B iometrika, 74, pp. 149 ± 154.
LAN, K. K. G. & DEM ETS, D. L. (1983) Discrete sequential boundaries for clinical trials, B iometr ika,
70, pp. 649 ± 663.
POCOCK, S. J. (1977) Group sequential methods in the design and analysis of clinical trials, B iometr ika,
64, pp. 191 ± 199.
POCOCK, S. J. (1982) Interim analyses for randomized clinical trials: The group sequential approach,
B iometr ics, 38, pp. 153 ± 162.
SARKAR, S. (1993) Some Aspects of B iology of Female Reproduction in the Soft-shelled Turtle Lissemys
Punctata punctata, Ph.D. Thesis, University of Calcutta, unpublished.
Dow
nloa
ded
by [
The
Uni
vers
ity o
f M
anch
este
r L
ibra
ry]
at 1
6:02
09
Oct
ober
201
4


![February 13, 2018 arXiv:1712.06983v2 [math.ST] 10 Feb 2018 · Nonparametric MANOVA in Mann-Whitney effects1 Dennis Dobler , Sarah Friedrich yand Markus Pauly February 13, 2018 Abstract](https://img.pdfslide.net/doc/110x75/5d5d226088c993204a8b8e0d/february-13-2018-arxiv171206983v2-mathst-10-feb-2018-nonparametric-manova.jpg)