Embed Size (px)
Citation preview
1
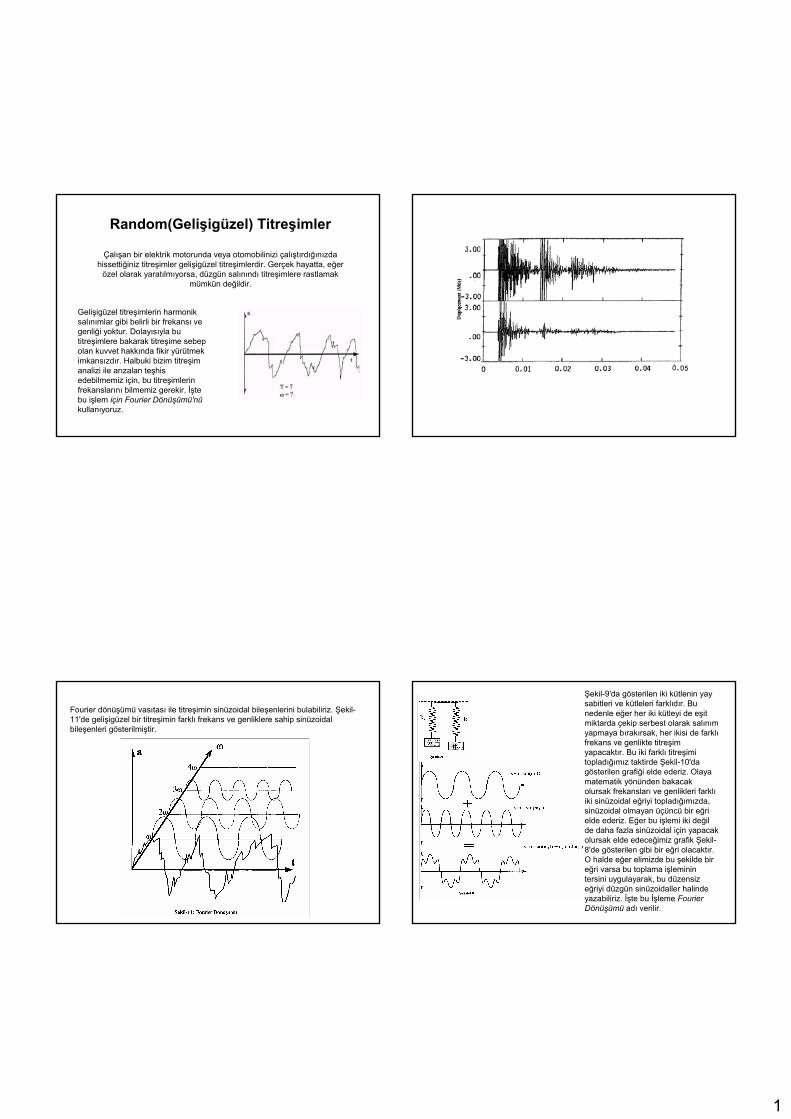
Random(Gelişigüzel) Titreşimler
Çalışan bir elektrik motorunda veya otomobilinizi çalıştırdığınızda hissettiğiniz titreşimler gelişigüzel titreşimlerdir. Gerçek hayatta, eğer
özel olarak yaratılmıyorsa, düzgün salınındı titreşimlere rastlamak mümkün değildir.
Gelişigüzel titreşimlerin harmoniksalınımlar gibi belirli bir frekansı ve genliği yoktur. Dolayısıyla bu titreşimlere bakarak titreşime sebep olan kuvvet hakkında fikir yürütmek imkansızdır. Halbuki bizim titreşim analizi ile arızalan teşhis edebilmemiz için, bu titreşimlerin frekanslarını bilmemiz gerekir. İşte bu işlem için Fourier Dönüşümü'nükullanıyoruz.
Fourier dönüşümü vasıtası ile titreşimin sinüzoidal bileşenlerini bulabiliriz. Şekil-11'de gelişigüzel bir titreşimin farklı frekans ve genliklere sahip sinüzoidal bileşenleri gösterilmiştir.
Şekil-9'da gösterilen iki kütlenin yay sabitleri ve kütleleri farklıdır. Bu nedenle eğer her iki kütleyi de eşit miktarda çekip serbest olarak salınım yapmaya bırakırsak, her ikisi de farklıfrekans ve genlikte titreşim yapacaktır. Bu iki farklı titreşimi topladığımız taktirde Şekil-10'da gösterilen grafiği elde ederiz. Olaya matematik yönünden bakacak olursak frekansları ve genlikleri farklıiki sinüzoidal eğriyi topladığımızda, sinüzoidal olmayan üçüncü bir eğri elde ederiz. Eğer bu işlemi iki değil de daha fazla sinüzoidal için yapacak olursak elde edeceğimiz grafik Şekil-8'de gösterilen gibi bir eğri olacaktır.O halde eğer elimizde bu şekilde bir eğri varsa bu toplama işleminin tersini uygulayarak, bu düzensiz eğriyi düzgün sinüzoidaller halinde yazabiliriz. İşte bu İşleme FourierDönüşümü adı verilir.
2
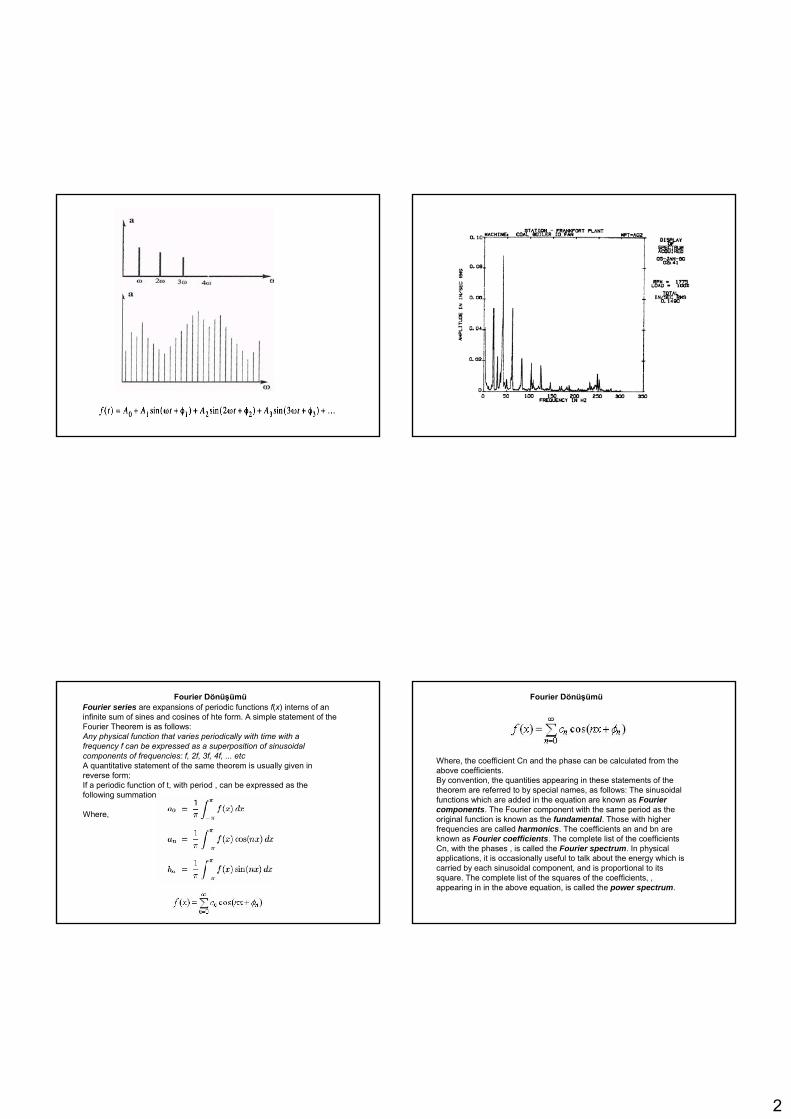
Fourier DönüşümüFourier series are expansions of periodic functions f(x) interns of an infinite sum of sines and cosines of hte form. A simple statement of theFourier Theorem is as follows: Any physical function that varies periodically with time with a frequency f can be expressed as a superposition of sinusoidalcomponents of frequencies: f, 2f, 3f, 4f, ... etcA quantitative statement of the same theorem is usually given in reverse form: If a periodic function of t, with period , can be expressed as thefollowing summation
Where,
Fourier Dönüşümü
Where, the coefficient Cn and the phase can be calculated from theabove coefficients.By convention, the quantities appearing in these statements of thetheorem are referred to by special names, as follows: The sinusoidalfunctions which are added in the equation are known as Fouriercomponents. The Fourier component with the same period as theoriginal function is known as the fundamental. Those with higherfrequencies are called harmonics. The coefficients an and bn areknown as Fourier coefficients. The complete list of the coefficientsCn, with the phases , is called the Fourier spectrum. In physicalapplications, it is occasionally useful to talk about the energy which is carried by each sinusoidal component, and is proportional to itssquare. The complete list of the squares of the coefficients, , appearing in in the above equation, is called the power spectrum.
3
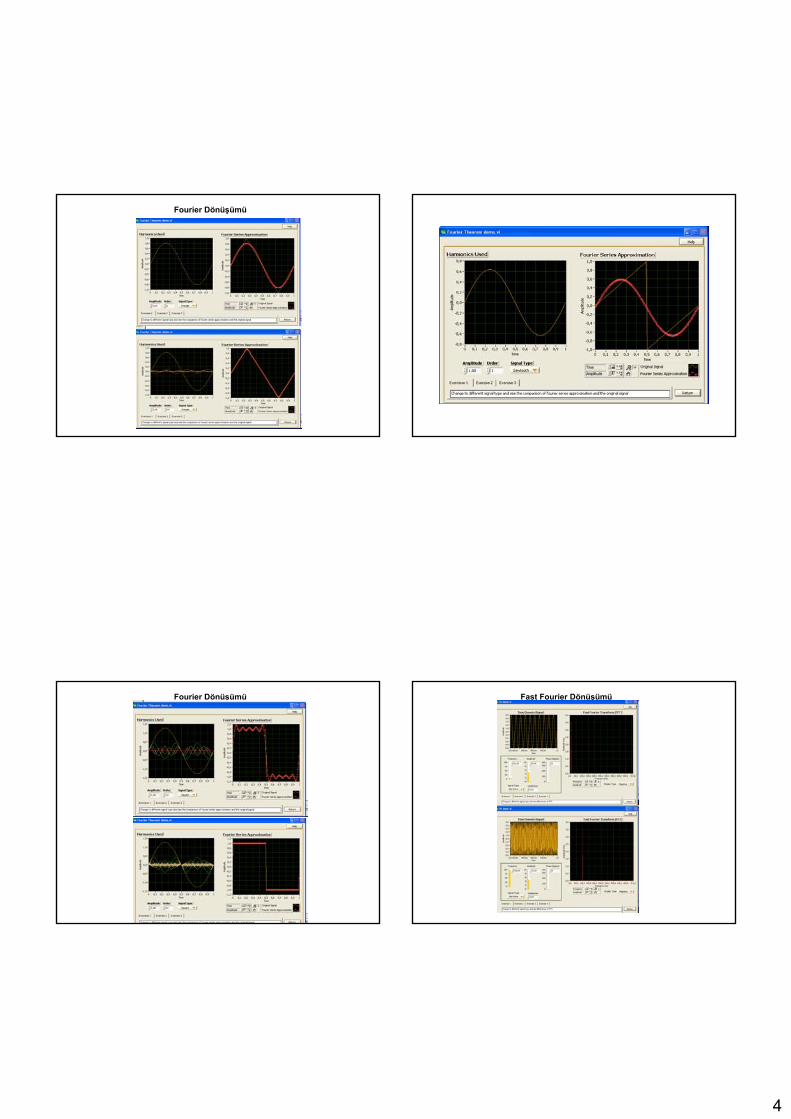
Fast Fourier DönüşümüThe Fast Fourier Transform is a mathematical algorithm, which allows a computer to perform the Discrete Fourier Transform efficiently. TheFourier Transform produces the frequency domain signal from the time domain signal. The Fast Fourier Transform (commonly called an “FFT”) computes the magnitude and phase of energy versus frequency for a given signal. An FFT does this by assuming the time domain signal is composed of a sum of sinusoids of various frequencies. The algorithmcomputes the amplitude of each of these sinusoids and the result is plotted as magnitude versus frequency. The FFT contains no information about the time evolution of a signal. Ifthe frequency content of a signal changes within the time record, the FFT gives no indication of when or how that change occurred. It does, however, give a summary of all frequencies contained in the sampleddata. Often we are interested only in the stable frequency content of a signal at a given time, though. There are techniques available to handlesignals with changing frequency content (nonstationary signal), but herewe will assume our signals here are stable in frequency(stationarysignal).
4
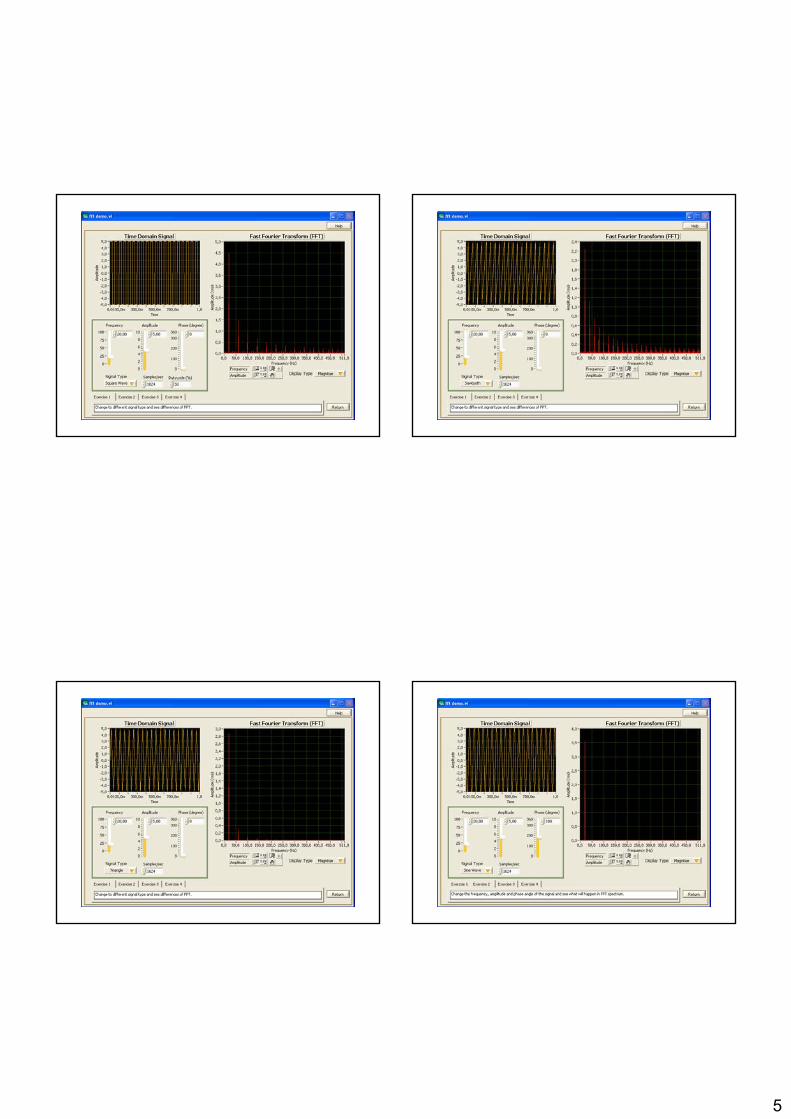
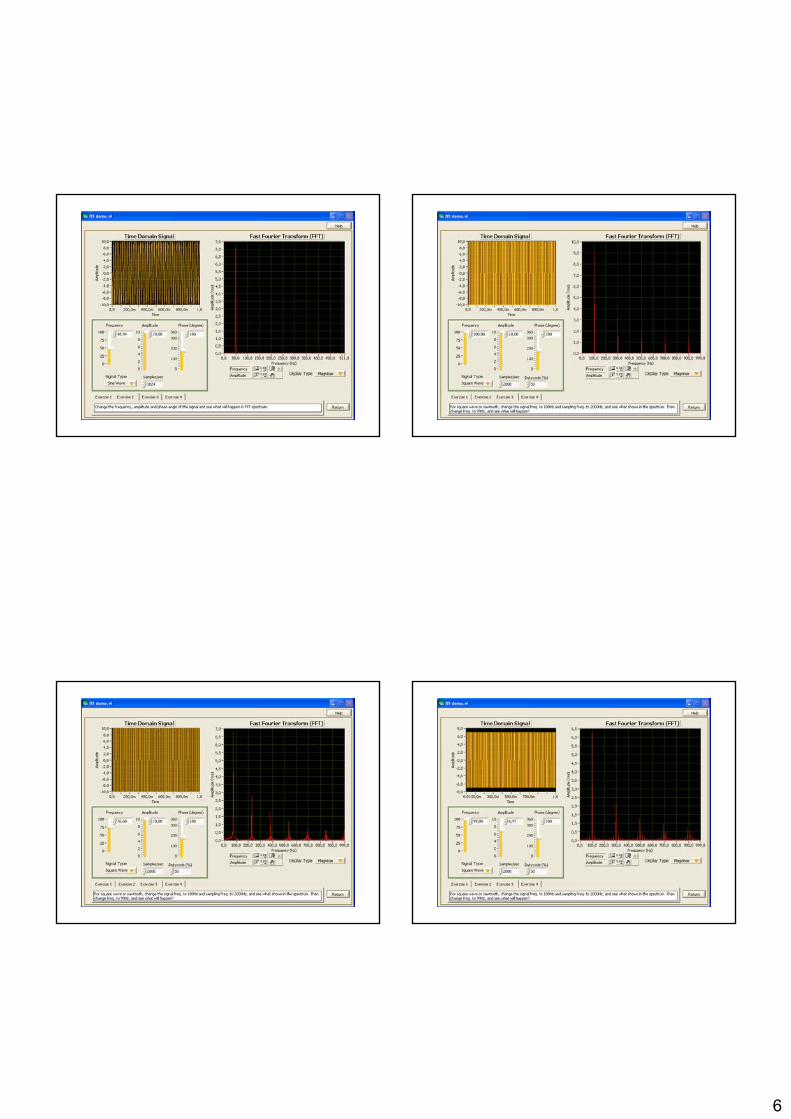
Fourier Dönüşümü
Fourier Dönüşümü Fast Fourier Dönüşümü
5
6
7
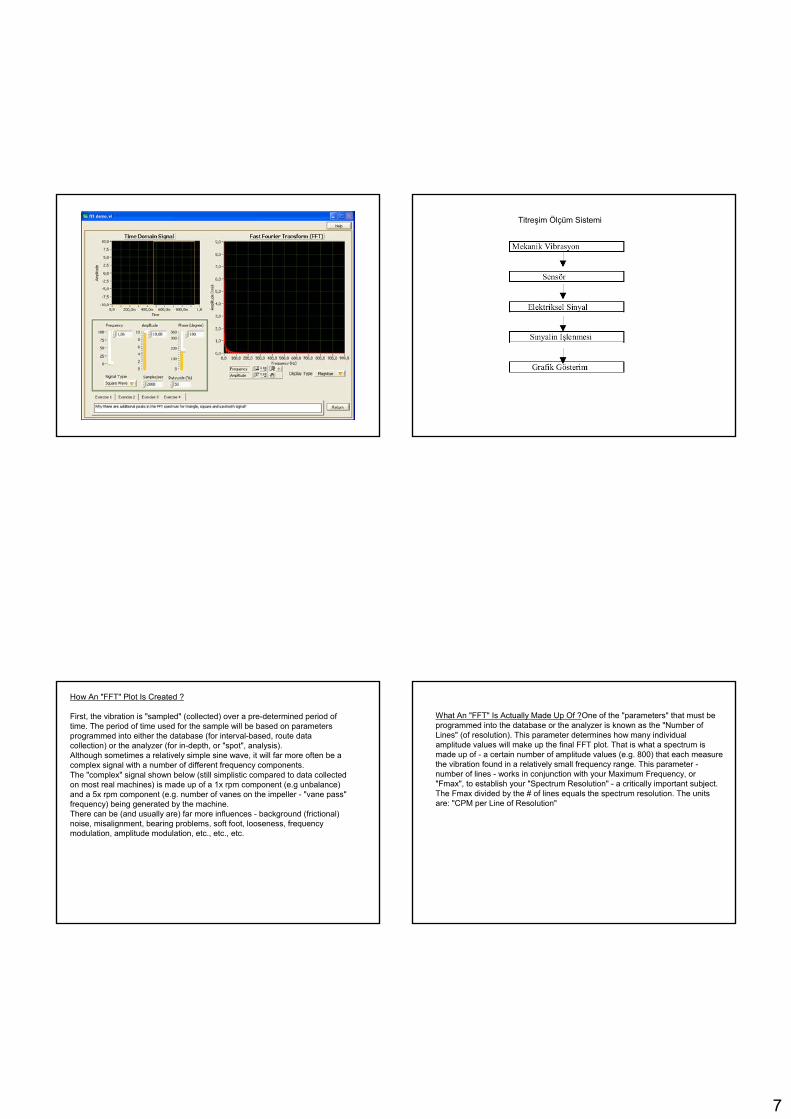
Titreşim Ölçüm Sistemi
How An "FFT" Plot Is Created ?
First, the vibration is "sampled" (collected) over a pre-determined period of time. The period of time used for the sample will be based on parametersprogrammed into either the database (for interval-based, route data collection) or the analyzer (for in-depth, or "spot", analysis).Although sometimes a relatively simple sine wave, it will far more often be a complex signal with a number of different frequency components.The "complex" signal shown below (still simplistic compared to data collectedon most real machines) is made up of a 1x rpm component (e.g unbalance) and a 5x rpm component (e.g. number of vanes on the impeller - "vane pass" frequency) being generated by the machine. There can be (and usually are) far more influences - background (frictional) noise, misalignment, bearing problems, soft foot, looseness, frequencymodulation, amplitude modulation, etc., etc., etc.
What An "FFT" Is Actually Made Up Of ?One of the "parameters" that must be programmed into the database or the analyzer is known as the "Number of Lines" (of resolution). This parameter determines how many individualamplitude values will make up the final FFT plot. That is what a spectrum is made up of - a certain number of amplitude values (e.g. 800) that each measurethe vibration found in a relatively small frequency range. This parameter -number of lines - works in conjunction with your Maximum Frequency, or"Fmax", to establish your "Spectrum Resolution" - a critically important subject. The Fmax divided by the # of lines equals the spectrum resolution. The unitsare: "CPM per Line of Resolution"
8
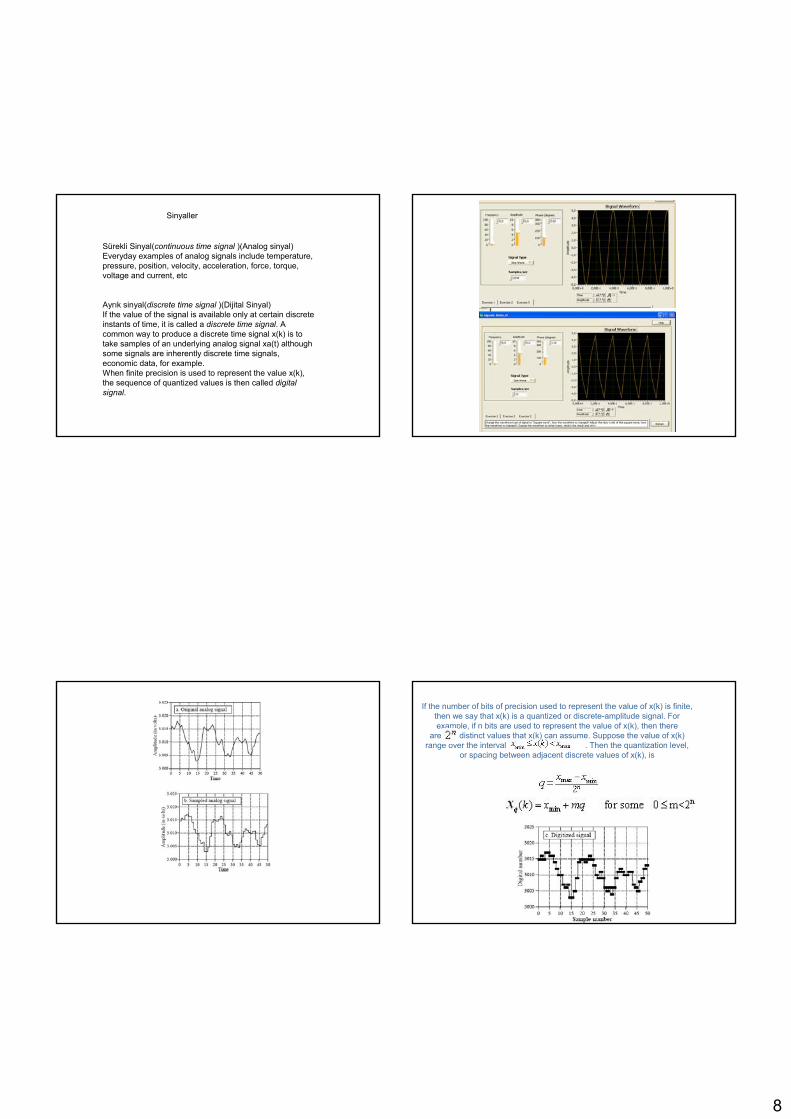
Sinyaller
Sürekli Sinyal(continuous time signal )(Analog sinyal)Everyday examples of analog signals include temperature, pressure, position, velocity, acceleration, force, torque, voltage and current, etc
Ayrık sinyal(discrete time signal )(Dijital Sinyal)If the value of the signal is available only at certain discreteinstants of time, it is called a discrete time signal. A common way to produce a discrete time signal x(k) is totake samples of an underlying analog signal xa(t) althoughsome signals are inherently discrete time signals, economic data, for example.When finite precision is used to represent the value x(k), the sequence of quantized values is then called digitalsignal.
If the number of bits of precision used to represent the value of x(k) is finite, then we say that x(k) is a quantized or discrete-amplitude signal. Forexample, if n bits are used to represent the value of x(k), then there
are distinct values that x(k) can assume. Suppose the value of x(k) range over the interval . Then the quantization level,
or spacing between adjacent discrete values of x(k), is
9
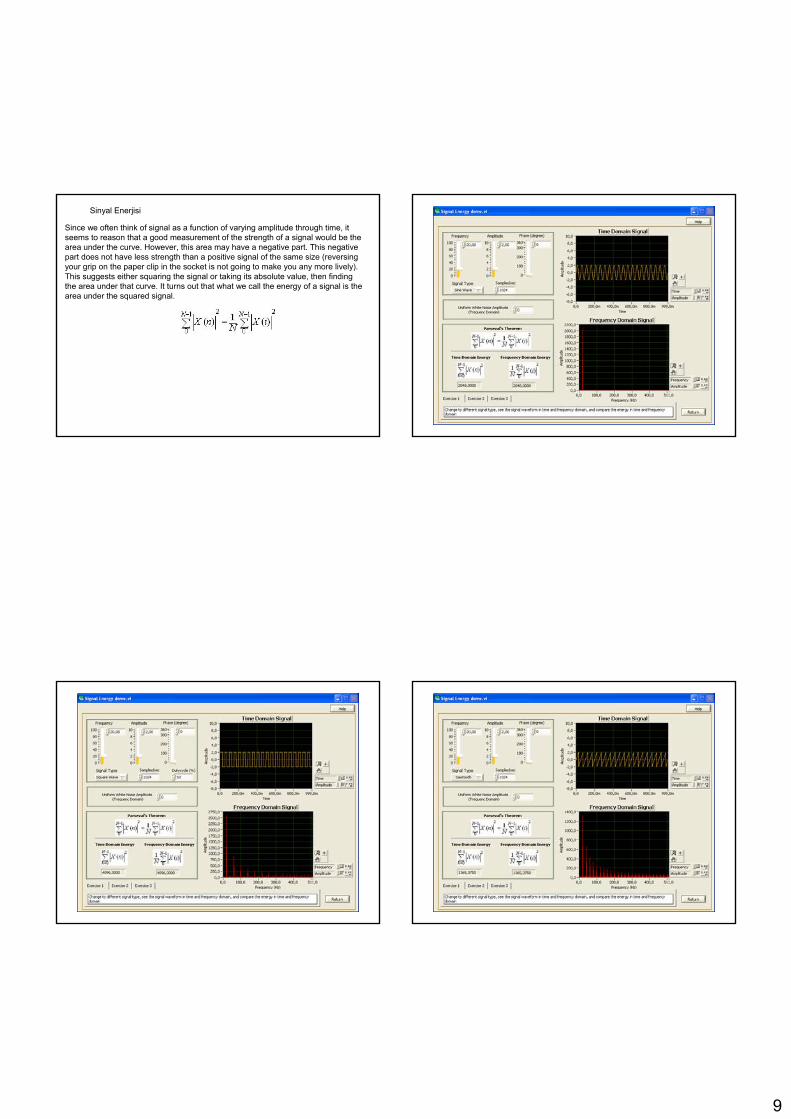
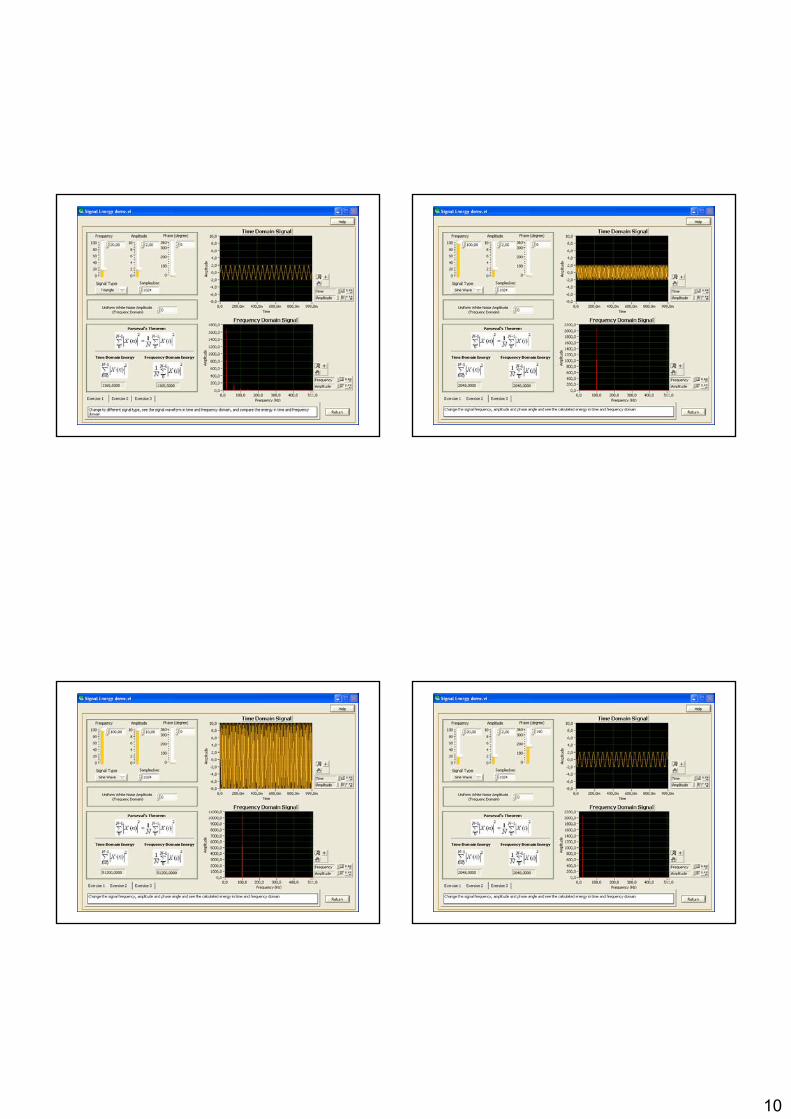
Sinyal Enerjisi
Since we often think of signal as a function of varying amplitude through time, it seems to reason that a good measurement of the strength of a signal would be thearea under the curve. However, this area may have a negative part. This negativepart does not have less strength than a positive signal of the same size (reversingyour grip on the paper clip in the socket is not going to make you any more lively). This suggests either squaring the signal or taking its absolute value, then findingthe area under that curve. It turns out that what we call the energy of a signal is thearea under the squared signal.
10
11
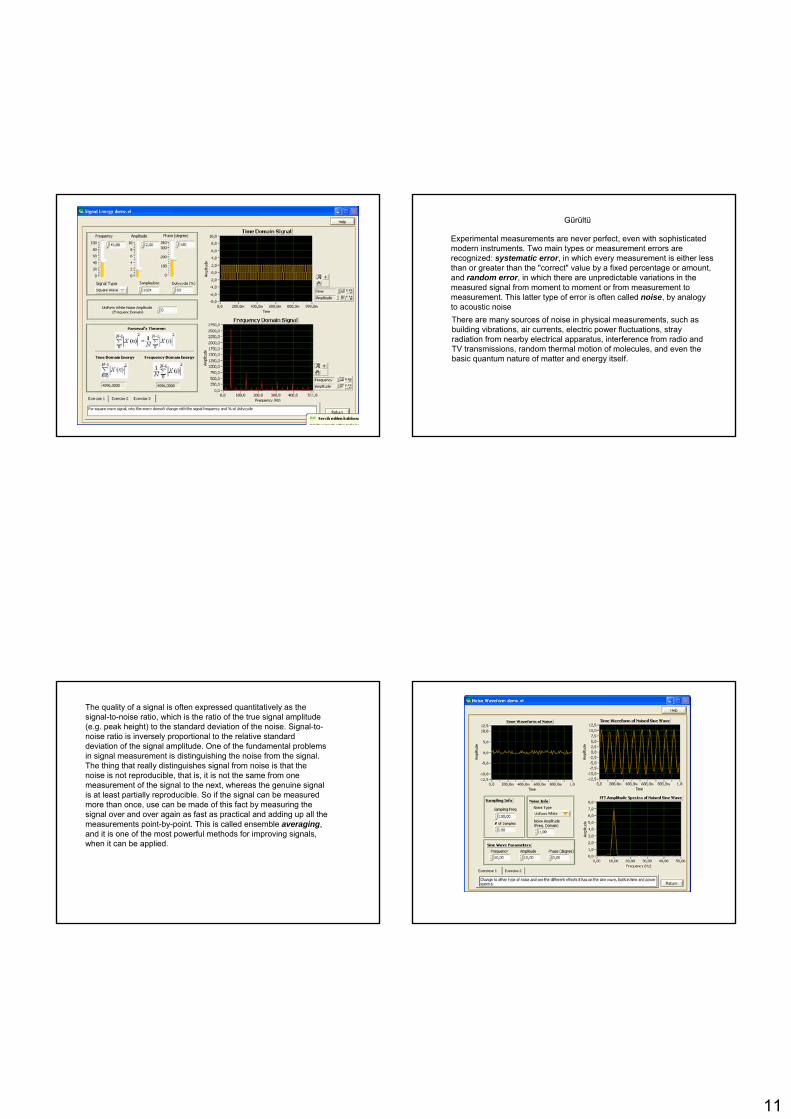
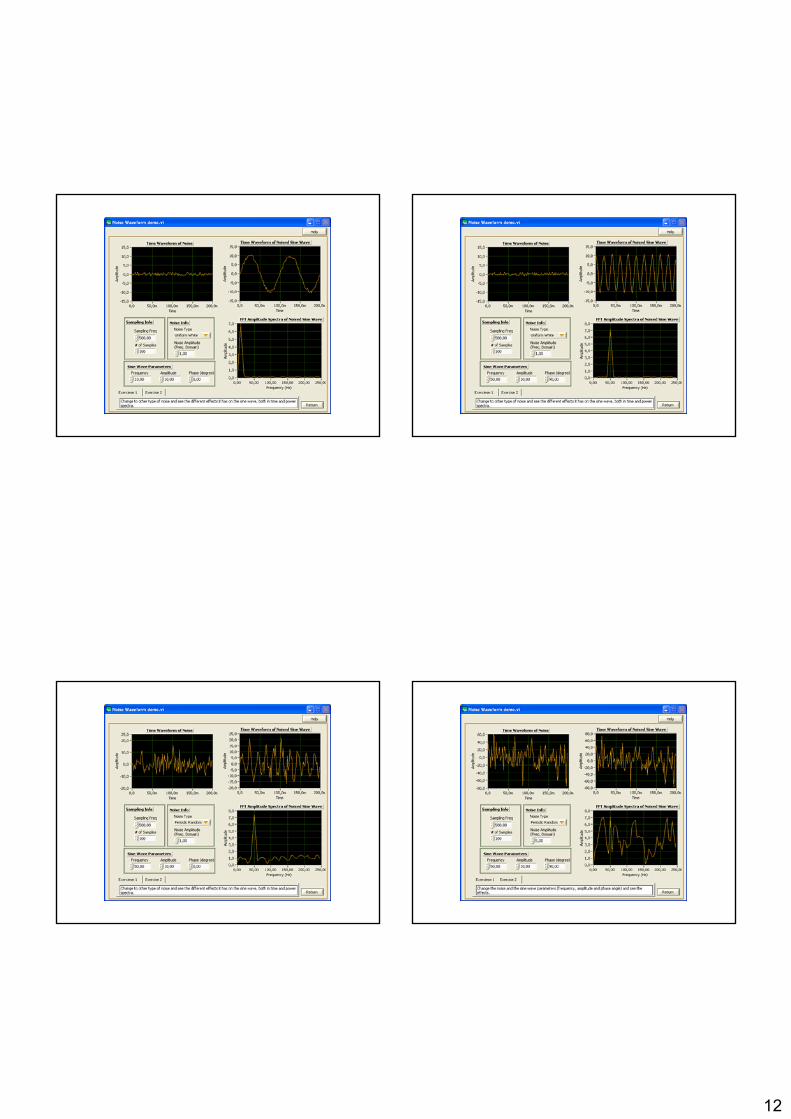
Gürültü
Experimental measurements are never perfect, even with sophisticatedmodern instruments. Two main types or measurement errors arerecognized: systematic error, in which every measurement is either lessthan or greater than the "correct" value by a fixed percentage or amount, and random error, in which there are unpredictable variations in themeasured signal from moment to moment or from measurement tomeasurement. This latter type of error is often called noise, by analogyto acoustic noiseThere are many sources of noise in physical measurements, such as building vibrations, air currents, electric power fluctuations, strayradiation from nearby electrical apparatus, interference from radio andTV transmissions, random thermal motion of molecules, and even thebasic quantum nature of matter and energy itself.
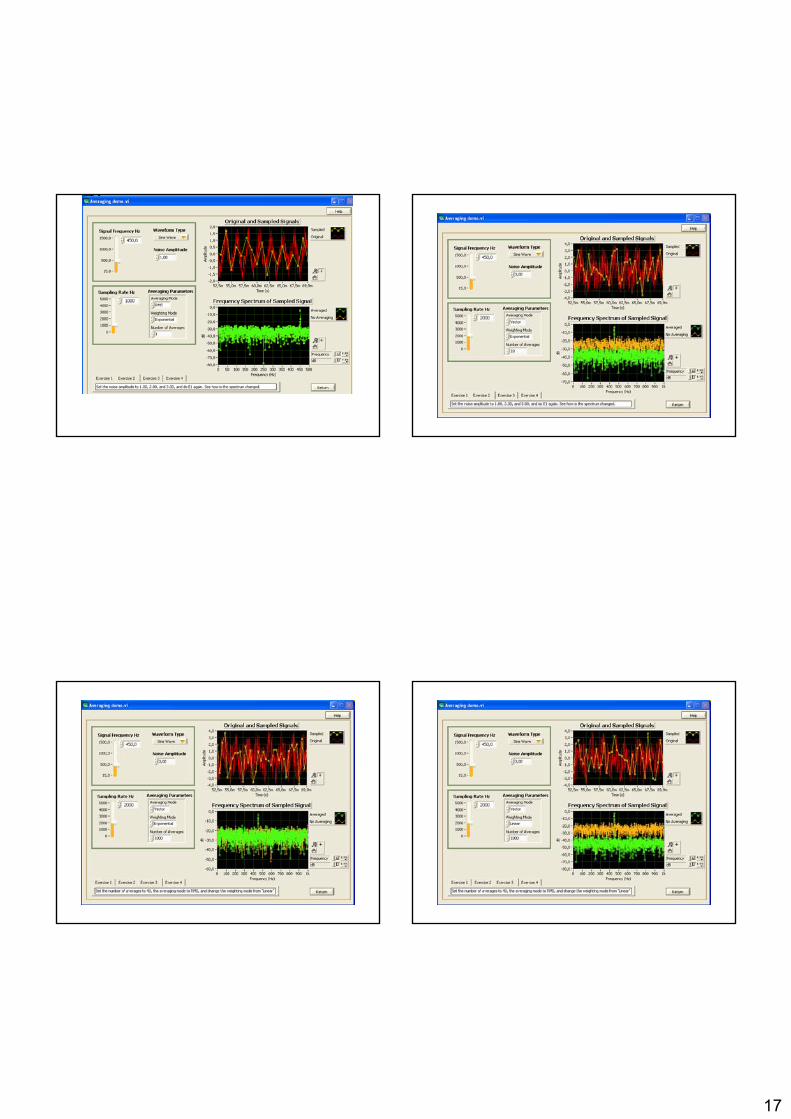
The quality of a signal is often expressed quantitatively as thesignal-to-noise ratio, which is the ratio of the true signal amplitude(e.g. peak height) to the standard deviation of the noise. Signal-to-noise ratio is inversely proportional to the relative standarddeviation of the signal amplitude. One of the fundamental problemsin signal measurement is distinguishing the noise from the signal. The thing that really distinguishes signal from noise is that thenoise is not reproducible, that is, it is not the same from onemeasurement of the signal to the next, whereas the genuine signalis at least partially reproducible. So if the signal can be measuredmore than once, use can be made of this fact by measuring thesignal over and over again as fast as practical and adding up all themeasurements point-by-point. This is called ensemble averaging, and it is one of the most powerful methods for improving signals, when it can be applied.
12
13
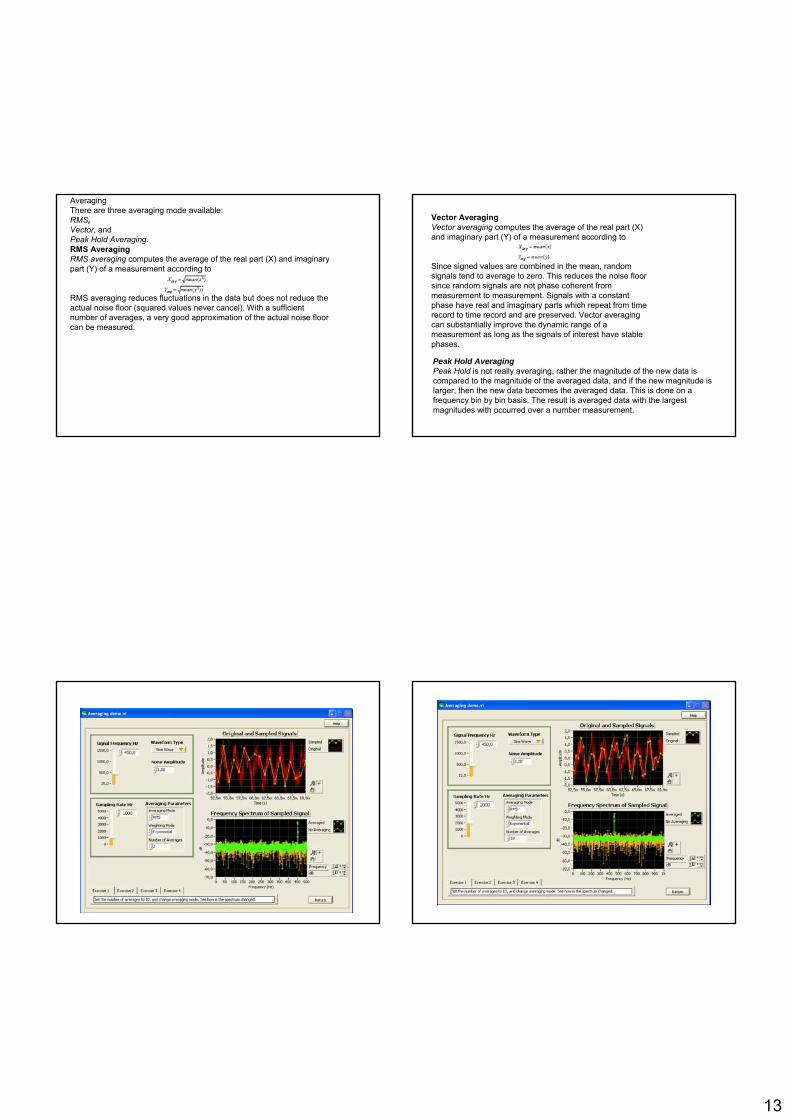
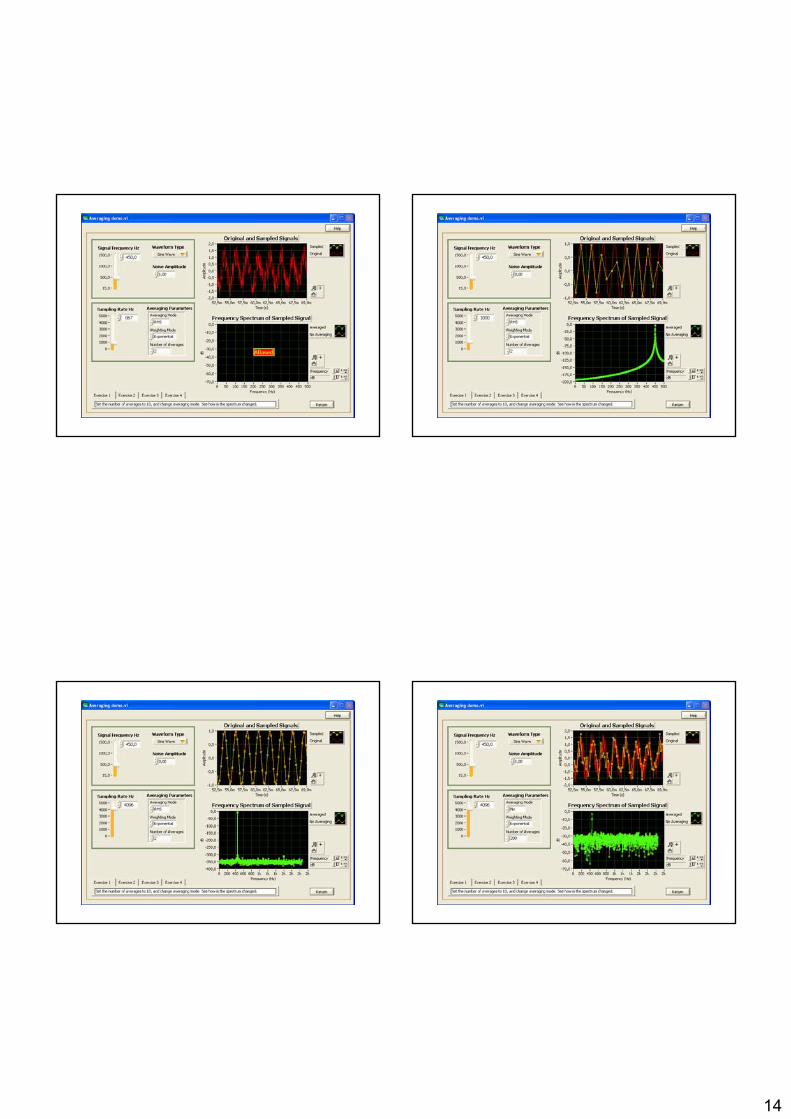
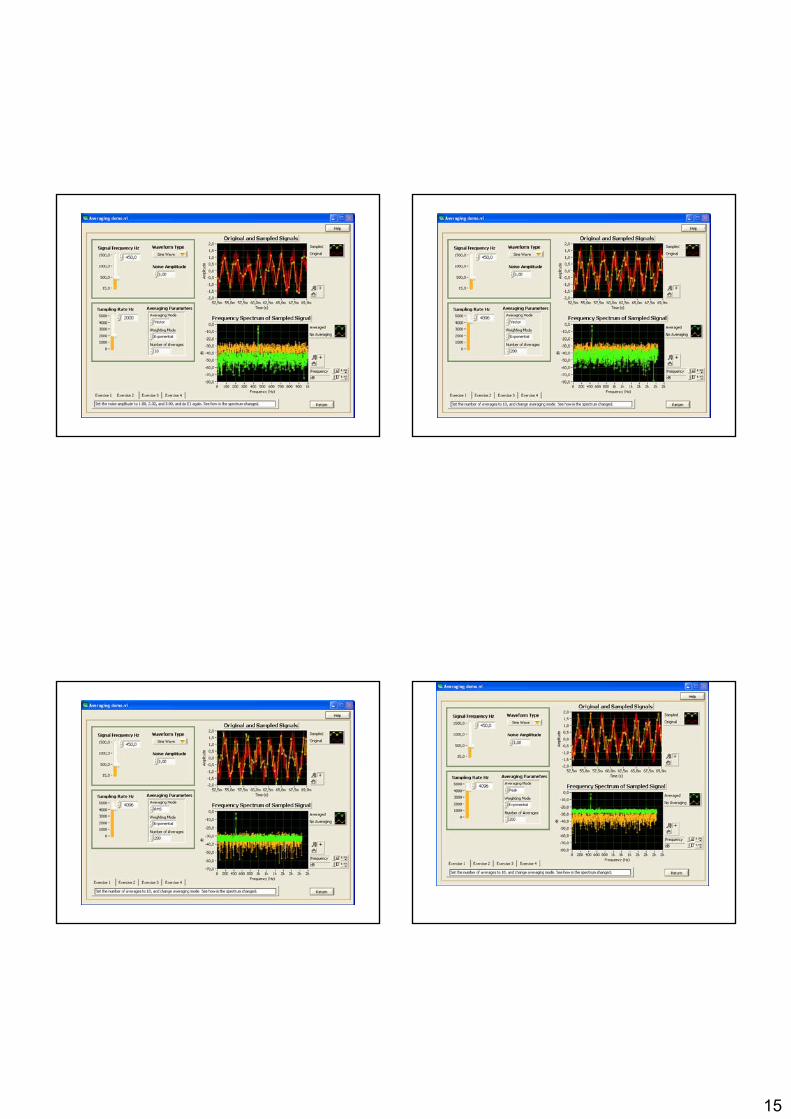
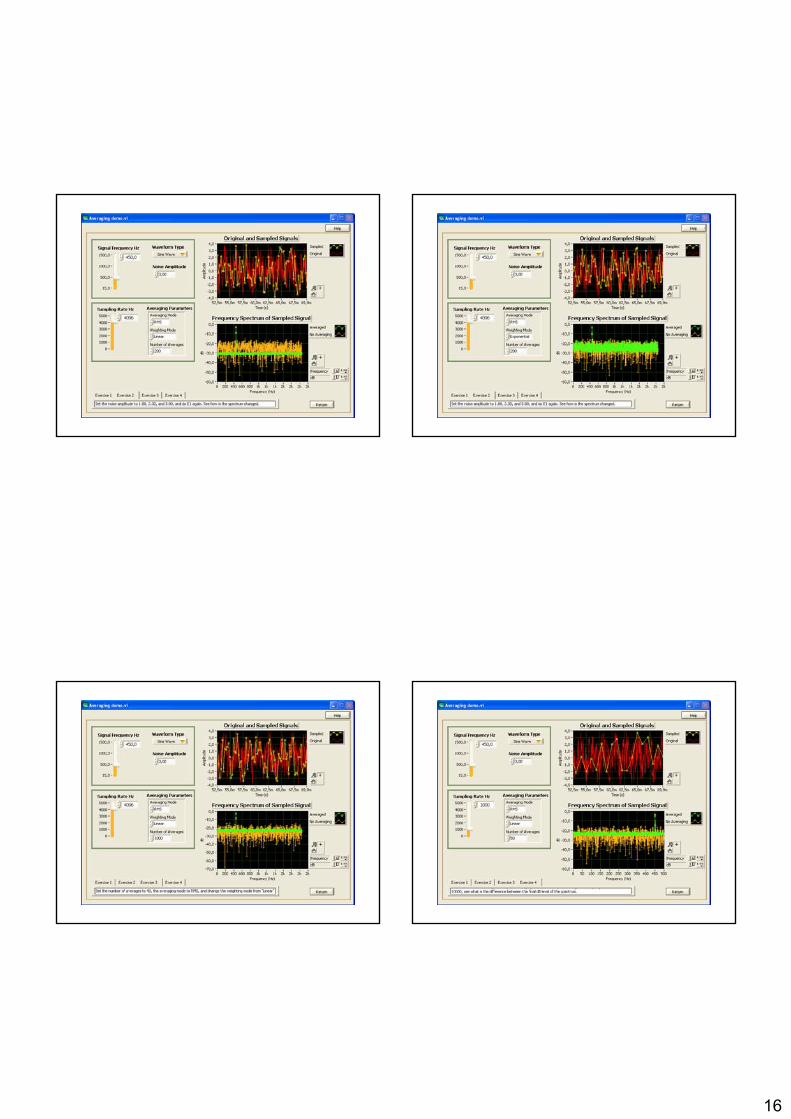
AveragingThere are three averaging mode available: RMS, Vector, andPeak Hold Averaging.RMS AveragingRMS averaging computes the average of the real part (X) and imaginarypart (Y) of a measurement according to
RMS averaging reduces fluctuations in the data but does not reduce theactual noise floor (squared values never cancel). With a sufficientnumber of averages, a very good approximation of the actual noise floorcan be measured.
Vector AveragingVector averaging computes the average of the real part (X) and imaginary part (Y) of a measurement according to
Since signed values are combined in the mean, randomsignals tend to average to zero. This reduces the noise floorsince random signals are not phase coherent frommeasurement to measurement. Signals with a constantphase have real and imaginary parts which repeat from time record to time record and are preserved. Vector averagingcan substantially improve the dynamic range of a measurement as long as the signals of interest have stablephases.
Peak Hold AveragingPeak Hold is not really averaging, rather the magnitude of the new data is compared to the magnitude of the averaged data, and if the new magnitude is larger, then the new data becomes the averaged data. This is done on a frequency bin by bin basis. The result is averaged data with the largestmagnitudes with occurred over a number measurement.
14
15
16
17
18
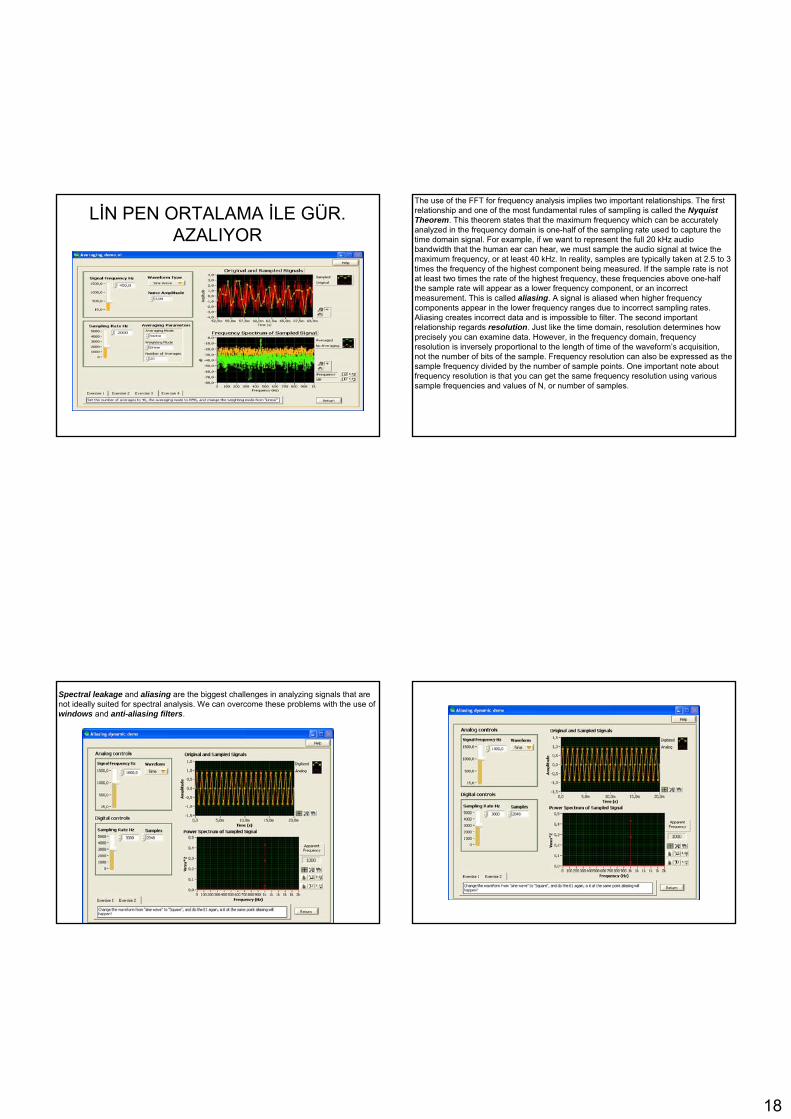
LİN PEN ORTALAMA İLE GÜR. AZALIYOR
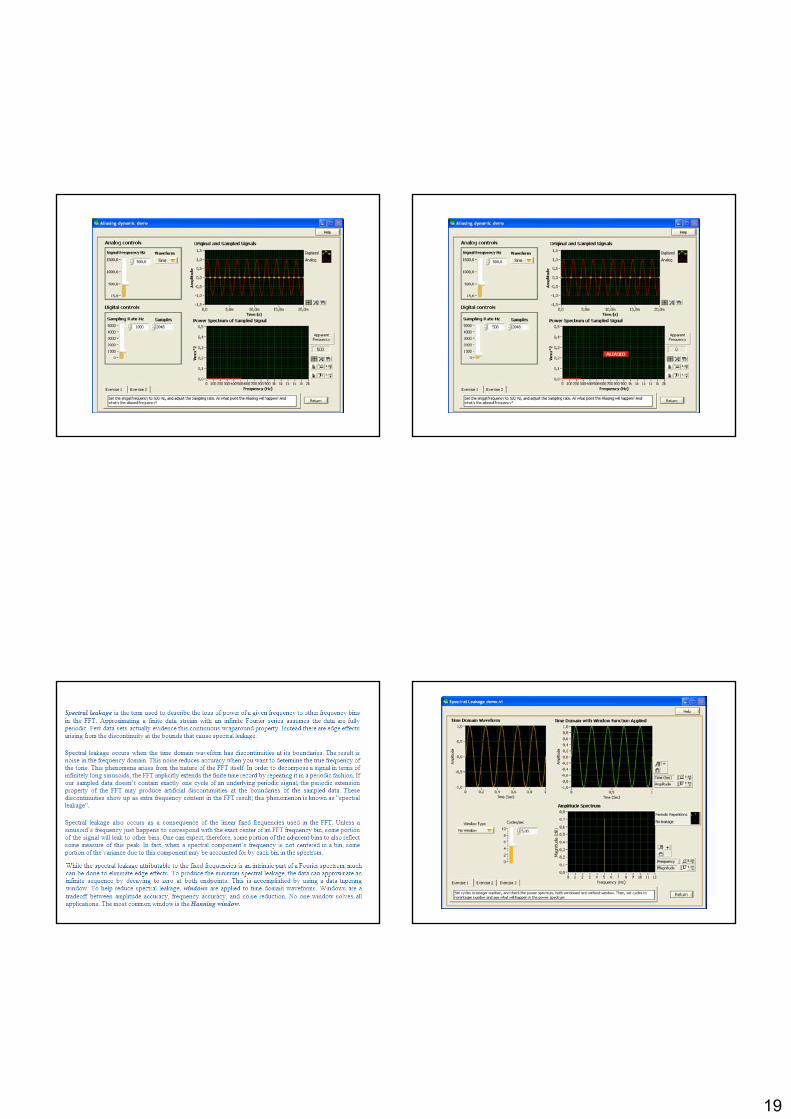
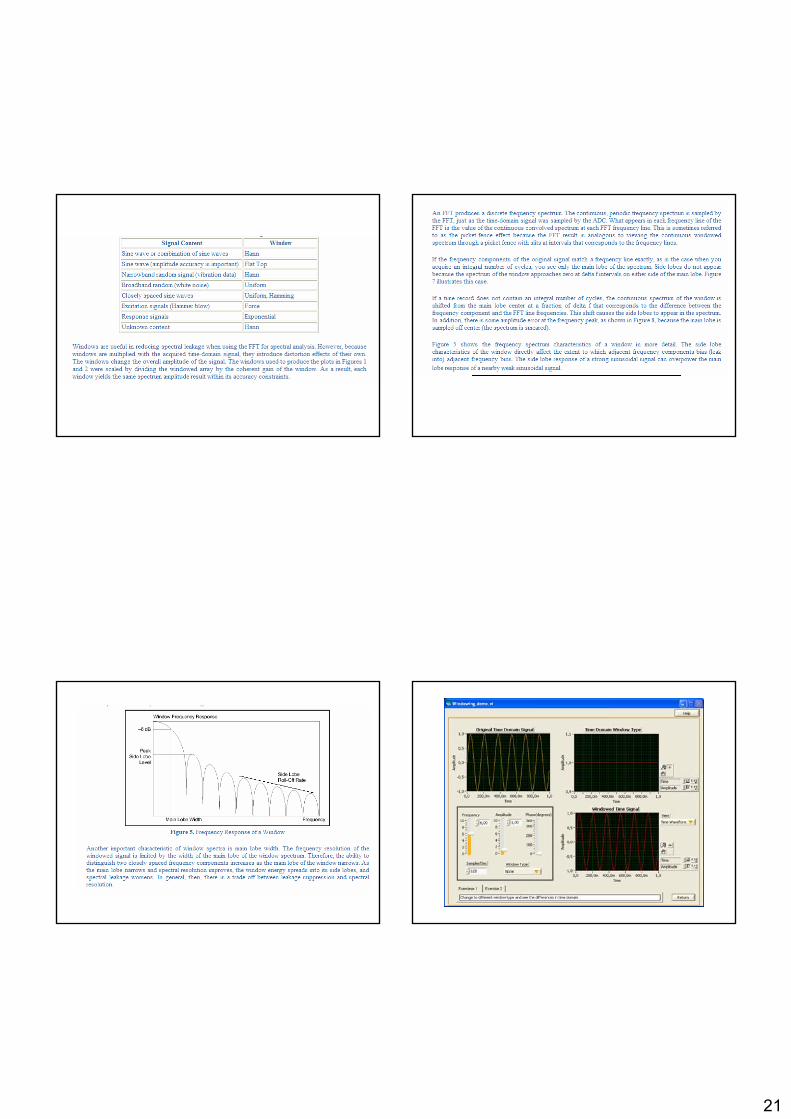
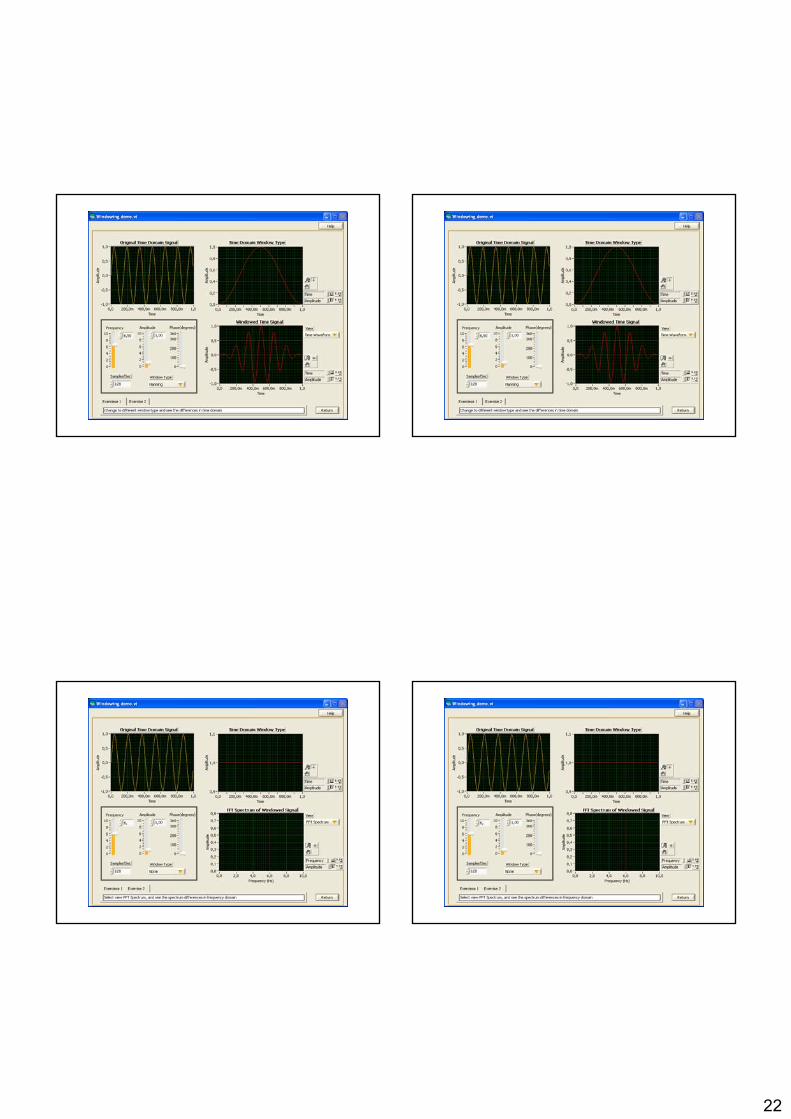
The use of the FFT for frequency analysis implies two important relationships. The firstrelationship and one of the most fundamental rules of sampling is called the NyquistTheorem. This theorem states that the maximum frequency which can be accuratelyanalyzed in the frequency domain is one-half of the sampling rate used to capture thetime domain signal. For example, if we want to represent the full 20 kHz audiobandwidth that the human ear can hear, we must sample the audio signal at twice themaximum frequency, or at least 40 kHz. In reality, samples are typically taken at 2.5 to 3 times the frequency of the highest component being measured. If the sample rate is not at least two times the rate of the highest frequency, these frequencies above one-halfthe sample rate will appear as a lower frequency component, or an incorrectmeasurement. This is called aliasing. A signal is aliased when higher frequencycomponents appear in the lower frequency ranges due to incorrect sampling rates. Aliasing creates incorrect data and is impossible to filter. The second importantrelationship regards resolution. Just like the time domain, resolution determines howprecisely you can examine data. However, in the frequency domain, frequencyresolution is inversely proportional to the length of time of the waveform’s acquisition, not the number of bits of the sample. Frequency resolution can also be expressed as thesample frequency divided by the number of sample points. One important note aboutfrequency resolution is that you can get the same frequency resolution using varioussample frequencies and values of N, or number of samples.
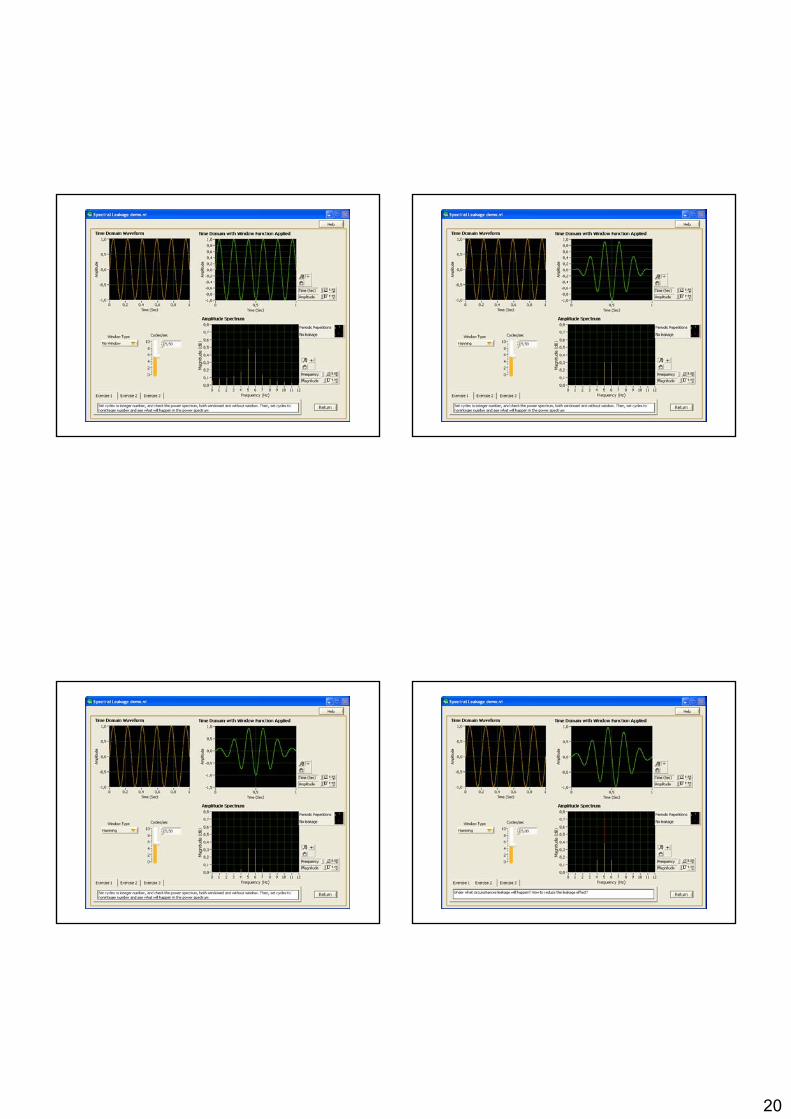
Spectral leakage and aliasing are the biggest challenges in analyzing signals that arenot ideally suited for spectral analysis. We can overcome these problems with the use of windows and anti-aliasing filters.
19
20
21
22
23
Sensörler
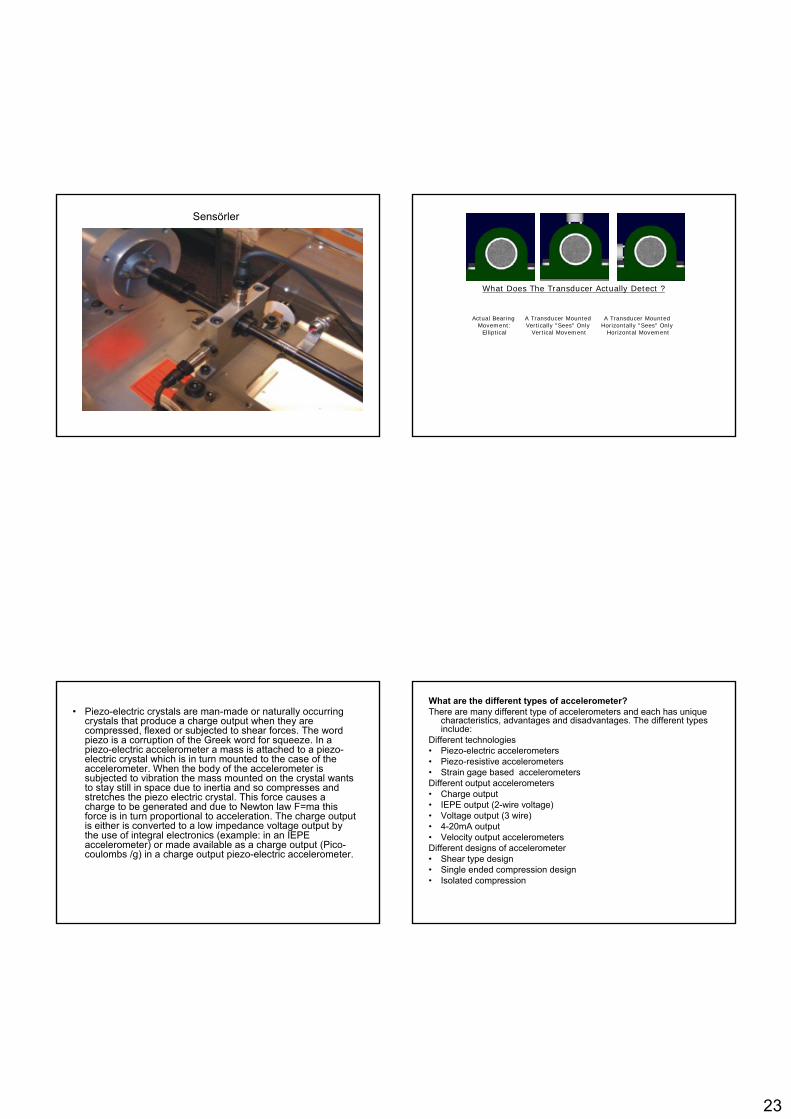
What Does The Transducer Actually Detect ?
A Transducer MountedHorizontally "Sees" Only
Horizontal Movement
A Transducer MountedVertically "Sees" Only
Vertical Movement
Actual BearingMovement:
Elliptical
• Piezo-electric crystals are man-made or naturally occurringcrystals that produce a charge output when they arecompressed, flexed or subjected to shear forces. The wordpiezo is a corruption of the Greek word for squeeze. In a piezo-electric accelerometer a mass is attached to a piezo-electric crystal which is in turn mounted to the case of theaccelerometer. When the body of the accelerometer is subjected to vibration the mass mounted on the crystal wantsto stay still in space due to inertia and so compresses andstretches the piezo electric crystal. This force causes a charge to be generated and due to Newton law F=ma thisforce is in turn proportional to acceleration. The charge outputis either is converted to a low impedance voltage output bythe use of integral electronics (example: in an IEPE accelerometer) or made available as a charge output (Pico-coulombs /g) in a charge output piezo-electric accelerometer.
What are the different types of accelerometer?There are many different type of accelerometers and each has unique
characteristics, advantages and disadvantages. The different typesinclude:
Different technologies• Piezo-electric accelerometers• Piezo-resistive accelerometers• Strain gage based accelerometersDifferent output accelerometers• Charge output• IEPE output (2-wire voltage)• Voltage output (3 wire)• 4-20mA output• Velocity output accelerometersDifferent designs of accelerometer• Shear type design• Single ended compression design• Isolated compression
24
Çok geniş bir frekans aralığında kullanılabilir. Çok geniş bir dinamik ölçüm bölgesinde mükemmel lineer özelliğe sahiptir. ivme sinyali elektronik olarak kolayca integre edilerek hız ve deplasman bilgisine dönüştürülebilir. Çok farklı koşullarda mükemmel doğrulukta titreşim ölçümleri yapmak mümkündür. Kendi kendilerine sinyal ürettikleri için dış güç kaynağına gereksinim yoktur. Hareketli kısımları olmadığı için son derece dayanıldıdır. Titreşimlere karşı son derece duyarlıdır ve (duyarlılık /kütle) oranı yüksektir.
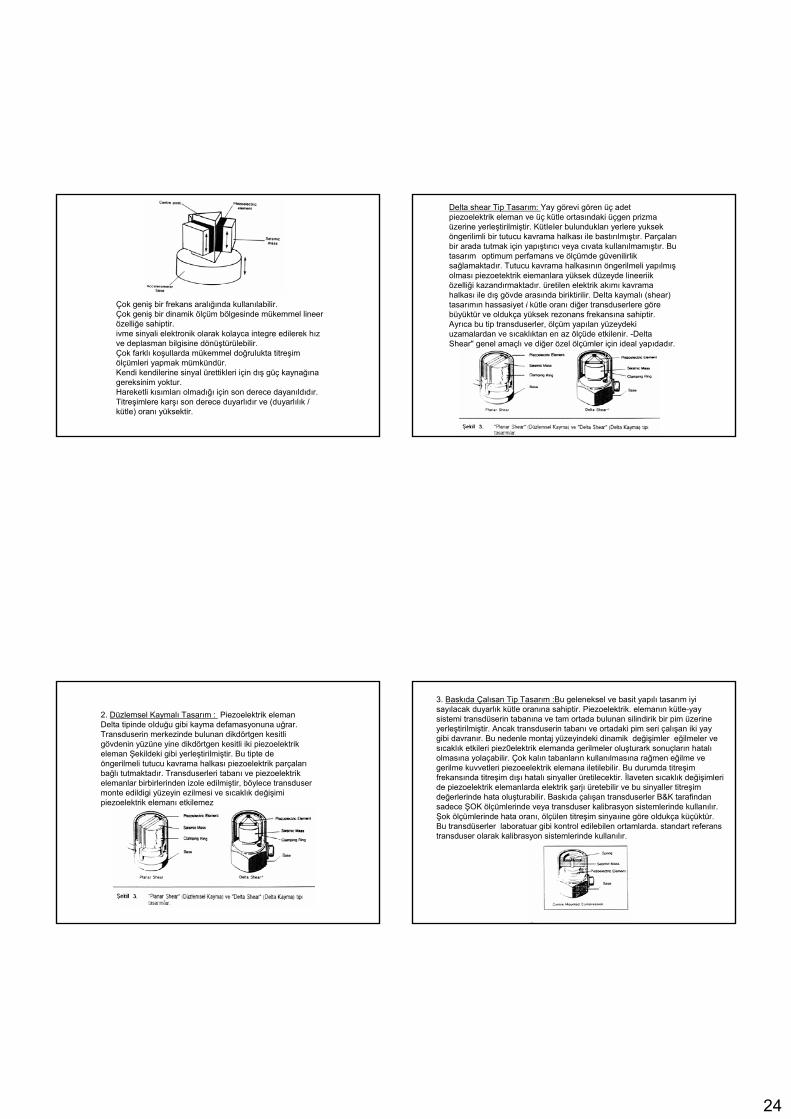
Delta shear Tip Tasarım: Yay görevi gören üç adet piezoelektrik eleman ve üç kütle ortasındaki üçgen prizma üzerine yerleştirilmiştir. KütIeIer bulundukları yerlere yukseköngerilimli bir tutucu kavrama halkası ile bastırılmıştır. Parçalarıbir arada tutmak için yapıştırıcı veya cıvata kullanılmamıştır. Bu tasarım optimum perfamans ve ölçümde güvenilirlik sağlamaktadır. Tutucu kavrama halkasının öngerilmeli yapılmışolması piezoetektrik eiemanlara yüksek düzeyde lineeriiközelliği kazandırmaktadır. üretilen elektrik akımı kavrama halkası ile dış gövde arasında biriktirilir. DeIta kaymalı (shear) tasarımın hassasiyet i kütle oranı diğer transduserlere göre büyüktür ve oldukça yüksek rezonans frekansına sahiptir. Ayrıca bu tip transduserler, ölçüm yapılan yüzeydeki uzamalardan ve sıcaklıktan en az ölçüde etkilenir. -Delta Shear" genel amaçlı ve diğer özel ölçümler için ideal yapıdadır.
2. Düzlemsel Kaymalı Tasarım : Piezoelektrik eleman Delta tipinde oIduğu gibi kayma defamasyonuna uğrar. Transduserin merkezinde bulunan dikdörtgen kesitli gövdenin yüzüne yine dikdörtgen kesitli iki piezoelektrikeleman Şekildeki gibi yerleştirilmiştir. Bu tipte de öngerilmeli tutucu kavrama halkası piezoelektrik parçalarıbağlı tutmaktadır. Transduserleri tabanı ve piezoelektrikelemanlar birbirlerinden izole edilmiştir, böylece transdusermonte edildigi yüzeyin ezilmesi ve sıcaklık değişimi piezoelektrik elemanı etkilemez
3. Baskıda Çalısan Tip Tasarım :Bu geleneksel ve basit yapılı tasarım iyi sayılacak duyarlık kütle oranına sahiptir. Piezoelektrik. elemanın kütle-yay sistemi transdüserin tabanına ve tam ortada bulunan silindirik bir pim üzerine yerleştirilmiştir. Ancak transduserin tabanı ve ortadaki pim seri çalışan iki yay gibi davranır. Bu nedenle montaj yüzeyindeki dinamik değişimler eğilmeler ve sıcaklık etkileri piez0elektrik elemanda gerilmeler oluşturark sonuçların hatalıolmasına yolaçabilir. Çok kalın tabanların kullanılmasına rağmen eğilme ve gerilme kuvvetleri piezoeelektrik elemana iletilebilir. Bu durumda titreşim frekansında titreşim dışı hatalı sinyaller üretilecektir. İlaveten sıcaklık değişimleri de piezoelektrik elemanlarda elektrik şarjı üretebilir ve bu sinyaller titreşim değerlerinde hata oluşturabilir. Baskıda çalışan transduserler B&K tarafindansadece ŞOK ölçümlerinde veya transduser kalibrasyon sistemlerinde kullanılır. Şok ölçümlerinde hata oranı, ölçülen titreşim sinyaıine göre oldukça küçüktür. Bu transdüserler laboratuar gibi kontrol edilebilen ortamlarda. standart referans transduser olarak kalibrasyon sistemlerinde kullanılır.
25
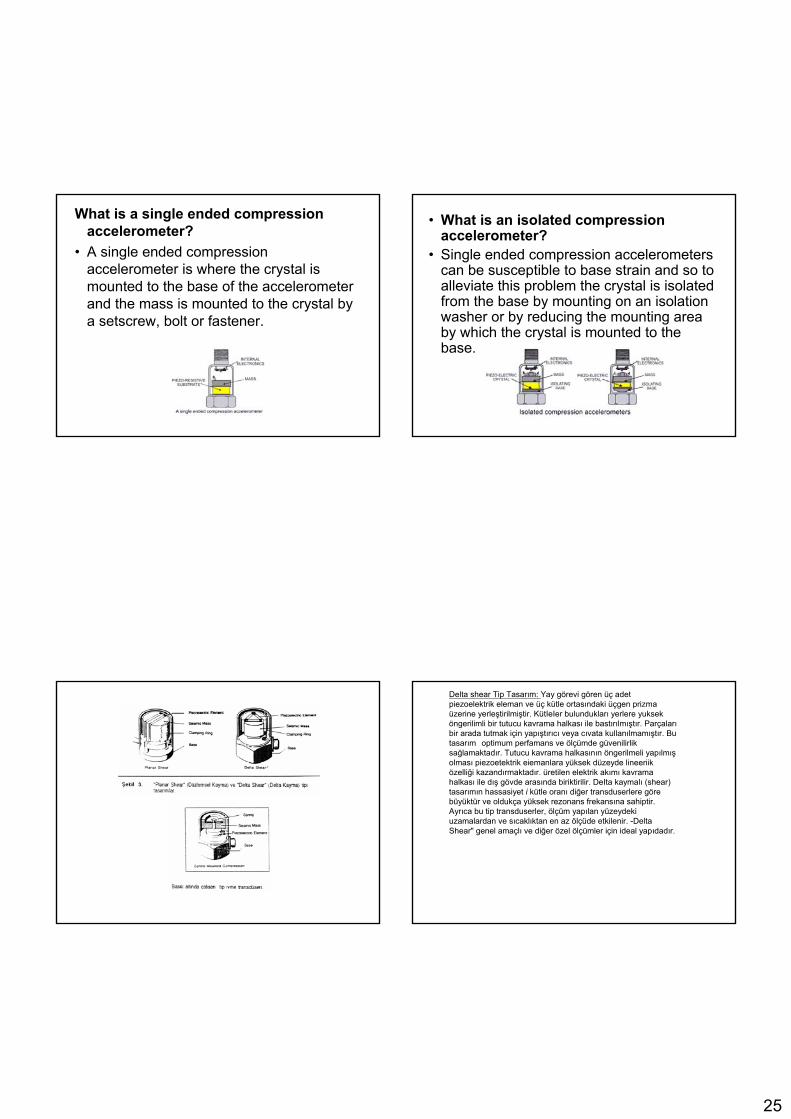
What is a single ended compressionaccelerometer?
• A single ended compressionaccelerometer is where the crystal is mounted to the base of the accelerometerand the mass is mounted to the crystal bya setscrew, bolt or fastener.
• What is an isolated compressionaccelerometer?
• Single ended compression accelerometerscan be susceptible to base strain and so toalleviate this problem the crystal is isolatedfrom the base by mounting on an isolationwasher or by reducing the mounting areaby which the crystal is mounted to thebase.
Delta shear Tip Tasarım: Yay görevi gören üç adet piezoelektrik eleman ve üç kütle ortasındaki üçgen prizma üzerine yerleştirilmiştir. KütIeIer bulundukları yerlere yukseköngerilimli bir tutucu kavrama halkası ile bastırılmıştır. Parçalarıbir arada tutmak için yapıştırıcı veya cıvata kullanılmamıştır. Bu tasarım optimum perfamans ve ölçümde güvenilirlik sağlamaktadır. Tutucu kavrama halkasının öngerilmeli yapılmışolması piezoetektrik eiemanlara yüksek düzeyde lineeriiközelliği kazandırmaktadır. üretilen elektrik akımı kavrama halkası ile dış gövde arasında biriktirilir. DeIta kaymalı (shear) tasarımın hassasiyet i kütle oranı diğer transduserlere göre büyüktür ve oldukça yüksek rezonans frekansına sahiptir. Ayrıca bu tip transduserler, ölçüm yapılan yüzeydeki uzamalardan ve sıcaklıktan en az ölçüde etkilenir. -Delta Shear" genel amaçlı ve diğer özel ölçümler için ideal yapıdadır.
26
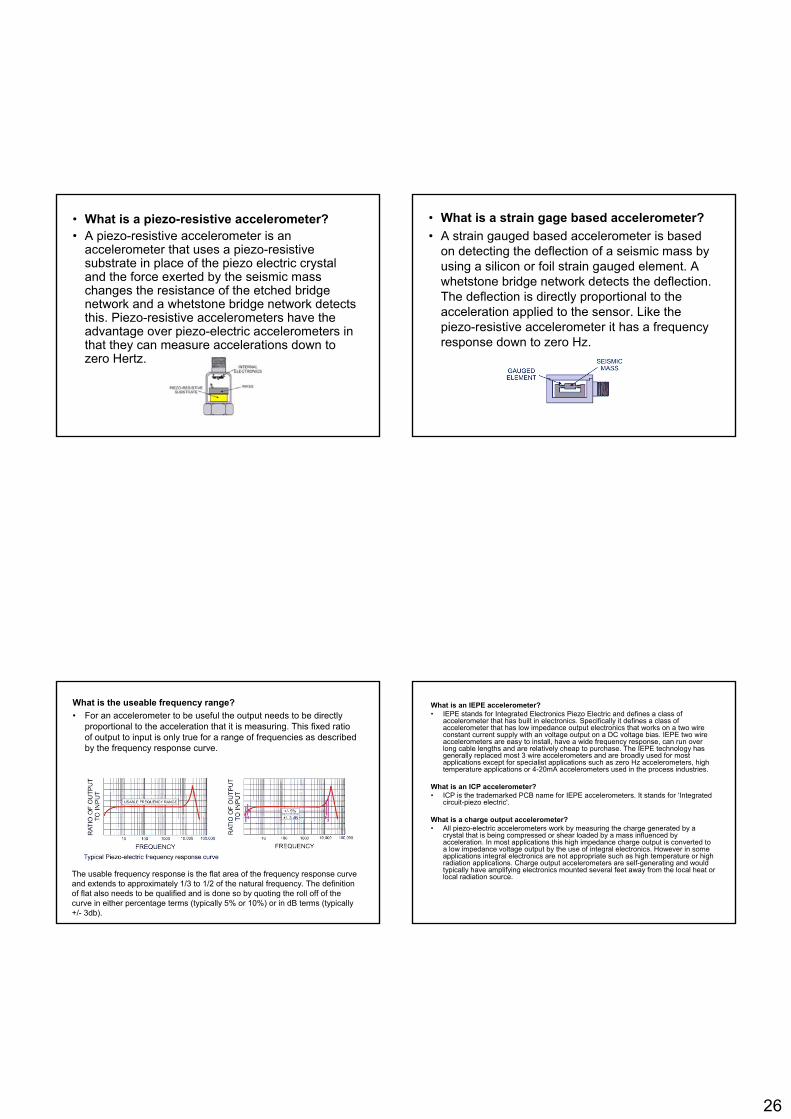
• What is a piezo-resistive accelerometer?• A piezo-resistive accelerometer is an
accelerometer that uses a piezo-resistivesubstrate in place of the piezo electric crystaland the force exerted by the seismic masschanges the resistance of the etched bridgenetwork and a whetstone bridge network detectsthis. Piezo-resistive accelerometers have theadvantage over piezo-electric accelerometers in that they can measure accelerations down tozero Hertz.
• What is a strain gage based accelerometer?• A strain gauged based accelerometer is based
on detecting the deflection of a seismic mass byusing a silicon or foil strain gauged element. A whetstone bridge network detects the deflection. The deflection is directly proportional to theacceleration applied to the sensor. Like thepiezo-resistive accelerometer it has a frequencyresponse down to zero Hz.
What is the useable frequency range?• For an accelerometer to be useful the output needs to be directly
proportional to the acceleration that it is measuring. This fixed ratioof output to input is only true for a range of frequencies as describedby the frequency response curve.
The usable frequency response is the flat area of the frequency response curveand extends to approximately 1/3 to 1/2 of the natural frequency. The definitionof flat also needs to be qualified and is done so by quoting the roll off of thecurve in either percentage terms (typically 5% or 10%) or in dB terms (typically+/- 3db).
What is an IEPE accelerometer?• IEPE stands for Integrated Electronics Piezo Electric and defines a class of
accelerometer that has built in electronics. Specifically it defines a class of accelerometer that has low impedance output electronics that works on a two wireconstant current supply with an voltage output on a DC voltage bias. IEPE two wireaccelerometers are easy to install, have a wide frequency response, can run overlong cable lengths and are relatively cheap to purchase. The IEPE technology has generally replaced most 3 wire accelerometers and are broadly used for mostapplications except for specialist applications such as zero Hz accelerometers, hightemperature applications or 4-20mA accelerometers used in the process industries.
What is an ICP accelerometer?• ICP is the trademarked PCB name for IEPE accelerometers. It stands for ‘Integrated
circuit-piezo electric'.
What is a charge output accelerometer?• All piezo-electric accelerometers work by measuring the charge generated by a
crystal that is being compressed or shear loaded by a mass influenced byacceleration. In most applications this high impedance charge output is converted toa low impedance voltage output by the use of integral electronics. However in someapplications integral electronics are not appropriate such as high temperature or highradiation applications. Charge output accelerometers are self-generating and wouldtypically have amplifying electronics mounted several feet away from the local heat orlocal radiation source.

27
What is dynamic range?• The dynamic range of an accelerometer is the range between the smallest
acceleration detectable by the accelerometer to the largest. A piezo-electricaccelerometer produces a charge proportional the force applied to thecrystal, which due to the seismic mass on the crystal is proportional toacceleration applied. The piezo electric effect can be detected for very smallforces or accelerations all the way through to very large accelerations. Inmost cases the smallest acceleration is dictated by the amplifyingelectronics noise floor and for high g levels to the voltage rail used by thepower supply. The design of the accelerometer will also play a part in whatshock g levels an accelerometer can withstand before the crystal is irreparably damaged or the structure holding the crystal is distorted. Compression accelerometers are the most shock resistant design of accelerometer.
• Accelerometers with integral electronics have a maximum output voltagedetermined by the circuit design and the input voltage. The maximum outputfor an IEPE accelerometer is typically 4-8 volts. An accelerometer with a sensitivity of 100mV/g with electronics that has a maximum output of 5V willobviously have a dynamic range of +/- 50g while an accelerometer of sensitivity of 10mV/g will have a dynamic range of +/- 500g.
What is amplitude linearity?• The amplitude linearity of an accelerometer is the degree
of accuracy that an accelerometer reports the output in voltage terms as it moves from being excited at thesmallest detectable acceleration levels to the highest. This accuracy is qualified by the linearity. Typically theamplitude linearity is 1%. The dynamic range describesthe minimum to maximum accelerations that can be detected. The output of an IEPE accelerometer can typically go from 100 micro g to 500g. This dynamicrange is dependent on the electronics used with theaccelerometer either internal or external, as is the outputlinearity over the dynamic range.
• When should I use a velocity output accelerometer?• Velocity output accelerometers are usually used in condition monitoring
applications where velocity is a much better parameter for judging thehealth of a machine. Doubling of velocity vibration equates to a doubling of the deterioration of the health of the machine. Velocity can also be used in lower frequency applications where the acceleration amplitude of vibrationis too small to measure and the velocity vibration maybe of a higher andmore meaningful value. Velocity vibration accelerometers are only reallyeffective if the frequency of vibration is higher than 2Hz but more ideally 5 Hz.
• How do I choose the sensitivity of an accelerometer?• Accelerometers with integral electronics have a maximum output voltage
determined by the circuit design and the input voltage. The maximum outputfor an IEPE accelerometer is typically 4-8 volts. An accelerometer with a sensitivity of 100mV/g with electronics that has a maximum output of 5V willobviously have a dynamic range of +/- 50g while an accelerometer of sensitivity of 10mV/g will have a dynamic range of +/- 500g If the maximumg levels likely to be experienced is known then dividing this number by 5 volts will give the maximum sensitivity that should be used to get thisdynamic range
• Example: Vibration expected to be seen is 300g. Sensitivity will be 5 divided by 300 which equals 16.6 mV/g. The nearest sensitivity would be a 10mV/g accelerometer.
• What is condition monitoring?• Condition monitoring is where the health of a rotating machine is
monitored using vibration levels. As the health of a machine(example becomes unbalanced, fan blades corrode, bearingsurfaces degrade) deteriorates so the amplitude of the vibration themachine generates increases. By monitoring the vibration levelsover a long period of time this gradual deterioration of the health of the machine can be assessed until the vibration levels get to a pointwhere the machine needs to be taken out of service and overhauled. Analysis of the frequency content of the machine vibration signal willindicate not only that the health of the machine has deteriorated but also root causes can be attributed to the problem.
• Example: An 8 bladed pump running at 6000 rpm (100Hz) willproduce a vibration signal with 100 Hz frequency if it becomesunbalanced, 200 Hz if it becomes mis-aligned 800 Hz if the bladesbecome corroded and 43-47 Hz if the bearings start to go into oilwhirl.
28
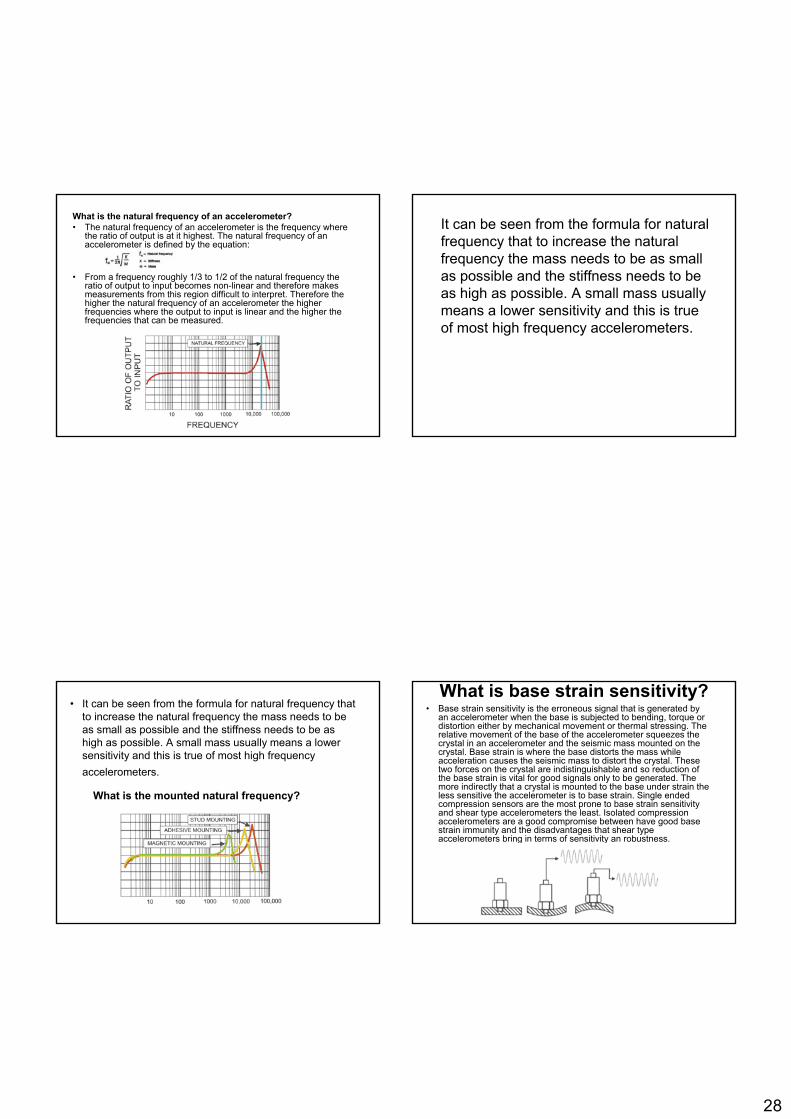
What is the natural frequency of an accelerometer?• The natural frequency of an accelerometer is the frequency where
the ratio of output is at it highest. The natural frequency of an accelerometer is defined by the equation:
• From a frequency roughly 1/3 to 1/2 of the natural frequency theratio of output to input becomes non-linear and therefore makesmeasurements from this region difficult to interpret. Therefore thehigher the natural frequency of an accelerometer the higherfrequencies where the output to input is linear and the higher thefrequencies that can be measured.
It can be seen from the formula for naturalfrequency that to increase the naturalfrequency the mass needs to be as smallas possible and the stiffness needs to be as high as possible. A small mass usuallymeans a lower sensitivity and this is trueof most high frequency accelerometers.
• It can be seen from the formula for natural frequency thatto increase the natural frequency the mass needs to be as small as possible and the stiffness needs to be as high as possible. A small mass usually means a lowersensitivity and this is true of most high frequencyaccelerometers.
What is the mounted natural frequency?
What is base strain sensitivity?• Base strain sensitivity is the erroneous signal that is generated by
an accelerometer when the base is subjected to bending, torque ordistortion either by mechanical movement or thermal stressing. Therelative movement of the base of the accelerometer squeezes thecrystal in an accelerometer and the seismic mass mounted on thecrystal. Base strain is where the base distorts the mass whileacceleration causes the seismic mass to distort the crystal. Thesetwo forces on the crystal are indistinguishable and so reduction of the base strain is vital for good signals only to be generated. Themore indirectly that a crystal is mounted to the base under strain theless sensitive the accelerometer is to base strain. Single endedcompression sensors are the most prone to base strain sensitivityand shear type accelerometers the least. Isolated compressionaccelerometers are a good compromise between have good basestrain immunity and the disadvantages that shear typeaccelerometers bring in terms of sensitivity an robustness.
29
What is cross sensitivity ortransverse sensitivity?
• An accelerometer produces a charge outputwhen the crystal is compressed. That samecrystal also produces a charge, albeit a muchsmaller one, when a shear load is exerted on the crystal. The accelerometer thereforeproduces a charge when it is vibrated in theaxis 90 degrees to the main axis of measurement, which is indistinguishablefrom acceleration in the main axis. Conversely shear type accelerometersproduce an erroneous signal when theyexperience cross axis acceleration only thistime it loads the crystal in compressivemode.
• The sensitivity of the accelerometer to a transverse vibration is known as thetransverse sensitivity and is typically lessthan 5% of the sensitivity to an "on axis" acceleration.
• The mounting of an accelerometer effects itsfrequency response. The mounted natural frequencyis dependent directly on the stiffness of themounting. The higher the stiffness the more themounted natural frequency approaches itsmaximum. The least stiff mounting of an accelerometer is magnetic mounting and the higheststiffness is using a high tensile setscrew tightened tothe correct torque mounted on a hard flat surface. Other mounting methods come in between these twoextremes.
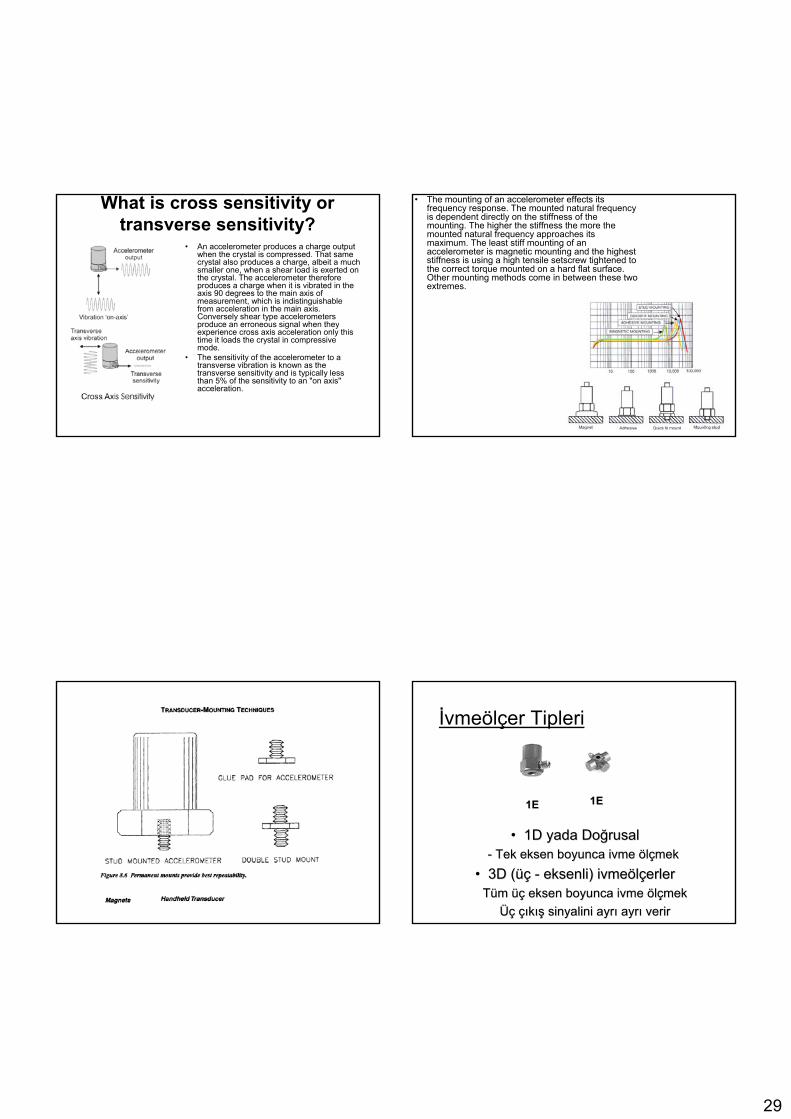
İvmeölçer Tipleri
• 1D 1D yada Doyada Doğğrusalrusal-- Tek eksen boyunca ivme Tek eksen boyunca ivme ööllççmekmek
• 3D (3D (üçüç -- eksenlieksenli) ) ivmeivmeööllççerlererlerTTüüm m üçüç eksen boyunca ivme eksen boyunca ivme ööllççmek mek
ÜçÜç ççııkkışış sinyalini ayrsinyalini ayrıı ayrayrıı verirverir
11EE 11EE
30
İvmeölçer Parametreleri• Ölçülebilir Sınır
Maksimum ölçülebilir ivmeler- “ + g “ olarak verilir
• Hassasiyet- Çıkış voltajı ile ivmenin “ g “ oranı
- “ mV/g “ olarak verilir• Rezonans Frekansı
- İvmeölçerin ikaz verdiği Frekans- “ kHz “ olarak verilir
• Birçok İvmeölçerin 2 ila 20 miliamperlikçalışma Akımına ihtiyacı vardır
• Devre bileşenleri İvmeölçerleri tam randımanlı olarak sürebilmelidir
• 3 Genel Tip vardır – Pil ve Direnç , Pil ve Diot ile Aktif Güç Kaynağı
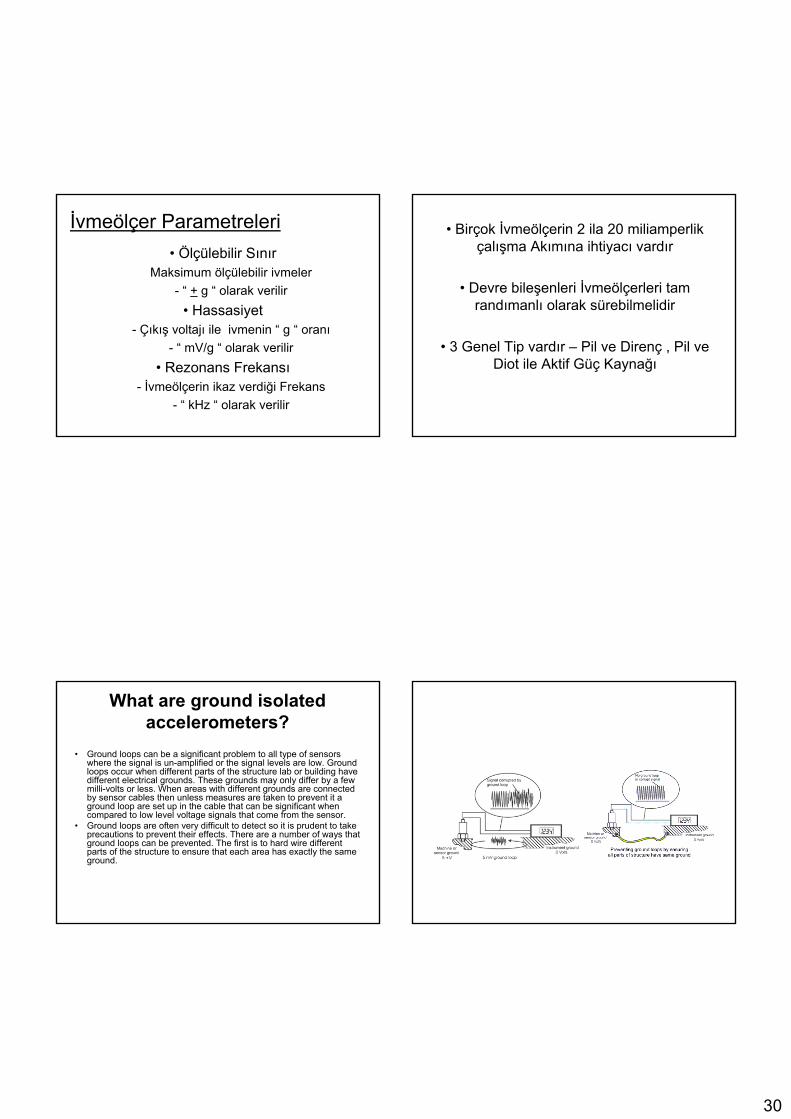
What are ground isolatedaccelerometers?
• Ground loops can be a significant problem to all type of sensorswhere the signal is un-amplified or the signal levels are low. Groundloops occur when different parts of the structure lab or building havedifferent electrical grounds. These grounds may only differ by a fewmilli-volts or less. When areas with different grounds are connectedby sensor cables then unless measures are taken to prevent it a ground loop are set up in the cable that can be significant whencompared to low level voltage signals that come from the sensor.
• Ground loops are often very difficult to detect so it is prudent to takeprecautions to prevent their effects. There are a number of ways thatground loops can be prevented. The first is to hard wire differentparts of the structure to ensure that each area has exactly the sameground.
31
• Ensuring different parts of a plant have the same ground may not be so easyparticularly when long distances are involved or structures carry noisegenerating machinery. In these cases it may be better not to eliminate groundloops but to prevent their effects influencing the sensor output. This can be achieved by mounting the accelerometer on an electrically isolated mountingstud. In this way the accelerometer sits on a locally constructed instrumentground and ensures that now ground loop exists between this and themeasuring instrument.
• The same effect as mounting the accelerometer on an electrically isolatedmounting base can be achieved by isolating the accelerometer internals fromthe outer case of the accelerometer. This is done by the manufacturer. Mounting the accelerometer on an isolating base or internally isolating theaccelerometer does reduce the stiffness of the accelerometer and thereforereduces the mounted natural frequency. It is for this reason that not allaccelerometers come automatically with internal isolation.
Ground Loop• Minimum gürültü sağlar
• Uygunsuz yapılırsa, hatalara neden olur
• Doğru Topraklamanın basitçe saptanması
- Sensör hareketli ise, sistem çıkışıtopraklanmalı
- Sensör topraklanmışsa, sistem girişi topraklanmamalı
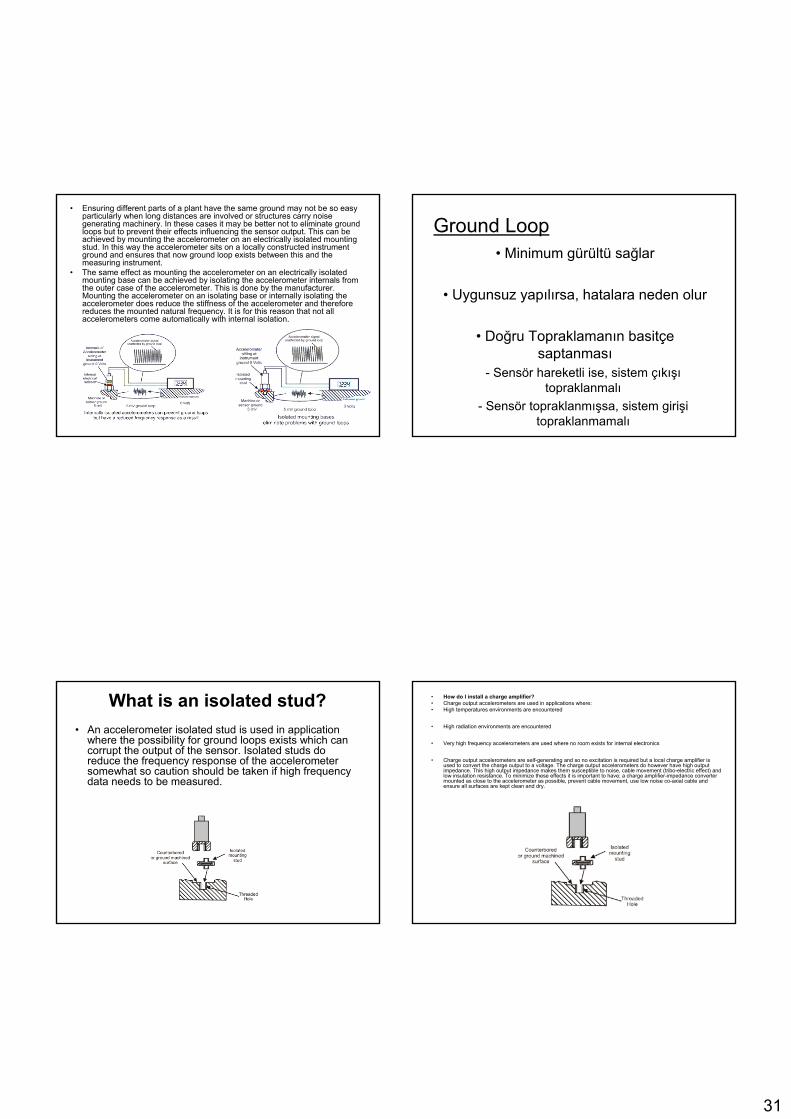
What is an isolated stud?• An accelerometer isolated stud is used in application
where the possibility for ground loops exists which can corrupt the output of the sensor. Isolated studs do reduce the frequency response of the accelerometersomewhat so caution should be taken if high frequencydata needs to be measured.
• How do I install a charge amplifier?• Charge output accelerometers are used in applications where:• High temperatures environments are encountered
• High radiation environments are encountered
• Very high frequency accelerometers are used where no room exists for internal electronics
• Charge output accelerometers are self-generating and so no excitation is required but a local charge amplifier is used to convert the charge output to a voltage. The charge output accelerometers do however have high outputimpedance. This high output impedance makes them susceptible to noise, cable movement (tribo-electric effect) andlow insulation resistance. To minimize these effects it is important to have; a charge amplifier-impedance convertermounted as close to the accelerometer as possible, prevent cable movement, use low noise co-axial cable andensure all surfaces are kept clean and dry.
32
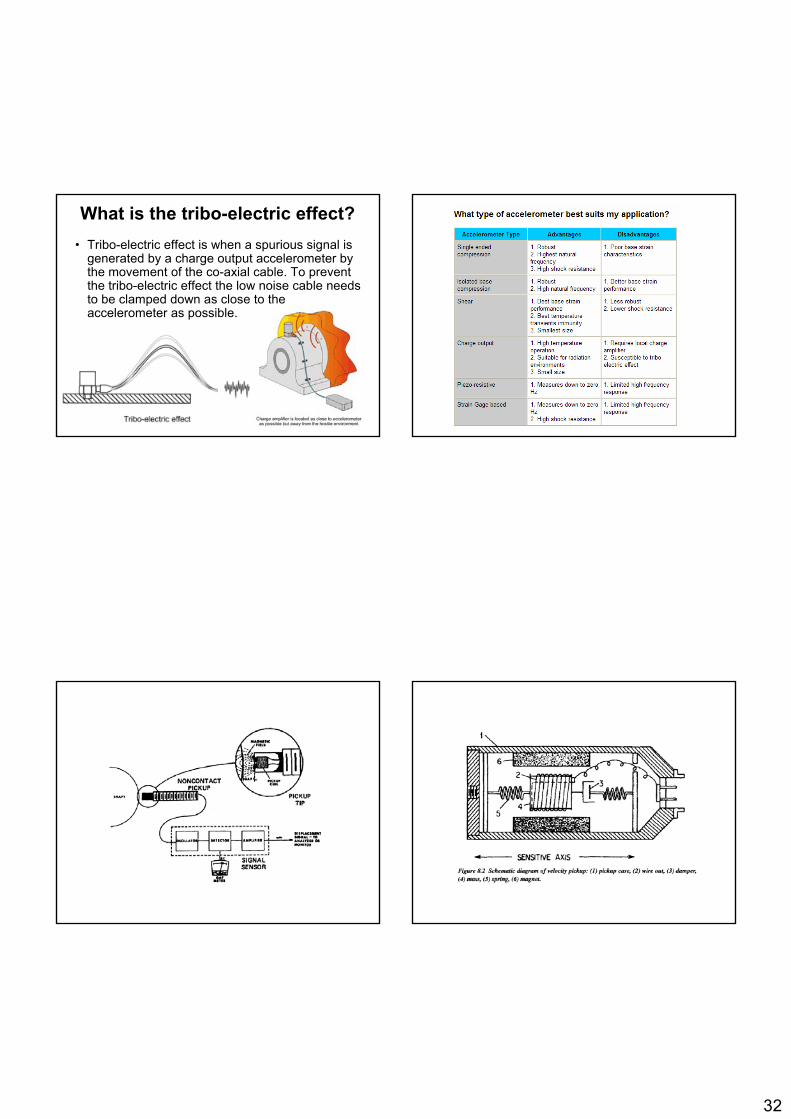
What is the tribo-electric effect?• Tribo-electric effect is when a spurious signal is
generated by a charge output accelerometer bythe movement of the co-axial cable. To preventthe tribo-electric effect the low noise cable needsto be clamped down as close to theaccelerometer as possible.

33