Embed Size (px)
Citation preview

ED 418 984
AUTHORTITLE
INSTITUTIONSPONS AGENCY
REPORT NOPUB DATENOTEAVAILABLE FROM
PUB TYPEEDRS PRICEDESCRIPTORS
IDENTIFIERS
ABSTRACT
DOCUMENT RESUME
TM 028 263
Kaufman, PhillipLinking Student Data to SASS: Why, When, How. Working PaperSeries.MPR Associates, Berkeley, CA.National Center for Education Statistics (ED), Washington,DCNCES-WP-96-231996-10-0026p.
U.S. Department of Education, Office of Educational Researchand Improvement, National Center for Education Statistics,555 New Jersey Avenue, N.W., Room 400, Washington, DC20208-5652.Reports Evaluative (142)MF01/PCO2 Plus Postage.Cost Effectiveness; Data Analysis; *Data Collection;Databases; Elementary Secondary Education; *LongitudinalStudies; *National Surveys; *Research Methodology; *StudentCharacteristics*Linkage; National Assessment of Educational Progress;National Education Longitudinal Study 1988; *Schools andStaffing Survey (NCES)
This paper considers the feasibility of linking a studentdata sample with the Schools and Staffing Survey (SASS) teacher andadministrative data. The National Center for Education Statistics (NCES) hasfrom time to time considered linking their student-based elementary andsecondary surveys to the school- and teacher-based surveys. Speculation onthe feasibility of linking datasets is of particular importance in thecurrent climate of budgetary constraints and distrust of federal datacollection. The rationale for linking a student data collection in SASS isdiscussed, and some options for collecting these data are explored, whetherlinking the National Assessment of Educational Progress to the SASS orlinking a new National Education Longitudinal Study with SASS. The argumentfor attaching a longitudinal component to the SASS response rests on severalpremises. Doing this could measure the types of student data deemed mostworthwhile, while satisfying the two criteria for sensible merger: producingsome cost benefit and engendering an analytical payoff. Of the variousoptions available, merging a new National Education Longitudinal Study andthe SASS provides the most benefit to the whole educational policy community.(Contains six references.) (SLD)
********************************************************************************
Reproductions supplied by EDRS are the best that can be madefrom the original document.
********************************************************************************

.
NATIONAL.:70ENTER F
Working a er - _ 4:::rilrNIT'6' 7342.7..-ru
1 ::',...:ri.;:.' ,
I --. --..: .
.. .. .
.,.
I
I .....-, , ''.- ., .,...
,
.
-; ' "-- tt. -Iji`
Linking Student Data to SASS: Why, When, How
Working Paper No. 96-23
'44
October 1996
?O: ;k:
it'-f s'Ikteffratyre,.11,
-i:,:-',?-',,,,,v,'-74,41.-,,"11.
'') .;4. "zit., ' -,,, , -4 &4, -... - ., , k .u7: ,.,, ,..y,,,,,,,,v,%,;!..,,,,,.
4'.:7 ' 'ZiFyjrir.,41 '. i....
',..'.'.. ,....
'...4
4
41'.4,`it ...44,1tifelir NP-441. .
z,;-.
4..-.10Wra
qtreviratf44..tAl.W-M-kt
-:.,,,,....14-4:y.t'?:',.:11;;;4'41V zslisl'4i..
....:'.: 0,,Fi;*ff.4-::,,,,,fL.;-:::3,,2,..,.-..:.
L. -:..- :....-,.". ', ..,: '.. ''.',-z.', -, :,.., ,..:. - -.--L,.- ,,-..- .. -- L.-- ''''''' --.' 1 ''--, ';'-'"'r'' l'iri;_tf-Yr.i.i.'-:.!,..,........_____,,_,..4.`--)-'')"4-1.- -I- - .4s.,4::tr4 Points of view or opinions stated in this-',.. BEST COPY AVAILABLE i'.t-4.!,:1f t-?')
official OERI position or policy.document do not necessarily represent.....: :', ..., -'n...,...-,.,.., 4
-; -; si.,..-:.- 'U S. Department of .Education ....,.,.,..,.........,"---4.g...-ic:::4,-.4,V,,,,kki,.....,.,;,-:.,,v; , ;., : -i,-...f.:4., Office of Educational Research and Improvement --s............. -.., . ,.,...- ..:...1.;,;.,,,,,,,,,,...., .... .... - ...,,,,,,.>:-. ..--''` '4'4'7- r;'' ',P. .4,,;'i:!,*17*!:,,,:,;.:1 : f.::,.. . ."' . ..' -%"..?::::,';':::%Z.,V-, '''''' ""1.....;..F:
, - . . . , .. . . . .. . .. . .
. . .
.. . .
. % .: . ,'.. 7 ... i ' .1 ? , '
U.S. DEPARTMENT OF EDUCATIONOffice of Educational Research and Improvement
EDUCATIONAL RESOURCES INFORMATIONCENTER (ERIC)
elThis document has been reproduced asreceived from the person or organizationoriginating it.
ID Minor changes have been made toimprove reproduction quality.

It
I
I
I
D
Linking Student Data to SASS: Why, When, How
Working Paper No. 96-23 October 1996
Contact: Dan KasprzykSurveys and Cooperative Systems Group(202) 219-1588e-mail: danielkasprzykoged.gov
3
0
I
U.S. Department of EducationRichard W. RileySecretary
Office of Educational Research and ImprovementSharon P. RobinsonAssistant Secretary
National Center for Education StatisticsPascal D. Forgione, Jr.Commissioner
Surveys and Cooperative Systems GroupPaul D. Planchon
hog" Associate Commissioner
I
I
The National Center for Education Statistics (NCES) is the primary federal entity for collecting, analyzing,and reporting data related to education in the United States and other nations. It fulfills a congressionalmandate to collect, collate, analyze, and report full and complete statistics on the condition of educationin the United States; conduct and publish reports and specialized analyses of the meaning and significanceof such statistics; assist state and local education agencies in improving their statistical systems; and reviewand report on education activities in foreign countries.
NCES activities are designed to address high priority education data needs; provide consistent, reliable,complete, and accurate indicators of education status and trends; and report timely, useful, and high qualitydata to the U.S. Department of Education, the Congress, the states, other education policymakers,practitioners, data users, and the general public.
We strive to make our products available in a variety of formats and in language that is appropriate to avariety of audiences. You, as our customer, are the best judge of our success in communicatinginformation effectively. If you have any comments or suggestions about this or any other NCES productor report, we would like to hear from you. Please direct your comments to:
National Center for Education StatisticsOffice of Educational Research and ImprovementU.S. Department of Education555 New Jersey. Avenue, NWWashington, DC 20208
Suggested Citation
U.S. Department of Education. National Center for Education Statistics. Linking Student Data to SASS: Why, When, How,Working Paper No. 96-23, by Philip Kaufman. Project Officer, Daniel Kaspryzk. Washington, D.C.: 1996.
October 1996
4
Foreword
Each year a large number of written documents are generated by NCES staff andindividuals commissioned by NCES which provide preliminary analyses of survey results andaddress technical, methodological, and evaluation issues. Even though they are not formallypublished, these documents reflect a tremendous amount of unique expertise, knowledge, andexperience.
The Working Paper Series was created in order to preserve the information containedin these documents and to promote the sharing of valuable work experience and knowledge.However, these documents were prepared under different formats and did not undergo vigorousNCES publication review and editing prior to their inclusion in the series. Consequently, weencourage users of the series to consult the individual authors for citations.
To receive information about submitting manuscripts or obtaining copies of the series,please contact Ruth R. Harris at (202) 219-1831 or U.S. Department of Education, Office ofEducational Research and Improvement, National Center for Education Statistics, 555 NewJersey Ave., N.W., Room 400, Washington, D.C. 20208-5654.
Susan AhmedChief Mathematical StatisticianStatistical Standards and
Services Group
Samuel S. PengDirectorMethodology, Training, and Customer
Service Program

Linking Student Data to SASS: Why, When, How
Phillip KaufmanMPR Associates, Inc.
October 1996
6

Table of Contents
Page
Foreword iii
Some Ground Rules 1
Why Collect Individual Student Data through SASS? 3
Linking NAEP to SASS 5
Linking a New NELS with SASS 7
The Design of the National Longitudinal Study of 1998 10
Periodicity of SASS 11
Summary 11
Conclusion 12
References 13
Endnotes 14

LINKING STUDENT DATA TO SASS: WHY, WHEN, HOW
Phillip Kaufman, MPR Associates, Inc.
This paper considers the feasibility of linking a student data sample with the SASS teacherand administrative data. NCES has from time to time considered linking their student-basedelementary and secondary surveys to the school- and teacher-based surveys. These thoughtshave usually been centered on the analytical power that such a student/teacher data set wouldhold. Budgetary concernsin terms of both fiscal program budgets and burdenbudgetshave also been important, but the analytical justification of linking student data toteacher data has generally taken precedence. However, speculation on the feasibility oflinking datasets is of particular importance now in the current climate of budgetaryconstraints and distrust of federal data collection among segments of the public.
NCES (and indeed all of the governmental statistics community) is entering an era when hardchoices need to be made concerning data collection and reporting. In an era when we faceincreasing demands for more and better data from a wide variety of educational policymakersand researchers, we are also being asked to do more with fewer resources in terms of bothprogram money and personnel. Thus it may no longer be feasible to collect data on schools,teachers, and programs through the Common Core of Data and the Schools and StaffingSurvey, conduct another National Assessment, continue to track the early childhood cohort ofstudents (in ECLS), and launch a new longitudinal study of high school students. If it is notfeasible to collect all of these data as they have been collected in the past (regardless of theiranalytical merit), it seems to me that ways must be found to collect all of these data withnew methods or systems. Unless we think hard about these issues, opportunities may be lostand we will create gaps in our knowledge about American schools and the impact of the lastfew decades of reform. Old ways of conducting the business of data collection may have tobe modified in light of the increased budgetary constraints imposed by Congress and thePresident and the simultaneous increase in analytical demands of the public.
Some Ground Rules
In this paper I discuss the rationale for linking a student data collection in SASS and thenexplore several options for collecting these data. However, before launching into the mainbody of the paper, I would like to lay out a few principles to organize my discussion of theseissues. These guidelines have to do with (1) what dimensions of student data should becollected, and (2) what criteria should be used to judge the merit of the proposed new datacollection system.
Dimensions of student data. As I will try and develop further in this paper, it seems to methat at least three aspects of students are important to track and should be a part of anysystem of student data. While perhaps not necessary elements of a SASS student component,
1

these elements should be (and are) part of the overall data strategy for NCES and should beconsidered when thinking about what kind of student data should be attached to SASS.These elements are: overall academic performance, growth in achievement, and successfultransition into and through the increasing demands of schooling and work.
Among these three, measuring overall academic achievement is perhaps most important (forwhy else can we justify public and private investment in schools) and has traditionally hadthe most attention. Both NAEP and the longitudinal studies have made estimates of overallachievement levels of various groups of students over time. Accurately measuring growth inachievement (especially in observational/survey data) is perhaps the most challenging. Thishas been done by analysts using both HS&B and NELS:88. Examining critical transitionshas historically received the least attention, but has come under increasing scrutiny as theeducational community has realized the importance of studying the life-course and its impacton education (Pallas, 1993, p. 20). It seems to me that three main transition periods areimportant to keep in mind while considering student data within SASS: 1) the passage frommiddle school to high school, 2) the path through high school to graduation, and 3) thetransition from graduation to school or work.
I
Evaluative criteria. While keeping these three elements of student data in mind, I need to setup a few criteria to judge the worthiness of any proposal to linking individual data withSASS. It seems to me that for such a merger to make sense, it must pass at least one of twotests. First, it must make sense in terms of efficiencies of administration or respondentburden. That is, it must prove to save budgetary resources (either program budget or burdenbudget). Secondly, it should make analytical sense. That is, the merger should result in adata system that allows more comprehensive and sensible inferences to be drawn.
To summarize, I start this discussion considering three main elements of student data and twoprinciples of an adequate argument for linking student data within SASS:
Elements of a student data system:
overall academic performance,growth in achievement,and successful transition through the increasing demands of schooling and work.
Criteria for judging the adequacy of including a student component in SASS:
The merger should produce some cost benefit, andThe merger should engender an analytical payoff.
All of the above must also be considered in the context of the mission of NCES (as Iparaphrase it): 1) providing to the public accurate information on the "Condition ofEducation," 2) producing policy-relevant but policy-neutral research reports on currentand/or enduring issues in educational policy, and 3) providing databases that other analysts

can use as research tools in their own policy work. The data needs differ for these threefunctionsranging from fairly descriptive data for function 1 to data for function 3 with thepotential for multivariate analysis and "cautious causal" analysis.
Why Collect Individual Student Data through SASS?
Much of the data that NCES collects are not on individual students, but are on characteristicsof schools and other educational institutions. For example, SASS now collects data onschool districts, schools, principals, and individual teachers. Detailed information isavailable on characteristics of the curriculum, qualifications of teachers, school and districtlevel policies and practices. Traditionally, what student data have existed in SASS weregenerally aggregated to the school level before being captured. For example, percent ofstudents receiving free lunch, percent of students of various racial-ethnic groups, etc., havebeen attached to the school files since the first cycle of SASS.
However, while it is important to be able to accurately measure and track schools, teachers,and curriculum practices, these data provide the context for measuring the main componentof educationstudent achievement, growth, and progress. As the nation tries to assess andtrack the implementation of school reform, the data on schools and teachers do providevaluable indicators of the extent of reformand these data have been used effectively overthe last decade for this purpose. However, these data are much more policy relevant whenused in the context of seeing how they are related to individual student achievement, growth,and experiences.
It is possible to attach to SASS additional aggregate measures of student characteristics andoutcomes. In fact, this is the approach advocated by Don McLaughlin in his response to anearlier version of this paper. McLaughlin makes the case for aggregate data based on thetremendous improvements in the assessment practices of many state departments ofeducation. He advocates using these state assessment data (presumably available for eachschool in SASS) by linking them to the state NAEP assessment. Dave Thissen has conductedsuch equating for the North Carolina state assessment.
I appreciate McLaughlin's contribution to this discussion and his comments on using stateassessments are well reasoned. However, as he acknowledges, cross-sectional data onstudent outcomes is less interesting than longitudinal data (and, in my opinion may not beworth the effort of collecting at all). Collecting longitudinal aggregate data on studentachievement within schools is of more interest, but (again in my opinion) not as useful ascollecting individual student data. That is, aggregate test scores or mean outcomes do notcapture the individual variation in achievement that traditionally has been of such interest.
For example, the variance of test scores within schools has been used as an outcome measurein assessing the effectiveness of schools. High mean test scores may be due to the school'sefforts at increasing the learning of students already achieving at a high level or may be due
3
10
to the school's successful attempts at raising the scores of students at the bottom of theability ladder. Mean scores mask these important differences in the impact of school policiesand practices. Furthermore, the transitional experiences and out-of-school experiences are soimportant to those educational outcomes. Therefore, while it may be worthwhile for SASSto explore the possibility of attaching aggregate and longitudinal assessment data to theirregular data collection, it seems to me that still accurate estimates of the associations ofteacher and school characteristics on student outcomes necessitates the linking in some wayof individual students (or similar groups of students) with individual schools, teachers, orpolicies (or similar groups thereof).
Of course, an expansion of the current SASS student survey (based on administrative recordsof students of sampled teachers) could add immeasurably to the analytical power of SASS.This option would build on the current efforts to include student data in SASS. Whilecurrent student samples would have to be increased to be representative of the school, it stillseems reasonable that this would be the most cost effective choice. However, it is perhapsthe least effective analytically. Only limited kinds of data could be collected byadministrative recordsrace-ethnicity, sex, absences, maybe grades. Test score data thatwould be comparable across schools would not be available. Furthermore, while data ondropout status may be available from administrative records, we have known for a long timethat these data are unreliable as indicators of student status. They may be reliable indicatorsof what that school thinks is the status of the student, but that student may have enrolled inanother school (perhaps an alternative school) or may have taken the GED and received analternative credential. Student data would also be cross-sectional and vulnerable to all of theweaknesses of cross-sectional data.
Thus, attaching only individual administrative student statistics to school and teacher datawould miss invaluable insights that are derived from observing student outcomes andtransitions in the context of student's prior experiences, aptitudes, and ability levels inschooldata that can only be measured through individual student surveys. Administrativedata also would fail to capture or measure the impact of the transitions that students makethrough different schools and classrooms to the world of work and family life. Clearly,while collecting student data through administrative records may be cost effective, they donot provide the kind of data that add as much to the analytical power of SASSonlyindividual student data can do this.
Over the years, NCES has relied primarily on two vehicles for collecting data on individualstudentsthe National Assessment of Educational Progress (NAEP) and the system oflongitudinal studies including the National Longitudinal Study of 1972 (NLS:72), the HighSchool and Beyond study (HS&B), and the National Education Longitudinal Study of 1988(NELS:88). As an integral part of these data collections, individual student data have beendirectly linked to data about the student's teacher, classroom, and school. NAEP and thelongitudinal studies accomplish this by including school and teacher questionnaires along withstudent background and assessment data. Data on student outcomes can therefore be linkedwith data on educational context.
4
11
S
I
I
However, much of the school, teacher, and classroom data collected by the student-basedsurveys are collected in more breadth and depth in SASS, or in any case is redundant withdata collected by SASS. Furthermore, SASS collects data about schools, teachers, and, mostimportantly, school districts that are not collected by NAEP or the typical longitudinal study.In a time of tight budgets (that may become even leaner) a reasonable question is why notborrow the strengths of both types of surveys and link the more detailed student data NAEPor a NELS to the richer teacher, school, and district level data in SASS? In this manner eachmay provide contextual data to better interpret the other and possibly reduce the overallrespondent burden (although perhaps increasing the burden on those sampled)thus fulfillingthe requirement I set for myself in the introductory section of this paper. This is the topic towhich I will turn next.
Linking NAEP to SASS
Advantages of a Linkage with SASS
NAEP has several distinct advantages over a NELS in such a linkage. The primaryadvantage is in the content detail that is provided in the assessment and the age or gradecoverage available in NAEP. Due to an adaptation of matrix sampling called balancedincomplete block (BIB) spiraling, the design of NAEP allows for broad coverage ofcurriculum content while minimizing the burden to individual students. For example, whileno student takes all test items, the 1992 NAEP mathematics assessment contained 178 itemsat grade 4, 205 items at grade 8, and 201 items at grade 12. This allows reliable estimatesacross 5 content areas in mathematics as well as 3 ability areas. (The mathematicsassessment in NELS:88 in contrast, contains only 40 items and 5 proficiency levels.)
NAEP also includes a student questionnaire that solicits background information on eachstudent. NAEP is built to obtain good estimates of proficiencies in a variety of areas forgroups of students. One of the primary strengths of NAEP is its ability to track the overallachievement levels of U.S. students over decades of time. From the early 1970s NAEP hasreported on the mathematics and reading achievement of elementary, middle school, and highschool students. This has provided educational policymakers and the general public with animmeasurably valuable tool in monitoring the health of our educational system.
I
Weaknesses of a Linkage with SASS
While NAEP has some obvious strengths as a candidate for merger with SASS it also hasseveral weaknesses. Those aspects of NAEP that do not lend themselves to a merger withSASS are analytical more than procedural. For example, the main weakness of NAEP is thatit is not longitudinal. Merging a cross-sectional SASS and a cross-sectional NAEP wouldstill result in a cross-sectional survey. While the cross-sectional design of NAEP allows forrich data for descriptive indicator work, the merged data set with its rich contextual data andassessment data would still be of little use in producing valid analysis of the association of
school policies and practices. In fact, the existence of such a dataset may actually encourage"invalid but potentially influential studies of schools effects that could seriously distortpolicy."' That is, secondary analysts (or, with due apologies to William Raspberry, acolumnist looking at published NAEP reports) could make erroneous conclusions aboutschool policy based on the real but misleading associations in the data.
Another analytical weakness of NAEP is that it does not contain good measures of studentsocioeconomic status' (and may never contain such measures). Without a measure of thiskind, it is difficult to accurately describe the contribution of school process and policyvariables on student outcomes. Most of these process variables are related to studentsocioeconomic status and/or student body socioeconomic status. Again, invalid butpersuasive inferences could be drawn from these data.
However, while socioeconomic status is a prominent gap in the student background variablesprovided by NAEP, it is only one of several variables that one would want to collect andmeasure in order to make satisfactory inferences from associations found in the data betweenachievement levels and school characteristics and practices. These variables include, but arenot limited to self-concept, attitudes toward school, and peer group attitudes and opinions.
As mentioned above, one of the major contributions of NAEP is the trend data that itprovides on student achievement in the United States. This strength of NAEP however,proves to be one of the greatest arguments for not linking it to SASS. It seems unreasonableto expect that such a linkage could be done without some modification of the design ofNAEPeither in its sampling design or its administration design. Such changes in thedesign of NAEP could result in changes in the estimated proficiency levels in the UnitedStates.' In addition, SASS is a fairly new and dynamic dataset. Again, given theimportance of the NAEP time series, one would want to be very cautious in any changes tothe design of SASS which would effect the design of NAEP, in either content or samplingdesign. Therefore, locking the design (and administration) of SASS to NAEP would makefuture changes in SASS very difficult. For example, currently NCES data collections poorlymeasure the classroom experiences of students. That is, while being able to describeeducational inputsstudents, teachers, schoolsthey do not measure educational processeswellwhat actually goes on inside the classroom. There would be many issues inincorporating a sample of classrooms within the design of SASSincluding preserving thetrend data of schools and teachers from earlier rounds of SASS. Adding the encumbrance ofinsuring that the trend data from NAEP is also preserved would make this task even moredifficult.
Furthermore, while merging the two surveys could produce savings in total respondentburden to the educational system, it almost certainly would increase respondent burden forindividual schools and teachers that are sampled in the merged survey system. This couldresult in lower response rates and threaten the data quality for both surveys. NAEP hastraditionally relied on high response rates to insure the quality of the trend data. Again, in
6
111
my opinion the integrity of these data is too important to jeopardize in a SASS/NAEPmerger.
The NAEP emphasizes the production of reliable estimates of national and state achievementlevels. Consequently, NAEP does a good, but not perfect, job of estimating the first elementof student data I outlined abovemeasuring overall student achievement. However, thestrength of NAEP is in measuring aggregate-level measures of proficiency and not individualor school-level measures of proficiency. The capture of individual proficiencies orachievement levels has never been the main goal of NAEP. Given the complex nature of theplausible value methodology, individual or small group proficiencies are measured with agood deal of measurement error.
NAEP is also a survey that emphasizes content depth over breadth of background variables.The burden budget of NAEP goes into accurately measuring content. Student backgroundcoverage is not ignored, but certainly has less emphasis than in the longitudinal studies. Thelongitudinal studies, on the other hand, have had somewhat different goals. For example,while NELS:88 also aspired to provide accurate estimates of group proficiencies, it had theadded burden of obtaining accurate estimates of school and individual level proficiencies andindividual growth. There was also the emphasis in NELS:88 on the measurement of avariety of student educational outcomes and not just academic achievement. To controlrespondent burden, the academic assessment tools in NELS:88 had to be much shorter inscope and content than the NAEP assessment. NAEP puts its burden dollars in the depth ofthe content while NELS:88 put its burden dollars in breadth of outcomes and backgroundinformation.
Furthermore, because NAEP does not measure students longitudinally, it does not do a goodjob of measuring (and does not attempt to measure) the other two elements of my list ofstudent data abovegrowth in achievement, and successful transitions through the increasingdemands of schooling and work. Longitudinal studies are needed to track these types ofoutcomes. For these reasons a new NELS (or some modification of NELS) may be a bettercandidate for merger with SASS. It is to this topic that I turn next.
Linking a New NELS with SASS
p
While it is important to measure and track overall achievement levels, it is also important tobe able to associate differences in school policies and practices with student achievement. Itis almost impossible to make valid inferences about the impact of school policies with cross -sectional dataregardless of how rich the individual data may be. Of course, making clearinferences about these kinds of associations is done best by experiments in which students areassigned to educational treatment conditions and subsequent growth in achievement ismeasured (Metcalf, 1995).
1
I
I
I
I
However, true experiments in education are difficult to conduct and maintain under the bestof circumstances. Many educational researchers have therefore relied on observationalsurvey data to make cautious inferences about policy effects on achievement gains. Whilethese studies have many well known inherent flaws, most educational researchers and policymakers have been determined to not let the "perfect be the enemy of the good" and haveconducted well thought out and executed policy studies with the longitudinal studies datasystems provided by NCES (Heyns & Hilton, 1982, pp. 89-102).
Three Options to Consider
It seems to me that there are at least three options to attaching a longitudinal studentcomponent to SASS. These are outlined below.
(1) Attach student administrative data to SASS and return to those schools to pick uplongitudinal data. This option would be substantially more expensive than simplyattaching student administrative record data to SASS since one would have to returnto the SASS schools to follow up on the students sampled in the first year. SASS iscurrently on a 5-year cycle. Presumably one would want to go back to recapturestudent data on a more frequent follow-up scheduleperhaps every 2 years. Re-surveying schools every 5 years to follow up on students is perhaps too long aperiodicity to make timely estimates of student outcomes. One could of course goback to the SASS schools (or sample of SASS schools) to capture just thoseadministrative records that one needs. However, even this would increase theadministrative and respondent burden of the survey system without providing much inthe way of analytical payoff. Student test data would still not be available andconsequently measures of growth in achievement would also not be available. Interms of measuring transitions, one would know if students were still enrolled in thatschool, but would know precious little else about the students transitions to otherschool or work. Furthermore, some portion of the students would have moved,making followup of their status difficult and expensive.
In addition, learning takes place in an interaction of school, home, and family. Astudent data collection based solely on school records obviously records only oneaspect of this learning system. The longitudinal studies have long recognized this andhave tried to measure the other aspects of the student's learning environment.Measuring only one component does not allow one to fully examine the totality of thestudents' learning experience and how the different components interact with oneanother.
(2) Create a new longitudinal survey and "link" several items to SASS items. NCES couldfield a new NELS with either an eighth-grade or tenth-grade cohort and use identicalitems from SASS in its school and teacher questionnaires. Linking these data wouldprovide some analytical payoff in terms of generalizabilty of the data provided. Itwould also decrease the burden to individual sampled schools, which would
8
15
(3)
presumably not have to respond to the both the SASS and NELS survey instruments.However, it would increase overall response burden and would likely increase overalladministrative costs. The analytical payoff would also be somewhat weak, since thelinked data to SASS would not include all of the contextual data provided by the newNELS.
Merge a new NELS with SASS. NCES could field a new NELS in a sample of SASSschools. For example the 1998 SASS could become the base year of NELS:98. Theoverall analytical reward of such a merger could be substantial. This class of studentswill be on schedule to graduate in 2002, thus leading to clean comparisons among thehigh school classes of 1972 (NLS-72), 1982 (HS&B), and 1992 (NELS:88). Thelongitudinal studies have traditionally have had teacher and school data, but have nothave had district level data to attach to student data. Furthermore, the richness of theSASS teacher and administrator data would enhance the student and parent data fromNELS. Student assessment data (perhaps both cognitive and affective) could beattached to the SASS data to enable analyses of the association of outcomes data withschool and district policy information. Data would also be collected with severalfollowups and would thus be able to measure growth in outcomes. Information wouldalso be available to track the success of students in making critical transitions throughschool and workfor example, transitions from middle school to high school, throughhigh school to high school completion, and from high school completion topostsecondary education and/or the world of work.
While a new NELS attached to SASS makes sense analytically, it also makes a great deal ofsense in terms of cost savings. The SASS data collector will have already contacted theschools and collected data from districts, schools, and teachers. A new NELS would onlyhave to supplement these data with a student and parent questionnairethe teacher andschool data would be collected within the normal SASS administration. Using the 1998SASS survey as the base year of a new NELS has been shown to indicate a substantial costsavings over a separate sample design (J. Owings, internal memo, 1995, National Center forEducation Statistics).
While total response burden would presumably be decreased by a NELS/SASS merger, theburden to individual schools will almost surely increase. However, this increase in responseburden would have the potential to effect the response rates of the NELS data collectioneffort rather than SASS. SASS should not have to pay any part of the response rate priceassociated with the merger.
Thus, a new NELS attached to SASS would meet the requirement that I set forth in theintroduction to this paper. It would collect all three types of data that I think isimportantoverall achievement data, data on cognitive and affective growth, and data oncritical transitions. It would also meet the two criteria for a reasonable mergerit wouldmake sense analytically, and it would make sense economically.
9
16
I
However, a new NELS attached to SASS would still have to overcome several obstacles andseveral issues will need to be addressed in designing a new NELS. In fact, fleshing out adesign for a new longitudinal study attached to SASS deserves its own design conference.However, short of this, I briefly outline two areas of concern in the next section.
The Design of the National Longitudinal Study of 1998
What age cohort should NELS:98 begin with? To track the transitions I outlined above,NELS:98 could start with either an 8th-grade cohort (to follow the transition from middleschool to high school and allow trend comparisons with NELS:88), with a 10th-grade cohort(to follow the transition from high school to graduation and allow trend comparisons withHS&B and NELS:88), 12th-grade cohort (to track the transition from high school topostsecondary education or work), or some combination of the above.
Starting with another eighth-grade cohort has a lot of analytical appeal. The transition fromeighth grade to high school is a significant passage. Meaningful research has been done withthe NELS:88 cohort on this issue. Furthermore, data from NAEP and from NELS:88indicate that a significant amount of cognitive and academic growth occurs during thisperiod. Larger gains are realized, on average, between the 8th and 10th grades than betweenthe 10th and 12th grades (Crouse & Ralph, 1996).
However, despite the intuitive appeal of starting with an 8th-grade cohort, for a variety ofreasons a 10th-grade cohort may be more feasible at this time. The primary reason for thisis the ease with which 10th-grade students can be followed and therefore the lower costinvolved. While younger cohorts are perhaps always more desirable analytically than oldercohorts, following younger cohorts is always more expensive than following older cohorts.For example, almost 90 percent of NELS:88 8th graders changed schools between the 8thand 10th grades, while less than 20 percent of NELS:88 10th graders changed schoolsbetween the 10th and 12th grades. Tracking students from the 8th to the 10th grade provedto be much more expensive than originally estimated with the NELS:88 first follow-up study.
Furthermore, while there was great analytical payoff to estimating the growth in achievementof an 8th grade in NELS:88, the complexities of the psychometrics involved in this effortwere severe. Because the NELS:88 test battery was used to measure overall achievementlevels and growth between the 8th and 12th grades, floor and ceiling effects were much moreworrisome that in HS&B, where growth was measured between the 10th and 12th gradesonly. The resulting adaptive nature of the NELS:88 assessment created analytical problemswith researchers not sophisticated with psychometrics. For example, measuring gains inmathematics proficiency was much more complicated than merely looking at IRT gainsscores, as had been done in HS&B. Since different kids took different tests, gains had toexamined in terms of gains in proficiency functioning rather than raw or IRT estimatedgains. Again, this complication was due to the fact that the assessment instruments had to
10
have a multilevel design to guard against the floor and ceiling effects that could occur whentesting spanned the 8th through 12th grades.
It is also interesting to speculate whether a 12th-grade cohort (either selected on their own oran "aged" 10th-grade cohort) could be attached to SASS in the high school years and thenattached or merged in a new Beginning Postsecondary Student (BPS) survey when the yearafter they are scheduled to leave high school. I realize that the sampling issues here may beenormously complicated and can only speculate about the complexities of such anoverlapping or multiple frame design. However, by designing the three surveys in thismanner, one would have the merged power (and savings?) of a SASS, a NELS, and a BPS.
Periodicity of SASS
To parallel the structure of the HS&B and NELS:88, the new longitudinal study should be ona 2-year cycle. That is, if NCES starts with a 10th-grade sample, they would want to goback and re-interview the sampled students 2 years later when most of them will be in the12th grade. In this manner, trend analyses could be run with the HS&B and the NELS:8810th- to 12th-grade cohorts. Since SASS is currently on a 5-year cycle, the 2-year followupwould have to be done separately from the normal SASS cycle. These independent follow-upinterviews could be done either as a CATI or as in-school interviews. In-school interviewswould probably be more costly, but would be more efficient if cognitive assessments wereconducted during this followup. (Unless someone develops a way to efficiently do aNELS:88 comparable assessment through CATI.)
Furthermore, in many ways HS&B and NELS:88 were multiple-cross-sectional data sets.Data were collected on the same people for two years apart. What went on in between thosetwo data points is often hard to determine. For example, detailed information on schoolenrollment has been difficult to obtain from HS&B and NELS:88. One knows from thevarious followups if sampled members were attending school at the time of the followup, butdo not know much about their enrollment status in between the follow-up survey dates. Onecould use CATI to efficiently go back to these students more frequently than a 2-year cycleand collect such time-sensitive data. These intermediate interviews would be limited to just afew items (dropout status, pregnancy status, employment status) with fewer time dependentvariables reserved for the more in-depth 2-year follow-up survey.
Summary
The argument for attaching a longitudinal component to SASS rests on several premises.First, attaching a longitudinal study to SASS seems to satisfy most of the criteria I have setout for myself. It could measure all three of the types of student data deemed mostworthwhile, while also satisfying the two criteria for sensible mergerproducing some costbenefit, and engendering an analytical payoff. The payoff, however, is to the overall data
11
18

p
P
collection effort of NCES and not necessarily to SASS data collection in particular. In fact,attaching a longitudinal study to SASS may have no payoff whatsoever for SASS but mayindeed provide more burden to the already overworked SASS staff. Attaching aggregatelongitudinal student data to SASS may be of more benefit to SASS itselfmerging a newNELS and SASS provides the most benefit to NCES and indeed, to the whole educationalpolicy community.
Conclusion
The years 1983-84 saw the release of two publications that would forever change the waythat Americans looked at their elementary and secondary schools. Ernest Boyer's HighSchool: A Report on Secondary Education in America, 1983 focused public attention onAmerican high schools, a "troubled institution" with a confused mission and low standards.At about the same time the U.S. Department of Education released A Nation at Risk, whichcalled attention to what was termed a "rising tide of mediocrity" in American schools. Duein part to the publicity these reports engendered, a decade of educational reform took hold inthe American educational system. This "reform" was actually many reforms and debate overthe consequences of these reforms continues today. NCES data help frame and focus thisdebate.
In 1984, a cohort of students had just graduated (in 1982) from high school. Theirexperiences in the pre-reform era would serve as a base line to judge the impact of thecoming reforms. The High School and Beyond study would record the experiences of thiscohort of students. In 1984, another cohort of students was in the fourth grade. Thesestudents would feel some of the immediate consequences of these reforms. Their experiencesin high school, in postsecondary education, and in the transition to the world of work werecaptured in the experiences of the students in the National Educational Longitudinal Study of1988. In 1984 (the year in which A Nation At Risk made its first impact), yet another cohortof children were born who are right now experiencing the full impact of the reforms of thelast two decades. Most of this cohort are on track to graduate from high school in 2002.
Unfortunately, current budget concerns cast doubt on whether NCES will be able to field anindependent longitudinal study of this class of high school students. The cohort of studentswho will be included in the Early Childhood Longitudinal Study will not be graduating fromhigh school until 2012. Missing the class of 2002 will result in a data gap of almost 20years and will weaken our ability to measure the impact of the changes introduced into ourelementary and secondary schools. Failing to capture the experiences of the high schoolclass born at the very beginning of reform will be a serious gap in the nation's knowledgeabout education. Linking a new longitudinal study with SASS may be the only way ofeffectively filling this data gap.
12
References
Arnold, C.L. & Kaufman, P.D. (1992, June). School Effects on Educational Achievement inMathmatics and Science: 1985-86. Report prepared for the National Center for EducationStatistics, Office of Educational Research and Improvement, U.S. Department of Education.
Burstein, L., & Aschbacher, P. (1987, December). Further thinking on the merger of theNational Assessment of Educational Progress and the Schools and Staffing Surveys: Summaryand recommendations for two meetings of statisticians and researchers. Unpublishedmanuscript, Center for Research and Evaluation, Standards, and Student Testing atUniversity of California, Los Angeles.
Crouse, J., & Ralph, J. (1996). The National Educational Longitudinal Study: Race andgender differences in academic achievement. Paper delivered at the American EducationalResearch Association meeting. New York, NY.
Heyns, B., & Hilton, T. L. (1982). The cognitive tests for high school and beyond: Anassessment. Sociology of Education 55, 89-102.
Metcalf, C. E. (1995, November). Incorporating experimental designs into new NCEScollection methodologies. Paper presented at the conference Future NCES Data Collection:Some Possible Directions. Washington, DC.
Pallas, A. (1993, Winter). Schooling in the course of human lives: The social context ofeducation and the transition to adulthood in industrial society. Review of EducationalResearch, 20.
13
26
II
Endnotes
1. This quote is attributed to Dan Koretz (and similar sentiments attributed to RichardMurnane and Marshall Smith) in L. Burstein and P. Aschbacher (1987).
2. A weak measure of SES has been used in several analyses using the NAEP data. SeeD C. Arnold and P. Kaufman for an example.
3. This happened in the mid-1980s with the NAEP reading assessment, resulting in theso called "reading anomaly."
Number
94-01 (July)
94-02 (July)
94-03 (July)
94-04 (July)
94-05 (July)
94-06 (July)
94-07 (Nov.)
95-01 (Jan.)
95-02 (Jan.)
95-03 (Jan.)
95-04 (Jan.)
95-05 (Jan.)
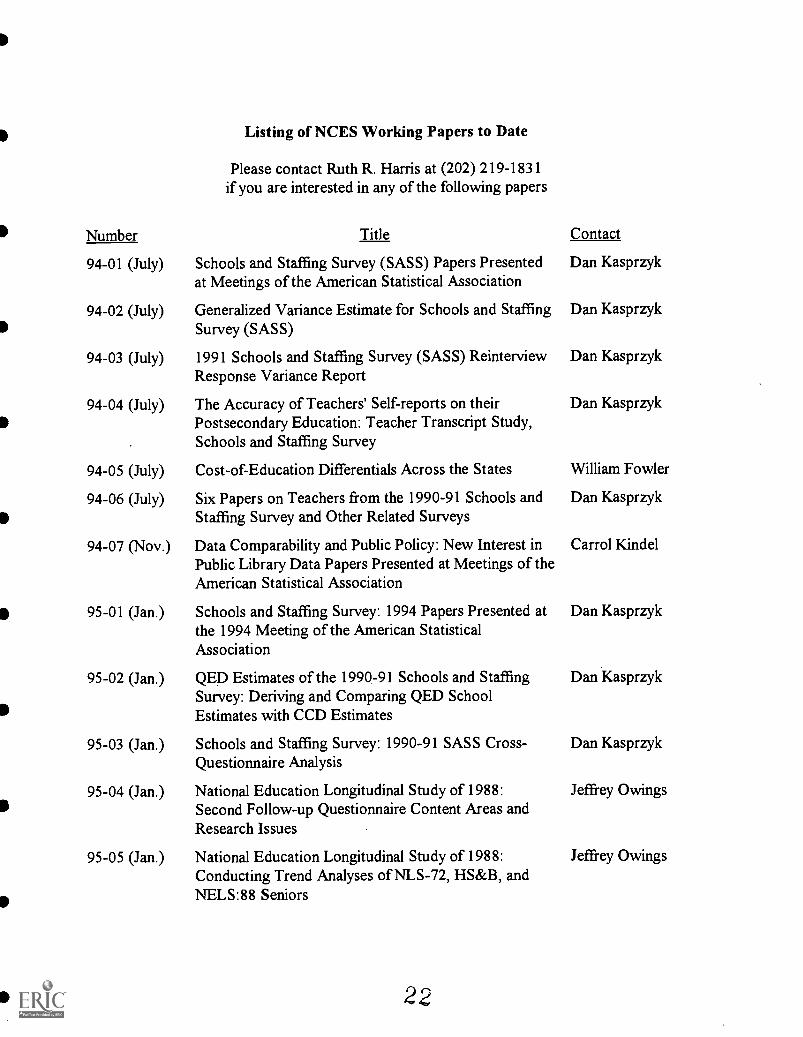
Listing of NCES Working Papers to Date
Please contact Ruth R. Harris at (202) 219-1831if you are interested in any of the following papers
Title
Schools and Staffing Survey (SASS) Papers Presentedat Meetings of the American Statistical Association
Generalized Variance Estimate for Schools and StaffingSurvey (SASS)
1991 Schools and Staffing Survey (SASS) ReinterviewResponse Variance Report
The Accuracy of Teachers' Self-reports on theirPostsecondary Education: Teacher Transcript Study,Schools and Staffing Survey
Cost-of-Education Differentials Across the States
Six Papers on Teachers from the 1990-91 Schools andStaffing Survey and Other Related Surveys
Data Comparability and Public Policy: New Interest inPublic Library Data Papers Presented at Meetings of theAmerican Statistical Association
Schools and Staffing Survey: 1994 Papers Presented atthe 1994 Meeting of the American StatisticalAssociation
QED Estimates of the 1990-91 Schools and StaffingSurvey: Deriving and Comparing QED SchoolEstimates with CCD Estimates
Schools and Staffing Survey: 1990-91 SASS Cross-Questionnaire Analysis
National Education Longitudinal Study of 1988:Second Follow-up Questionnaire Content Areas andResearch Issues
National Education Longitudinal Study of 1988:Conducting Trend Analyses of NLS-72, HS&B, andNELS:88 Seniors
Contact
Dan Kasprzyk
Dan Kasprzyk
Dan Kasprzyk
Dan Kasprzyk
William Fowler
Dan Kasprzyk
Carrol Kindel
Dan Kasprzyk
Dan Kasprzyk
Dan Kasprzyk
Jeffrey Owings
Jeffrey Owings

Number
95-06 (Jan.)
95-07 (Jan.)
95-08 (Feb.)
95-09 (Feb.)
95-10 (Feb.)
95-11 (Mar.)
95-12 (Mar.)
95-13 (Mar.)
95-14 (Mar.)
95-15 (Apr.)
95-16 (Apr.)
95-17 (May)
95-18 (Nov.)
96-01 (Jan.)
Listing of NCES Working Papers to Date--Continued
Title
National Education Longitudinal Study of 1988:Conducting Cross-Cohort Comparisons Using HS&B,NAEP, and NELS:88 Academic Transcript Data
National Education Longitudinal Study of 1988:Conducting Trend Analyses HS&B and NELS:88Sophomore Cohort Dropouts
CCD Adjustment to the 1990-91 SASS: A Comparisonof Estimates
The Results of the 1993 Teacher List Validation Study(TLVS)
The Results of the 1991-92 Teacher Follow-up Survey(TFS) Reinterview and Extensive Reconciliation
Measuring Instruction, Curriculum Content, andInstructional Resources: The Status of Recent Work
Rural Education Data User's Guide
Assessing Students with Disabilities and LimitedEnglish Proficiency
Empirical Evaluation of Social, Psychological, &Educational Construct Variables Used in NCESSurveys
Classroom Instructional Processes: A Review ofExisting Measurement Approaches and TheirApplicability for the Teacher Follow-up Survey
Intersurvey Consistency in NCES Private SchoolSurveys
Estimates of Expenditures for Private K-12 Schools
An Agenda for Research on Teachers and Schools:Revisiting NCES' Schools and Staffing Survey
Methodological Issues in the Study of Teachers'Careers: Critical Features of a Truly Longitudinal Study
2j
Contact
Jeffrey Owings
Jeffrey Owings
Dan Kasprzyk
Dan Kasprzyk
Dan Kasprzyk
Sharon Bobbitt &John Ralph
Samuel Peng
James Houser
Samuel Peng
Sharon Bobbitt
Steven Kaufman
StephenBroughman
Dan Kasprzyk
Dan Kasprzyk

Number
96-02 (Feb.)
96-03 (Feb.)
96-04 (Feb.)
96-05 (Feb.)
96-06 (Mar.)
96-07 (Mar.)
96-08 (Apr.)
96-09 (Apr.)
96-10 (Apr.)
96-11 (June)
96-12 (June)
96-13 (June)
96-14 (June)
96-15 (June)
Listing of NCES Working Papers to Date--Continued
Title
Schools and Staffing Survey (SASS): 1995 Selectedpapers presented at the 1995 Meeting of the AmericanStatistical Association
National Education Longitudinal Study of 1988(NELS:88) Research Framework and Issues
Census Mapping Project/School District Data Book
Cognitive Research on the Teacher Listing Form for theSchools and Staffing Survey
The Schools and Staffing Survey (SASS) for 1998-99:Design Recommendations to Inform Broad EducationPolicy
Should SASS Measure Instructional Processes andTeacher Effectiveness?
How Accurate are Teacher Judgments of Students'Academic Performance?
Making Data Relevant for Policy Discussions:Redesigning the School Administrator Questionnaire forthe 1998-99 SASS
1998-99 Schools and Staffing Survey: Issues Related toSurvey Depth
Towards an Organizational Database on America'sSchools: A Proposal for the Future of SASS, withcomments on School Reform, Governance, and Finance
Predictors of Retention, Transfer, and Attrition ofSpecial and General Education Teachers: Data from the1989 Teacher Followup Survey
Estimation of Response Bias in the NHES:95 AdultEducation Survey
The 1995 National Household Education Survey:Reinterview Results for the Adult EducationComponent
Nested Structures: District-Level Data in the Schoolsand Staffing Survey
24
Contact
Dan Kasprzyk
Jeffrey Owings
Tai Phan
Dan Kasprzyk
Dan Kasprzyk
Dan Kasprzyk
Jerry West
Dan Kasprzyk
Dan Kasprzyk
Dan Kasprzyk
Dan Kasprzyk
Steven Kaufman
Steven Kaufman
Dan Kasprzyk
Number
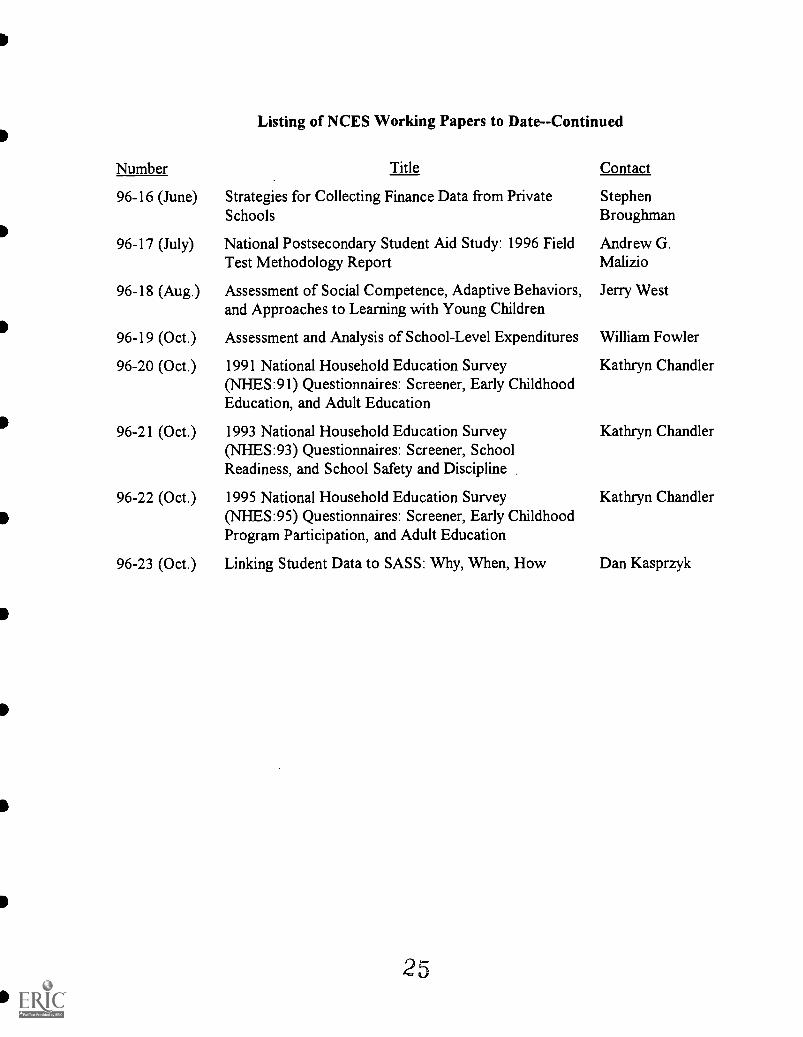
96-16 (June)
96-17 (July)
96-18 (Aug.)
96-19 (Oct.)
96-20 (Oct.)
96-21 (Oct.)
96-22 (Oct.)
96-23 (Oct.)
Listing of NCES Working Papers to Date--Continued
Title
Strategies for Collecting Finance Data from PrivateSchools
National Postsecondary Student Aid Study: 1996 FieldTest Methodology Report
Assessment of Social Competence, Adaptive Behaviors,and Approaches to Learning with Young Children
Assessment and Analysis of School-Level Expenditures
1991 National Household Education Survey(NHES:91) Questionnaires: Screener, Early ChildhoodEducation, and Adult Education
1993 National Household Education Survey(NHES:93) Questionnaires: Screener, SchoolReadiness, and School Safety and Discipline
1995 National Household Education Survey(NHES:95) Questionnaires: Screener, Early ChildhoodProgram Participation, and Adult Education
Linking Student Data to SASS: Why, When, How
25
Contact
StephenBroughman
Andrew G.Malizio
Jerry West
William Fowler
Kathryn Chandler
Kathryn Chandler
Kathryn Chandler
Dan Kasprzyk
ck

e.
(982)
tlU.S. DEPARTMENT OF EDUCATIONoffice of Educational Research and Improvement PEROEducational Resources Information Center (ERIC)
NOTICE
REPRODUCTION BASIS
TM028263
tE
This document is covered by a signed "Reproduction Release(Blanket)" form (on file within the ERIC system), encompassing allor classes of documents from its source organization and, therefore,does not require a "Specific Document" Release form.
This document is Federally-funded, or carries its own permission toreproduce, or is otherwise in the public domain and, therefore, maybe reproduced by ERIC without a signed Reproduction Releaseform (either "Specific Document" or "Blanker).
OM.