Embed Size (px)
Citation preview
SCIENTIFIC BULLETINSERIES F. BIOTECHNOLOGIES
Volume XXV, No. 1
University of Agronomic Sciencesand Veterinary Medicine of Bucharest
Faculty of Biotechnology
BucharesT2021
SCIE
NT
IFIC
BU
LLET
IN. S
ERIE
S F.
BIO
TEC
HN
OLO
GIE
S. V
olu
me
XX
V, N
o. 1
, 202
1
ISSN 2285 – 1364ISSN-L 2285 – 1364

1
SCIENTIFIC BULLETINSERIES F. BIOTECHNOLOGIES
Volume XXV, No. 1, 2021

University of Agronomic Sciencesand Veterinary Medicine of Bucharest
Faculty of Biotechnology
BucharesT2021
SCIENTIFIC BULLETINSERIES F. BIOTECHNOLOGIES
Volume XXV, No. 1

3
University of Agronomic Sciencesand Veterinary Medicine of Bucharest
Faculty of Biotechnology
BucharesT2021
SCIENTIFIC BULLETINSERIES F. BIOTECHNOLOGIES
Volume XXV, No. 1

4
SCIENTIFIC COMMITTEE • Veronika ABRAM - Biotechnical Faculty, University of Ljubljana, Slovenia • Ioan ARDELEAN - Institute of Biology, Romanian Academy • Narcisa BĂBEANU - Faculty of Biotechnology, USAMV Bucharest, Romania • Gabriela BAHRIM - Faculty of Food Science and Engineering, “Dunărea de Jos Galați” University of Romania • Gustavo V. BARBOSA-CANOVAS - Washington State University Pullman, State of Washington, USA • Ingrid BAUMAN - Faculty of Food Technology and Biotechnology, Zagreb, Croația • Nastasia BELC - Faculty of Biotechnology, USAMV Bucharest, Romania • Daniela BORDA - Faculty of Food Science and Engineering, “Dunărea de Jos Galați” University of Romania • Monica BOSCAIU - Mediterranean Agroforestry Institute (IAM, UPV), Universitat Politècnica de València, Spain • Dorica BOTĂU - Faculty of Agriculture, USAMVB from Timisoara, Romania • Nicolae CORCIONIVOSCHI - Agri-Food and Biosciences Institute, Belfast, UK • Călina Petruţa CORNEA - Faculty of Biotechnology, USAMV Bucharest, Romania • Delia DIMITRIU - Manchester Metropolitan University, United Kingdom • Carla EMILIANI - Università degli Studi di Perugia, Italy • Helmut GLATTES - ISEKI Food Association, Austria • Gustavo Fidel GUTIERREZ-LOPEZ - ENCB-IPN, National School of Biological Sciences, National Polytechnic
Institute, Mexico • Florentina ISRAEL-ROMING - Faculty of Biotechnology, USAMV Bucharest, Romania • Huub LELIEVELD - GHI Association Netherlands and EFFoST Executive Committee, Netherlands • Leonardo LEONARDI - Università degli Studi di Perugia, Italy • Florentina MATEI - Faculty of Biotechnology, USAMV Bucharest, Romania • Amalia Carmen MITELUŢ - Faculty of Biotechnology, USAMV Bucharest, Romania • Paola PITTIA - Dipartimento di Scienze, degli Alimenti University degli Studi di Teramo, Italy • Mona Elena POPA - Faculty of Biotechnology, USAMV Bucharest, Romania • Sandrine ROUSSEAUX - University of Burgundy, Dijon, France • Mark SHAMTSYAN - St. Petersburg State Institute of Technology, Russia • Cristina SILVA - ISEKI Food, Catholic University of Portugal • Ileana STOICA - University of Bucharest, Romania • Gabriela TENEA - Universidad Técnica del Norte, Ibarra, Ecuador • Margarida VIEIRA - Directora do Dep. De Engenharia Alimentar, Instituto Superior de Engenharia, Universidade do
Algarve, Portugal • Tatiana Vassu - University of Bucharest, Romania • Oscar VICENTE - Universitat Politècnica de València, Spain • Medana ZAMFIR - Institute of Biology, Romanian Academy • Chin-Kun Wang - Chung Shan Medical University, Taiwan
EDITORIAL BOARD
General Editor: Călina Petruţa CORNEA; Executive Editor: Florentina MATEI Members: Florentina ISRAEL-ROMING, Elena Elisabeta POPA, Oana LIVADARIU,
Radu Cristian TOMA, Gabriela MĂRGĂRIT
Secretariat: Paul Alexandru POPESCU, Elena Elisabeta POPA
PUBLISHERS: University of Agronomic Sciences and Veterinary Medicine of Bucharest, Romania – Faculty of Biotechnology
Address: 59 Mărăşti Blvd., District 1, Zip code 011464, Bucharest, Romania, Phone: + 40 21 318 25 64, Fax: +40 21 318 28 88,
E-mail: [email protected], Webpage: http://biotechnologyjournal.usamv.ro
CERES Publishing House Address: 29 Oastei Street, District 1, Bucharest, Romania
Phone: + 40 21 317 90 23, E-mail: [email protected], Webpage: www.editura-ceres.ro
Copyright 2021 To be cited: Scientific Bulletin. Series F. Biotechnologies, Volume XXV, No. 1, 2021
The publisher is not responsible for the opinions published in the Volume. They represent the authors’ point of view.
ISSN 2285-1364, CD-ROM ISSN 2285-5521, ISSN Online 2285-1372, ISSN-L 2285-1364
International Database Indexing: COPERNICUS, CABI, GOOGLE SCHOLAR, DOAJ, Scipio, PBN (Polish Scholarly
Bibliography), OCLC, Research Bible, Cite Factor (Academic Scientific Journals), Universal Impact Factor

5
SUMMARY
SUBSECTION I: AGRICULTURAL BIOTECHNOLOGY
1. ASSESSING THE MOST APPROPRIATE PCR CONDITIONS FOR SSR MARKERS IN
WHEAT CULTIVARS STUDY - Valentina VASILE, Matilda CIUCĂ, Elena NICOLAE, Cătălina VOAIDEȘ, Călina Petruța CORNEA ............................................................................. 9
2. PROTEIN AND AMINO ACID PROFILE ANALYSIS OF AGRI-FOOD WASTE BIOMASSES - Eleonora CALZONI, Alessio CESARETTI, Nicolò MONTEGIOVE, Roberto Maria PELLEGRINO, Leonardo LEONARDI, Carla EMILIANI ........................................................ 19
3. BIOMETRIC RESULTS FOR MAIZE CROP, AS A RESULT OF TREATMENT WITH NEW BIOSTIMULATORS BASED ON PROTEIN ADDITIVES - Roxana HOROIAȘ, Marius BECHERIȚU, Cristian CIOINEAG, Paul BOROVINĂ, Carmen GAIDĂU, Mihaela NICULESCU ..................................................................................................................................... 26
4. POROUS CERAMIC GRANULES AS INORGANIC SOIL CONDITIONER - Orsolya Csilla RADULY, József FAZAKAS, Diana CONSTANTINESCU-ARUXANDEI, Csilla BENEDEK, Mălina AVRAM-DEȘLIU, Enikö FAZAKAS, Florin OANCEA ........................... 32
5. IMPACT OF SOME ELEMENTS IN THE CULTIVATION TECHNOLOGY ON BIOCHEMICAL AND QUALITATIVE CHARACTERISTICS OF RASPBERRY FRUIT - Stanislava ATANASOVA, Maria GEORGIEVA, Diyan GEORGIEV, Petya IVANOVA ....... 42
SUBSECTION II: FOOD BIOTECHNOLOGY
1. ANTIOXIDANT ACTIVITY IN SELECTED BRASSICACEAE VEGETABLES - Mihaela MULȚESCU, Iulia-Elena SUSMAN, Floarea BURNICHI, Florentina ISRAEL-ROMING ... 51
2. IMPROVING BREAD aroma USING SOURDOUGH FERMENTATION - Şerban-Eugen CUCU, Mona Elena POPA ................................................................................................ 59
3. MILK-CLOTTING ENZYMES OBTAINED FROM PLANTS IN CHEESEMAKING - A REVIEW - Sorin NITU, Mihaela GEICU-CRISTEA, Florentina MATEI .............................. 66
4. GLUTEN-FREE PRODUCTS AND POSSIBILITIES OF NEW FORMULATION FOR IMPROVING TEXTURAL AND NUTRITIONAL CHARACTERISTICS - REVIEW - Elena-Claudia STOICAN, Claudia-Elena MOȘOIU, Florentina ISRAEL-ROMING ....................... 76
5. IMPROVING NUTRITIONAL VALUE AND SENSORIAL PROPERTIES OF BAKERY PRODUCTS USING FUNCTIONAL INGREDIENTS - Ioana STANCIU, Mona Elena POPA 87
6. HEALTH PROMOTING QUALITY OF THE ROMANIAN HONEY - Andra Lavinia NICHIȚEAN, Diana CONSTANTINESCU-ARUXANDEI, Florin OANCEA .......................... 95
7. COMPARATIVE ANALYSIS OF ESTIMATED SHELF LIFE, APPROACHING ACCELERATED AGING METHODS - Catalin BILBIE, Andra GHIZDAREANU .................. 104

6
SUBSECTION III: MEDICAL AND PHARMACEUTICAL BIOTECHNOLOGY
1. A REVIEW OF CONTAMINATION CONTROL IN PHARMACEUTICAL INDUSTRY IN THE CURRENT SARS-COV-2 PANDEMIC CONTEXT - Ruxandra-Daniela DUMITRU, Oana LIVADARIU ................................................................................................................. 115
2. INFLUENCE OF PRESERVATION METHOD ON PEPPERMINT, BASIL AND ROSEMARY PLANT EXTRACTS CHEMICAL COMPOSITION - Denisa CIOTEA, Mona Elena POPA ..... 121
3. USE OF SACCHAROMYCES CEREVISIAE AS AN ANTI-AGING STUDY TOOL - Mircea-Cosmin PRISTAVU, Camelia Filofteia DIGUŢĂ, Ionuţ MORARU, Florentina MATEI ........ 126
4. THE BIOLOGICAL ACTIVITY IN VIVO AND IN VITRO OF CENTAUREA CYANUS, LACTARIUS PIPERATUS AND RIBES RUBRUM - Cristina Monica DABULICI, Emanuel VAMANU, Nand Rai SACHCHIDA ............................................................................................. 139
SUBSECTION IV: ENVIRONMENTAL BIOTECHNOLOGY
1. USE OF POLYMERS IN THE DEVELOPMENT OF EDIBLE PACKAGING MATERIALS FOR FOOD SUPPLEMENTS - Roxana GHEORGHIŢĂ, Sonia AMARIEI, Gheorghe GUTT 147
2. SOME BIOTECHNOLOGICAL APPLICATIONS OF CYANOBACTERIA AND GREEN MICROALGAE - Ana Valentina ARDELEAN, Ioan ARDELEAN, Loredana Mirela SFÎRLOAGĂ, Călina Petruța CORNEA ...................................................................................... 155
SUBSECTION V: MISCELLANEOUS
1. ANTHOCYANINS IN PURPLE MAIZE - Andrei Constantin Ioan ARLET, Aglaia POPA (BURLACU), Alexandru GROSU, Florentina ISRAEL-ROMING …………………………… 167
2. COMPARATIVE STUDY OF LIGHT MICROSCOPY IMAGES OF POLLEN FROM 3 ONAGRACEAE SPECIES - Monica ENACHE, Silvana Mihaela DĂNĂILĂ-GUIDEA, Marius HANGAN ………………………………………………......................………................. 175

7
AGRICULTURAL BIOTECHNOLOGY

8

9
ASSESSING THE MOST APPROPRIATE PCR CONDITIONS
FOR SSR MARKERS IN WHEAT CULTIVARS STUDY
Valentina VASILE1, 2, Matilda CIUCĂ3, Elena NICOLAE1, 2, Cătălina VOAIDEȘ1, Călina Petruța CORNEA1
1University of Agronomic Sciences and Veterinary Medicine of Bucharest,
59 Mărăşti Blvd, District 1, 011464, Bucharest, Romania 2Central Laboratory for Quality of Seeds and Planting Material, 10 Constantin Sandu Aldea Alley,
District 1, 012065, Bucharest, Romania 3National Agricultural Research and Development Institute Fundulea, 1 Nicolae Titulescu Street,
915200, Fundulea, Călărași, Romania
Corresponding author email: [email protected] Abstract Although it is well known that molecular biology techniques have recently seen a significant increase in the development of new research methods, an important role when choosing the appropriate working methods lies not only in the methods acceptance criteria such as specificity, applicability, robustness but also in the final cost of the implemented technology. Therefore, although methods involving SSR markers are much more specific and informative than other and these markers can be easily identified by PCR techniques, difficulties may arise in interpreting the results if the chosen SSR markers are not suitable for researches purposes or the conditions for PCR reaction are not appropriate. The methods optimization plays an important role in obtaining the desired results. The aim of this study was to choose the most suitable PCR conditions optimizing either the reaction parameters by varying the reagents used or their concentration as well as PCR amplification conditions when using fourteen SSRs markers in wheat cultivars grown in Romania. The SSRs markers DuPw167, DuPw217, DuPw004, DuPw115, DuPw205, Xgwm155, Xgwm413, Xgwm003, Xgwm372, Xbarc184, Xbarc347, Xbarc074, Xgwm052 and Xgwm095 were amplified with three PCR reaction mixtures at different annealing temperatures. All SSRs markers gave the best amplification profiles with the PCR mix 2 which had as reagent a Hot Start Taq DNA Polymerase. By choosing the best methods conditions a successful amplification and a unique allele profile may be provided thus being able to standardize the methods used. Key words: SSR markers, PCR conditions, methods optimization, wheat. INTRODUCTION Wheat is one of the main cereal crops and if we refer to the evolution of agricultural researches in this field, we can mention the fact that molecular biology methods and especially those using molecular markers or PCR based technology have provided in the last decades new opportunities for researchers (Yadav et al., 2019; Kumar et al., 2009). Molecular markers have many applications such as marker assisted selection (MAS), being used in breeding programs, genetic purity assessment and variety identification, quantitative trait loci mapping (QTLs) (Bernardo, 2008; Raza et al., 2019; Nadeem et al., 2018; Noli et al., 2008; Niaz et al., 2020). Thus, using molecular markers in molecular biology techniques plays an important part for
researchers and nowadays there are numerous research studies that designate Simple Sequence Repeats or SSRs markers as being among the most used molecular markers in wheat study and not only (Varshney et al., 2000; Hayden et al., 2008; Haque et al., 2021). SSRs or microsatellite markers are valuable tools for studying plant genetic material. These markers are represented by sequences of 1-6 nucleotides repeated in tandem. SSR markers are found in abundance in the plant genome but may also exist in other places, such as mitochondria (mtSSRs) or chloroplast (cpSSRs) (Nadeem et al., 2018). Due to the high level of polymorphism, they can be easily identified by PCR technique (Raza et al., 2019; Elameen & Mohamed, 2019; Erayman et al., 2016).
Scientific Bulletin. Series F. Biotechnologies, Vol. XXV, No. 1, 2021ISSN 2285-1364, CD-ROM ISSN 2285-5521, ISSN Online 2285-1372, ISSN-L 2285-1364

10
When it comes to molecular biology methods used for wheat we can remark that the methods involving SSRs are widely used. Among the reasons for their excessive use we can list that SSRs markers are more informative than other markers with important implications in breading program where marker assisted selection speeds up the process (Madesis et al., 2013; Xu & Crouch, 2008; Brumlop & Finckh, 2010; Ciucă et al., 2018; Cristina et al., 2018; Nadeem et al., 2018; Dinu et al., 2014) in genetic diversity assessment ( Zhao et al., 2019; El-Fiki & Adly, 2019; Mangini et al., 2010; Xinquan et al., 2005) and genotyping the wheat genomes (Röder et al., 1998; Eujayl et al., 2002). When choosing the most appropriate method Several aspects should be taken into account when choosing the working method. Thus, the methods evaluation regarding applicability, practicability, robustness, reproducibility plays an important role in its selection and using SSRs markers has advantages in terms of method specificity. SSRs markers are codominant markers that have a high level of polymorphism being easily identified by PCR technique (Raza et al., 2019). A first important factor for the selected method to work within the chosen limits is to select molecular markers that can highlight the genetic polymorphism associated with the biological material used. The allelic profiles resulting from amplification as well as the polymorphism associated with the use of markers play an important role in choosing the right method (Khan et al., 2014). Although SSRs markers are much more specific and informative than other markers, difficulties may arise in interpreting the results if the chosen markers are not suitable for the purpose (Senan et al., 2014; Sun et al., 2020). Thus, the selected methods regardless the purpose should use reliable markers so that the results can be quickly obtained. The technology should be easy to use and not to generate high costs and should not require a large amount of DNA or prior information about the plant genome.
As advantages for development of methods based on the use of SSRs markers are that these methods use a small amount of DNA that does not require high purification, and the results can be obtained much faster (Raza et al., 2019, Nadeem et al., 2018). This study aimed to find the best working conditions for fourteen SSRs markers recommended in wheat varietal purity assessment (ISTA, 2021). MATERIALS AND METHODS Selection of samples material and DNA extraction Plant material consisted of certified wheat seeds obtained from Central Laboratory for Quality of Seeds and Planting Material (LCCSMS), Romania. DNA extraction In this study DNA extraction was performed using NucleoSpin Plant II extraction kit (Macherey-Nagel) and the protocol was performed according to the manufacturer's requirements and adapted to meet the desired concentration and purity requirements (Macherey-Nagel, 2019). DNA was extracted from dry wheat seeds as follows: from each homogenized seed samples a number of 3-4 seeds were ground with a mortar and pestle and approximately 40 mg of ground powder was transferred to a sterile 2 ml microcentrifuge tube. The extraction kit has included two lysis buffers based on CTAB and SDS methods. In this study the DNA was extracted with CTAB based buffer. The mixture was vortexed thoroughly and RNase A solution has been added to the mixture. The suspension was incubated for 30 min at 65°C. The lysates were cleared by centrifugation and/ or filtration using the kit column in order to remove polysaccharides, contaminations and/or other residual cellular debris and mixed with kit binding buffer. After loading this mixture on a silica membrane spin column, the contaminants were washed three times using kit wash buffers. The genomic DNA was eluted with a low salt elution buffer (5 mM Tris/HCl, pH 8.5). After extraction the genomic DNA extracted can be kept at 4 °C for a short period

11
of time for further analysis but should be frozen at -20 °C for longer storage. (Macherey - Nagel, 2019). Genomic DNA evaluation The DNA concentration and quality were evaluated by spectrophotometry using Biochrom Biowave DNA UV-Vis Spectrophotometer.
SSRs markers Wheat SSRs markers for this study were chosen according to International Seed Testing Association (ISTA) rules being recommended as suitable for verification of wheat varieties (ISTA, 2021). In Table 1 the SSRs markers and PCR primers sequence used for optimizing the methods in this study is presented.
Table 1. PCR primers sequence of the SSRs markers used in this study
SSRs marker Forward Reverse DuPw167 CGGAGCAAGGACGATAGG CACCACACCAATCAGGAACC DuPw217 CGAATTACACTTCCTTCTTCCG CGAGCGTGTCTAACAAGTGC DuPw004 GGTCTGGTCGGAGAAGAAGC TGGGAGCGTACGTTGTATCC DuPw115 TGTTTCTTCCTCGCGTAACC CCTCGAATCTCCCAGTTATCG DuPw205 ATCCAGATCACACCAAACGG CTTCCGCTTCATCTTCTTGC Xgwm155 CAATCATTTCCCCCTCCC AATCATTGGAAATCCATATGCC Xgwm413 TGCTTGTCTAGATTGCTTGGG GATCGTCTCGTCCTTGGCA Xgwm003 GCAGCGGCACTGGTACATTT AATATCGCATCACTATCCCA Xgwm372 AATAGAGCCCTGGGACTGGG GAAGGACGACATTCCACCTG Xbarc347 GCGCACCTCTCCTCACCTTCT GCGAACATGGAAATGAAAACTATCT Xbarc184 TTCGGTGATATCTTTTCCCCTTGA CCGAGTTGACTGTGTGGGCTTGCTG Xbarc074 GCGCTTGCCCCTTCAGGCGAG CGCGGGAGAACCACCAGTGACAGAGC Xgwm052 CTATGAGGCGGAGGTTGAAG TGCGGTGCTCTTCCATTT Xgwm095 GATCAAACACACACCCCTCC AATGCAAAGTGAAAAACCCG (ISTA, 2021; Eujayl et al., 2002; Röder et al., 1998; Song et al., 2005) Choosing PCR conditions To choose the best PCR conditions was made an experimental plan that consisted of evaluating PCR products resulting from the PCR amplification process with the chosen SSRs markers. For this purpose, three PCR reaction mixtures were made. Mixture one containing PCR mix composed of 1x concentration Fast Start PCR Master, a ready-to-use, double-concentrated hot start PCR mix (Roche) which contains a Fast Start Taq DNA Polymerase, nucleotides and all other reagents required for PCR reaction. Mixture two containing PCR mix composed of 1 x concentration from 5 x Green GoTaq Flexi Buffer, 1.5 mM MgCl2 solution 25 mM, 0.2
mM PCR Nucleotide Mix 10 mM, 1.25 u GoTaq Hot Start Polymerase (5 u/µL) (Promega). Mixture three containing PCR mix composed of 1 x DreamTaq Buffer which includes 20 mM MgCl2, 0.2 mM PCR Nucleotide Mix 10 mM, 1.25 u Thermo Scientific DreamTaq DNA Polymerase. Additional reagents for all mixture: nuclease-free water up to 15-50 µL final volume, upstream and downstream primer at a final concentration of 0.3 µM and 30-40 ng/µL template DNA. Table 2 presents the final concentrations for all reagents contained in the mentioned mixtures.
Table 2. PCR component reaction and final concentration
PCR Mix PCR component reaction Final Concentration
1
FastStart PCR Master 2x 1 x upstream primer 0.3 µM downstream primer 0.3 µM template DNA 5 µL Nuclease-Free Water to 50 µL
2
5 x Green GoTaq® Flexi Buffer 1 x MgCl2 Solution, 25 mM 1.5 mM PCR Nucleotide Mix, 10 mM each 0.2 mM upstream primer 0.3 µM downstream primer 0.3 µM GoTaq® Hot Start Polymerase (5u/µl) 1.25 u

12
PCR Mix PCR component reaction Final Concentration template DNA 3 µL Nuclease-Free Water to 15 µL
3
10X DreamTaq Buffer 1 x PCR Nucleotide Mix, 10mM each 0.2 mM upstream primer 0.3 µM downstream primer 0.3 µM DreamTaq DNA Polymerase 1.25 u template DNA 3 µL Nuclease-Free Water to 20 µL
For PCR mix 3, additional optimization was performed and variations consisted in primers final concentration within a range of 0.2 to 0.4 µM, additional amount of 25 mM MgCl2 added to the PCR mix and also in mix final volume from 15 to 20 µL were made. Thermal cycling profile for PCR amplification for chosen SSRs markers was also evaluated. In Table 3 is presented the thermal cycling profile for PCR amplification, variations made on number of cycles, annealing temperature range and cycles duration. PCR amplification was performed in 96 well BIO- RAD T100TM Thermal Cycler system.
Table 3. Thermal cycling profile for PCR amplification
and its variation Number of
cycles Program Temperatu
re Duration
1 Initial Denaturation
95°C 3- 5 min
34-45
Denaturation 95°C 30 s-1 min
Annealing 48-65°C 30 s-1 min
Extension 72°C 30 s-1 min
1 Final extension 72°C 5 min
1 Hold 12°C indefinitely
Fragment separation and detection for PCR products resulted after amplification was done by agarose gel electrophoresis. PCR products were analysed using an agarose gel with a concentration in range of 2.3-2.6% agarose (Agarose I TM/VWR and Agarose, LE, Analytical Grade/Promega) in 1 x TAE buffer (Rothiphorese 10 x TAE Buffer from Roth). For detecting nucleic acid in agarose gel was used Red Safe™ Nucleic Acid Staining Solution (Intron) a substitute for EtBr (ethidium bromide). Electrophoresis power supply was insured by Consort EV243 and the migration was performed at a voltage between 66-90 V. The migration time was between 45 minutes and
two hours. PCR products were visualized on UV light using Vilber Lourmat E - Box VX2 imaging analysis system. RESULTS AND DISCUSSIONS An important step when talking about molecular biology techniques that uses PCR technology is DNA extraction. The chosen extraction method must lead to a template DNA that meets methods quality and quantity requirements and when using SSRs markers the DNA requirements are small amount of template DNA that does not require high purification (Raza et al., 2019; Nadeem et al., 2018) As previously mentioned, DNA extraction in this study was performed using an extraction kit. The manufacturer successfully tested both lysis buffers (CTAB and SDS based lysis buffer) on wheat leaves (Macherey-Nagel, 2019). In this study only CTAB lysis buffer was tested on dry seeds and the chosen buffer gave the expected results for extracted DNA. The DNA yield was between 60-100 ng/µL and the average of the measurements for the purity ratio was 1.8 for A260/A280 ratio and 2 for A260/ A230 ratio. The extracted genomic DNA, thus had all the qualities regarding the purity ratio and the desired concentration to go further with PCR amplification. Seeing that other studies show that an SDS-based lysis buffer is more suitable for DNA extraction from wheat dry seeds (Cristina et al., 2017) this buffer is also considered for testing in future studies. As chosen method must meet the conditions in terms of its specificity and reproducibility (Agarwal et al., 2008) when validating a method, it is important to meet all the acceptability criteria (Wood, 1999) so it becomes necessary to standardize the technique involving the use of SSRs and to choose for this purpose the most informative markers.

13
All SSRs markers chosen in this study gave good amplification products Another important stage in order to optimize the working methods is to choose the right PCR conditions for amplifying SSRs markers. The experimental plan consisted in choosing for each SSRs marker the reaction mixture and the most suitable annealing temperature so that the resulting amplification products can be well highlighted without non-specific amplification products, thus allowing a good results interpretation.
All markers were tested under reaction conditions in which PCR reaction mix, the primers annealing temperature as well as the number of amplification cycles varied. For each SSR marker, several combinations of PCR reaction mixtures and annealing temperatures were tested. The variations regarding the PCR reaction mixtures, annealing temperatures, number of amplification cycles used for each SSR marker but also details and remarks regarding the PCR products obtained after amplification under the given conditions can be observed in Table 4.
Table 4. Variation data on protocols and results obtained for each SSRs marker under present study
SSRs markers
PCRMix
Annealing temperature/
gradient (°C)
Number of
cycles
Amplification products Remarks
mix 1 mix 2 mix 3
DuPw167 1 57.6 ;56.1; 54; 53.3 35 +;+; +;+ No No - good products amplification for all temp with mix 1;
- chosen temperature 54°C for mix 1 and 2; - with mix 2 the products are much well highlighted than with mix 1 and 3; - mix 3 needs more optimization.
1& 2 54 35 + + No
2 & 3 54 40 No + +, Ns.p.
DuPw217 1 & 2 61.0; 56.1; 54.5;
53.0 35 -; +; +;+ +; +; +; + No - no products amplification with mix 1 at 61°C; - with mix 2 the products are much well highlighted - chosen temperature for this marker 55°C - optimization for mix 3 is needed (more non-specific amplification products).
2 55 35 No + No 2 & 3 55 40 No + +, Ns.p.
DuPw004
1 & 2 55; 54; 51 35 +; +; + +; +, Ns.p; +, Ns.p No - chosen temperature 55°C for all PCR mix;
- with mix 2 the products are highlighted much well at all temperatures; - non-specific amplifications products with mix 2 and 3; - the results are reproducible; - between 65°C - 55.3°C good amplification at all temp for mix 1 & 2.
2 65 35 No + No 2 54 35 No +, Ns.p No
1 & 2 54 35 + +, Ns.p No 1 & 2 65;60.3;55.3 35 +; +; + +; +; + No 2 & 3 55 40 No + +, Ns.p.
DuPw115
1 & 2 55; 54;51°C 35 +; +; + +; +; + No - with mix 2 the products are much well highlighted for all temperatures; - no amplification products at 65°C - chosen temperature 56°C for mix 2 - poor amplification with mix 1 (needs optimization); - non-specific amplifications products with mix 3
2 54 35 No + No 2 65; 60.3;55.3 35 No -; +; + No
1 & 2 56 35 No + No 2 & 3 56 40 No + +; Ns.p.
DuPw205
1 & 2 55; 54; 51 35 +; +; + +; +; + No - with PCR mix 1 & 2 between 55°C- 51°C the products are not well highlighted, reaction need optimization; - the results are reproducible; - chosen temperature 60°C for mix 2 - results reproducibility and repeatability when chosen temperature is 60° ( for PCR mix 2 variables in number of cycles from 34 to 40 and variation on the use of another hot start enzyme GoTaq G2 Polymerase) and for PCR Mix 1 the use of Fast start master 480 probes master (Roche) when they were not non-specific amplifications products; - non-specific amplifications products with PCR mix 3 at chosen temperature.
2 54 35 No + No 2 60; 58.8; 57.7; 56.3 34 No +; +; +; + No
2 60 40 No + No
2 60; 58.2 ;56.5; 51 35 No +; +; +; + No
2 & 3 60 40 No + +, Ns.p.
Xgwm155
1 & 2 54; 52.8; 48 35 +; +; + +, Ns.p; +,
Ns.p; +, Ns.p
No - between 54°C-48°C non-specific amplifications with mix 2, with mix 1 the products are not well highlighted, reaction need optimization - 60°C with PCR mix 1 the products are not well highlighted -62.4°C-61.4°C no amplification with PCR mix 2; - chosen temperature 56°C for PCR mix 2; - non- specific amplifications products with PCR mix 3.
1 & 2 60 45 + + No
2 62.4; 61.4; 59.9; 55.6 40 No -; -; +; + No
2 & 3 56 40 No + +, Ns.p.
Xgwm413
1 & 2 54; 52.8;48 35 +; +; + +, Ns.p; +,
Ns.p; +, Ns.p
No - 54°C-48°C non-specific amplifications with mix 2 and with mix 1 the products are not well highlighted, the reaction needs more optimization - chosen temperature 60°C for PCR mix 2 with PCR mix 1 the products are not well highlighted - results are confirmed at chosen temperature - non-specific amplifications products with PCR mix 3
1 & 2 60 45 + + No
2 62.4;61.4; 59.9; 55.6 40 No +; +; +; + No
2 60 40 No + No
2 & 3 60 40 No + +, Ns.p.
Xgwm003 1 & 2 54; 52.8; 48 35 +; +; + +; +, Ns.p; +, Ns.p No - 54°C-48°C with PCR mix 1 the products are not well
highlighted, optimizing the reaction is needed/ non-specific amplification products with PCR mix 2; 1 & 2 55.2 45 + + No

14
SSRs markers
PCRMix
Annealing temperature/
gradient (°C)
Number of
cycles
Amplification products Remarks
mix 1 mix 2 mix 3
2 59.9; 58.1; 56.5; 55 40 No +; +; +; + No - chosen temperature 55°C for PCR mix 2; - non-specific amplifications products with PCR mix 3.
2 & 3 55 40 No + +, Ns.p.
Xgwm372
1 & 2 60 35 + + No - at 60°C with PCR mix 1 the products are not well highlighted - non-specific amplifications products with PCR mix 3, the reaction needs more optimization - variation in primers final concentration with PCR mix 3 are made (0.2 µM primers final concentration); - chosen temperature 61°C for PCR mix 2 & 3
3 60 40 No No +, Ns.p. 3 61 40 No No +
3 61.4 ;59.9; 58.1; 56.5 40 No No +; +; +; +
2 & 3 61 40 No + +
Xbarc347
3 61; 60.5;58.7; 57.3; 55.3 40 No No
+, Ns.p.; +, Ns.p.; +, Ns.p.; +, Ns.p.; +,
Ns.p.
- more non-specific amplification products with this marker when using PCR mix 3 than PCR mix 2 -variation in primers final concentration with PCR mix 3 are made (from 0.2 to 0.4 µM primers final concentration); - chosen temp 57°C with PCR mix 2 3 57 40 No No +, Ns.p.
3 & 2 58; 57.4; 56.1; 55.1 40 No +; +; +; +
+, Ns.p.; +, Ns.p.; +, Ns.p.; +,
Ns.p. 2 57 40 No + No
Xbarc184
1 & 2 58 35 + + No - with PCR mix 1 the products are not well highlighted - results are confirmed for PCR mix 2 at chosen temperature - chosen temp 58°C with PCR mix 2 and all PCR products are well highlighted at all temperatures (good amplification products with PCR mix 2 & 3- with PCR mix 1 the products are not well highlighted
2 58 40 No + No 2 58; 57.4; 56.1; 55.1 40 No +; +; +; + No
3 & 2 58 40 No + +
Xbarc074
1 & 2 60 35 + + No - at 60°C with PCR mix 1 the products are not well highlighted - good amplification between 60°C-58°C for PCR mix 2, non-specific products amplification at 56.1°C - chosen temp 60°C for PCR mix 2 with this marker, - repetitive results at chosen temperature
2 61; 60.5; 58.7; 56.1 40 No +; +; +; +, Ns.p No
2 60 40 No + No
Xgwm052 2 61.2; 60; 58.8 40 No +; +; + No - good amplification for PCR mix 2 at all temperatures, - working temperature chosen for this marker is 60°C for PCR mix 2; repetitive results at chosen temperature 2 60 40 No + No
Xgwm095
1 & 2 60 35 + + No - with PCR mix 1 the products are not well highlighted - good amplification products for PCR mix 2 at all temperatures, the chosen temperature for this marker is 60°C for PCR mix 2, repetitive results at chosen temperature with PCR mix 2
2 61.2; 60; 58.8 40 No +; +; + No
2 60 40 No + No
Legend: “+”- presence of amplification products, “-” - absence of amplification products; “Ns.p.”- Non-specific amplification products, “No”- no amplification in these conditions was done. Following the data analysis from Table 4 we can say in terms of using the appropriate PCR reactions mix that the best results were obtained for all SSRs markers included in the study by using the PCR reaction mix 2. The analysis of obtained results with the three PCR reaction mixtures showed that the PCR products resulting from amplification with PCR mix 2 were better highlighted than when PCR mix 1was used, so in Figure 1 can be observed the products resulting from the amplification with DuPw167 marker of four wheat varieties with PCR mix 2 and PCR mix 1 at the chosen annealing temperatures 54°C.
Figure 1. Agarose gel electrophoresis of PCR product
obtained with DuPw167 marker Legend: “1-4” - wheat varieties tested, on the right are
products obtained with PCR mix 1 and on the left products obtained with PCR mix 2, NTC- negative
control which does not contain template DNA.

15
Even if with mix 1 the amplification products are not well highlighted compared to mix 2 and 3, non-specific products could not be observed in this study under the tested conditions. Another observation regarding the use of PCR mix 1 is that depending on the molecular markers and the annealing temperature used, the products are either not very well highlighted and at certain temperatures products cannot be observed. Thus, for DuPw217 marker no amplification products can be observed with PCR mix 1 at the annealing temperature of 61°C while with mix 2 the products are present. Since the annealing temperature chosen for future PCR reactions with this marker is 55°C, the absence of PCR products at 61°C with PCR mix 1 is not of great significance for the present study. The same was observed for the DuPw115 marker when it is not relevant that at annealing temperature of 65°C no amplification products with PCR mix 2 are obtained because the temperature chosen for future research with this marker is 56°C. Following the data analysis, it was found that variations related to the use of another Taq DNA polymerase namely GoTaq G2 Hot Start DNA Polymerase (Promega) for PCR mix two or the use of a new ready-to-use mix (Fast start master 480 probes master from Roche) instead of mix 1 did not influence the amplification result at the annealing temperature of 60°C chosen for DuPw205 marker. Regarding the PCR mix 3, it was observed that there are many more non-specific amplifications products than when the PCR mix 2 is used. The presence of non-specific amplification products when working with mix 3 compared to mix 2 can be observed in Figure 2. Thus, when using the Xbarc347 marker, it could be observed that under the conditions of the present study and at the chosen temperatures there are more non-specific products when using mix 3 than when using mix 2. This can be explained by the fact that the enzyme GoTaq® Hot Start Polymerase used in mix 2 has higher reaction specificity than DreamTaq DNA Polymerase from mix 3. In Figure 2 can be observed the products resulting from the amplification with Xbarc347 marker of two wheat varieties with PCR mix 3
and PCR mix 2 at annealing temperatures of 58°C, 57.4°C, 56.1°C and 55.1°C.
Figure 2. Agarose gel electrophoresis of PCR product
obtained with Xbarc347 marker Legend: “1, 2” - two of the wheat varieties tested; “D” - amplification with PCR mix 3; “H” - amplification with
PCR mix 2; NTC - negative control which does not contain template DNA
In order to reduce the presence of non-specific amplification products that appeared under the tested conditions in some of the SSR markers it was decided that for PCR mix 3 variations should be made. For SSR markers Xgwm372 and Xbarc347 with PCR mix 3 variations in primers final concentration (from 0.2-0.4 µM), additional 25 mM MgCl2 added to the master mix and reaction final volume were made. No significant differences were reported under tested conditions and it was decided that the values chosen in Table 2 are appropriate. This fact suggests that for the use of PCR mix 3 in future studies a better optimization for PCR reaction conditions is needed in case of some SSRs markers. The starting point in order to select the right annealing temperature for the selected SSRs markers under the conditions of the present study was to perform a gradient temperature either starting from primers melting temperatures (Tm) or from selected annealing temperature from online resources or literature (Blake et al., 2019; El-Fiki & Adly, 2019; Eujayl et al., 2002; Röder et al., 1998; Song et al., 2005; ISTA, 2021). So, for a better optimization a gradient temperature around these values in accordance with PCR equipment capacity was achieved. Annealing temperature for all SSR markers recommended by ISTA (2021) is 58°C but it
16
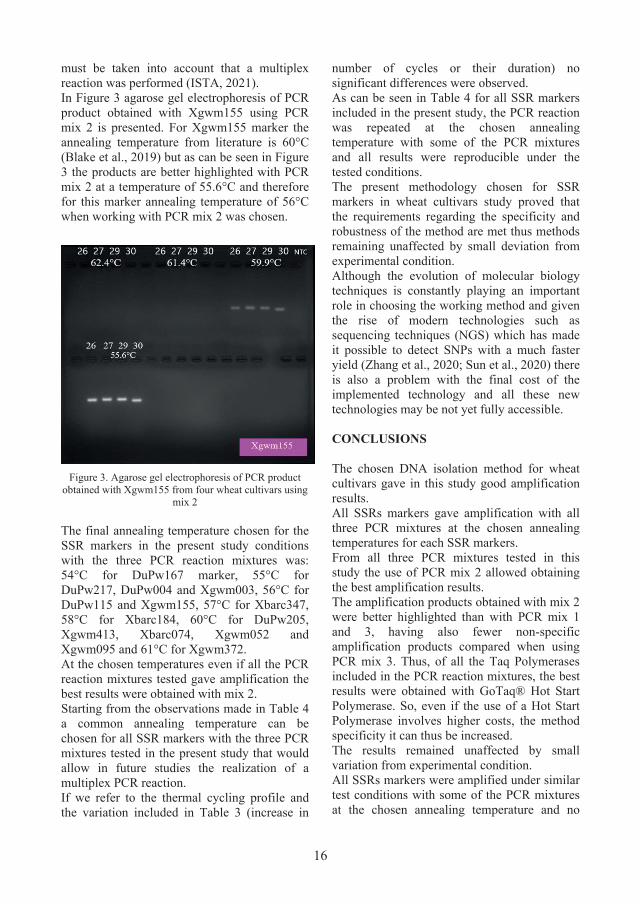
must be taken into account that a multiplex reaction was performed (ISTA, 2021). In Figure 3 agarose gel electrophoresis of PCR product obtained with Xgwm155 using PCR mix 2 is presented. For Xgwm155 marker the annealing temperature from literature is 60°C (Blake et al., 2019) but as can be seen in Figure 3 the products are better highlighted with PCR mix 2 at a temperature of 55.6°C and therefore for this marker annealing temperature of 56°C when working with PCR mix 2 was chosen.
Figure 3. Agarose gel electrophoresis of PCR product
obtained with Xgwm155 from four wheat cultivars using mix 2
The final annealing temperature chosen for the SSR markers in the present study conditions with the three PCR reaction mixtures was: 54°C for DuPw167 marker, 55°C for DuPw217, DuPw004 and Xgwm003, 56°C for DuPw115 and Xgwm155, 57°C for Xbarc347, 58°C for Xbarc184, 60°C for DuPw205, Xgwm413, Xbarc074, Xgwm052 and Xgwm095 and 61°C for Xgwm372. At the chosen temperatures even if all the PCR reaction mixtures tested gave amplification the best results were obtained with mix 2. Starting from the observations made in Table 4 a common annealing temperature can be chosen for all SSR markers with the three PCR mixtures tested in the present study that would allow in future studies the realization of a multiplex PCR reaction. If we refer to the thermal cycling profile and the variation included in Table 3 (increase in
number of cycles or their duration) no significant differences were observed. As can be seen in Table 4 for all SSR markers included in the present study, the PCR reaction was repeated at the chosen annealing temperature with some of the PCR mixtures and all results were reproducible under the tested conditions. The present methodology chosen for SSR markers in wheat cultivars study proved that the requirements regarding the specificity and robustness of the method are met thus methods remaining unaffected by small deviation from experimental condition. Although the evolution of molecular biology techniques is constantly playing an important role in choosing the working method and given the rise of modern technologies such as sequencing techniques (NGS) which has made it possible to detect SNPs with a much faster yield (Zhang et al., 2020; Sun et al., 2020) there is also a problem with the final cost of the implemented technology and all these new technologies may be not yet fully accessible. CONCLUSIONS The chosen DNA isolation method for wheat cultivars gave in this study good amplification results. All SSRs markers gave amplification with all three PCR mixtures at the chosen annealing temperatures for each SSR markers. From all three PCR mixtures tested in this study the use of PCR mix 2 allowed obtaining the best amplification results. The amplification products obtained with mix 2 were better highlighted than with PCR mix 1 and 3, having also fewer non-specific amplification products compared when using PCR mix 3. Thus, of all the Taq Polymerases included in the PCR reaction mixtures, the best results were obtained with GoTaq® Hot Start Polymerase. So, even if the use of a Hot Start Polymerase involves higher costs, the method specificity it can thus be increased. The results remained unaffected by small variation from experimental condition. All SSRs markers were amplified under similar test conditions with some of the PCR mixtures at the chosen annealing temperature and no

17
differences were reported, so results being reproducible. Depending on the reaction mixture used especially by the enzyme included in the PCR reaction mix as well as reagents final concentration a PCR reaction optimization plan can be made for each marker, which could facilitate the method validation and method standardization. Choosing a common annealing temperature that would allow a multiplex PCR reaction could reduce test time but it can also reduce the final costs of the analysis. REFERENCES Agarwal, M., Shrivastava, N., & Padh, H. (2008). Advances in molecular marker techniques and their applications in plant sciences. Plant cell reports, 27(4), 617-631.
Bernardo, R. (2008). Molecular markers and selection for complex traits in plants: learning from the last 20 years. Crop science, 48(5), 1649-1664.
Blake, V. C., Woodhouse, M. R., Lazo, G. R., Odell, S. G., Wight, C. P., Tinker, N. A., & Sen, T. Z. (2019). GrainGenes: centralized small grain resources and digital platform for geneticists and breeders. Database, 2019.
Brumlop, S., & Finckh, M. R. (2010). Applications and potentials of marker assisted selection (MAS) in plant breeding. Final report of the F+ E project “Applications and Potentials of Smart Breeding”(FKZ 350 889 0020) On behalf of the Federal Agency for Nature Conservation December.
Ciucă, M., Cristina, D., & Turcu, A. G. (2018). SSR marker TSM106 is a convenient tool for identifying wheat-RYE 1AL. 1RS translocation. Romanian Agricultural Research, (35), 11-14.
Cristina, D., Ciuca, M., & Cornea, C. P. (2017). Comparison of four genomic DNA isolation methods from single dry seed of wheat, barley and rye. AgroLife Scientific Journal, 6(1), 84-91.
Cristina, D., Ciucă, M., Mandea, V., & Cornea, C. P. (2018). Genetic diversity of TaSAP1-A1 locus and its association with TKW in some European winter wheat cultivars. Romanian Agricultural Research, 35, 3-9.
Dinu, L. D., Diguta, C., Ciuca, M., Ursu, L., & Cornea, C. P. (2014). Detection of molecular polymorphism of Puccinia triticina from wheat in Romania. Scientific Bulletin UASVM, 15-19.
Elameen, T. M., & Mohamed, E. A. (2019). SSR Marker for grain yield under heat stress conditions in bread wheat. Egyptian Journal of Genetics And Cytology, 48(2).
El-Fiki, A., & Adly, M. (2019). Molecular characterization and genetic diversity in some Egyptian wheat (Triticum aestivum L.) using microsatellite markers. Potravinarstvo, 13(1).
Erayman, M., Ilhan, E., Eren, A. H., Güngör, H., & Akgöl, B. (2016). Diversity analysis of genetic,
agronomic, and quality characteristics of bread wheat (Triticum aestivum L.) cultivars grown in Turkey. Turkish Journal of Agriculture and Forestry, 40(1), 83-94.
Eujayl, I., Sorrells, M. E., Baum, M., Wolters, P., & Powell, W. (2002). Isolation of EST-derived microsatellite markers for genotyping the A and B genomes of wheat. Theoretical and Applied Genetics, 104(2-3), 399-407.
Haque, M. S., Saha, N. R., Islam, M. T., Islam, M. M., Kwon, S. J., Roy, S. K., & Woo, S. H. (2021). Screening for drought tolerance in wheat genotypes by morphological and SSR markers. Journal of Crop Science and Biotechnology, 24(1), 27-39.
Hayden, M. J., Nguyen, T. M., Waterman, A., McMichael, G. L., & Chalmers, K. J. (2008). Application of multiplex-ready PCR for fluorescence-based SSR genotyping in barley and wheat. Molecular breeding, 21(3), 271-281.
International Rules for Seed Testing (ISTA), 2021, Chapter 8, Species and variety testing, i–8-28 (36), Zurich, Switzerland.
Khan, M. K., Pandey, A., Choudhary, S., Hakki, E. E., Akkaya, M. S., & Thomas, G. (2014). From RFLP to DArT: molecular tools for wheat (Triticum spp.) diversity analysis. Genetic resources and crop evolution, 61(5), 1001-1032.
Kumar, P., Gupta, V. K., Misra, A. K., Modi, D. R., & Pandey, B. K. (2009). Potential of molecular markers in plant biotechnology. Plant omics, 2(4), 141.
Macherey-Nagel. (2019). Genomic DNA from plant. User manual. Rev.11. Düren, Germany.
Madesis, P., Ganopoulos, I., & Tsaftaris, A. (2013). Microsatellites: evolution and contribution. In Microsatellites (pp. 1-13). Humana Press, Totowa, NJ.
Mangini, G., Taranto, F., Giove, S., Gadaleta, A., & Blanco, A. (2010). Identification of durum wheat cultivars by a minimum number of microsatellite markers. Cereal Research Communications, 38(2), 155-162.
Nadeem, M. A., Nawaz, M. A., Shahid, M. Q., Doğan, Y., Comertpay, G., Yıldız, M., & Baloch, F. S. (2018). DNA molecular markers in plant breeding: current status and recent advancements in genomic selection and genome editing. Biotechnology & Biotechnological Equipment, 32(2), 261-285.
Niaz, S., Nawaz, S., Butt, A., Bilal, M. Q., Mubin, M., Akram, A., & Ahmed, N. (2020). Genetic variability estimation in wheat using random amplified polymorphic DNA based markers. Pakistan Journal of Agricultural Sciences, 57(3).
Noli, E., Teriaca, M. S., Sanguineti, M. C., & Conti, S. (2008). Utilization of SSR and AFLP markers for the assessment of distinctness in durum wheat. Molecular Breeding, 22(2), 301-313.
Raza, A., Mehmood, S. S., Shah, T., Zou, X., Yan, L., Zhang, X., & Khan, R. S. A. (2019). Applications of molecular markers to develop resistance against abiotic stresses in wheat. In Wheat Production in Changing Environments (pp. 393-420). Springer, Singapore.
Röder, M. S., Korzun, V., Wendehake, K., Plaschke, J., Tixier, M. H., Leroy, P., & Ganal, M. W. (1998). A

18
microsatellite map of wheat. Genetics, 149(4), 2007-2023.
Senan, S., Kizhakayil, D., SASIKUMAR, B., & SHEEJA, T. E. (2014). Methods for development of microsatellite markers: an overview. Notulae Scientia Biologicae, 6(1), 1-13.
Song, Q. J., Shi, J. R., Singh, S., Fickus, E. W., Costa, J. M., Lewis, J., & Cregan, P. B. (2005). Development and mapping of microsatellite (SSR) markers in wheat. Theoretical and applied genetics, 110(3), 550-560.
Sun, C., Dong, Z., Zhao, L., Ren, Y., Zhang, N., & Chen, F. (2020). The Wheat 660K SNP array demonstrates great potential for marker-assisted selection in polyploid wheat. Plant Biotechnology Journal, 18(6), 1354-1360.
Varshney, R. K., Kumar, A., Balyan, H. S., Roy, J. K., Prasad, M., & Gupta, P. K. (2000). Characterization of microsatellites and development of chromosome specific STMS markers in bread wheat. Plant Molecular Biology Reporter, 18(1), 5-16.
Wood, R. (1999). How to validate analytical methods. TrAC Trends in Analytical Chemistry, 18(9-10), 624-632.
Xinquan, Y., Peng, L., Zongfu, H., Zhongfu, N., & Qixin**, S. (2005). Genetic diversity revealed by genomic-SSR and EST-SSR markers among common wheat, spelt and compactum. Progress in Natural Science, 15(1), 24-33.
Xu, Y., & Crouch, J. H. (2008). Marker-assisted selection in plant breeding: From publications to practice. Crop science, 48(2), 391-407.
Yadav, Summy & Vijapura, Akdasbanu & Dave, Akanksha & Shah, Sneha & Memon, Zeba (2019). Genetic Diversity Analysis of Different Wheat [Triticum aestivum (L.)] Varieties Using SSR Markers. International Journal of Current Microbiology and Applied Sciences, 8, 839-846.
Zhang, S., Li, B., Chen, Y., Shaibu, A. S., Zheng, H., & Sun, J. (2020). Molecular-Assisted Distinctness and Uniformity Testing Using SLAF-Sequencing Approach in Soybean. Genes, 11(2), 175.
Zhao, C., Sun, H., Guan, C., Cui, J., Zhang, Q., Liu, M., & Cui, F. (2019). Physical information of 2705 PCR-based molecular markers and the evaluation of their potential use in wheat. Journal of genetics, 98(3), 69.

19
PROTEIN AND AMINO ACID PROFILE ANALYSIS
OF AGRI-FOOD WASTE BIOMASSES
Eleonora CALZONI1, Alessio CESARETTI1, 2, Nicolò MONTEGIOVE1, Roberto Maria PELLEGRINO1, Leonardo LEONARDI3, Carla EMILIANI1, 2
1Department of Chemistry, Biology and Biotechnology, Biochemistry and Molecular Biology
Section, University of Perugia, Via del Giochetto, 06123 Perugia, Italy 2Centro di Eccellenza sui Materiali Innovativi Nanostrutturati (CEMIN), University of Perugia,
Via del Giochetto, 06123 Perugia, Italy 3Department of Veterinary Medicine, University of Perugia, Via San Costanzo 4,
06126 Perugia, Italy
Corresponding author email: [email protected] Abstract The degradation of biomasses derived from agriculture and food industry presents the double advantage of both eliminating often polluting wastes and giving the possibility of introducing novel bio-derived products into the market. The recovery of the protein component and its transformation into protein hydrolysates is generally carried out chemically or enzymatically and brings great added value to waste biomasses. The recovery of the protein component from waste products is extremely advantageous inasmuch as bio-based products can be reintroduced into the market by virtue of their high added value in full compliance with the perspective of the Circular Economy. The products obtained can be used as food supplements both in human and animal nutrition, as growth stimulants in agriculture, or as biofertilizers. The peculiar characteristics of the obtained protein hydrolysates allow their multiple applications in many industrial fields. Therefore, the aim of this work is to assess the protein and amino acid (AA) profiles of agri-food biomass, i.e. soy wastes, previously subjected to an enzymatic hydrolysis process. The protein profile of the initial biomass and the corresponding hydrolysate was analyzed by SDS-PAGE followed by Coomassie Blue staining, while the AA profile was evaluated by quadrupole time-of-flight liquid chromatography/mass spectrometry (Q-TOF LC/MS). The results indicate how the enzymatic hydrolysis process breaks down the peptide bonds of the protein component in the biomass, leading to the formation of hydrolysates rich in small peptides and free AAs. Key words: Circular Economy, enzymatic hydrolysis, enzyme immobilization, protein hydrolysates, waste biomasses. INTRODUCTION The use of biomasses for industrial purposes represents an extremely alluring tool for the recovery of the waste products coming from the agribusiness and food industry. The recovery of these materials provides environmental and socioeconomic benefits, as the problems concerning their disposal are reduced and, at the same time, they can be used as alternative energetic sources (Calzoni et al., 2019; Calzoni et al., 2020; Cesaretti et al., 2020; Calzoni et al., 2021). The enhancement of waste products deriving from agriculture is also one of the main objectives of Circular Economy, which is extremely supported by European Union (EU) policies that promote the use of bioproducts obtained from these types of materials (Stahel, 2016; Tuck et al., 2012; Sherwood, 2020). Biomasses are organic raw
materials of natural biological origin that can be used as substrates for the production of bio-based products. Broadly speaking, waste biomasses are classified into different categories according to their chemical composition (Tuck et al., 2012), based on which it is possible to obtain different bio-products: polysaccharides, lignin, triglycerides (from fats and oils), or proteins. All these by-products can thus be exploited to make compost, biogas, or other products with high-added value (Cesaretti et al., 2020; Calzoni et al., 2021). Particularly, the production of high added value protein hydrolysates obtainable from these waste materials is extremely interesting (Martínez-Alvarez et al., 2015). In fact, most of the agricultural waste biomass has a high content of recoverable proteins in the form of hydrolysates, which may find various applications in many industrial and non-
Scientific Bulletin. Series F. Biotechnologies, Vol. XXV, No. 1, 2021ISSN 2285-1364, CD-ROM ISSN 2285-5521, ISSN Online 2285-1372, ISSN-L 2285-1364

20
industrial sectors. Furthermore, hydrolysates of vegetable origin are safe products and do not present any toxicity for plants or humans. The production of protein hydrolysates can be obtained by chemical, microbial, or enzymatic routes (Callegaro et al., 2019; Cesaretti et al., 2020). Chemical hydrolysis is carried out under acidic or basic conditions at high temperatures. However, this type of processes leads to the formation of poor-quality products, due to the loss of assimilable amino acids (AAs) such as tryptophan, cysteine, arginine, threonine, serine, and isoleucine, and to the production of modified AAs such as lysinoalanine and lanthionine, as well as secondary products such as chlorides (Tsugita & Scheffler, 1982; Fountoulakis & Lahm, 1998; Tavano, 2013; Corte et al., 2014; Cesaretti et al., 2020). Further to this, high content of acidic or basic residues can be found in the final hydrolysate which limits their applicability, especially in the agricultural sector and in the food industry (Chervan & Deeslie, 1984; Cesaretti et al., 2020). Microbial hydrolysis, on the other hand, is obtained through the use of specific microbial cultures which allow, thanks to their enzymatic pathways, good quality hydrolysates to be obtained; this type of technique is widely used to produce hydrolysates starting from plant biomasses (Lòpez-Barrios et al., 2014; Li-Chan, 2015; Bah et al., 2016). Hydrolysis mediated by microorganisms excludes the use of chemicals or high temperatures, preventing or limiting the loss of essential amino acids (EAAs). However, this type of technique is often expensive and there could be a certain susceptibility of the microbial strain chosen if changes in the environmental conditions occur (Hou et al., 2017). Protein hydrolysates can also be obtained enzymatically through the use of purified enzymes in their free or immobilized form. This type of process is extremely advantageous compared to the chemical or microbial ones both from an economic and environmental point of view, as it is carried out under mild conditions of temperature and pH; furthermore, the problem of the environmental condition susceptibility of the microbial strains is avoided. Enzymatic hydrolysis does not lead to the formation of unwanted and toxic secondary products, it preserves the structure of AAs and
makes the final product more soluble (Fox et al., 1982; Clemente et al., 1999; Clemente, 2000; Cesaretti et al., 2020). In this regard, proteases constitute the largest group of enzymes used for the production of protein hydrolysates and represent about 60% of the enzymes used in various industrial fields (Zambare et al., 2011; Sawant & Nagendran, 2014; Souza et al., 2015; Salihi et al., 2017; Calzoni et al., 2021). In fact, these enzymes are able to hydrolyze the peptide bonds in proteins, converting them into small peptides and free AAs. There are many sectors in which protein hydrolysates of vegetable origin can find application; they are used in the animal nutrition field by virtue of their nutritional, physiological, and direct regulatory functions, as they promote the growth rate of the animal, and are used as biofertilizers, as the hydrolysates can improve the assimilation of crop nutrients and to mitigate crop stress (Halpern et al., 2015; Cesaretti et al., 2020). Furthermore, those hydrolysates containing bioactive peptides can be used as antihypertensive, antioxidant, and anti-inflammatory agents (Hou et al., 2017; Cesaretti et al., 2020; Zou et al., 2020). It should also be remembered that the vast majority of protein hydrolysates have a hypoallergenic nature, making them suitable ingredients for infant food formulations or as supplements in the diets of children suffering from severe food allergies (Schaafsma, 2009; Cesaretti et al., 2020). The purpose of this work is to recover protein hydrolysates from agricultural waste biomass, i.e. soybean, obtained by the enzymatic method through the use of immobilized proteases extracted from Aspergillus oryzae. The degree of hydrolysis of the original biomass was evaluated primarily by SDS-PAGE followed by Coomassie Blue staining, and subsequently by Ninhydrin Assay and Mass Spectrometry analysis to evaluate the amount of AAs and small peptides formed as a result of hydrolysis. MATERIALS AND METHODS Protein Solubilization The biomass used consists of soy wastes resulting from its processing. The soy waste was mechanically shredded to form a

21
homogeneous powder. The soy powder was suspended in deionized water and incubated for 1 hour at 80°C. During the incubation, the sample was repeatedly shaken to favor the extraction of proteins. At the end of the incubation time, the sample was centrifuged at 16,000 × g at 4°C for 15 minutes and the soluble part was then collected. This solution was further centrifuged at 16,000 x g at 4°C for 15 minutes and the supernatant containing the total extract of solubilized proteins was collected. Protein Content Analysis Protein content in the samples was determined with the Bradford assay (Bradford, 1976) using Quick Start™ Bradford 1× Dye Reagent (Bio-Rad, Hercules, CA, USA) according to the manufacturer’s instructions for one-step determination of protein concentration. The quantitative determination was carried out using the Coomassie Brilliant Blue G-250 dye (Bio-Rad, Hercules, CA, USA), which in the protein-bound form has an absorption peak at 595 nm. The absorbance at 595 nm was measured using a Shimadzu UV-160A UV-Visible Recording Spectrophotometer (Shimadzu Scientific Instruments, Kyoto, Japan). The concentration of the proteins of the samples was obtained from their absorbance using a calibration curve prepared with known concentrations of bovine serum albumin (BSA; Sigma-Aldrich, Saint Louis, MO, USA). Enzymatic Hydrolysis In order to obtain soybean protein hydrolysates, proteases from Aspergillus oryzae, purchased from Sigma-Aldrich (Saint Louis, MO, USA) were used without any further purification. These fungal proteases consist of a cocktail of different enzymes exhibiting both endoprotease and exopeptidase activities. 200 µg/cm2 of proteases were immobilized by adsorption on nitrocellulose membranes of the size of 1 cm2. The soy extract was treated with immobilized enzymes for 4 hours at 37°C and the hydrolysate obtained was collected. SDS-PAGE and Coomassie Blue Staining Method The electrophoretic profile of the samples was assessed through SDS-PAGE according to the
Laemmli protocol (Laemmli, 1970). An exact quantity of soluble protein extract was mixed with sample buffer 5× (0.5 M Tris-HCl pH 6.8, 10% (w/v) SDS, 50% (v/v) glycerol, 0.01% (w/v) bromophenol blue, and 125 mM dithiothreitol; Sigma-Aldrich, Saint Louis, MO, USA) at a concentration ratio of 4:1 (v/v). Samples were then boiled for 5 minutes and electrophoresed on 15% acrylamide gel (Mini-PROTEAN® 3 Cell, Bio-Rad, Hercules, CA, USA) at 40 mA. Gels were later stained with Coomassie Blue R-250 (Bio-Rad, Hercules, CA, USA). Hydrolysis Degree Evaluation by Ninhydrin Assay The degree of hydrolysis was assessed by estimating the concentration of free AAs in solution through the Ninhydrin assay (Rosen, 1957) and by making a comparison with the concentration of free AAs found in the starting extract. The test was carried out using 2,2-dihydroxy-1,3-dioxyhydrindene (Ninhydrin) supplied by Sigma-Aldrich (Saint Louis, MO, USA), which, added to the protein hydrolysate, interacts with the primary amines giving a blue-violet color with maximum absorption at 570 nm. The absorbance at 570 nm was measured using a Shimadzu UV-160A UV-Visible Recording Spectrophotometer (Shimadzu Scientific Instruments, Kyoto, Japan). Peptides analysis by Q-TOF LC/MS The raw extract of soybean waste and the hydrolysates produced after 4-hour hydrolysis were analyzed for peptide quantification with Q-TOF LC/MS. Protein hydrolysates obtained from the hydrolysis of the soy waste biomass were diluted with methanol (up to 90% of the final volume) to allow both peptide extraction and protein precipitation. After a centrifugation step, an aliquot of the Supernatant was subject to Q-TOF LC/MS analysis. LC separation was performed on an Agilent 1260 Infinity LC System (Agilent Technologies, Inc., Santa Clara, CA, USA) with a 10 minutes gradient time on a reverse phase column (Ascentis Express Peptide ES-C18 75 x 2.1 mm, 2.7 μm, Supelco Inc., Bellefonte, PA, USA) at 50°C and 0.5 mL/min flow. The mobile phase consisted of water and acetonitrile both containing 0.1% formic acid. Positive polarity

22
data were acquired on the Agilent 6530 LC/QTOF (Agilent Technologies, Inc., Santa Clara, CA, USA) using an Agilent JetStream source in the range 50-1700 m/z and in Auto MSMS modality, at 5 spectra/sec and 3 spectra/sec for MS and MS/MS, respectively. The acquired raw data were processed with Agilent MassHunter Bioconfirm Software (B.09.00) (Agilent Technologies, Inc., Santa Clara, CA, USA) and searched for the identification of small peptides using MassHunter Metlin Peptides AM PCD library (Agilent Technologies, Inc., Santa Clara, CA, USA). Statistical analysis Data shown in this study are reported as mean values of three analyzed samples ± standard error of the mean (SEM). The Student’s t-test was used to analyze the significance of the differences between the means of control values (soy extract) and the sample values after
the hydrolysis process. The level of significance for the data was set at p < 0.05. All statistical tests were done using GraphPad Prism 6.00 for Windows (GraphPad Software, San Diego, CA, USA). RESULTS AND DISCUSSIONS In this study, waste resulting from the processing of soy, biomass extremely rich in proteins, was used. The process that led to the production of the protein hydrolysate from the waste is shown in Figure 1. The hydrolysis was carried out using a pool of proteases extracted from Aspergillus oryzae immobilized on nitrocellulose membranes. The advantage deriving from the immobilization of enzymes on solid supports is represented by the possibility of reusing the same biocatalysts for several reaction cycles (Husain, 2016; Husain, 2018; Calzoni et al., 2021).
Figure 1. Experimental plan to obtain protein hydrolysates from soybean waste by immobilized enzymes

23
In this regard, the enzyme-mediated hydrolysis was carried out at 37°C for 4 hours and repeated for three operating cycles. The degree of hydrolysis of the starting biomass was then evaluated by SDS-PAGE followed by Coomassie Blue staining (Figure 2).
Figure 2. Protein profile of free proteases, soy extract,
and soy hydrolysates obtained after three operating cycles at 37 °C for 4 hours with immobilized proteases, evaluated by SDS-PAGE, followed by Coomassie Blue
staining method. The protein profile obtained by SDS-PAGE shows how the soy extract is almost completely hydrolyzed after the first operating cycle; in fact, the disappearance of the main bands that characterize the biomass protein profile is evident. This is due to the probable production of small peptides and free AAs following the hydrolysis process. With the following reaction cycles, a slight loss of efficiency of the membrane-bound proteases can be noted, but nevertheless, a satisfactory level of hydrolysis is again obtained after the third reaction. The same samples were also analyzed employing the Ninhydrin assay, to obtain an estimate of the free AAs in solution before and after the enzymatic hydrolysis. In fact, Ninhydrin is a reagent that interacts with the primary amines of AAs leading to the formation of a complex that absorbs at 570 nm. The results shown in Figure 3 confirm those previously obtained by SDS-PAGE analysis.
In fact, following the first reaction cycle, the enzymatic hydrolysis process produces a concentration of free AAs about 14 times higher than that found in the starting biomass; while in the two subsequent hydrolysis cycles a slight decrease is observed relatively to the first cycle but the concentration of free AAs is still significantly higher than in the control. The soybean protein hydrolysate obtained after the hydrolysis performed by immobilized proteases was then analyzed by Q-TOF LC/MS. The control, consisting of a raw extract of soybean waste, and the mix of hydrolysates produced after 3 cycles of hydrolysis were searched for tri- and tetrapeptides with the aid of the MassHunter Metlin Peptides AM PCD database.
Figure 3. A concentration obtained using the Ninhydrin assay after enzymatic hydrolysis at 37°C for 4 hours in three consecutive operating cycles. Data are reported as
mean ± SEM, n = 3. **** p < 0.0001 Figure 4 reports the peptide abundances, measured as the area under the chromatogram peaks, of the total peptides, detected in the mix of hydrolysates after three operating cycles, compared with the control. The presence of some peptides already in the control extract may be due to the thermal treatment of the initial soybean powder, carried at 80°C as described in the Materials and Methods section. However, in the hydrolysate mix, a massive increase of total peptides is detected, thus corroborating the results acquired with the SDS-PAGE and Ninhydrin assay analyses, and confirming the efficient functioning of immobilized proteases on a nitrocellulose membrane support.
Soy Extr
act
1st cyc
le
2nd cyc
le
3rd cyc
le0
5
10
15
20
µM
****
****
****

24
Figure 4. The abundance of total peptides in soy extracts
and hydrolysate mix evaluated by Q-TOF LC/MS analysis. Data are reported as mean ± SEM, n = 3. ****
p < 0.0001
The most abundant tri- and tetrapeptides detected in the hydrolysate are reported in Table 1, the abundance of these peptides represents about 15% of the total peptides detected. Table 1. Peptide characterization in soy hydrolysate mix.
Peptides characterization
Tetrapeptides Tripeptides
Arg-Ile-Lys-Pro Lys-Pro-Val
Gln-Lys-Lys-Lys Arg-Gly-Ser
The most abundant species found are the tetrapeptides Arg-Ile-Lys-Pro and Gln-Lys-Lys-Lys, followed by two other tripeptides, namely Lys-Pro-Val and Arg-Gly-Ser. As is well-known for protein hydrolysates, these
kinds of peptides arouse interest in the industrial field for their several potential biological activities and applications in the food and agricultural sector (Karami & Akbari-Adergani, 2019; Calzoni et al., 2021). CONCLUSIONS In this work, the possibility of using immobilized enzymes for biomass degradation has been demonstrated. In particular, the results of the enzymatic hydrolysis of soybean waste extract are very encouraging as demonstrated by the SDS-PAGE, Ninhydrin assay, and Q-TOF LC/MS analysis, which allowed a high degree of hydrolysis of the original biomass to be highlighted. Furthermore, the experiment was repeated for 3 operating cycles on a nitrocellulose membrane support, demonstrating how the system can be reused with only a minimal reduction in its performance. These protein hydrolysates obtained following this hydrolysis process could be used as sources of bioactive peptides and AAs which can be useful both in the food industry as supplements for humans or feed additives for animals, and in the agricultural field as soluble fertilizers or growth factors for plants. The enzymatic way by-passes the problem of toxic side products that are formed with the classic chemical hydrolysis and avoids the susceptibility problematic of the microbial strains to the environmental condition changes. From this perspective, the use of immobilized enzymes expresses great potential and represents a new green technology enabling the disposal of agri-food waste and the production of high-added-value bio-products to be reintroduced into the market.
REFERENCES Bah, C.S., Carne, A., McConnell, M.A., Mros, S. &
Bekhit, A.E.D.A. (2016). Production of bioactive peptide hydrolysates from deer, sheep, pig and cattle red blood cell fractions using plant and fungal protease preparations. Food chemistry, 202, 458-466.
Bradford, M. M. (1976). A rapid and sensitive method for the quantitation of microgram quantities of protein utilizing the principle of protein-dye binding. Analytical biochemistry, 72(1-2), 248-254.
Callegaro, K., Brandelli, A., & Daroit, D. J. (2019). Beyond plucking: Feathers bioprocessing into
valuable protein hydrolysates. Waste Management, 95, 399-415.
Calzoni, E., Cesaretti, A., & Emiliani, C. (2019). Creating Products and Services in Industrial Biotechnology. In Introduction to Biotech Entrepreneurship: From Idea to Business (pp. 129-139). Springer, Cham.
Calzoni, E., Cesaretti, A., Montegiove, N., Pierantoni Casagrande, D., Corte, L., Roscini, L., Emiliani, C., Leonardi, L., Cardinali, G. (2020). Mixed microbial and thermal degradation of agricultural derived plant wastes. Scientific Bulletin. Series F. Biotechnologies, 24, 11-16.
Soy Extract
Hydrolysates
0
5×10⁷
1×10⁸
1.5×10⁸
Pept
ide A
bund
ance
****

25
Calzoni, E., Cesaretti, A., Tacchi, S., Caponi, S.,
Pellegrino, R. M., Luzi, F., Cottone, F., Fioretto, D., Emiliani, C., & Di Michele, A. (2021). Covalent Immobilization of Proteases on Polylactic Acid for Proteins Hydrolysis and Waste Biomass Protein Content Valorization. Catalysts, 11(2), 167.
Cesaretti, A., Montegiove, N., Calzoni, E., Leonardi, L., & Emiliani, C. (2020). Protein hydrolysates: from agricultural waste biomasses to high added-value products (minireview). AgroLife Scientific Journal, 9(1), 79-87.
Chervan, M. & Deeslie, W.D. (1984). U.S. Patent No. 4,443,540. Washington, DC: U.S. Patent and Trademark Office.
Clemente, A. (2000). Enzymatic protein hydrolysates in human nutrition. Trends in Food Science & Technology, 11(7), 254-262.
Clemente, A., Vioque, J., Sánchez-Vioque, R., Pedroche, J., Bautista, J. & Millán, F. (1999). Protein quality of chickpea (Cicer arietinum L.) protein hydrolysates. Food Chemistry, 67(3), 269-274.
Corte, L., Dell'Abate, M. T., Magini, A., Migliore, M., Felici, B., Roscini, L., ... & Benedetti, A. (2014). Assessment of safety and efficiency of nitrogen organic fertilizers from animal based protein hydrolysates - a laboratory multidisciplinary approach. Journal of the Science of Food and Agriculture, 94(2), 235-245.
Fountoulakis, M. & Lahm, H.W. (1998). Hydrolysis and amino acid composition analysis of proteins. Journal of chromatography A, 826(2), 109-134.
Fox, P.F., Morrissey, P.A. & Mulvihill, D.M. (1982). Chemical and enzymatic modification of food proteins. Developments in food proteins.
Halpern, M., Bar-Tal, A., Ofek, M., Minz, D., Muller, T. & Yermiyahu, U. (2015). The use of biostimulants for enhancing nutrient uptake. In Advances in agronomy 130, 141-174. Academic Press.
Hou, Y., Wu, Z., Dai, Z., Wang, G. & Wu, G. (2017). Protein hydrolysates in animal nutrition: Industrial production, bioactive peptides, and functional significance. Journal of Animal Science and Biotechnology, 8(1), 24.
Husain, Q. (2016). Magnetic nanoparticles as a tool for the immobilization/stabilization of hydrolases and their applications: An overview. Biointerface Research in Applied Chemistry, 6(6).
Husain, Q. (2018). Nanocarriers immobilized proteases and their industrial applications: An overview. Journal of nanoscience and nanotechnology, 18(1), 486-499.
Karami, Z., & Akbari-Adergani, B. (2019). Bioactive food derived peptides: A review on correlation between structure of bioactive peptides and their functional properties. Journal of food science and technology, 56(2), 535-547.
Laemmli, U. K. (1970). SDS-page Laemmli method. Nature, 227, 680-5.
Li-Chan, E.C.Y. (2015). Bioactive peptides and protein hydrolysates: research trends and challenges for application as nutraceuticals and functional food ingredients. Curr Opin Food Sci., 1: 28-3.
López-Barrios, L, Gutiérrez-Uribe, J.A., & Serna-Saldívar, S.O. (2014). Bioactive peptides and hydrolysates from pulses and their potential use as functional ingredients. J Food Sci., 79: R2 73–83.
Martínez-Alvarez, O., Chamorro, S. & Brenes, A. (2015). Protein hydrolysates from animal processing by-products as a source of bioactive molecules with interest in animal feeding: A review. Food Research International, 73, 204-212.
Rosen, H. (1957). A modified ninhydrin colorimetric analysis for amino acids. Archives of biochemistry and biophysics, 67(1), 10-15.
Salihi, A., Asoodeh, A., & Aliabadian, M. (2017). Production and biochemical characterization of an alkaline protease from Aspergillus oryzae CH93. International journal of biological macromolecules, 94, 827-835.
Sawant, R., & Nagendran, S. (2014). Protease: an enzyme with multiple industrial applications. World J Pharm Sci, 3, 568-579.
Schaafsma, G. (2009). Safety of protein hydrolysates, fractions thereof and bioactive peptides in human nutrition. European journal of clinical nutrition, 63(10), 1161-1168.
Sherwood, J. (2020). The significance of biomass in a circular economy. Bioresource technology, 300, 122755
Souza, P. M. D., Bittencourt, M. L. D. A., Caprara, C. C., Freitas, M. D., Almeida, R. P. C. D., Silveira, D., ... & Magalhães, P. O. (2015). A biotechnology perspective of fungal proteases. Brazilian Journal of Microbiology, 46(2), 337-346.
Stahel, W.R. (2016). The circular economy. Nature, 531(7595), 435-438.
Tavano, O.L. (2013). Protein hydrolysis using proteases: an important tool for food biotechnology. Journal of Molecular Catalysis B: Enzymatic, 90, 1-11.
Tsugita, A. & Scheffler, J.J. (1982). A rapid method for acid hydrolysis of protein with a mixture of trifluoroacetic acid and hydrochloric acid. European Journal of Biochemistry, 124(3), 585-588.
Tuck, C.O., Pérez, E., Horváth, I.T., Sheldon, R.A. & Poliakoff, M. (2012). Valorization of biomass: deriving more value from waste. Science, 337(6095), 695-699.
Zambare, V., Nilegaonkar, S., & Kanekar, P. (2011). A novel extracellular protease from Pseudomonas aeruginosa MCM B-327: enzyme production and its partial characterization. New biotechnology, 28(2), 173-181.
Zou, Z., Wang, M., Wang, Z., Aluko, R. E. & He, R. (2020). Antihypertensive and antioxidant activities of enzymatic wheat bran protein hydrolysates. Journal of food biochemistry, 44(1), e13090.

26
BIOMETRIC RESULTS FOR MAIZE CROP, AS A RESULT OF TREATMENT WITH NEW BIOSTIMULATORS
BASED ON PROTEIN ADDITIVES
Roxana HOROIAȘ1, Marius BECHERIȚU1, Cristian CIOINEAG1, Paul BOROVINĂ1, Carmen GAIDĂU2, Mihaela NICULESCU2
1Probstdorfer Saatzucht Romania SRL, 20 Siriului Street, 014354, District 1, Bucharest, Romania
2Research and Development National Institute for Textiles and Leather - Division Leather and Footwear Research Institute, Leather Research Department, 93 Ion Minulescu Street,
031215, Bucharest, Romania
Corresponding author email: [email protected] Abstract In 2020, nine new biostimulators for maize crop, with foliar application, have been created and the testing process started. All these biostimulators are based on protein additives, respectively hydrolyzed keratin and collagen of animal origin, obtained from residues left after the skins tanning process. The tested products have been applied in 2 phases (3-4 and 7-8 leaves) and in 2 graduations (2.5 and 5.0 l/ha). In maize crop, in successive experiments in the laboratory and in research fields, two biometric indicators have been chosen, namely chlorophyll content index (CCI) and plants height. Each time the measurements have been made 5 days after the foliar application of the biostimulators. After performing both foliar treatments with biostimulators, it has been found that both chlorophyll content index (CCI) and plants height are significantly influenced by some of the products tested (increases of up to 100% in chlorophyll and 10-15% in plant height), compared to control plot (untreated). By correlating the results of these indicators with those of yields, it will be possible to choose the products with the best efficiency, with optimal characteristics for maize and which will go further in the testing process. Key words: maize, biostimulators, protein additives, chlorophyll, plants height. INTRODUCTION Maize (Zea mays L.) is one of the most important agricultural crops in the world, occupying approximately 196 million hectares worldwide (USDA, 2021). The yield potential of maize is twice as high as that of other cereals, which makes a lot of research to focus on this crop (Ali et al., 2020; Berca et al., 2014; Sible, 2019). One of the most important factors affecting crop yields is the balanced supply of essential nutrients (Fageria, 2001), i.e. those chemical elements that are absolutely necessary for plants to grow and develop. One way to avoid problems related to availability, but also to soil pollution, is by foliar fertilization or by providing nutrients to plants through their leaves (Ali et al., 2008; Kannan, 2010; Rajasekar, 2017). The ability of plant leaves to absorb water and nutrients was recognized about three centuries ago
(Alexander, 1986), and has been in the spotlight of researchers ever since. Variable responses of field crops, including maize, to foliar applied nutrients have been and are recorded, ranging from significant yield increases to no effect (Tollenaar & Lee, 2002) and sometimes even to negative effects - decreases in yield quality and quantity (Sible, 2019). Even with variable and inconsistent results, there is a general convention that foliar application of fertilizers isn’t intended to replace nutrients applied to the soil, but rather supplements soil fertility management (Halpern et al., 2015). The newest category of products that are used to increase yields are biostimulants (Vaskova et al., 2013; Yakhin et al., 2016), with which more and more experiments are being done (Becheritu et al., 2020; Horoias et al., 2020; Pecha et al., 2011). The difference between a biostimulant and a plant growth regulator or fertilizer is vague, but biostimulants usually
Scientific Bulletin. Series F. Biotechnologies, Vol. XXV, No. 1, 2021ISSN 2285-1364, CD-ROM ISSN 2285-5521, ISSN Online 2285-1372, ISSN-L 2285-1364

27
play a role in reducing stress or accumulating nutrients in plants (Halpern et al., 2015; Kolomaznik et al., 2012). It’s assumed that these products regulate the metabolic activity of plants, in order to increase yields, which we intend to demonstrate in practice. Typically, these types of products, especially those based on collagen and keratin, both obtained from residues from slaughtered animals (Berechet et al., 2020; Niculescu et al., 2019), are aimed at relieving stress, especially drought stress. The purpose of this paper is to analyze the reaction of maize plants to the new biostimulators, based on collagen and keratin of animal origin. According to the first year’s results, the research structure for the next agricultural year will be designed. MATERIALS AND METHODS For the testing of the newly created products to be conclusive, it started with the laboratory stage, in which the maize plants have only been used for analyzing the first stages of vegetation, the allocated space being much too small, while pollination and fruiting practically impossible. During the laboratory stage, the field work has been established, for which two different locations have been chosen, so that the research results to be conclusive. For both location, the same plant material has been used, namely Olt, a Romanian hybrid, group FAO 430. In order to ensure crop’s necessary nutrients, a complex fertilizer type NPK 16-16-16 (250 kg/ha), with soil incorporation, was used at the germination bed preparation. A solid fertilizer was added at the sowing time, as starter, ammonium nitrate (150 kg/ha) being used. Subsequently, only the two foliar fertilization with biostimulators were additionally performed. The plants were foliar treated in 2 phases of vegetation, at 3-4 leaves and at 7-8 leaves. Taking into account the particularities of the year, by observing the temperature and precipitation conditions in the first months of the year (January - April 2020), the locations for the two research fields were established (small and large plots), in different soil and climatic conditions:
→ Modelu (Calarasi county); → Calomfiresti (Teleorman county).
In both locations the soils are of chernozem type, richer in clay and humus in Calomfiresti (32% clay and 3.4% humus) and poorer in Modelu (27% clay and 2.9% humus). Both locations are geographically positioned in the sylvosteppe area. All the water that falls on the ground infiltrates and forms the useful reserve of the soil, when the rains fall constantly. By applying biostimulators based on keratin and collagen on maize plants, their tolerance to drought has been followed. That is why three different environments have been chosen:
1) laboratory - potted plants, only used during the vegetation stages;
2) field (Calarasi) - microplots, of 10 sqm (1 x 10 m, 2 rows of maize each);
3) field (Teleorman) - macroplots, of 1000 sqm (20 x 50 m each).
By establishing the two fertilization graduations, the experiences became bifactorial, with the following factors (Figure 1): 1) Tested products - 9 new products + control
version: → control; → K1 - superior keratin hydrolysate, obtained
by alkaline and alkaline-enzymatic hydrolysis with 1% protamex, pH = 7;
→ K2 - superior keratin hydrolysate, obtained by alkaline and alkaline-enzymatic hydrolysis with 1% esperase, pH = 7;
→ K3 - superior keratin hydrolysate, obtained by alkaline and alkaline-enzymatic hydrolysis with 1% valkerase, pH = 7;
→ K4 - superior keratin hydrolysate, obtained by alkaline hydrolysis, adjusted pH = 7, with H2SO4 dilution 1:20;
→ K5 - superior keratin hydrolysate, obtained by alkaline hydrolysis, adjusted pH = 7, with H3PO4 dilution 1:20;
→ KC - superior keratin hydrolysate + collagen hydrolysate + microelements, adjusted pH = 7;
→ C - collagen hydrolysate, adjusted pH = 7, with H2SO4 dilution 1:20;
→ FM1 - collagen hydrolysate (N = 4.2%); → FM2 - collagen hydrolysate (N = 3.93%). 2) Applied doses - two graduations: → 2.5 l/ha; → 5.0 l/ha.

28
Figure 1. Technological scheme of the research field -
similar for both locations
For the microplots, the products have been manually applied, with the shoulders pump, while for the macroplots the mechanized version has been used. The applications have been made in the established vegetation stages (at 3-4 and 7-8 leaves), being combined with other plant protection products (fungicide and insecticide), depending on the necessary estimated in the evaluation of the crop. At 5 days after each of the foliar applications, 10 plants were randomly selected, for which the chlorophyll (CCI) was determined and which were measured (Figure 3). CCI (chlorophyll content index) determinations were performed using the CCM-200 Plus chlorophyll meter, produced by Opti-Sciences. RESULTS AND DISCUSSIONS The 2019-2020 agricultural year was a completely atypical one, with climatic conditions not at all favourable for agricultural crops. The anomalies were recorded both at the level of temperatures (above the multiannual average) and at the level of precipitation - well below the level of the multiannual average and with a deficient monthly distribution. For testing new biostimulators, however, it was the optimal environment to highlight the effects of protein additives that enter into the composition of each product based on collagen and keratin. In February-May 2020, tests were carried out in laboratory, on potted plants, kept in the work rooms and periodically exposed to the sun (Figure 2), in similar conditions to those found
in the natural environment, during the vegetation period of maize.
Figure 2. Maize plants on which biostimulators based on keratin and collage were tested, in laboratory conditions
(April 2020)
Figure 3. CCI determinations in the field, on maize plants on which biostimulators based on keratin and
collagen were tested (May 19, 2020) Data were collected in large tables, then the averages were calculated and the significances were established, compared to the control variant. In Table 1 and Table 2 a data synthesis has been performed, using only the averages of the determinations collected from all the research environments. Subsequently, they were introduced in the Anova statistical program and in Excel, obtaining the graphs in Figure 4 and Figure 5, the first one for the influence of biostimulators on the level of chlorophyll in plants, and the other one for the evolution of plant height, also under the influence of the foliar fertilizations with the new products.
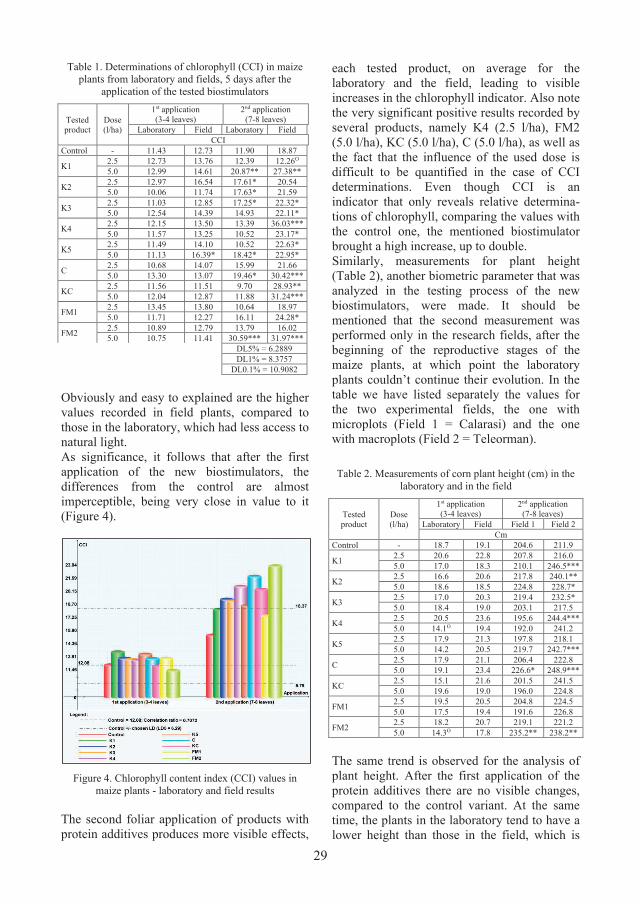
29
Table 1. Determinations of chlorophyll (CCI) in maize
plants from laboratory and fields, 5 days after the application of the tested biostimulators
Tested product
Dose (l/ha)
1st application (3-4 leaves)
2nd application (7-8 leaves)
Laboratory Field Laboratory Field CCI
Control - 11.43 12.73 11.90 18.87
K1 2.5 12.73 13.76 12.39 12.26O 5.0 12.99 14.61 20.87** 27.38**
K2 2.5 12.97 16.54 17.61* 20.54 5.0 10.06 11.74 17.63* 21.59
K3 2.5 11.03 12.85 17.25* 22.32* 5.0 12.54 14.39 14.93 22.11*
K4 2.5 12.15 13.50 13.39 36.03*** 5.0 11.57 13.25 10.52 23.17*
K5 2.5 11.49 14.10 10.52 22.63* 5.0 11.13 16.39* 18.42* 22.95*
C 2.5 10.68 14.07 15.99 21.66 5.0 13.30 13.07 19.46* 30.42***
KC 2.5 11.56 11.51 9.70 28.93** 5.0 12.04 12.87 11.88 31.24***
FM1 2.5 13.45 13.80 10.64 18.97 5.0 11.71 12.27 16.11 24.28*
FM2 2.5 10.89 12.79 13.79 16.02 5.0 10.75 11.41 30.59*** 31.97***
DL5% = 6.2889 DL1% = 8.3757 DL0.1% = 10.9082
Obviously and easy to explained are the higher values recorded in field plants, compared to those in the laboratory, which had less access to natural light. As significance, it follows that after the first application of the new biostimulators, the differences from the control are almost imperceptible, being very close in value to it (Figure 4).
Figure 4. Chlorophyll content index (CCI) values in
maize plants - laboratory and field results The second foliar application of products with protein additives produces more visible effects,
each tested product, on average for the laboratory and the field, leading to visible increases in the chlorophyll indicator. Also note the very significant positive results recorded by several products, namely K4 (2.5 l/ha), FM2 (5.0 l/ha), KC (5.0 l/ha), C (5.0 l/ha), as well as the fact that the influence of the used dose is difficult to be quantified in the case of CCI determinations. Even though CCI is an indicator that only reveals relative determina-tions of chlorophyll, comparing the values with the control one, the mentioned biostimulator brought a high increase, up to double. Similarly, measurements for plant height (Table 2), another biometric parameter that was analyzed in the testing process of the new biostimulators, were made. It should be mentioned that the second measurement was performed only in the research fields, after the beginning of the reproductive stages of the maize plants, at which point the laboratory plants couldn’t continue their evolution. In the table we have listed separately the values for the two experimental fields, the one with microplots (Field 1 = Calarasi) and the one with macroplots (Field 2 = Teleorman). Table 2. Measurements of corn plant height (cm) in the
laboratory and in the field
Tested product
Dose (l/ha)
1st application (3-4 leaves)
2nd application (7-8 leaves)
Laboratory Field Field 1 Field 2 Cm
Control - 18.7 19.1 204.6 211.9
K1 2.5 20.6 22.8 207.8 216.0 5.0 17.0 18.3 210.1 246.5***
K2 2.5 16.6 20.6 217.8 240.1** 5.0 18.6 18.5 224.8 228.7*
K3 2.5 17.0 20.3 219.4 232.5* 5.0 18.4 19.0 203.1 217.5
K4 2.5 20.5 23.6 195.6 244.4*** 5.0 14.1O 19.4 192.0 241.2
K5 2.5 17.9 21.3 197.8 218.1 5.0 14.2 20.5 219.7 242.7***
C 2.5 17.9 21.1 206.4 222.8 5.0 19.1 23.4 226.6* 248.9***
KC 2.5 15.1 21.6 201.5 241.5 5.0 19.6 19.0 196.0 224.8
FM1 2.5 19.5 20.5 204.8 224.5 5.0 17.5 19.4 191.6 226.8
FM2 2.5 18.2 20.7 219.1 221.2 5.0 14.3O 17.8 235.2** 238.2**
The same trend is observed for the analysis of plant height. After the first application of the protein additives there are no visible changes, compared to the control variant. At the same time, the plants in the laboratory tend to have a lower height than those in the field, which is

30
also easy understandable why, being the same effect as in the case of CCI parameter. For the second application, where only measurements from the field were performed, there are very significant differences between plants, up to 50 cm, the explanation consisting in the different pedologic and climatic regime of the two research areas, as presented in the methodology. Very significant positive compared to the control are the heights of maize plants in Teleorman (Figure 5), where the drought was more moderate, especially those fertilized with products C (5.0 l/ha), K1 (5.0 l/ha), K4 (2.5 l/ha), K5 (5.0 l/ha) and FM2 (5.0 l/ha), of which C, K4 and FM2 are common with those from chlorophyll. Also, in plant heights there are differences of about 10-15%, for almost all the fertilized plots, so this is the estimated influence for most of the tested biostimulators.
Figure 5. Height of maize plants fertilized with the new
biostimulators - values from laboratory and fields CONCLUSIONS In 2020, the first practical researches have been carried out (in the laboratory and in the field) for the nine biostimulators under test, applied to the maize crop as foliar fertilizers. The biometric results obtained in this first year, respectively chlorophyll (CCI) and plant height, confirmed that some protein additives have more significant effects (K1, K4, C, FM2), while others (K2, K3, FM1) don’t influence the development of maize plants at all. For confirmation, the parameters from the reproduction phases of the plants, the way in which the new products stimulate the fructification and, especially, the obtained
productions were followed. The field and laboratory tests will be repeated in the next two years, for the relevance of the results. ACKNOWLEDGEMENTS This work was supported by a grant of the Romanian Ministry of Research and Innovation, CCCDI - UEFISCDI, project number PN-III-P3-3.5-EUK-2017-D-0098, within PNCDI III. REFERENCES Alexander, A. (1986). Optimum Timing of Foliar
Nutrient Sprays. In: Alexander A. (eds) Foliar Fertilization. Developments in Plant and Soil Sciences, vol. 22. Springer, Dordrecht. https://doi.org/10.1007/978-94-009-4386-5_4
Ali, Q., Ashraf, M., Shahbaz, M., & Humera, H. (2008). Ameliorating effect of foliar applied proline on nutrient uptake in water stressed maize (Zea mays L.) plants. Pakistan Journal of Botany, 40(1), 211-219. Retrieved February 11, 2021, from http://www.pakbs.org/pjbot/PDFs/40(1)/PJB40(1)211.pdf
Ali, Q., Javed, M.T., Haider, M.Z., Habib, N., Rizwan, M., Perveen, R., Ali, S., Alyemeni, M.N., El-Serehy, H. & Al-Misned, F.A. (2020). -Tocopherol foliar spray and translocation mediates growth, photosynthetic pigments, nutrient uptake and oxidative defense in maize (Zea mays L.) under drought stress. Agronomy, 10, 1235. Retrieved February 12, 2021, from http://dx.doi.org/10.3390/ agronomy10091235
Becheritu, M., Horoias, R., Cioineag, C.F. & Borovina, P. (2020). Effects of rape seeds pelleting with bioactive products based on collagen and keratin extract on germination and plantlets development. Romanian Biotechnological Letters, 25(5), 1953-1960. Retrieved February 18, 2021, from https://doi.org/10.25083/RBL/25.5/1953.1960
Berca, M., Robescu, V.O. & Horoias, R. (2014). Management issues of the corn crop on the eutricamboils from Brebu area (Prahova county). Scientific Papers Series Management, Economic Engineering in Agriculture and Rural Development, 14(3), 31-34. Retrieved February 26, 2021, from http://managementjournal.usamv.ro/pdf/vol_14/art4.pdf
Berechet, M.D., Simion, D., Stanca, M., Alexe, C.A., Chelaru, C. & Rapa, M. (2020). Keratin hydrolysates extracted from sheep wool with potential use as organic fertilizer. Revista de Pielarie, 20(3), 267-276. Retrieved February 17, 2021, from https://doi.org/10.24264/lfj.20.3.5
Fageria, V.D. (2001). Nutrient interactions in crop plants. Journal of Plant Nutrition, 24(8), 1269-1290. Retrieved February 26, 2021, from https://doi.org/10.1081/PLN-100106981

31
Halpern, M., Bar-Tal, A., Ofek, M., Minz, D., Muller, T.
& Yermiyahu, U. (2015). Chapter two – the use of biostimulants for enhancing nutrient uptake. Advances in Agronomy, 130, 141-174. Retrieved March 2, 2021, from https://doi.org/10.1016/ bs.agron.2014.10.001
Horoias, R., Becheritu, M., Cioineag, C.F. & Borovina, P. (2020). Influence of biostimulator treatments applied by rape seeds pelleting, on certain biometric parameters of plants in field conditions. International Journal of Scientific Engineering and Applied Science, 6(9), 129-135. Retrieved February 19, 2021, from http://ijseas.com/volume6/v6i9/ijseas20200914.pdf
Kannan, S. (2010). Foliar fertilization for sustainable crop production. In: Lichtfouse E. (eds.) Genetic Engineering, Biofertilisation, Soil Quality and Organic Farming. Sustainable Agriculture Reviews, 4. Springer, Dordrecht. https://doi.org/10.1007/978-90-481-8741-6_13
Kolomaznik, K., Pecha, J., Friebrova, V., Janacova., D. & Vasek, V. (2012). Diffusion of biostimulators into plant tissues. Heat Mass Transfer, 48, 1505-1512. Retrieved February 19, 2021, from https://doi.org/10.1007/s00231-012-0998-6
Niculescu, M.D., Epure, D.G., Lason-Rydel, M., Gaidau, C., Gidea, M. & Enascuta, C. (2019). Biocomposites based on collagen and keratin with properties for agriculture and industrie applications. The EuroBiotech Journal, 3(3), 160-166. Retrieved February 22, 2021, from https://doi.org/10.2478/ebtj-2019-0019
Pecha, J., Furst, T., Kolomaznik, K., Friebrova, V. & Svoboda, P. (2011). Protein biostimulant foliar uptake modelling: the impact of climatic conditions. AIChE Journal, 58(7), 2010-2019. Retrieved
February 18, 2021, from https://doi.org/10.1002/aic.12739
Rajasekar, R., Nandhini, D.U. & Suganthi, S. (2017). Supplementation of mineral nutrients through foliar spray – a review. International Journal of Current Microbiology and Applied Sciences, 6(3), 2504-2513. Retrieved February 11, 2021, from https://doi.org/10.20546/ijcmas.2017.603.283
Sible, C.N. (2019). Plant growth regulators and biostimulants for use in varying management systems to improve corn grain yield. University of Illinois at Urbana-Champaign, PhD. thesis. Retrieved March 2, 2021, from http://hdl.handle.net/2142/104895
Tollenaar, M. & Lee, E.A. (2002). Yield potential, yield stability and stress tolerance in maize. Field Crops Research, 75(2-3), 161-169. Retrieved February 26, 2021, from https://doi.org/10.1016/S0378-4290(02)00024-2
USDA (2021). World Agricultural Production. Circular Series, WAP 3-21. Retrieved March 3, 2021, from https://apps.fas.usda.gov/psdonline/circulars/production.pdf
Vaskova, H., Kolomaznik, K. & Vasek, V. (2013). Hydrolysis process of collagen protein from tannery waste materials for production of biostimulator and its mathematical model. International Journal of Mathematical Models and Methods in Applied Sciences, 5(7), 568-575. Retrieved February 19, 2021, from https://www.naun.org/main/NAUN/ijmmas/2001-154.pdf
Yakhin, O.I., Lubyanov, A.A., Yakhin, I.A. & Brown, P.H. (2016). Biostimulants in plant science: a global perspective. Frontiers in Plant Science, 7, 2049. Retrieved February 17, 2021, from https://dx.doi.org/10.3389%2Ffpls.2016.02049

32
POROUS CERAMIC GRANULES AS INORGANIC SOIL CONDITIONER Orsolya Csilla RADULY1, 2, József FAZAKAS2, Diana CONSTANTINESCU-ARUXANDEI3,
Csilla BENEDEK4, Mălina AVRAM-DEȘLIU3, Enikö FAZAKAS2, Florin OANCEA3, 1
1University of Agronomic Sciences and Veterinary Medicine of Bucharest, 59 Mărăști Blvd, District 1, Bucharest, Romania
2Chemi Ceramic F, 163 Ciucului Street, 520036, Sfântul Gheorghe, Covasna, Romania 3National Institute for Research & Development in Chemistry and Petrochemistry - ICECHIM,
202 Spl. Independenței, 060021, Bucharest, Romania 4Semmelweis University, Faculty of Health Sciences, Department of Dietetics and Nutrition
Sciences, 17 Vas Street, 1088, Budapest, Hungary
Corresponding author email: [email protected] Abstract Porous ceramic granules (PCGs) present an interconnected pores architecture, which mimics the spatial arrangement of the pore spaces and of the solid particles, mineral and/or organic, in the soil. More than 2/3 of the volumes of the ceramic granules used as soil improvers are pores of different sizes – macro, micro and nanopores. Around one half of these pores are capillary pores, which retain and slowly release water and mineral nutrients. The other half of the pores are non-capillary pores, retaining gases and supporting soil aeration. This PCGs porous structure, related to the efficiency as soil improver, is highly compaction-resistant, making PCGs an effective soil conditioner for cultivated plants that support high traffic, such as turf and ornamental garden plants. This paper reviews the use of porous ceramic granules as inorganic soil improver for horticultural plants. Key words: porous ceramic granules, capillary pores, water and nutrient release, soil aeration, compaction. INTRODUCTION For decades, one of the main goals in both horticulture and agriculture has been to increase soil fertility, affected by agricultural practices. In particular, sandy soils require more attention, due to their poor water and mineral nutrients. This problem of soil fertility constant degradation is solved by the applica-tion of various organic and inorganic soil improvement material (Bigelow et al., 2004; Szegi, 2009). The sand content of the Earth’s land reaches 7%. However, sandy soils in Romania occupy about 500,000 ha, of which 150,000 ha is semi-bound or quicksand (Dumitru et al., 2011; Josan et al., 2000). The use of soil improvers of both organic and inorganic origin creates favorable properties for soil fertility, especially for the physico-chemical properties and microbiological activity of sandy soils (Kocsis, 2018; Makádi, 2010). However, the organic soil conditioners are biodegradable over time and their beneficial effect is not a long lasting-one. The inorganic
soil conditioners effects are for a longer period, due to their longer stability. The inorganic ma-terials that can be used as soil conditioners in-clude by-products of various origins, including those from bioeconomy, e.g., spent diatoma-ceous earth from mini-breweries. The produc-tion and utilization of soil conditioners close the loop in the (bio)economy value chains in a biomimetic manner (Makádi, 2010; Roșu et al., 2016). Such byproducts are regulated for their use as soil improvers and should contain a small quantities of contaminants - e.g., poten-tial toxic metals, entero-toxigenic bacteria. Most studies with soil improvers are related to their influence on soil structure and crop yield. Several studies were conducted also on the extent to which soil conditioners can affect the sorption capacity of colloid-poor soils (Bigelow et al., 2004; Kocsis, 2018). A particular case of soil conditioners is related to restoring lands following major construction works, ornamental horticulture (new gardens)
Scientific Bulletin. Series F. Biotechnologies, Vol. XXV, No. 1, 2021ISSN 2285-1364, CD-ROM ISSN 2285-5521, ISSN Online 2285-1372, ISSN-L 2285-1364

33
and golf course greens. In these situations, occur a total reconstruction of the soil. For example, to accommodate golf course greens, the soil layer is often removed from its location and replaced with sand-based media to prevent compaction and improve drainage. Several soil modifiers have been used for sand-based grassland media, such as calcined clay, diato-mite, porous ceramic, expanded shale, perlite, pumice, sintered fly ash, slags, and vermiculite. Due to the low water and nutrient holding capacity of sand-based soils, several inorganic modifiers are proposed to eliminate defects in sandy soils, i.e., to increase water retention and to maintain high drainage and aeration properties, and to improve Cation Exchange Capacity - CEC (Guertal & Waltz, 2008; Jing, 2013; Li, 2001; Szegi, 2009) The development of porous ceramics began in the 1970s, but more recently, due to their in-dustrial, agricultural, and horticultural applica-tions, they have become increasingly important. The pore size formed in the ceramic material is greatly influenced by the starting raw materials and the production method. The porosity value of porous ceramics is variable, between 20 and 95%. After sintering, the porous ceramic material consists of three phases: a ceramic solid phase, a water phase, and an air (gaseous) phase that fills the pores (Al-Naib, 2018; Liu & Chen, 2014; Roșu et al., 2016). Inorganic porous ceramics promote water retention in sandy soils, have beneficial effect on soil structure, stimulate the uptake and utilization of mineral nutrients. Such soil conditioners could be included in soil or could
be applied at the surface of the soils (Guertal & Waltz, 2008; Kocsis, 2018; Stefanovits et al., 1999). This study aims to review the main features of the porous ceramic granules related to their use as (sandy) soil conditioners and the improve-ment of the soil physico-chemical and biolo-gical characteristics resulted after their application. MATERIALS AND METHODS The materials used are represented by scientific publications from around the world. This paper reviews the use of porous ceramic granules as inorganic soil improver for horticultural plants.
RESULTS AND DISCUSSIONS POROSITY FEATURES OF THE CERAMIC SOIL IMPROVERS An essential feature for the ability of a ceramic granule to act as a soil conditioner is porosity (Figure 1). Porous ceramic granules mimic the structure of the soils, presenting three distinct phases: a solid phase, comprising the ceramic support, a water/liquid phase, consisting of water retained by the hydrophilic surface of ceramic pores and a gaseous phase, filling the empty part of the ceramic pores (Roșu et al., 2016). Essential for soil water retention and CEC improvement are both porosity and pore surface hydrophilicity.
Figure 1. The essential features related to ability of a ceramic granule to act as soil conditioner - porosity and
hydrophilicity of the pores surface
Porous ceramic granules
Water retention intosoilMore than
50% pores
Air pores
Ideal soil
Water pores Soil solids
AIR WATER
SOLID
AIR WATER
SOLID
Cation exchangecapacity improvement
Pore capilarity

34
Ceramics are rigid materials due to the covalent bonds that hold them together. Their pore systems greatly depend on the size of the particles and type of shaping. However, to increase the porosity of ceramics, wood flour, sawdust or polystyrene beads are mixed even during production, which, after heat treatment, create pores - sacrificeal scaffolds (Horváth, 2019). According to their structure, differences
are distinguished between open-pore ceramics in which most cells are in contact with each other (Figure 2), and closed-pore ceramics, where the pores are independent from each other, without communicating channels. However, there are also mixed structures, when both open and closed structures occur within a granule (Fazakas, 2006; Horváth, 2019).
Figure 2. Open-pore ceramic SAB25 in which pores are communicating with each other and ensure fluids
transport. SEM images of the cross-section (a) 1000x and (b) 5000x of SAB25-PCG (original images)
Pore type and manufacturing methods Porous ceramics are classified as high porosity ceramics, of 20 to 95% pores. If the porosity of any ceramic body is determined, a distinction is made between open porosity (externally accessible) and closed porosity. The sum of open and closed porosity is understood to mean total porosity. The (nano) porous size of porous ceramics can be divided into 3 types depending on the pore diameter: microporous (less than 2 nm), mesoporous (between 2-50 nm) and macroporous (> 50 nm) (Al-Naib, 2018; Dittmann et al., 2013). The ideal nanoporous structure of the porous ceramic used as soils conditioners should be similar to that of allophane, a nanoporous clay specific to Andosols - volcanic soil from Andes. Allophane has a large pore volume, and a fractal 3 porous fractal arrangement, resembling to a labyrinth (Woignier et al., 2015). Such 3D nanostructures are also present in the siliceous natural nanomaterials (SNNMs) used as soil improvers, i.e., natural zeolites and diatomaceous earth (Constantinescu-Aruxandei et al., 2020).
The division of the pore space can be distinguished by the size of the pores and the pores characterized by different pore diameter limits, according to the forces acting on the fluid flowing in the pore space. Within the pore space, from a practical viewpoint, two types of pores can be distinguished: (i) the group of capillary/micro/matrix pores; (ii) the group of non-capillary/macro/structural pores (Hernádi et al., 2017). In terms of water movement, macropores are rapidly-drainable-pores (RDPs). The micro-pores are composed of capillary pores with two different pore diameter ranges, which correspond to slow-draining and water-retaining pores, respectively slowly drainable pores - SDP; water holding pores - WHP) (Hernádi et al., 2017). For the preparation of porous material, beside the sacrificial scaffold techniques, already mentioned, other methods such as layer by layer deposition, pressing, pelletizing and the capillary suspensions are used (Table 1). (Chen et al., 2019; Dabare & Svinka, 2014; Dittmann et al., 2013; Liang et al., 2007; Saponjic et al., 2015; Surabhi, 2012; Yoo et al., 2008).
ba

35
Table 1. Pore characteristic according to manufacturing method
Manufacturing method Water absorbtion
Apparent density Porosity CEC Capillarity Reference
Sacrificeal scaffold ++ + ++ + + (Surabhi, 2012) Layer by layer deposition + + + + + (Liang et al., 2007) Pressing + + + + + (Saponjic et al., 2015)
Pelletizing +++ +++ +++ +++ ++ (Dabare & Svinka, 2014; Yoo et al., 2008)
Capillary suspensions ++ ++ +++ + ++++ (Dittmann et al., 2013) +: quite good; ++: good; and +++: very good/excellent During production of a porous ceramic body, the formation of porosity is significantly influenced not only by the manufacturing techniques, but also by the raw materials and binders used and their distribution and, last but not least, by the sintering process, which also affects the final porosity, pore connectivity (Al-Naib, 2018; Surabhi, 2012). Dittmann et al. (2013) introduced a method by which macroporous ceramics can be produced by capillary suspensions. By their method, 60% higher porosity can be achieved. To adjust porosity and pore size, the Al2O3 model system was used (Dittmann et al., 2013; Weiss et al., 2019). In another production method, after grinding and wetting the clay, the granules are burned in a tube furnace rotating at 1150°C. The moisture content of clay becomes vapor under the action of heat, inflating the granules and making them porous. Due to this porosity generated by water vapors, the application of burned clay to the soil gives to the plants’ rapidly developing roots extra aeration. The clay granules produced by this method can be used alone (e.g. in hydroponic plant cultivation) or mixed with other materials as a growing substrate (Guertal & Waltz, 2008; Profile, 2021). Pore analysis and characterization The number of pores and their distribution are analysed and characterized by several methods, including X-ray diffraction, scanning electron microscopy, penetration porosimetry (Szegi, 2009). X-ray diffraction characterizes the phase composition of the raw materials and the sintered products. The microstructural morphology (external and sequential structure of the granules) is observed by scanning electron microscopy (SEM). The porosity could
also be estimated from the bulk density of porous ceramic materials, using the Archimedes technique (Al-Qadhi et al., 2019; Anovitz & Cole, 2015; Dabare & Svinka, 2014; Dutra et al., 2019; Jing, 2013). Pore size distributions are usually determined by mercury penetration porosimetry but can also be measured by optical and electronic examination of polished cross-sections and X-ray computed tomography (Al-Naib, 2018; Al-Qadhi et al., 2019) Water-based porosimetry is useful for determination of the macropores volumes (Andersson et al., 2013). Capillary action and water movement Soil, water and gas exchange is affected by several factors such as: pore volume, pore size, distribution in the soil. The vertical and lateral drainage of water in the soil is large through gravitational forces, so it occurs through non-capillary soil pores. In contrast, the upward movement and redistribution of water takes place through the capillary-pores (Amer et al., 2009; Stefanovits et al., 1999). Under the influence of adhesive and capillary forces, the interaction between the solid phase and water is realized. This explains why some of the soil moisture adheres to the surface of the particles, while the other part is located in the pore space itself. In order for this adhesion to occur between water molecules and soil particles, the dipole nature of the water molecules and electrical charging of the finer soil particles is required (Hartman, 2008; Stefanovits et al., 1999). Water entering the capillaries cannot be retained by larger pores as it is rapidly discharged by gravity. The water-retaining and water-lifting ability in capillaries can be attributed not only to adhesion forces between water and soil particles, but also and cohesion

36
forces between water molecules. Capillary moisture also dissolves large quantities of plant nutrients and other compounds, which are transported by soil water to higher suction areas (Hargitai, 1985; Stefanovits et al., 1999). Depending on the water moving in the soil, the filling of the capillaries can occur from the water leaking downwards (dependent capillary moisture) or from the groundwater (supporting capillary moisture). In the case where the capillaries are charged from top to bottom, it is a slower process, and the capillaries fill up from the infiltrating rainwater or irrigation water so that these capillaries are not in contact with groundwater. In capillaries feeding below, i.e. from groundwater, the capillary moisture decreasing from groundwater is constantly replenished by evaporation (Hartman, 2008; Stefanovits et al., 1999). CATION EXCHANGE CHARACTERISTICS Ion exchange processes play an important role in soil, the importance of which has been discovered in soil-related research. Ion exchangers are solids that contain ionic groups that are positively or negatively charged, yet can exchange their free-moving ions with other but equally charged counterions (Simándi, 2011). The ion exchange capacity is mostly related to layered lattice aluminosilicates as well as clay minerals. Clay minerals with a trivalent cation in the octahedron and tetravalent silicon in the tetrahedron have a significant cation exchange capacity, as well as smectite (montmorillonite) type silicates (Nagy, 2017). For efficient nutrient replenishment, it is essential to know the cation exchange capacity. The CEC test provides an answer to how much cation the tested soil can retain. The higher the CEC, the more cations can be bound. The clay and organic matter particles that make up the soil have a negative charge. In doing so, they attract positively charged particles, but repel negatively charged ones. The essence of the cation exchange capacity is that cations adhering to negatively charged material and organic matter particles can be replaced by other cations, i.e., exchangeable. For example, potassium can be replaced by calcium or hydrogen or vice versa (Mengel, 2014; Stefanovits et al., 1999). In the soil solution, in
most cases, only 6 cations are present in larger amounts, so these compensate for the negative charges of the colloid. Thus, these cations, which equalize the negative charges of the colloid, are divided into two groups: ✓ Exchangeable acidifying cations: H3O+ and Al3+. ✓ Exchangeable strong base cations: Ca2+, Mg2+, Na+, K+ (Szalai & Jakab, 2012). MAIN APPLICATION OF POROUS CERAMIC SOIL IMPROVERS
Nowadays, agricultural and horticultural soils are constrained by several inherent defects, most of them of anthropogenic origin. Various soil improvers serve to eliminate the defects of these soils and to make the soils more fertile (Füleky et al., 2011). The use of porous ceramic granules (PCGs) to improve soil quality and crop yield is an emerging technology. PCGs are primarily used to improve degraded soils and constructed lands, as their porous structure is generating a high specific surface area. Due the large pores volumes and CEC area, PCGs improve soil water retention, plant nutrient uptake and soil aeration, as well as preventing nutrient leaching from the soil (Table 2) (Guertal & Waltz, 2008; Kocsis, 2018; Profile, 2021)
Table 2. Advantages and disadvantages of porous ceramic-based soil conditioners
Advantages Disadvantages Improves physical soil structure (Guertal & Waltz, 2008) Improves sand-based root zones ( Li, 2001) Resist to compaction (Profile, 2021) Water retention (Bigelow et al., 2004) Facilitate healthy root systems (Profile, 2021)
Considerable production cost (Liu & Chen, 2014)
A wide range of these PCG soil improvers is now commercially available to modify and improve the physical and chemical properties of sand-based greens, tees, yards, beds, containers, and sports fields. The effectiveness of soil improvers depends to a large extent on the existing properties of the soil to be modified and the amount added (Profile, 2021; Szegi, 2009).

37
Improvement of the sandy soil characteristics The disadvantage of sandy soils is that a large porous system can form between large elementary particles, thus they cannot drain or store water and therefore dry out quickly. This disadvantage is also related to the low content of colloidal components that would allow water and nutrients to be trapped, avoiding leaching into the deeper layers and contamination of the groundwater. Some sandy soils are also prone to compaction (Füleky et al., 2011; Miguel & Vilar, 2009; Szegi, 2009), To improve the unfavorable physico-chemical properties of sandy soils, several agrotechnical methods or various technologies suitable for soil improvement were used (Füleky et al., 2011; Szegi, 2009) Briefly, the properties of sandy soils can be improved by: ✓ physical soil improvement methods: fertilization, inorganic soil conditioners - clay granules, porous ceramic granules (Andreola et al., 2021); ✓ chemical soil improvement methods: with artificial additives, such as superabsorbent anionic polymers (Eneji et al., 2013; Lejcuś et al., 2018; Panova et al., 2021); ✓ biological soil improvement methods: stable fertilization or the use of a material that is rich in colloids, as this layer has to be spread at a depth of 60 cm, as a result of which the nutrient and water management of the soil is also improved (Füleky et al., 2011). Studies suggest that the inorganic soil conditio-ners are the most effective in improving sandy soil properties. For example, it was shown that calcined porous ceramics mixed with sand per-form better than peat and chemical soil condi-tioner in improving water and nutrient retention and increasing oxygen levels in the root zone, while maintaining sandy soil drainage. These ceramic porous particles also retain water and release it to the plant as needed, delaying the need for irrigation (Profile, 2021). By examined the effect of different compositions and amounts of inorganic soil conditioners, was reported that bermudagrass grown in sandy soil, modified with zeolite, calcined clay, diatomaceous earth or clay binder, diatomaceous earth, have up to 16% more available water, comparing the untreated control.
Improvement of the growing substrate characteristics Growing substrate are used to cultivate plant in protected environment (e.g., greenhouses or nursery) or in constructed land - e.g., sand based turf media. Many types of calcined and expanded clays, diatomaceous earth, zeolites or other kiln-fired porous ceramic materials were used to improve the characteristics of the growing substrate used in greenhouses and nursery (Andreola et al., 2021; Gül et al., 2005; Ronga et al., 2020). The porous ceramic granules are particularly suitable for urban agriculture and vertical farming, due to their lightweight characteristics (Andreola et al., 2021). Simultaneously, in the industry of constructed greens(lands), the use of inorganic modifiers to replace peat has also become common (Li et al., 2000). Numerous studies have been conducted on the efficacy of inorganic modifiers, with mixed results (Hargitai, 1985; Kappel, 2006; Sarkar & Kim, 2015). Inorganic soil modifiers are proposed when using grasslands to alleviate soil compaction, increase water retention and hydraulic conductivity, and improve many other physical properties of the soil (Bigelow et al., 2001). Li et al. (2000) gave inorganic modifiers in sand-based golf ground - porous ceramic clay (PCC), calcined diatomaceous earth (CDE) and polymer coated clay - with the aim of determining their physical properties in sand-based media and determining the effects of these modifiers. According to their research, it was found that those treated with PCC had 7-8% higher cation exchange capacity (CEC) and also improved compaction compared to controls. Water retention also improved with the use of CDE. However, their research in the laboratory simulated changes during the winter, i.e., how the freeze-thaw cycle affects volume density, and concluded that PCC increased by 2.2%, CDE by 2.5%, and control. It reduced the bulk density by 7.2% (Li et al., 2000). Porous ceramic granules (PPC) help to permanently improve root zones, increase oxygen levels, and retain water and nutrients. PPC soil improvers replace peat and other inferior products in native soil and sand

38
mixtures. The secret of PPC granules is that a ceramic particle decomposes only 3% in 20 years, providing decades of ideal conditions in the root zones of golf greens, fairways, landscaping beds. They make it easier to work the soil, help the plant grow faster, reduce the frequency of watering, make the use of fertilizer more efficient, thus producing healthier lawns and ornamentals (Profile, 2021). The inorganic porous ceramic particle has a pore space of 74%, of which 39% contains capillary (water) and 35% non-capillary (air) pores. Thanks to the high pore space of the material, it helps to resist compaction and treats moisture/drainage. Ceramic particles are incorporated into the root zones of the soil or used as cover layers (Profile, 2021). In addition, inorganic soil conditioners have been developed that wrap nutrients in clay-based porous ceramic montmorillonite particles, protecting the plant from nutrient loss. These organically managed soil products improve the soil biology of the plant, helping to preserve the flow of water and oxygen in the roots of the plants in the easily compacted soil. It can be applied to sports grass as well as agricultural fields (Spittle, 2014). EFFECTS ON PLANT ROOTS AND SOIL MICROBIOTA
Inorganic soil improvers, applied in granular form (porous ceramic, clay granules, perlite, lava powder), in addition to their long-lasting effect on soil characteristics, have also beneficial effect on the roots of plants. Inorganic soil improvers increase the oxygen level in the root zone, improve water and nutrient management, prevent the soil and roots from drying-out quickly and control overflowing. Due to their porous structure, porous ceramic granules provide a uniform nutrient concentration, creating a good habitat for plant roots (Bigelow et al., 2004; Guertal & Waltz, 2008; Nagy, 2017). The application of organic and inorganic soil improvers/conditioners to the soil/plant growing medium not only increases the
availability of plant nutrients. The soil improvers influence also both long- and short-term land use changes in the composition and activity of the soil microbial community (Ikoyi et al., 2020; Kocsis, 2018; Liu et al., 2017). Beneficial soil microorganisms are essential for plant development. In nutrient poor soils, introduction of small quantities of mineral nutrients leads to a rapid proliferation of soil microbes, which could turn to competitors for the plants nutrient usage. Large quantitate of mineral fertilizer promote soil acidification and favours the growth of fungi, including plant pathogenic fungi (Makádi, 2010). Due to their capacity to bind nutrients inorganic soil improvers buffer mineral nutrients variations and reduce the negative influence of fertilizers variations on soil microbiota (Fomina & Skorochod, 2020). Recently, it was demonstrated that large macropores present in soil promote development of soil microorganisms (Harvey et al., 2020; Sun et al., 2020). This is mainly due formation of microhabitat which are driving trophic interactions, allowing beneficial bacteria and fungi to escape from meso- and macrofauna predators (Erktan et al., 2020). Porous ceramics offer shelter to the beneficial microorganisms, which proliferate inside the macropores and develop biofilms on the surface of the granules (Nikolajeva et al., 2012). The use of the porous ceramic granules as carrier for plant biostimulant Trichoderma was patented (Raut et al., 2017). Weathering of porous clay granules and formation of the soluble silicon species was demonstrated (Vu et al., 2011). In the case of porous ceramic/calcined clay soil improvers this effect resulted from their interaction with soil microbiota could explain several effects (as crop quality improvement or increase tolerance to stress) which are rather specific for plant biostimulants (Constantinescu-Aruxandei et al., 2020). By definition, plant biostimulants enhance/benefit nutrient uptake, increase plant tolerance to abiotic stress and improve quality of the crop yield (Du Jardin, 2015). Soil improvers also enhance benefits nutrient uptake, due to their influence on soil CEC.
39
Improvement of the yield quality and/or increase tolerance to abiotic stress, demonstra-ted for several silicates-based soil improvers are most probably related to their interaction with soil microorganisms and slow released of the soluble silicon species (Constantinescu-Aruxandei et al., 2020). CONCLUSIONS One of the challenges today is to provide fertile, stable soil for our plants and soil microbiome. To solve this challenge, numerous inorganic soil improvers (pumice, grounded lava stone, expanded clay, porous ceramics, zeolites, diatomaceuous earth) are used. These inorganic soil improvers influence the chemical and biological properties of the soils, especially of sandy soils, and of growing substrate (Guertal & Waltz, 2008; Kappel, 2006; Li et al., 2000). In the case of the porous ceramic granules, the cost reduction for their production involve use of the less expensive raw materials, including bioeconomy byproducts. Porous ceramic granules are suitable for the reclamation of the (sandy) soils because their structure is similar to the ideal soil (Guertal & Waltz, 2008; Kappel, 2006; Li, 2001; Roșu et al., 2016). Improving the water holding and water holding capacity of sandy soils is a major challenge (Bigelow et al., 2001). The results of several years of research and applications have shown that the use of porous ceramic granules as soil improvers can increase soil stability, improve the physicochemical and biological properties of the soil, and improve the water management and aeration of the soil, mainly due to the capillary and non-capillary pores. Their usage in lawn and golf courses prevent compaction, resistance to stepping and detachment (Roșu et al., 2016). Porous ceramic granules offer shel-tering micro-habitats for soil microorganisms, stimulate root formation, promote plant growth and development (Li, 2001; Li et al., 2000; Liu & Chen, 2014; Profile, 2021). ACKNOWLEDGEMENTS This research work was carried out with the support of European Union structural funds, Project POC KTP P_40_352, contract 81/2016
“Sequential processes of closing the side streams from bioeconomy and innovative (bio)products resulting from it - SECVENT”, subsidiary contract no. 1818/2020 AgriCEM. REFERENCES Al-Naib, U. M. B. (2018). Introductory chapter: A brief
introduction to porous ceramic. In U. M. B. Al-Naib (Ed.), Recent advances in porous ceramics. London: IntechOpen.
Al-Qadhi, E., Li, G. Y., & Ni, Y. X. (2019). Influence of a Two-Stage Sintering Process on Characteristics of Porous Ceramics Produced with Sewage Sludge and Coal Ash as Low-Cost Raw Materials. Advances in Materials Science and Engineering, 2019(6), 1-12. doi:10.1155/2019/3710692
Amer, A. M. M., Logsdon, S. D., & Davis, D. (2009). Prediction of Hydraulic Conductivity as Related to Pore Size Distribution in Unsaturated Soils. Soil Science, 174(9), 508-515. doi:10.1097/ SS.0b013e3181b76c29
Andersson, L., Larsson, P. T., Wågberg, L., & Bergström, L. (2013). Evaluating Pore Space in Macroporous Ceramics with Water-Based Porosimetry. Journal of the American Ceramic Society, 96(6), 1916-1922. doi:https://doi.org/10.1111/jace.12223
Andreola, F., Lancellotti, I., Sergi, R., Cannillo, V., & Barbieri, L. (2021). Comparison of Three Manufacturing Techniques for Sustainable Porous Clay Ceramics. Materials, 14(1), 167.
Anovitz, L. M., & Cole, D. R. (2015). Characterization and Analysis of Porosity and Pore Structures. Mineralogy & Geochemistry, 80, 61-164. doi:10.2138/rmg.2015.80.04
Bigelow, C. A., Bowman, D. C., & Cassel, D. K. (2001). Nitrogen leaching in sand-based rootzones amended with inorganic soil amendments and sphagnum peat. Journal of the American Society for Horticultural Science, 126(1), 151-156. doi:10.21273/ jashs.126.1.151
Bigelow, C. A., Bowman, D. C., & Cassel, D. K. (2004). Physical properties of three sand size classes amended with inorganic materials or sphagnum peat moss for putting green rootzones. Crop Science, 44(3), 900-907. doi:10.2135/cropsci2004.0900
Chen, S. S., Shi, Y. F., Luo, Y., & Ma, J. (2019). Layer-by-layer coated porous 3D printed hydroxyapatite composite scaffolds It for controlled drug delivery. Colloids and Surfaces B-Biointerfaces, 179, 121-127. doi:10.1016/j.colsurfb.2019.03.063
Constantinescu-Aruxandei, D., Lupu, C., & Oancea, F. (2020). Siliceous Natural Nanomaterials as Biorationals-Plant Protectants and Plant Health Strengtheners. Agronomy-Basel, 10(11), 1791. doi:10.3390/agronomy10111791
Dabare, L., & Svinka, R. (2014). Characterization of porous ceramic pellets from Latvian clays. Chemija, 25(2), 82-88. Retrieved from <Go to ISI>://WOS:000344416300004

40
Dittmann, J., Koos, E., & Willenbacher, N. (2013). Ceramic Capillary Suspensions: Novel Processing Route for Macroporous Ceramic Materials. Journal of the American Ceramic Society, 96(2), 391-397. doi:10.1111/jace.12126
Du Jardin, P. (2015). Plant biostimulants: definition, concept, main categories and regulation. Scientia Horticulturae, 196, 3-14.
Dumitru, M., Dumitru, S., Tănase V., Mocanu, V., Manea, A., Vrinceanu, N., Preda, M., Eftene, M., Ciobanu, C., Calciu, I., & Rîșnoveanu, I. (2011). Monitoringul stării de calitate a solurilor din România. Craiova: Sitech.
Dutra, L. F., Freitas, M. E., Grillet, A. C., Mendes, N., & Woloszyn, M. (2019). Microstructural Characteri-zation of Porous Clay-Based Ceramic Composites. Materials, 12(6), 946. doi:10.3390/ma12060946
Eneji, A. E., Islam, R., An, P., & Amalu, U. (2013). Nitrate retention and physiological adjustment of maize to soil amendment with superabsorbent polymers. Journal of Cleaner Production, 52, 474-480.
Erktan, A., Or, D., & Scheu, S. (2020). The physical structure of soil: Determinant and consequence of trophic interactions. Soil Biology and Biochemistry, 148, 107876. doi:https://doi.org/10.1016/j.soilbio.2020.107876
Fazakas, E. (2006). Ceramici poroase filtrante - Teza de doctorat. Universitatea Politehnică, București.
Fomina, M., & Skorochod, I. (2020). Microbial Interaction with Clay Minerals and Its Environmental and Biotechnological Implications. Minerals, 10(10). doi:10.3390/min10100861
Füleky, G., Bidló, A., Bíró, B., Tombácz, E., Horváth, E., Michéli, E., Pápay, L., & Farsang, A. (2011). Talajvédelem, talajtan. Veszprém: Pannon Egyetem, Környezetmérnöki Intézet.
Guertal, E., & Waltz, C. (2008). Adding inorganic amendments to a poorly performing green. Environmental Institute for Golf, San-Francisco, pp.133-137.
Gül, A., Eroğul, D., & Ongun, A. R. (2005). Comparison of the use of zeolite and perlite as substrate for crisp-head lettuce. Scientia Horticulturae, 106(4), 464-471.
Hargitai, L. (1985). Talajtan és agrokémia I. (K. Egyetem Ed. Vol. I.). Budapest.
Hartman, M. (2008). Fizika, kémia és biológia a talajban. Retrieved from Budapest.
Harvey, H. J., Wildman, R. D., Mooney, S. J., & Avery, S. V. (2020). Soil aggregates by design: Manufac-tured aggregates with defined microbial composition for interrogating microbial activities in soil micro-habitats. Soil Biology and Biochemistry, 148, 107870. doi:https://doi.org/10.1016/j.soilbio.2020.107870
Hernádi, H., Barna, G., & Makó, A. (2017). Folyadék-visszatartás, folyadékvezetés és porozitás összefüggései vízzel és folyadékkal telített talajokban. II. Folyadékvezető-képesség - Szemle. Agrokémia és Talajtan, 66, 419-451. doi:https://doi.org/10.1556/0088.2017.66.2.9
Horváth, S. (2019). Pórusos anyagok az építőiparban. Budapesti Műszaki és Gazdaságtudományi Egyetem, Vegyészmérnöki és Biomérnöki Kar. Budapest.
Ikoyi, I., Egeter, B., Chaves, C., Ahmed, M., Fowler, A., & Schmalenberger, A. (2020). Responses of soil microbiota and nematodes to application of organic and inorganic fertilizers in grassland columns. Biology and Fertility of Soils, 56(5), 647-662. doi:10.1007/s00374-020-01440-5
Jing, Z. Q. (2013). Characterization of Nanoporous Ceramic Granules Made with Coal Fly Ash and Their Utilization in Phenol Removal from Water. Journal of Nanomaterials, 2013. doi:10.1155/2013/606940
Josan, N., Sabău, N. C., & Burescu, P. (2000). Érvelések a Nyírségben (Románia) létesítendő véfterület érdekében (Érmihályfalva-Nagykároly). Crisicum, 3, 267-276.
Kappel, N. (2006). Zöldségpalánták nevelésére alkalmas földkeverékek legfontosabb fizikai tulajdonságai. Doktori értekezés. Budapesti Corvinus Egyetem, Budapest.
Kocsis, T. (2018). Bioszén és bioeffektor kombinációk hatása homoktalajok biológiai tulajdonságaira-Doktori értekezés. Szent István Egyetem, Budapest.
Lejcuś, K., Śpitalniak, M., & Dąbrowska, J. (2018). Swelling behaviour of superabsorbent polymers for soil amendment under different loads. Polymers, 10(3), 271.
Li, D. (2001). Physical properties of golf and sports turf root-zones as affected by amendments, construction methods and management practices. Iowa State University, Ames, Iowa.
Li, D. Y., Joo, Y. K., Christians, N. E., & Minner, D. D. (2000). Inorganic soil amendment effects on sand-based sports turf media. Crop Science, 40(4), 1121-1125. doi:10.2135/cropsci2000.4041121x
Liang, X. H., Hakim, L. F., Zhan, G. D., McCormick, J. A., George, S. M., Weimer, A. W., . . . Dorgan, J. R. (2007). Novel processing to produce polymer/ceramic nanocomposites by atomic layer deposition. Journal of the American Ceramic Society, 90(1), 57-63. doi:10.1111/j.1551-2916.2006.01359.x
Liu, P. S., & Chen, G. F. (2014). Introduction to Porous Materials. In Porous Materials (pp. 1-20).
Liu, Z. J., Rong, Q. L., Zhou, W., & Liang, G. Q. (2017). Effects of inorganic and organic amendment on soil chemical properties, enzyme activities, microbial community and soil quality in yellow clayey soil. Plos One, 12(3), e0172767. doi:10.1371/journal.pone.0172767
Makádi, M. (2010). Ásványi és szerves adalékanyagok hatása a nyírségi homoktalajok mikrobiológiai tulajdonságaira - Doktori Értekezés. Szent István Egyetem, Gödöllő.
Mengel, D. B. (2014). Fundamentals of Soil Cation Exchange Capacity (CEC)Agronomy Guide. Retrieved from https://www.extension.purdue.edu/extmedia/ay/ay-238.html
Miguel, M. G., & Vilar, O. M. (2009). Study of the water retention properties of a tropical soil. Canadian Geotechnical Journal, 46(9), 1084-1092. doi:10.1139/t09-039
Nagy, M. N. (2017). Ioncsere-folyamatok az agyagásványok “nanolaboratóriumában”. Magyar

41
Kémiai Folyóirat, 123, 25-32. doi:10.24100/MKF.2017.01.25
Nikolajeva, V., Griba, T., & Petriņa, Z. (2012). Factors influencing adhesion of Pseudomonas putida on porous clay ceramic granules. Environmental and Experimental Biology, 10, 77-80.
Panova, I. G., Ilyasov, L. O., Khaidapova, D. D., Bashina, A. S., Smagin, A. V., Ogawa, K., . . . Yaroslavov, A. A. (2021). Soil conditioners based on anionic polymer and anionic micro-sized hydrogel: A comparative study. Colloids and Surfaces A: Physicochemical and Engineering Aspects, 610, 125635. doi:https://doi.org/10.1016/j.colsurfa.2020.125635
Profile (2021). Soil amendments. Raut, I., Oancea, F., Arsene, M., Sesan, T.E., Doni, M.,
Jecu, L., Calin, M. (2017). Procedeu de condiționare a microorganismelor biostimulante pentru plante pe suporturi ceramice poroase., Brevet RO 131926 B, Oficiul de Stat pentru Invenții și Mărci.
Ronga, D., Parisi, M., Barbieri, L., Lancellotti, I., Andreola, F., & Bignami, C. (2020). Valorization of Spent Coffee Grounds, Biochar and other residues to Produce Lightweight Clay Ceramic Aggregates Suitable for Nursery Grapevine Production. Horticulturae, 6(4), 58.
Roșu, C. D., Oancea, F., Fazakas, J., Roba, C. A., & Piștea, I. C. (2016). The development and the optimization of the porous ceramics manufacturing technology used in horticulture - Ceram-Frticle title. Analele Universității din Oradea, Fascicula Protecția Mediului, XXVII, 142-145.
Saponjic, A., Stankovic, M., Majstorovic, J., Matovic, B., Ilic, S., Egelja, A., & Kokunesoski, M. (2015). Porous ceramic monoliths based on diatomite. Ceramics International, 41(8), 9745-9752. doi:10.1016/j.ceramint.2015.04.046
Sarkar, N., & Kim, I. J. (2015). Porous Ceramics. In Advanced Ceramic Processing.
Simándi, P. (2011). Szennyvíztisztítási technológiák I. (S. I. Egyetem Ed.).
Spittle, K. S. (2014). US Patent No. 8,728,460 B2: USTPO.
Stefanovits, P., Filep, G., & Füleky, G. (1999). Talajtan: Mezőgazda Kiadó.
Sun, B., Chen, X., Zhang, X., Liang, A., Whalen, J. K., & McLaughlin, N. B. (2020). Greater fungal and bacterial biomass in soil large macropores under no-tillage than mouldboard ploughing. European Journal of Soil Biology, 97, 103155. doi:https://doi.org/10.1016/j.ejsobi.2020.103155
Surabhi, S. (2012). Production of alumina based porous ceramics using naphthalene as the pore former. Rourkela.
Szalai, Z., & Jakab, G. (2012). Bevezetés a talajtanba környezet-tanosoknak: Typotex Kiadó.
Szegi, T. A. (2009). The effect of mineral and organic additives on the physical and chemical properties of the sandy areas. (Ph.D). Szent István Egyetem, Gödöllő.
Vu, D.-H., Wang, K.-S., & Bac, B. H. (2011). Humidity control porous ceramics prepared from waste and porous materials. Materials Letters, 65(6), 940-943.
Weiss, M., Maurath, J., Willenbacher, N., & Koos, E. (2019). Shrinkage and dimensional accuracy of porous ceramics derived from capillary suspensions. Journal of the European Ceramic Society, 39(5), 1887-1892. doi:10.1016/j.jeurceramsoc.2019.01.011
Woignier, T., Duffours, L., Colombel, P., & Dieudonne, P. (2015). Nanoporous clay with carbon sink and pesticide trapping properties. European Physical Journal-Special Topics, 224(9), 1945-1962. doi:10.1140/epjst/e2015-02512-x
Yoo, Y. S., Cheon, K. H., Lee, J. I., & Kim, B. S. (2008). Development of Porous Materials Using Sewage Sludge By Molten-Salt Method. Materials Science Forum(569), 325-328.

42
IMPACT OF SOME ELEMENTS IN THE CULTIVATION TECHNOLOGY
ON BIOCHEMICAL AND QUALITATIVE CHARACTERISTICS OF RASPBERRY FRUIT
Stanislava ATANASOVA1, Maria GEORGIEVA2, Diyan GEORGIEV2, Petya IVANOVA3
1Trakia University, Studentski grad, Stara Zagora, Bulgaria 2Research Institute of Mountain Stockbreeding and Agriculture,
281 Vasil Levski Street, Troyan, Bulgaria 3Institute of Food Preservation and Quality, 154 Vasil Aprilov Street, Plovdiv, Bulgaria
Corresponding author email: [email protected]
Abstract The biochemical composition of raspberry fruit was studied at two different planting distances. Their qualitative characteristics were determined. The impact of an individual technological element on the studied indicators was analysed. The experiment included raspberry cultivars, such as 'Willamette', 'Meeker', 'Samodiva' and a candidate cultivar 'Magdalena' from the collection plantation of RIMSA-Troyan. The planting material was produced in vitro. The planting distances were: 0.30 m and 0.50 m in the intra row spacing and 3.00 m in the row spacing. The highest amount of anthocyanins (38.87 mg) and total polyphenols (263.37 mg%) were reported for 'Willamette' fruit at 0.50 m planting distances. The highest antioxidant activity was reported in 'Willamette' fruit (7750.00 µmol TE/100 g) (at 0.30 m) and 'Samodiva' (6625.00 µmol TE/100 g) (at 0.50 m). The sensor rating is in the range from 4.63 ('Willamette' - 0.50 m) to 4.93 ('Magdalena' candidate cultivar - 0.30 m). Key words: biochemical composition, cultivars, cultivation technology, fruit quality, raspberry. INTRODUCTION Raspberry is a cosmopolitan fruit crop. It is widespread in almost every continent because of its plasticity and taste. Its fruits have an exceptional taste and fine aroma. They are an important dietary source of vitamins, minerals and fiber. Red, violet, purple or blue colour is due to the presence of antioxidants in them that enhance human health. Many authors focus their studies on proving the biological activity in raspberry fruits that has anticancer, antibac-terial, antiviral, anti-inflammatory and cardio-vascular disease prevention (Wang, 2000; Moyer et al., 2002; Mullen et al., 2003; Cerda et al., 2005; Seeram et al., 2006; Jakobek et al., 2007; Heinonen, 2007; Borges et al., 2007) The purpose of the present article is to follow the impact of some elements of raspberry cultivation technology on the biochemical composition and quality of the fruit. MATERIALS AND METHODS The experiment was set in 2018. The objective of the present experiment was selected
Bulgarian cultivars, such as 'Samodiva' and 'Magdalena' (a candidate cultivar) and two cultivars that are products of the world selection, such as 'Meeker' and 'Willamette'. The choice is not accidental. 'Samodiva' is characterized by good fruitfullness, resistance to abiotic and biotic stress factors and the ability to be cultivated without a support structure. Candidate cultivar 'Magdalena' is a prospective cultivar, which is selected in RIMSA Troyan and is characterized by good shoot formation, moderate to strong growth and good taste of the fruits. 'Meeker' and 'Willamette' are introduced cultivars with good characteristics and suitable for cultivation in hilly areas. The following biochemical characteristics of fruit of the selected cultivars were investigated: - dry weight matter (%) - 5 to 10 g were taken from the sample, using glass weight, glass rod and quartz sand; - dry matter (DM) according to (refractometer) Re (%); - sugars (total, invert and sucrose) and acid, according to the method of Schoorl (Donchev et al., 2001), 25 g of sugars were taken from the
Scientific Bulletin. Series F. Biotechnologies, Vol. XXV, No. 1, 2021ISSN 2285-1364, CD-ROM ISSN 2285-5521, ISSN Online 2285-1372, ISSN-L 2285-1364

43
sample; chemicals: 10% NaCO3, NaHPO4, Fehling’s solution I, Fehling’s solution II (made in the laboratory), 30% KJ, 1: 6 H2SO4, titrated by 0.1 n Na2S2O3 and starch indicator - sugars; 5 ml of acids were taken from the primary filtrate (as malic) by titration with 0.1 n NaOH (%) and phenolphthalein indicator - acids; - tanning substances according to the method of Levental (Donchev et al., 2000), 25 g of tannins were taken from the sample. Chemicals: 1: 4 H2SO4, titrated by 0.1 KM4O4 and an indicator (indigo carmine); - anthocyanins (mg%) according to the method of Fuleki and Francis (1968), 2 g were taken from the sample. Chemicals: 96% spirt, buffer with pH 1.0; buffer with pH 4.5; - pectin according to the method of Melitz (Donchev et al., 2000), 12.5 g were taken from the sample. Chemicals: 0.1 n NaOH, 1 n CH3COOH, CaCl2, AgNO3; - total polyphenols (mg GAE/100 g fresh weight) according to the method of Singleton and Rossi (1965). In a test tube, 0.1 ml of sample extract was successively mixed with 0.5 ml of Folin-Ciocalteu - reagent (diluted 1: 4 with distilled water) and 1.5 ml of aqueous sodium carbonate solution (7.5%, w/v), bringing the volume to 10 mL with distilled water. The reaction mixture was allowed to stand for 2 hours in the dark at room temperature before to measure the absorption at 750 nm. The results obtained are presented as (GAE) in mg/100 g sample. - total antioxidant capacity was evaluated by determination of radical-scavenging activity with DPPH (2,2-diphenyl-1-picrylhydrazy) - test. The procedure is based on the method of Brand-Williams et al. (1995). Trolox, a water-soluble vitamin E analogue, was used as a standard and the results were expressed as Trolox equivalents (TE) in μmol per 100 g sample. - DPPH-test The procedure is based in the following modification: 2250 μl of DPPH methanolic solution (6 x 10⁻⁵ M) were mixed with 250 μl of sample extract (diluted with distilled water in a 1:3 v/v ratio); absorbance at 515 nm was measured after 15 minutes of staying of the
reaction mixture in a closed cuvette in the dark at room temperature. - antioxidant activity (µmol TE/100 g) methodology was adapted according to the method of Brand-Williams et al. (1995). All spectrophotometric measurements were performed at UV-Vis spectrophotometer Helios Omega, with VISION lite software (Thermo Fisher Scientific, Madison, WI, USA). Quality characteristics of fruit: - pH; appearance; colour; consistency; aroma; taste; overall tasting evaluation; total sensory evaluation calculated. Color assessment Color assessment was evaluated by Gardner with colorimeter Colorgard 05/CIELab 2000 (BYK-Gardner Inc. USA) (Damyanov, 2005a; Damyanov, 2005b). CIE Lab system was used for color measurement (CIE. (1986)). Color was expressed in L*, a* and b* values, where:
L - lightness: 100 for white and 0 for black; a* - positive values for red color and
negative ones for green color; b* - positive values for yellow color,
negative values for blue color. The measurement was performed in five replicates and the results were expressed as mean values. The biochemical analyzes of fruits were carried out in the chemical laboratory of RIMSA-Troyan, antioxidant activity and their qualitative characteristics were determined in department “Food technology” of the Institute of Food Preservation and Quality, Plovdiv. The field experiment was based on the methodology of plant resources (Nedev et al., 1979). Data processing was performed by the methods of variation and two-way dispersion analysis (Lidanski, 1988), using MS Excel software-2010. The collection plantation is located on a slope with an eastern exposure and altitude of 460 m. The soils are grey forest. The planting schemes are as follows: 0.30 m and 0.50 m in the intra row spacing and 3.00 m in the row spacing. The agrotechnics involved naturally grassed row spacing and the intra row spacing was kept as follow.

44
RESULTS AND DISCUSSIONS The fresh fruit biochemical composition reported a dry weight ranging from 11.08% ('Samodiva' 0.30 m), for comparison, the other variant at 0.50 m -12.06% to 14.57% ('Meeker' 0.30 m) (Table 1). Dry refractometric substances are represented in values from 6.50% ('Samodiva' 0.30 m) to 12.50% ('Meeker' 0.30 m). Total sugars were in the range of 1.30% ('Willamette' 0.50 m and candidate cultivar 'Magdalena' 0.30 m) to 2.40 ('Meeker' 0.50 m and 'Samodiva' 0.30 m). The lowest amount of inverted sugar was found in candidate cultivar 'Magdalena' (0.50) - 0.65%, while the highest amount was found in 'Meeker' (0.30 m) and 'Samodiva' (0.30 m) - 1.45%. The lowest sucrose values were found in 'Willamette' (0.50 m) - 0.62% and the highest value in candidate cultivar 'Magdalena'
(0.50 m) - 1.38%. Organic acids ranged from 0.32% ('Meeker' 0.30 m) to 0.70% ('Willamette' 0.50 m, candidate cultivar). The tannins ranged from 0.019% ('Meeker' 0.30 m) to 0.225% ('Willamette' 0.50 m). The amount of anthocyanins ranged from 6.29 mg/% (a candidate cultivar 'Magdalena' 0.30 m) to 38.87 mg/% ('Willamette' 0.50 m). That is to say there was a considerable variation in the indicator. It is noteworthy that higher values were obtained for variants of cultivars with longer planting distances. Pectin was in high values and ranged from 1.15% ('Meeker' 0.30 m) to 3.45% (a candidate cultivar 'Magdalena' 0.50 m). The total polyphenols content ranged from 104.14 mg/% ('Samodiva' 0.50 m) to 167.77% ('Meeker' 0.50 m). Significant variation is observed in the antioxidant activity ranging from 2625.00 µmol
Table 1. Biochemical composition of fresh fruit of raspberry cultivars in 2018
Sam
ple
No
Dry
wei
ght
mat
ter (
%)
DM
in R
e (%
)
Tota
l sug
ars
(%)
Inve
rted
suga
r (%
)
Sucr
ose
(%)
Aci
ds (a
s m
alic
) (%
)
Tann
ins (
%)
Ant
hocy
anin
s in
(mg
%)
Pect
in (%
)
Tota
l po
lyph
enol
s (m
g %
)
'Willamette' 0.50 m 12.53 9.00 1.30 0.65 0.62 0.70 0.225 38.87 2.11 263.37
'Willamette' 0.30 m 12.29 9.50 1.75 0.65 1.05 0.51 0.094 14.35 2.59 110.30
'Meeker' 0.50 m 14.57 11.00 2.40 1.30 1.05 0.64 0.037 20.97 2.69 167.77
'Meeker' 0.30 m 12.88 12.50 2.10 1.45 0.62 0.32 0.019 10.30 1.15 147.20
'Samodiva' 0.50 m 12.06 8.50 2.10 0.95 1.09 0.64 0.056 26.29 2.88 104.14
'Samodiva' 0.30 m 11.08 6.50 2.40 1.45 0.90 0.70 0.056 24.35 3.39 172.37
candidate cultivar 'Magdalena' 0.50 m 11.44 7.00 2.10 0.65 1.38 0.51 0.037 22.26 3.45 162.30
candidate cultivar 'Magdalena' 0.30 m 13.14 8.50 1.30 1.30 - 0.70 0.037 6.29 2.30 115.12
ẋ ± SE 0.38 0.70 0.16 0.13 0.15 0.05 0.02 3.62 0.26 18.17
St Dev 1.08 1.97 0.44 0.37 0.42 0.13 0.07 10.23 0.74 51.41
VC % 8.64 21.74 22.8 35.24 50 22.03 100 50 28.79 33.1
LSD-0.05 n.s n.s n.s n.s n.s n.s n.s n.s n.s n.s

45
Figure 1. Antioxidant capacity of raspberry fruit of different variants and cultivars
TE/100 g (candidate cultivar 'Magdalena' 0.30 m) to 7750.00 µmol TE/100 g for 'Willamette' in the same variant (Figure 1). There is no pronounced tendency among the variants. The quality characteristics of fruits are presented in Table 2. pH values were almost even and highly acid. Fruit appearance was at maximum values for 'Willamette' (both variants), 'Meeker' (0.50 m), 'Samodiva' (0.50 m) and candidate cultivar 'Magdalena' (0.30 m) with a grade of 5.00. In other words, the greater the planting distance higher the values. Colour is an important indicator of cultivar specificity. The variation range was close to 4.75 ('Meeker' 0.50 m, and 'Samodiva' 0.30 m) to 5.00 (for other cultivars and
variants). The fruit consistency was rated with a maximum score of 5.00 with the exception of 'Samodiva' (0.30 m). Fruit aroma determines to a great extent the attractiveness of raspberry fruit. The highest grades were obtained by 'Willamette' and candidate cultivar 'Magdalena' at planting distances of 0.30 m and the lowest by 'Meeker' in the same variant. The results show that there is no definite relationship between the variants. Fruit taste is next indicator that determines the complex evaluation. The results show that no maximum score was obtained. The highest value for all cultivars was 4.75 (except 'Willamette' 0.50 m). A value giving a high degree of that indicator. The same parameters were obtained when calculating the total tasting score of fruit.
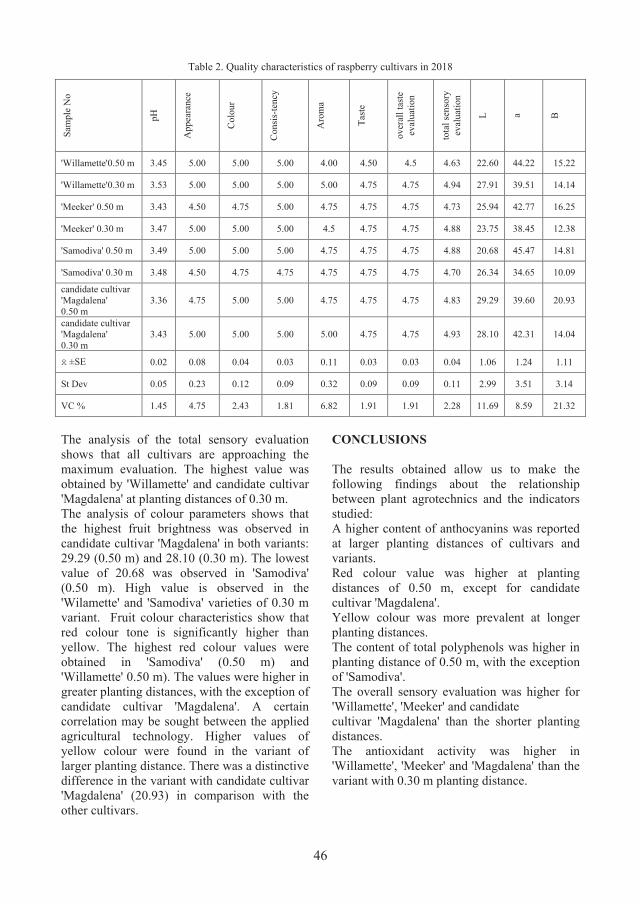
46
Table 2. Quality characteristics of raspberry cultivars in 2018 Sa
mpl
e N
o
рН
App
eara
nce
Col
our
Con
sis-
tenc
y
Aro
ma
Tast
e
over
all t
aste
ev
alua
tion
tota
l sen
sory
ev
alua
tion
L a B
'Willamette'0.50 m 3.45 5.00 5.00 5.00 4.00 4.50 4.5 4.63 22.60 44.22 15.22
'Willamette'0.30 m 3.53 5.00 5.00 5.00 5.00 4.75 4.75 4.94 27.91 39.51 14.14
'Meeker' 0.50 m 3.43 4.50 4.75 5.00 4.75 4.75 4.75 4.73 25.94 42.77 16.25
'Meeker' 0.30 m 3.47 5.00 5.00 5.00 4.5 4.75 4.75 4.88 23.75 38.45 12.38
'Samodiva' 0.50 m 3.49 5.00 5.00 5.00 4.75 4.75 4.75 4.88 20.68 45.47 14.81
'Samodiva' 0.30 m 3.48 4.50 4.75 4.75 4.75 4.75 4.75 4.70 26.34 34.65 10.09
candidate cultivar 'Magdalena' 0.50 m
3.36 4.75 5.00 5.00 4.75 4.75 4.75 4.83 29.29 39.60 20.93
candidate cultivar 'Magdalena' 0.30 m
3.43 5.00 5.00 5.00 5.00 4.75 4.75 4.93 28.10 42.31 14.04
ẋ ±SE 0.02 0.08 0.04 0.03 0.11 0.03 0.03 0.04 1.06 1.24 1.11
St Dev 0.05 0.23 0.12 0.09 0.32 0.09 0.09 0.11 2.99 3.51 3.14
VC % 1.45 4.75 2.43 1.81 6.82 1.91 1.91 2.28 11.69 8.59 21.32
The analysis of the total sensory evaluation shows that all cultivars are approaching the maximum evaluation. The highest value was obtained by 'Willamette' and candidate cultivar 'Magdalena' at planting distances of 0.30 m. The analysis of colour parameters shows that the highest fruit brightness was observed in candidate cultivar 'Magdalena' in both variants: 29.29 (0.50 m) and 28.10 (0.30 m). The lowest value of 20.68 was observed in 'Samodiva' (0.50 m). High value is observed in the 'Wilamette' and 'Samodiva' varieties of 0.30 m variant. Fruit colour characteristics show that red colour tone is significantly higher than yellow. The highest red colour values were obtained in 'Samodiva' (0.50 m) and 'Willamette' 0.50 m). The values were higher in greater planting distances, with the exception of candidate cultivar 'Magdalena'. A certain correlation may be sought between the applied agricultural technology. Higher values of yellow colour were found in the variant of larger planting distance. There was a distinctive difference in the variant with candidate cultivar 'Magdalena' (20.93) in comparison with the other cultivars.
CONCLUSIONS The results obtained allow us to make the following findings about the relationship between plant agrotechnics and the indicators studied: A higher content of anthocyanins was reported at larger planting distances of cultivars and variants. Red colour value was higher at planting distances of 0.50 m, except for candidate cultivar 'Magdalena'. Yellow colour was more prevalent at longer planting distances. The content of total polyphenols was higher in planting distance of 0.50 m, with the exception of 'Samodiva'. The overall sensory evaluation was higher for 'Willamette', 'Meeker' and candidate cultivar 'Magdalena' than the shorter planting distances. The antioxidant activity was higher in 'Willamette', 'Meeker' and 'Magdalena' than the variant with 0.30 m planting distance.

47
REFERENCES Borges, G. G., Roowi, S., Rouanet, J.-M., Duthie, GG,
Lean, MEJ, Crozier, A. (2007). The bioavailability of raspberry anthocyanins and ellagitannins in rats. Mol. nutr. food res., 6, 714-725.
Brand-Williams, W., M. Cuvelier, C. Berst. (1995). Use of a free radical method to evaluate antioxidant activity. Lebensmittel wissenschaft and technologie, 28, 25-30.
CIE. (1986). Colorimetry. Ed. CIE # 15 centrally. Bureau committee. intern. l'eclairage Vienna.
Cerda, B., Tomás-Barberán FA, Espín JC. (2005). Metabolism of antioxidant and chemopreventive ellagitannins from strawberries, raspberries, walnuts, and oak-aged wine in humans: identification of biomarkers and individual variability. J. Agric. food chem., 53. 227–235.
Damyanov, Ch. (2005a). Color and Quality - Food processing magazine, 2, 20-24.
Damyanov, Ch. (2005b). Color and Quality - Food processing magazine, 3, 13-15.
Donchev, Hr., Zlateva D, Pashova S. (2000). Food science, laboratory exercise guide, (pp. 61-63). Part Two, Varna, BG: University of Economics Publishing House.
Donchev, Hr., Zlateva D, Pashova S, Ivanov A. (2001). Food science, laboratory exercise guide (pp.103-106). Part First, Varna, BG: University of Economics Publishing House.
Fuleki T., Francis F.J. (1968). Journal of food science, 33(5), 471.
Heinonen, M. (2007). Antioxidant activity and antimicrobial effect of berry phenolics – a Finnish perspective. Molecular nutrition and food research, 51, 684-691.
Jakobek, L., Šeruga, M., Novak I., Medvidović-Kosanović, M. (2007). Flavonols, phenolic acids and antioxidant activity of some red fruits. Deutsche lebensmittel-rundschau, 103, 369-378.
Moyer, R. A., Hummer, K. E., Finn, C. E., Frei, B., Wrolstad, R. E. (2002). Anthocyanins, phenolics and antioxidant capacity in diverse small fruits: Vaccinium, Rubus and Ribes. Journal of agricultural and food chemistry, 50, 519-525.
Mullen, W, Yokota, T., Lean, MEJ, Crozier, A. (2003). Analysis of ellagitannins and conjugates of ellagic acid and quercetin in raspberry fruit by LC-MS, Phytochemistry, 64, 617-624.
Lidanski T. (1988). Statistical methods in biology and in agriculture. (pp. 43-62; 135-160), Zemizdat, Sofia (Bg).
Nedev, N., Grigorov, Y., Baev, Hr., Serafimov, S., Strandzhev, Al., Kavardzhikov, L., Lazarov, Kr., Nikolov, N., Dzhuvinov, V., Popova, L., Slavov, N., Iliev, P., Stoyanov, D., Kanev, Il., Krinkov, H., Vishanska, Yu., Topchiyska, M., Petrova, L. (1979). Methods for studying of planting resources of fruit crops. (pp. 111-116). Plovdiv, BG.
Seeram, N.P., Adams, LS, Zhang Y., Lee, R., Sand, D., Scheuller, HS, Heber D. (2006). Blackberry, black raspberry, blueberry, cranberry, red raspberry. and strawberry extracts inhibit growth and stimulate apoptosis of human cancer cells in vitro. J. agric. food chem., 54, 9329-9339.
Singleton, V., Rossi, J. (1965). Colorimetry of total phenolics with phosphomolybdic- phosphotungstic acid reagents. American journal of enology and viticulture, 50, 3828-3834.
Wang, S.Y., Lin, H.S. (2000). Antioxidant activity in fruits and leaves of blackberry, raspberry and strawberry varies with cultivar and developmental stage. J. agric. food chem, 48, 140-14.

48

49
FOOD BIOTECHNOLOGY

50

51
ANTIOXIDANT ACTIVITY IN SELECTED BRASSICACEAE VEGETABLES
Mihaela MULȚESCU1, 2, Iulia-Elena SUSMAN2, Floarea BURNICHI3, Florentina ISRAEL-ROMING1
1University of Agronomic Sciences and Veterinary Medicine of Bucharest, 59 Mărăști Blvd,
District 1, Bucharest, Romania 2National Institute of Research and Development for Food Bioresources - IBA Bucharest, 6 Dinu
Vintilă Street, Bucharest, Romania 3Research and Development Station for Vegetables Growing, 23 Mesteacănului Street, Buzău,
Romania
Corresponding author email: [email protected] Abstract Vegetables from Brassicaceae family are an excellent source of bioactive phytochemicals and may help to reduce the risk of chronic diseases. These vegetables contain various biologically active substances such as glucosinolates, polyphenols, flavonoids and vitamins. White cabbage (Brassica oleracea var. capita), red cabbage (Brassica oleracea var. capitata f. rubra), broccoli (Brassica oleracea var. italica), cauliflower (Brassica oleraceae var. botrytis) and kohlrabi (Brassica oleracea Gongylodes Group) were investigated for their contents in antioxidants: polyphenols, vitamin C, carotenoids, and chlorophyll. The antioxidant efficacy was assessed using DPPH free radical scavenging. Ascorbic acid and phenolic content varied considerably between different Brassica varieties. The results of vitamin C content ranged between 38.99-74.25 mg/100 g fresh weight (FW) and 21.69-71.64 mg/100 g fresh weight for polyphenols. Regarding pigments, the examined vegetables were found to contain between 0.095 and 0.85 mg/100 g FW carotenoids and between 1.37 and 3.41 mg/100 g FW chlorophyll. Regarding DPPH• assay, red cabbage had an exceptionally high antioxidant activity followed by cauliflower, broccoli, kohlrabi and white cabbage. Key words: Brassicaceae, DPPH method, pigments, polyphenols, vitamin C. INTRODUCTION
Regular consumption of fruits and vegetables confers significant benefits to human health. Epidemiological data as well as in vitro studies, strongly suggest that foods containing phytochemicals with antioxidation potential have strong protective effects against major disease risks (Kaur and Kapoor, 2002). Many epidemiological studies have correlated the intake of a diet rich in vegetables and fruits with a reduced risk of incidence of chronic diseases. In particular, current studies reported an inverse correlation between consumption of Brassicaceae and risk of cancer (Yagar et al., 2016). Brassicaceae family or Cruciferae family contains 350 genera and about 3,500 species and includes several genera such as Camelina, Crambe, Sinapis, Thlaspi and Brassica. The genus Brassica is the most important within the Brassicaceae, which includes some crops and species of a great worldwide economic
importance such as Brassica oleracea L., Brassica napus L. and Brassica rapa L. The main species of B. oleracea includes vegetable such as kale, cabbage, broccoli, Brussels sprouts, cauliflower and others (Cartea et al., 2011). According to Food and Agriculture Organization (FAO) data, the production of Brassica vegetables in the world covers a total of approximately 139 million tons: 33.5 million tons of cauliflower and broccoli, 105.7 million tons of cabbage and other Brassica species. China is the biggest Brassica vegetables producer in the world and constitutes over half of all Brassica vegetables production in the world [FAOSTAT]. Brassicaceae vegetables are an abundant source of health-promoting substances. Apart from anticarcinogenic glucosinolates, they possess antioxidants of both hydrophilic (vitamin C, polyphenols) and hydrophobic properties (carotenoids, vitamin
Scientific Bulletin. Series F. Biotechnologies, Vol. XXV, No. 1, 2021ISSN 2285-1364, CD-ROM ISSN 2285-5521, ISSN Online 2285-1372, ISSN-L 2285-1364

52
E), which can neutralize active oxygen species and quench free radicals. These vegetables are also rich in potassium, magnesium, calcium, phosphorus and vitamins C, E, K (Heimler et al., 2006; Hagen et al., 2009; Jahangir et al., 2009). The antioxidants mentioned above, scavenge radicals and inhibit chain initiation or break the chain propagation (the second defence line). Thus, the contribution of the Brassicaceae vegetables (e.g. broccoli, cauliflower, cabbage, kale) to health may be related to the antioxidant capacity of these vegetables due to the presence of phenolic compounds, carotenoids, vitamins and minerals (Mulțescu et al., 2020). The previous studies indicate the importance of these vegetables as the richest potential source of these substances. The studies emphasize the need to increase the proportion of these products in the human diet. The current study investigated the content of the main antioxidants between of the selected Brassicaceae vegetables (white cabbage, red cabbage, broccoli, cauliflower and kohlrabi) cultivated in Romania. MATERIALS AND METHODS Materials Samples of white cabbage (Brassica oleracea var. capita), red cabbage (Brassica oleracea var. capitata f. rubra), broccoli (Brassica oleracea var. italica), cauliflower (Brassica oleracea var. botrytis) and kohlrabi (Brassica oleracea zhanggylodes Group) were provided by the Development and Research Station for Vegetables growing from Buzau, Romania. The different Brassica varieties were cultivated in the same pedoclimatic conditions with respect to their own cultivating requirements. After harvesting, the vegetables were analyzed within 3 days. Chemicals like Trolox, DPPH (2,2-difenil-1-picrililhidrazil) and 2,6 diclorphenol-indophenol were purchased from Sigma-Aldrich. Meta-phosphoric acid, ethylenediaminetetraacetic acid, sodium hydrogen carbonate and sodium carbonate were purchased from Roth, while Folin-Ciocâlteu reagent, ascorbic acid and analytical grade organic solvents (methanol and acetone) were purchased from Merck.
Methods Sample preparation The inflorescences of selected vegetables were separated from inedible parts and were visually evaluated for damages or infections. Only vegetables with intact integrity were selected. The samples were washed in tap water and dried at room temperature, cut into small pieces and homogenized. For obtaining the vegetables extracts, a 1: 10 ratio between fresh plant material and selected extraction solvent was used. Finally, the extracts were vortexed and centrifuged, keeping the supernatants. Analytical methods Determination of total phenolic content Total phenolic content of fresh vegetables was determined using Folin-Ciocâlteu reagent (Singleton and Rossi, 1965) with modifications and adaptations to the working conditions of the laboratory. Briefly, 1 ml of 50% (v/v) methanolic extract was treated with 5 ml Folin-Ciocâlteu reagent (10% v/v) and 4 ml sodium carbonate (7.5% w/v). After 20 min keeping in the dark, the blue-colored compound was measured spectrophotometrically at 752 nm using a Specord 210 UV-VIS spectrophotometer (Analytic Jena, Germany). Phenolic content was calculated using a calibration curve obtained with gallic acid standard, over an interval of 10-50 µg acid gallic/ml. The results were expressed as mg GAE (gallic acid equivalents)/100 g fresh weight (FW). Determination of ascorbic acid The level of ascorbic acid was determined using dye-titration method, according to AOAC procedure, 2000. Metaphosphoric acid extracts of fresh vegetables were subjected to titration with 2,6-dichlorophenolindophenol. In this oxidation-reduction reaction, the ascorbic acid from the extract was oxidized to dehydroascorbic acid and the indophenol dye was reduced to a colourless compound. The end point of the titration was detected when an excess of the unreduced dye gave a rose pink in acid solution. Dehydroascorbic acid was not analysed in this study. The results were expressed in mg ascorbic acid/100 g FW.

53
Determination of pigments Carotenoids and chlorophyll were determined according to Lichtenthaler (1987) by extracting pigments using a solvent mixture of acetone/water (80:20, v/v). For a more efficient extraction, the vegetable sample mixed with the solvent was vortexed at 2000 rpm, at 20°C, for 15 min and then separated by centrifugation at 3500 rpm, at 20°C, for 15 min. The clear supernatant was further used for absorbance determination at 470, 646, 663 nm with a Specord 210 UV-VIS spectrophotometer (Analytic Jena, Germany). The content of total chlorophyll, chlorophyll a and chlorophyll b and carotenoid pigments were calculated on the basis of the absorbance values and the equations according to Lichtenthaler (1987) were as follows:
𝐶𝐶ℎ𝑙𝑙𝑙𝑙 𝑎𝑎 = (12.25xA663) − (2.79xA646)
𝐶𝐶ℎ𝑙𝑙𝑙𝑙 𝑏𝑏 = (21.50xA646) − (5.10xA663)
𝐶𝐶𝑎𝑎𝐶𝐶 =(1000𝑥𝑥𝑥𝑥470) − (1.82𝑥𝑥𝐶𝐶ℎ𝑙𝑙𝑙𝑙 𝑎𝑎) − (85.02𝑥𝑥𝐶𝐶ℎ𝑙𝑙𝑙𝑙 𝑏𝑏)
198 The results were expressed in mg chlorophyll/100 g FW and mg carotenoids/ 100 g FW, respectively. DPPH "scavenging" radical capacity The antioxidant activity was determined based on the reduction of 2,2-diphenyl-1-picryl-hydrazyl (DPPH) radical. A modified protocol (Culețu et al., 2016) was used consisting in the extraction of the samples in methanol: water (1:1, v/v). After vortexing (2000 rpm, 20°C, 15 min) and centrifugation (3500 rpm, 20°C, 15 min), 1 ml of supernatant was treated with 6 ml DPPH solution. Prepared solutions were left in the dark for 30 min and then the absorbance was measured at 517 nm using Specord 210 UV-VIS spectrophotometer (Analytic Jena, Germany). The antioxidant activity was calculated using a calibration curve obtained with Trolox (6-Hydroxy-2,5,7,8-tetramethylchroman-2-carboxylic acid) standards, over an interval of 0-0.40 mg Trolox/ml. The results were expressed in µmol Trolox/100 g FW. RESULTS AND DISCUSSIONS Five Brassica vegetables were assayed for variability between cultivars regarding antioxidant phyto-chemicals.
Total phenolic content Phenolic compounds are major antioxidants of Brassicaceae vegetables (Podsędek, 2007). Vegetables containing phenolics are an integral part of human diet. Some of the health protec-tive effects of phenolic compounds have been ascribed to their antioxidant, antimutagenic, anticarcinogenic, anti-inflammatory and antimicrobial properties (Xu et al., 2008). In plants, phenols occur in soluble forms and along with cell wall components-bound phenols. Bound phenols were quantified in the extracts after base hydrolysis of residues following the solvent soluble extraction (Podsędek, 2007). Figure 1 presents the total phenolic content of analysed raw vegetables. The content of phenolic content was highest in red cabbage. According to Charon et al. (2007), red cabbage is a good source of phenolic compounds, and the most abundant class is the anthocyanins. In this study, the greatest quantity was found in red cabbage (71.64 mg/100 g) followed by broccoli (56.62 mg/100 g) and cauliflower (51.09 mg/100 g). Total polyphenol content of red cabbage was extremely high, four times higher than in white cabbage. Leja et al. (2010) found that the level of phenolic substances (total, as well as those of individual groups) was much higher in red cabbage compared with the two white cabbage cultivars tested. Previous studies indicated different levels of total phenolic content for white cabbage ranging between 134.73-393.1 mg GAE/100 g FW (Podsędek et al., 2006; Leja et al., 2010; Chun et al., 2004). Considering that Brassica species are the most efficient vegetables regar-ding polyphenolic content, they are acting as an efficient antiradical agent (Podsędek, 2007). In present study, kohlrabi and white cabbage presented the lowest quantity of phenolics, 21.69 mg GAE/100 g FW and 22.18 mg GAE/100 g FW, respectively. Yi et al. (2017) reported that kohlrabi is rich in antioxidants from the group of phenolic compounds with a total phenolic content of 27.33 mg GAE/100 g and contains antioxidant vitamins. However, the content of polyphenols in fresh white cabbage was reported to range from 15.3 mg GAE/100 g to 203 mg GAE/100 g (Bahorun et al., 2004; Wu et al., 2004).
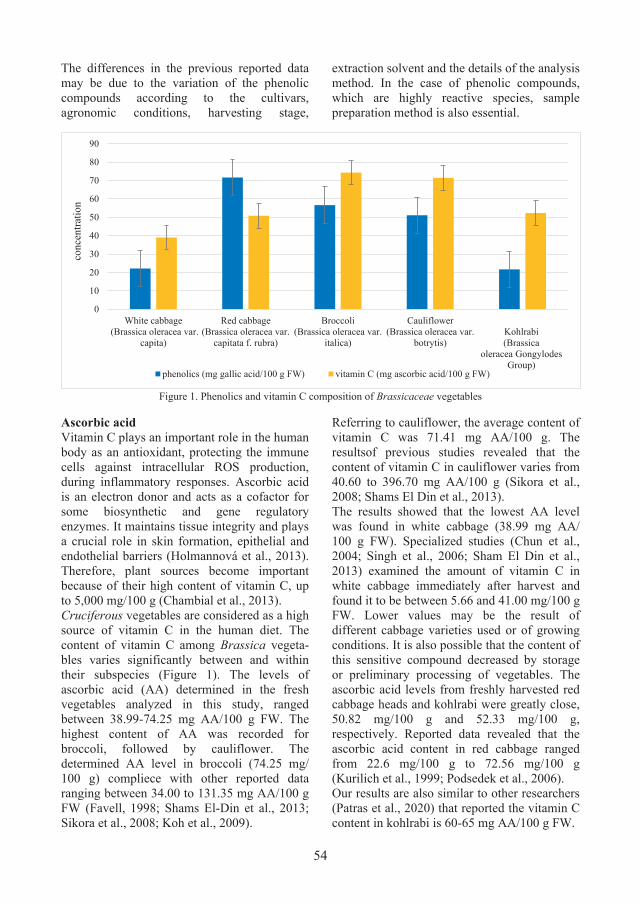
54
The differences in the previous reported data may be due to the variation of the phenolic compounds according to the cultivars, agronomic conditions, harvesting stage,
extraction solvent and the details of the analysis method. In the case of phenolic compounds, which are highly reactive species, sample preparation method is also essential.
Figure 1. Phenolics and vitamin C composition of Brassicaceae vegetables
Ascorbic acid Vitamin C plays an important role in the human body as an antioxidant, protecting the immune cells against intracellular ROS production, during inflammatory responses. Ascorbic acid is an electron donor and acts as a cofactor for some biosynthetic and gene regulatory enzymes. It maintains tissue integrity and plays a crucial role in skin formation, epithelial and endothelial barriers (Holmannová et al., 2013). Therefore, plant sources become important because of their high content of vitamin C, up to 5,000 mg/100 g (Chambial et al., 2013). Cruciferous vegetables are considered as a high source of vitamin C in the human diet. The content of vitamin C among Brassica vegeta-bles varies significantly between and within their subspecies (Figure 1). The levels of ascorbic acid (AA) determined in the fresh vegetables analyzed in this study, ranged between 38.99-74.25 mg AA/100 g FW. The highest content of AA was recorded for broccoli, followed by cauliflower. The determined AA level in broccoli (74.25 mg/ 100 g) compliece with other reported data ranging between 34.00 to 131.35 mg AA/100 g FW (Favell, 1998; Shams El-Din et al., 2013; Sikora et al., 2008; Koh et al., 2009).
Referring to cauliflower, the average content of vitamin C was 71.41 mg AA/100 g. The resultsof previous studies revealed that the content of vitamin C in cauliflower varies from 40.60 to 396.70 mg AA/100 g (Sikora et al., 2008; Shams El Din et al., 2013). The results showed that the lowest AA level was found in white cabbage (38.99 mg AA/ 100 g FW). Specialized studies (Chun et al., 2004; Singh et al., 2006; Sham El Din et al., 2013) examined the amount of vitamin C in white cabbage immediately after harvest and found it to be between 5.66 and 41.00 mg/100 g FW. Lower values may be the result of different cabbage varieties used or of growing conditions. It is also possible that the content of this sensitive compound decreased by storage or preliminary processing of vegetables. The ascorbic acid levels from freshly harvested red cabbage heads and kohlrabi were greatly close, 50.82 mg/100 g and 52.33 mg/100 g, respectively. Reported data revealed that the ascorbic acid content in red cabbage ranged from 22.6 mg/100 g to 72.56 mg/100 g (Kurilich et al., 1999; Podsedek et al., 2006). Our results are also similar to other researchers (Patras et al., 2020) that reported the vitamin C content in kohlrabi is 60-65 mg AA/100 g FW.
0
10
20
30
40
50
60
70
80
90
White cabbage (Brassica oleracea var.
capita)
Red cabbage(Brassica oleracea var.
capitata f. rubra)
Broccoli(Brassica oleracea var.
italica)
Cauliflower(Brassica oleracea var.
botrytis)Kohlrabi(Brassica
oleracea GongylodesGroup)
conc
entra
tion
phenolics (mg gallic acid/100 g FW) vitamin C (mg ascorbic acid/100 g FW)

55
According to our study and previous research, the content of AA showed considerable variation depending on vegetables cultivars, sample extraction and analytical method. Chlorophyll Chlorophylls (Chl) are photosynthetic pigments that are widely distributed in nature. They can be found in a large number of green vegetables, such as broccoli and cabbage plants. It is classified as blue chlorophyll (chlorophyll a), green chlorophyll (chlorophyll b) and chlorofucin (chlorophyll c1, chlorophyll c2). The absorbance properties of pigments facili-tate the qualitative and quantitative analysis of them (Fernandez-Leon et al., 2010). All green vegetables contain chlorophyll a and chlo-rophyll b. In higher plants, chlorophyll a is the major pigment and chlorophyll b is an accessory pigment. The ratio a/b is usually 3 to 1. The ratio depends and varies with growth conditions and environmental factors. The con-tent of chlorophylls can be determined spectrophotometrically following extraction of the pigments using an organic solvent, such as acetone or dimethyl formamide. The spectro-photometric determination for chlorophylls permits direct calculation of chlorophyll a and chlorophyll b in the plant extract, without separation into individual pigments. Our results (Table 1) showed a variation in the chlorophyll content of the analysed vegetables, with levels of pigments ranging between 1.37 mg/100 g and 3.41 mg/100 g FW. The highest concentration of chlorophyll was found in broccoli (3.41 mg/100 g) while kohlrabi presented the smallest level of total chlorophyll (1.37 mg/100 g). In cauliflower, no pigments level was detected. Ramos dos Reis et al. (2015) observed that the content of chlorophyll in fresh broccoli inflorescences was 30.8 mg/100 g, 10 times higher than our value. The authors, also reported the absence of these pigments in cauliflower. In this study, white cabbage and red cabbage contain 1.96 mg/100 g and 2.77 mg/100 g, respectively. Lower values may be the result of varieties used or growing conditions. It is also possible that the content of this sensitive compound
decreased by storage or preliminary processing of the vegetables. Overall, chlorophyll levels differed depending on the cultivar and plant part in most cases. Carotenoids Carotenoids are natural pigments, that are - synthesized by plants, algae and photosynthetic bacteria. They are responsible for the yellow, orange and red colours in various fruits and vegetables (Namitha and Negi, 2010). Carotenoids in plants can be found in free form or esterified with fatty acids. Though, esterification does not alter the chromophore properties of the carotenoid, it does modify the chemical and biological properties by changing its immediate environment (Pérez-Gálvez & Mínguez-Mosquera, 2005). These pigments can be found in green leaves and fruits along with chlorophylls. The natural functions and properties of carotenoids are determined by their molecular structure. Thus, chromophore is the part of a carotenoid molecule responsible for its colour and photoprotective actions. The colour develops when a chromophore absorbs particular wavelengths of visible light and transmits or reflects others (Britton, 2008). Carotenoids are important for antioxidant activity, intercellular communication and immune system influence (Skibsted, 2012; Stephensen, 2013). According to the results of this study presented in Table 1, Brassica oleracea varieties that were analyzed contain low concentrations of carotenoids. The obtained data confirm that Cruciferous vegetables are not a major dietary source of carotenoids. Kaulmann et al. (2014), reported similar levels of carotenoids in these vegetables as follows: white cabbage (0.51 mg/100 g), red cabbage (0.16 mg/100 g), cauliflower (0.07 mg/100 g) except broccoli, which presented a higher concentration than our result, 4.69 mg/100 g. Ramos dos Reis et al. (2015) analysed the total carotenoid content in fresh broccoli and cauliflower and they obtained lower results 0.76 mg/100 g for broccoli and 0.0035 mg/ 100 g for cauliflower. Zhang and Hamauzu (2004) investigated total carotenoids of broccoli florets and stem and they reported that the stem contained 0.10 mg/100 g FW of carotenoids, less than 3% of total carotenoids

56
present in the floret, 3.75%. Sikora et al. (2008) examined the amount of total carotenoids in broccoli and cauliflower immediately after harvest and found it to be 0.26 mg/100 g for broccoli. In cauliflower, these compounds were absent. Among the 22 species of vegetables investigated by Muller (1997), he observes that broccoli (1.6 mg/100 g), red cabbage (0.43
mg/100 g) white cabbage (0.25 mg/100 g) and kohlrabi (0.07 mg/100 g) contain a small quantity of total carotenoid content. Content and types of carotenoids in plants depend on several pre- and post-harvesting factors, genotype, ripening time, cultivation method and climatic conditions, processing.
Table 1. Chlorophyll and carotenoid content of selected Brassicaceae vegetables
Antioxidant activity The model of scavenging the stable DPPH∙ radical is a widely used method to evaluate antioxidant activities in a relatively short time compared with other methods. The effect of antioxidants on DPPH radical scavenging was thought to be due to their hydrogen donating ability (Baumann, 1979). The DPPH∙ radical is one of the few stable organic nitrogen radicals, which has a deep purple. Brassicaceae vegetables extracts have been screened for antioxidant activity using different oxidation systems and methods to measure antioxidant capacity (Honer & Cervellati, 2002). Various antioxidant activity methods have been used to monitor and compare the antioxidant activity of foods. These methods differ in terms of their assay principles and experimental conditions. The antioxidant capacity was expressed as μmol Trolox/100 g of vegetables extract. The values are displayed in Figure 2. Broccoli, cauliflower and red cabbage show high antioxidant potential, whereas white cabbage has a rather low antioxidant activity Samec et al. (2011) found that the antioxidant activity of white cabbage leaves reached its maximum in the juvenile stages. The maximum of antioxidant activity was recorded in red cabbage (Brassica oleracea var. capitata f. rubra), 431.82 μM Trolox/100 g, followed by
cauliflower (Brassica oleracea var. botryitis), 394.88 μM Trolox/100 g). The minimum of DPPH was recorded in white cabbage (Brassica oleracea var. capita), 252.85 μM Trolox/100 g, followed by kohlrabi (Brassica oleracea Gongylodes Group), 329.56 μmol Trolox/100 g and broccoli (Brassica oleracea var. italica), 380.05 μM Trolox/100 g. Ramos dos Reis et al. (2015) analyzed the antioxidant activity of fresh broccoli and cauliflower. They found that broccoli and cauliflower have an antioxidant scavenging of 719.34 μM Trolox/100 g and 391.13 μM Trolox/100 g and 391.13 μM Trolox/100 g, respectively. Compare with our study, the value of broccoli was approximately two-fold higher. Some authors (Soare et al., 2016) estimated that the level of 5 cultivars of white cabbage was 91.53-161.12 μM Trolox/100 g, lower than our reported value. The variation of antioxidant activity is caused by many factors such as geographical region, climate, variety, harvest maturity, growth conditions, soil condition and post-harvest conservation and processing methods (Gonçalves et al., 2004). Because the contribution of the antioxidant to the overall antioxidant capacity is different, a correlation analysis was performed. The results showed a strong positive correlation of total phenolic content with antioxidant activity on DPPH
White cabbage (Brassica
oleracea var. capita)
Red cabbage (Brassica oleracea
var. capitata f. rubra)
Broccoli (Brassica
oleracea var. italica)
Cauliflower (Brassica
oleracea var. botrytis)
Kohlrabi (Brassica
oleracea Gongylodes Group)
Total chlorophyll (mg/100 g FW) 1.96±0.31 2.77±0.61 3.41±0.43 Nd 1.37±0.59
Chlorophyll a (mg/100 g FW) 1.38±0.42 2.47±0.49 2.75±0.54 Nd 0.99±0.42
Chlorophyll b (mg/100 g FW) 0.58±0.29 1.30±0.32 0.66±0.15 Nd 0.38±0.06
Total carotenoids (mg/100 g FW) 0.29±0.10 0.11±0.009 0.85±0.06 0.095±0.008 0.28±1.22

57
Figure 2. Total antioxidant activity of fresh vegetables determined by DPPH assay
radical, with a correlation coefficient of 0.814. Moderate correlation was recorded for ascorbic acid (0.362), while for chlorophyll and carotenoids the relationship was insignificant. The results complies with other studies that reported strong correlation of antioxidant activity with total phenolic content, correlation coefficient ranging between 0.61-0.86. according to analyses of Brassica varieties. CONCLUSIONS In this study, 5 subspecies of Brassica oleracea were analysed of the content of the most important antioxidants and also of antioxidant activity. All the varieties were cultivated in the same area, the different results were not giving by soil quality, agricultural practices or postharvest conditions. That means that the values obtained for the determination were influence only by different subspecies and the environmental conditions (because they have different cultivation period). ACKNOWLEDGEMENTS This research work was performed with the support of National Research and Development Institute for Food Bioresources – IBA Bucharest and Research and Development Station for Vegetables growing Buzau. Also, the study was achieved through Core Program (PN 19 02), with the support of the Ministry of Research and Innovation (MCI), contract 22N/2019, project PN 19 02 02 04 and USAMVB PhD fellowship programme.
REFERENCES AOAC-International. (2000). AOAC official method 967.21-
2,6-dichloroindophenol titrimetric method (17 ed). New York
Bahorun, T., Luximon-Ramma, A., Crozier, A., Aruoma, O. I. (2004). Total phenol, flavonoid, proanthocyanidin and vitamin C levels and antioxidant and cure: an overview. Indian Journal of Clinical Biochemistry, 28, 314–328.
Baumann, J., Wurn, G., Bruchlausen, F. V. (1979). Prostaglandin synthetase inhibiting O2- radical scavenging properties of some flavonoids and related phenolic compounds, 308, R27.
Britton, G., Liaaen-Jensen, S., Pfander, H. (2008). Carotenoids, Natural Functions, 4.
Cartea, M. L., Lema, M., Francisco, M., Velasco, P. (2011). Basic Information on Vegetable Brassica Crops. Pontevedra, Spain.
Chambial, S., Dwivedi S., Shukla, K. K., Placheril J. J, Praveen S. (2013). Vitamin C in Disease Prevention and Cure: An Overview. Indian Journal of Clinical Biochemistry, 28, 314–328.
Charron, C. S., Clevidence, B. A., Britz, S. J., Novotny, J. A. (2007). Effect of dose size on bioavailability of acylated and nonacylated anthocyanins from red cabbage (Brassica oleracea L. var. capitata). Journal of Agriculture and Food Chemistry, 55, 5354–5362.
Chun, O.K., Smith, N., Sakagawa, A., Chang Yong Lee C. Y. (2004). Antioxidant properties of raw and processed cabbages. International Journal of Food Sciences and Nutrition, 55, 191‒199.
Culețu, A., Fernandez-Gomez, B., Ullate, M., Del Castillo, M.D., Andlauer, W. (2016). Effect of theanine and polyphenols enriched fractions from decaffeinated tea dust on the formation of Maillard reaction products and sensory attributes of breads. Food Chemistry, 197, 14–23.
Favell, D. J. (1998). A comparison of the vitamin C content of fresh and frozen vegetables. Food Chemistry, 62, 59–64.
Fernández-Leon, M. F, Lozano, M., Ayuso, M. C., Fernández-Leon, A. M., González-Gomez, D. (2010). Fast and accurate alternative UV-chemometric method for the determination of chlorophyll A and B in broccoli (Brassica oleracea Italica) and cabbage (Brassica oleracea Sabauda) plants. Journal of Food Composition and Analysis, 23, 809–813.
Food and Agriculture Organisation Statistics (FAOSTAT) (2014) Food and Agriculture Organization of the United Nations, Viale delle Terme di Caracalla, Rome, Italy.
0
100
200
300
400
500
White cabbage (Brassica oleracea var.
capita)
Red cabbage(Brassica oleracea var.
capitata f. rubra)
Broccoli(Brassica oleracea var.
italica)
Cauliflower(Brassica oleracea var.
botrytis)Kohlrabi(Brassica
oleracea GongylodesGroup)
conc
entra
tion
antioxidant activity (μmol Trolox/100 g)

58
Gonçalves, B., Landbo, A., Knudsen, D., Silva, A. P.,
Moutinho- Pereira, J., Rosa, E. (2004). Effect of ripeness and postharvest storage on the phenolic profiles of cheeries (Prunes avium L.). Journal of Agricultural and Food Chemistry, 52, 523–530.
Hagen, S. F., Borge, G. I. A., Solhaug, K. A., Bengtsson, G. B. (2009). Effects of cold storage and harvest date on bioactive compounds in curly kale (Brassica oleracea L. var. Acephala). Postharvest Biology and Technology, 51, 36-42.
Heimler, D., Vignolini, P., Dini, M. G., Vincieri, F. F., Romani, A. (2006). Antiradical activity and polyphenol composition of local Brassicaiceae edible varieties. Food Chemistry, 99, 464-469.
Holmannova, D., Koláĉhová, M., Krejsek, J. (2013). Vitamin C and its physiological role with respect to the components of the immune system. Vnitrni Lekarstvi, 58, 743–749.
Honer, K., & Cervellati, R. (2002). Measurements of the antioxidant capacity of fruits and vegetables using the BR reaction method. European Food Research and Technology, 215, 437–442.
Jahangir, M., Kim, H. K., Choi, Y. H., Verpoorte, R. (2009). Health-affecting compounds in Brassicaceae. Comprehensive Reviews Food Science and Food Safety, 8, 31−43.
Kaulmann, A., Jonville, M. C., Schneider, Y. J., Hoffmann, L., Bohn, T. (2014). Carotenoids, polyphenols and micronutrient profiles of Brassica oleracea and plum varieties and their contribution to measures of total antioxidant capacity. Food Chemistry, 155, 240–250.
Kaur, C., Kapoor, H. C. (2002). Anti-oxidant activities and total phenolic content of some Asian vegetables. International Journal of Food Science & Technology, 37, 153-161.
Koh, E., Wimalasiri , K. M. S., Chassy, A. W., Mitchell, A. E. (2009). Content of ascorbic acid, quercetin, kaempferol and total phenolics in commercial broccoli. Journal of Food Composition and Analysis, 22, 637–643.
Kurilich, A. C., Tsau, G. J., Brown, A., Howard, L., Klein, B. P., Jeffery, E. H., et al. (1999). Carotene, tocopherol, and ascorbate contents in subspecies of Brassica oleracea. Journal of Agriculture and Food Chemistry, 47, 1576–1581.
Leja, M., Kamińska, I., Kołton, A. (2010). Phenolic compounds as the major antioxidants in red cabbage. Folia Horticulturae Ann., 22, 19-24.
Lichtenthaler, H. K. (1987). Chlorophylls and carotenoids: pigments of photosynthetic biomembranes. Methods in Enzymology, 148, 350‒382.
Muller, H. (1997). Determination of the carotenoid content in selected vegetables and fruit by HPLC and photodiode array detection. Zeitschrift fur Lebensmittel-Untersuchung und-Forschung A., 204, 88–94.
Mulțescu, M., Zachia, M., Belc, N., Burnichi, F., Israel-Roming F. (2020). Antioxidants in fresh and cooked broccoli (Brassica oleracea var. Avenger) and cauliflower (Brassica oleracea var. Alphina F1). Scientific Bulletin. Series F. Biotechnologies, 24, 107‒113.
Namitha, K. K., & Negi, P. S. (2010). Chemistry and biotechnology of carotenoids. Critical Reviews in Food Science and Nutrition, 50, 728–760.
Patras A. (2020). Polyphenolic content and radical scavenging capacity of kohlrabi sprouts at different maturity stages. Journal of Engineering Science, 2, 154‒159.
Pérez-Gálvez, A., & Mínguez-Mosquera, M. I. (2005). Esterification of xanthophylls and its effect on chemical behavior and bioavailability of carotenoids in the human. Nutrition Research, 25, 631–640.
Podsędek, A., (2007). Natural antioxidants and antioxidant capacity of Brassica vegetables: A review. International Journal of Food Science and Technology, 40, 1‒11.
Podsędek, A., Sosnowska, D., Redzynia, M., Anders, B. (2006). Antioxidant capacity and content of Brassica oleracea dietary antioxidants. International Journal of Food Science and Technology, 41, 49–58.
Ramos dos Reis, L. C., Ruffo de Oliveira, V., Kienzle Hagen, M. E., Jablonski, A., Hickmann Flôres, S., Oliveira Rios, A. (2015). Effect of cooking on the concentration of bioactive compounds in broccoli (Brassica oleracea var. Avenger) and cauliflower (Brassica oleracea var. Alphina F1) grown in an organic system. Food Chemistry, 63, 177-183.
Singleton, V. L., & Rossi, J. A. (1965). Colorimetry of total phenolics with phosphomolybdic-phosphotungstic acid reagents. American Journal Enology Viticulture, 16, 144-158.
Samec, D., Piljac-Zagarac, J., Bogovic, M., Habjanic, K., & Gruz, J. (2011). Antioxidant potency of white (Brassica oleracea L. var. capitata) and Chinese (Brassica rapa L. var. pekinensis (Lour.)) cabbage: The influence of development stage, cultivar choice and seed selection. Scientia Horticulturae, 128, 78–83.
Shams El-Din, M.H.A., Abdel- Kader, M.M., Makhlouf, S.K., Mohamed O.S.S. (2013). Effect of Some Cooking Methods on Natural Antioxidants and Their Activities in Some Brassica Vegetables. World Applied Sciences Journal, 26, 697-703.
Sikora, E., Cieslik, E., Leszczynska, T., Filipiak-Florkiewicz, A., Pisulewski, P. M. (2008). The antioxidant activity of selected cruciferous vegetables subjected to aquathermal processing. Food Chemistry, 107, 55–59.
Singh, J., Upadhyay, A.K., Bahadur, A., Singh, B., Singh Mathura Rai, K. P. (2006). Antioxidant phytochemicals in cabbage (Brassica oleracea L. var. capitata). Scientia Horticulturae, 108, 233-237.
Skibsted, L. H. (2012). Carotenoids in antioxidant networks colorants or radical scavengers. Journal of Agricultural and Food Chemistry, 60, 2409–2417.
Soare, R., Dinu, M., Babeanu, C., Fortofoiu, M., (2016). Bioactive compounds and antioxidant capacity in some genottypes of white cabbage. Advances in Biotechnology, 16, 437-444.
Stephensen, C. B. (2013). Provitamin A carotenoids and immune function. Nutrition and Health, 261–270.
Wu, X., Beecher, G. R., Holden, J. M., Haytowitz, D. B., Gebhardt, S. E., Prior, R. L. (2004). Lipophilic and hydrophilic antioxidant capacities of common foods in the United States. Journal of Agriculture and Food Chemistry, 52, 4026–4037.
Xu, G., Ye, X., Liu, D., Ma, Y., & Chen, J. (2008). Composition and distribution of phenolic acids in Ponkan (Citrus poonensis Hort. ex Tanaka) and Huyou (Citrus paradisi Macf. Changshanhuyou) during maturity. Journal of Food Composition and Analysis, 21, 382–389.
Yagar, H., Isbilir, S., Akagun, G. (2016). Antioxidant Activity of Kohlrabi Leaf and Tuber. Journal of Agriculture and Life Sciences, 1, 55‒65.
Yi, M. R., Kangm C. H., Bu, H. J. (2017). Antioxidant and anti-inflammatory activity of extracts from kohlrabi (Brassica oleracea var. Gongylodes). Journal of the Korean Applied Science and Technology, 34, 189-202.
Zhang, D., & Hamauzu, Y. (2004). Phenolics, ascorbic acid, carotenoids and antioxidant activity of broccoli and their changes during conventional and microwave cooking. Food Chemistry, 88, 503–550.

59
IMPROVING BREAD AROMA USING SOURDOUGH FERMENTATION
Şerban-Eugen CUCU1, 2, Mona Elena POPA1
1University of Agronomic Sciences and Veterinary Medicine of Bucharest, 59 Mărăști Blvd,
District 1, Bucharest, Romania 2National Research and Development Institute for Food Bioresources, 5 Ancuța Băneasa Street,
District 2, Bucharest, Romania
Corresponding author email: [email protected] Abstract Whole-wheat bread is commonly consumed all over the world, due to its high nutritional content. However, this type of bread have high levels of phytic acid, which can chelate divalent minerals. Phytic acid is a major phosphorous storage compound existing in most cereal grains, oilseeds and legumes and it is necessary to find technological solution for reducing its content in bread. In recent years, consumer appreciation regarding sourdough bread has increased, not only due to higher information of its nutritional properties, but mainly because consumers relish the stronger aroma of sourdough bread compared with yeasted bread. Technological aids such as natural antimicrobial compounds or sourdough utilization can be a particularly useful tool to improve bread shelf life but also bread quality and flavor. Bread aroma is determined by numerous factors, including the sort of cereal flours, the characteristics of sourdough preparation, the baking conditions, and the metabolism of fermenting microorganisms. This paper aim is to review the literature for various state of the art technological solutions for bread flavor and nutritional quality improving. Key words: bread, phytic acid, sourdough, whole-wheat bread. INTRODUCTION Known as traditional practice the sourdough fermentation is a used in bread or steamed bread production to ferment cereals for. Compared to the instant active dry yeast commonly used in food industries, the sourdough produced bread/steamed bread has unique flavor, shelf-life, nutrition and texture characteristics (Li et al., 2017; Liu et al., 2016) and in addition lower allergenicity (Fu et al., 2020). In present-day, sourdough has been increasingly used worldwide as the consumer request for natural, tasty, healthy and nutritious foods has increased (Palla et al., 2017). One of the main fabricated products of variety of Romanian food industry is bread. Approximately 55% of the Romanian households are consuming bread with no packaging, obtained particularly from bakeries and small supermarkets. Bread is continuously present in everyday diet. 97 kilograms for each person is the estimation of the annual medium consumption of bread per capita. This fact is overtaking the European medium consumption levels (Tamba-Berehoiu et al., 2014). If we have to compare two categories of bakery
products: one made by using highly refined white flour and one containing whole-wheat flour or rye flour, we can observe that the first one contains lower amounts of vitamin B1 and vitamin E. We can obtain B1 and E vitamins enriched food products by adding supplementary ingredients (mixed seeds, garlic, olive oil, onion) to some types of bakery products. These additional vegetable admixtures have been used to improve aroma and diversify the area of bakery products, pursuing to be a motivation and guidance for a healthier consumption of food (Gherghina et al., 2015). A major role in expanding the specific features of sourdough used to process wheat flour foods is played by microorganisms. From different countries there are communications regarding the microbiota of sourdough that having shown that the lactic acid bacteria (LAB) fermentation largely redounds to the specific features of sourdough products (Siepmann et al., 2018). Until now, the Lactobacillus genus contain 261 species. These species can be classified into 25 genera (Zheng et al., 2020) and in this category more than 60 species have been identified in sourdoughs worldwide (Gobbetti et al., 2016).
Scientific Bulletin. Series F. Biotechnologies, Vol. XXV, No. 1, 2021ISSN 2285-1364, CD-ROM ISSN 2285-5521, ISSN Online 2285-1372, ISSN-L 2285-1364
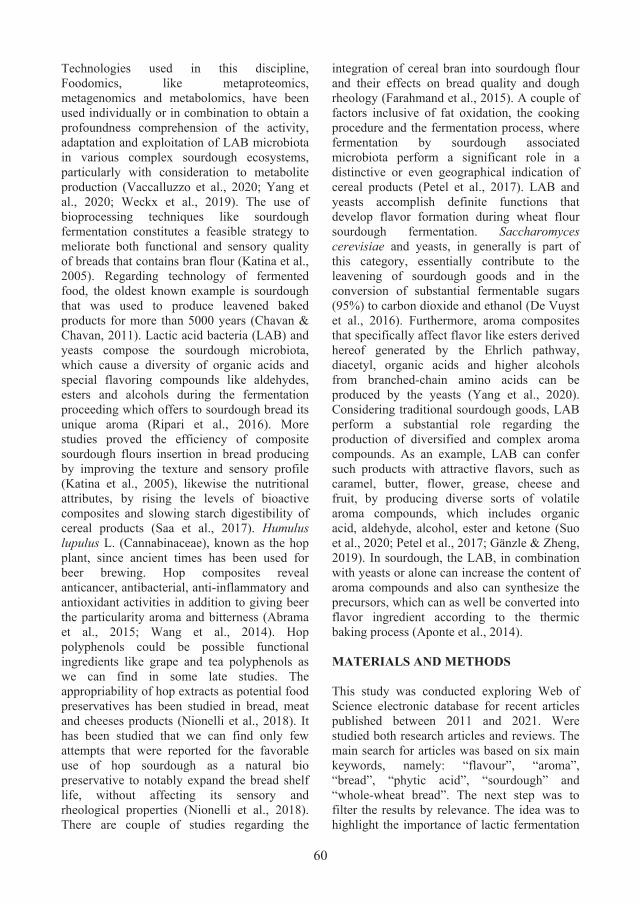
60
Technologies used in this discipline, Foodomics, like metaproteomics, metagenomics and metabolomics, have been used individually or in combination to obtain a profoundness comprehension of the activity, adaptation and exploitation of LAB microbiota in various complex sourdough ecosystems, particularly with consideration to metabolite production (Vaccalluzzo et al., 2020; Yang et al., 2020; Weckx et al., 2019). The use of bioprocessing techniques like sourdough fermentation constitutes a feasible strategy to meliorate both functional and sensory quality of breads that contains bran flour (Katina et al., 2005). Regarding technology of fermented food, the oldest known example is sourdough that was used to produce leavened baked products for more than 5000 years (Chavan & Chavan, 2011). Lactic acid bacteria (LAB) and yeasts compose the sourdough microbiota, which cause a diversity of organic acids and special flavoring compounds like aldehydes, esters and alcohols during the fermentation proceeding which offers to sourdough bread its unique aroma (Ripari et al., 2016). More studies proved the efficiency of composite sourdough flours insertion in bread producing by improving the texture and sensory profile (Katina et al., 2005), likewise the nutritional attributes, by rising the levels of bioactive composites and slowing starch digestibility of cereal products (Saa et al., 2017). Humulus lupulus L. (Cannabinaceae), known as the hop plant, since ancient times has been used for beer brewing. Hop composites reveal anticancer, antibacterial, anti-inflammatory and antioxidant activities in addition to giving beer the particularity aroma and bitterness (Abrama et al., 2015; Wang et al., 2014). Hop polyphenols could be possible functional ingredients like grape and tea polyphenols as we can find in some late studies. The appropriability of hop extracts as potential food preservatives has been studied in bread, meat and cheeses products (Nionelli et al., 2018). It has been studied that we can find only few attempts that were reported for the favorable use of hop sourdough as a natural bio preservative to notably expand the bread shelf life, without affecting its sensory and rheological properties (Nionelli et al., 2018). There are couple of studies regarding the
integration of cereal bran into sourdough flour and their effects on bread quality and dough rheology (Farahmand et al., 2015). A couple of factors inclusive of fat oxidation, the cooking procedure and the fermentation process, where fermentation by sourdough associated microbiota perform a significant role in a distinctive or even geographical indication of cereal products (Petel et al., 2017). LAB and yeasts accomplish definite functions that develop flavor formation during wheat flour sourdough fermentation. Saccharomyces cerevisiae and yeasts, in generally is part of this category, essentially contribute to the leavening of sourdough goods and in the conversion of substantial fermentable sugars (95%) to carbon dioxide and ethanol (De Vuyst et al., 2016). Furthermore, aroma composites that specifically affect flavor like esters derived hereof generated by the Ehrlich pathway, diacetyl, organic acids and higher alcohols from branched-chain amino acids can be produced by the yeasts (Yang et al., 2020). Considering traditional sourdough goods, LAB perform a substantial role regarding the production of diversified and complex aroma compounds. As an example, LAB can confer such products with attractive flavors, such as caramel, butter, flower, grease, cheese and fruit, by producing diverse sorts of volatile aroma compounds, which includes organic acid, aldehyde, alcohol, ester and ketone (Suo et al., 2020; Petel et al., 2017; Gänzle & Zheng, 2019). In sourdough, the LAB, in combination with yeasts or alone can increase the content of aroma compounds and also can synthesize the precursors, which can as well be converted into flavor ingredient according to the thermic baking process (Aponte et al., 2014). MATERIALS AND METHODS This study was conducted exploring Web of Science electronic database for recent articles published between 2011 and 2021. Were studied both research articles and reviews. The main search for articles was based on six main keywords, namely: “flavour”, “aroma”, “bread”, “phytic acid”, “sourdough” and “whole-wheat bread”. The next step was to filter the results by relevance. The idea was to highlight the importance of lactic fermentation

61
in improving bread aroma. Most of the selected articles contains in the title the words “flour” or “sourdough”. RESULTS AND DISCUSSIONS Lactic acid bacteria (LAB) represent a heterogeneous cluster of industrially significant germs that are used to fabricate fermented beverages and foods, using diverse substrates, like cocoa beans, cereals, meat, vegetables or milk. The supreme advantage of LAB which is making them appropriate for the use in food biotechnology is that they are Generally Recognized As Safe (GRAS). Due to the production of a large diversity of composites, acting in a synergistic way to avoid or remove microbial contamination, it has been shown that LAB contribute to the development of the shelf life of fermented foods. LAB leads to formation of organoleptic and nutritional specific features of the final products in fermented foods. For the commercial production of many categories of beverages and foods, LAB are used in traditional manner as starter cultures. The concept “functional foods” was lately suggested and has demonstrated an outstanding development over the last few years. This type of foods should support well-being and health improvements, whereas at the same time should decrease the risk of some high degenerative and chronic diseases, such as gastrointestinal tract disorders, obesity, cancer and cardiovascular diseases (Zamfir et al., 2014). It is extremely difficult to stabilize microbiota of a sourdough with industrial appropriate specific features due to microbiota structure of sourdough which is intricate. After research regarding the varied functional characteristics of LAB isolates could conduct to the election of the most efficient single strains and of the optimum performing strain combinations for application as starters for the fabrication of steamed bread or fermented bread (Palla et al., 2017). Recently, have been spotted and isolated a few LAB strains for their role in sourdough fermentation, with Pediococcus pentosaceus and Fructilactobacillus sanfranciscensis having earned attention founded on inoculation tests. On a large scale, P. pentosaceus has been isolated from different geographical regions
sourdoughs and is mainly prevalent in fermented potato dough (Rizzello et al., 2019), the traditional Italian sourdoughs (Reale et al., 2019), various categories of Jiaozi sourdough in China (Liu et al., 2016; Xing et al., 2020; Li et al., 2016) and even in wheat flour (Alfonzo et al., 2017). Taking into acount its capability to decrease the acrylamide content in baking bread (Nachi et al., 2018), also its capability to produce antioxidant exopolysaccharides (Abedfar et al., 2018) and for its antimicrobial and antifungal attributes (Bartkiene et al., 2020), P. pentosaceus in fermentation activity has become high interesting for use in sourdoughs. P. pentosaceus has the ability to ferment glucose to lactic acid, which benefits the fast production of flavor compounds and bioactive materials (Carafa et al., 2015). It was demonstrated that the inoculated P. pentosaceus during faba bean dough fermentation, was increased the dough attributes by decreasing phytic acid production and reducing the oligosaccharide content (Rizzello et al., 2019). If we are making an analogy to commercially purchased starters, bread produced by inoculating P. pentosaceus was shown to have more high organic acid - like volatile aroma compounds and greater sensory attributes (Plessas et al., 2020; Montemurro et al., 2020). Notwithstanding P. pentosaceus is not the optimum genus for bread aroma constitution, based on analogy between different LABs (Siepmann et al., 2019), therefore when the strain was inoculated in the starter, Chinese steamed bread has the higher sensory attribute (Xing et al., 2019). P. pentosaceus was demonstrated to have a beneficial and close connection with the production of volatile aroma compounds, like2-methyl-1-propanol, phenethyl alcohol, isoamyl alcohol, ethyl caprylate and phenylethyl acetate in sourdough fermented steamed bread. (Yan et al., 2019a). When we talk about representative sourdough LAB in the USA, France, United Kindom, Belgium and Italy for making baked bread, we refere to Fl. sanfranciscensis (Comasio et al., 2020; De Vuyst et al., 2014). We can find that this genus was evidenced that in the field of steamed bread making is preponderant in type I Chinese traditional sourdough specimens (Wang et al., 2020), even though there is no proof to express that

62
Fl. sanfranciscensis is corresponding with geographical source, as no region specific strains could be recognized in a study using Multilocus Sequence Typing (MLST) and multiplex-RAPD techniques (Yang et al., 2017). The widespread allocation of Fl. sanfranciscensis in sourdough ecosystems may be due to the fact that it comes originary from insects, as stated in the examinations in which the predominant genus was most often discovered in both sourdough and insect powder food. (Boiocchi et al., 2017). Fl. sanfranciscensis is a ambitious genus in the microbiota over sourdough fermentation, in conformity with a differential analysis research utilising the Clustered Regularly Interspaced Short Palindromic Repeats (CRISPR) - Locus Length Polymorphism PCR (CLLP-PCR), where Fl. sanfranciscensis TMW 1.392 get prevailing after 2 days of sourdough fermentation and remained the only recognized strain in the subsequent sampling session (Rogalski et al., 2020). The competitiveness of Fl. sanfranciscensis could be attenuated by small perturbations of the ecosystem, like the existence of ferulic acid and fluctuations in the sucrose levels of the fermented sourdough (Dinardo et al., 2019). In sourdough, Fl. sanfranciscensis has a high impact at the level of rheological characteristics of dough and bread (steamed) sensory quality, aroma, texture and specific features (Xu et al., 2019a), shelf-life through the medium of the inhibition of fungal growth (Zhang et al., 2019a), the fabrication of exopolysaccharides with characterized antioxidant actions (Zhang et al., 2019b) and gluten attributes (Xu et al., 2018). When inoculating bread with yeast and Fl. sanfranciscensis the intricate structure volatile compounds is higher than intricate structure of bread made with baker’s yeast (Xu et al., 2019b). It was demonstrated that the prevailing of Fl. sanfranciscensis in type I sourdough-based Jiaozi Chinese steamed bread is performing a substantial role in the creation of volatile aroma compounds, like aldehydes, furan and organic acids (Yan et al., 2019b). Recent studies have shown in an analysis of the microbial community dynamics that Fl. sanfranciscensis with a metabolic preference for maltose and a Kazachstania humilis strain unable to use maltose were
predominantly stable microorganisms anywhere in the fabrication of type I sourdough steamed bread made using the process of retarded sponge-dough, which agreed with the formation of ethyl esters of volatile compounds because the accumulation of ethanol and organic acids as the sponge delay time was extended. (Wang et al., 2020). It was shown in an investigation of a gene deletion mutant that Fl. sanfranciscensis collected γ-glutamyl-cysteine and decreased glutathione through the medium of glutathione reductase (GshR) process over proofing, which is salutary to meliorate the texture and taste of type I sourdough bread (Tang et al., 2017). Omics boardings have been on a large scale utilised to realize the sourdough fermentation activity, as transcriptomics has high potential in clarifying the expression of functional genes based on RNA specimens (Weckx et al., 2019). Fl. sanfranciscensis demonstrated improved self-protective actions and carbohydrate metabolism and reduced cell proliferation in sourdough at 12 hours, resulting in an exclusive volatile profile, with no defined compounds in the sourdough, according to a transcriptomic analysis using the process of RNA sequencing process compared to fermented sourdough for 6 hours (Liu et al., 2020). CONCLUSIONS Using LAB in food biotechnology has the main advantage of being recognized as GRAS. Also, when using LAB in fermented food products, especially bread, the organoleptic and nutritional characteristics, as well as rheological characteristics, sensory quality, aroma and texture are improved. Fermentation and baking process influenced also the functional properties of bread by leading to a reformulation of some bioactive compounds. LAB combined with yeast fermentation may increase or retain the content of bioactive compounds present in flour. In combination with yeasts or alone, in sourdough, the LAB can increase the content of aroma compounds. The LAB can synthesize the precursors, which can as well be converted into flavor ingredient according to the baking process. In fermented foods, LAB is important not only because it acidifies and therefore preserves food from

63
deterioration, but also because of their contribution to the organoleptic properties of the fermented food. This is partly due to the production of exopolysaccharides (EPS), which are long-chain polysaccharides composed of a single type (homopolysaccharides - HoPS) or several different monosaccharides (heteropolysaccharides - HePS), released by bacteria in their surroundings. REFERENCES Abedfar A., Hosseininezhad M., Sadeghi A., Raeisi M.,
Feizy J. (2018). Investigation on “spontaneous fermentation” and the productivity of microbial exopolysaccharides by Lactobacillus plantarum and Pediococcus pentosaceus isolated from wheat bran sourdough. LWT-Food Sci Technol 2018, 96:686-693.
Abrama, V., Čeh, B., Vidmar, M., Hercezi, M., Lazić, N., Bucik, V., Ulrih, N. P. (2015). A comparison of antioxidant and antimicrobial activity between hop leaves and hop cones. Industrial Crops and Products, 64, 124-134.
Alfonzo A., Miceli C., Nasca A., Franciosi E., Ventimiglia G., Di Gerlando R., Tuohy K., Francesca N., Moschetti G., Settanni L. (2017). Monitoring of wheat lactic acid bacteria from the field until the first step of dough fermentation. Food Microbiol 2017, 62:256-269.
Aponte M., Boscaino F., Sorrentino A., Coppola R., Masi P., Romano A. (2014). Effects of fermentation and rye flour on microstructure and volatile compounds of chestnut flour based sourdoughs. LWT Food Sci Technol 2014, 58:387-395.
Bartkiene E., Lele V., Ruzauskas M., Domig K. J., Starkute V., Zavistanaviciute P., Bartkevics V., Pugajeva I., Klupsaite D., Juodeikiene G. et al. (2020). Lactic acid bacteria isolation from spontaneous sourdough and their characterization including antimicrobial and antifungal properties evaluation. Microorganisms 2020, 8:64.
Boiocchi F., Porcellato D., Limonta L., Picozzi C., Vigentini I., Locatelli D. P., Foschino R. (2017). Insect frass in stored cereal products as a potential source of Lactobacillus sanfranciscensis for sourdough ecosystem. J Appl Microbiol 2017, 123:944-955.
Carafa I., Nardin T., Larcher R., Viola R., Tuohy K., Franciosi E. (2015). Identification and characterization of wild lactobacilli and pediococci from spontaneously fermented Mountain cheese. Food Microbiol 2015, 48:123-132.
Chavan, R. S., & Chavan, S. R. (2011). Sourdough technology-a traditional way for wholesome foods: A review. Comprehensive Reviews in Food Science and Food Safety, 10(3), 169-182.
Comasio A., Verce M., Van Kerrebroeck S., De Vuyst L. (2020). Diverse microbial composition of sourdoughs from different origins. Front Microbiol 2020, 11:1212.
De Vuyst L., Harth H., Van Kerrebroeck S., Leroy F. (2016). Yeast diversity of sourdoughs and associated metabolic properties and functionalities. Int J Food Microbiology 2016, 239:26-34.
De Vuyst L., Van Kerrebroeck S., Harth H., Huys G., Daniel H. M., Weckx S. (2014). Microbial ecology of sourdough fermentations: diverse or uniform? Food Microbiol 2014, 37:11-29.
Dinardo F. R., Minervini F., De Angelis M., Gobbetti M., Gänzle M. G. (2019). Dynamics of Enterobacteriaceae and lactobacilli in model sourdoughs are driven by pH and concentrations of sucrose and ferulic acid. LWT-Food Sci Technol 2019, 114:108394.
Farahmand, E., Razavi, S. H., Yarmand, M. S., & Morovatpour, M. (2015). Development of Iranian rice-bran sourdough breads: Physicochemical, microbiological and sensorial characterisation during the storage period. Quality Assurance and Safety of Crops & Foods, 7(3), 295-303.
Fu W., Rao H., Tian Y., Xue W. (2020). Bacterial composition in sourdoughs from different regions in China and the microbial potential to reduce wheat allergens. LWT-Food Sci Technol 2020, 117:108669.
Gänzle M.G., Zheng J. (2019). Lifestyles of sourdough lactobacilli - Do they matter for microbial ecology and bread quality? International Journal Food Microbiology, 2019, 302:1523.
Gherghina E., Israel-Roming F., Balan D., Luta G., Simion V., Zachia M. (2015). Assessment of some nutrients in bakery products. Scientific Bulletin. Series F. Biotechnologies, Vol. XIX, ISSN 2285-1364, 140-144.
Gobbetti M., Minervini F., Pontonio E., Di Cagno R., De Angelis M. (2016). Drivers for the establishment and composition of the sourdough lactic acid bacteria biota. Int J Food Microbiol 2016, 239:3-18.
Katina, K., Arendt, E., Liukkonen, K. H., Autio, K., Flander, L., & Poutanen, K. (2005). Potential of sourdough for healthier cereal products. Trends in Food Science & Technology, 16, 104-112.
Li H., Li Z., Qu J., Wang J. (2017). Bacterial diversity in traditional Jiaozi and sourdough revealed by high-throughput sequencing of 16S rRNA amplicons. LWT-Food Sci Technol 2017, 81:319-325.
Li Z., Li H., Bian K. (2016). Microbiological characterization of traditional dough fermentation starter (Jiaozi) for steamed bread making by culture-dependent and culture-independent methods. Int J Food Microbiol 2016, 234:9-14.
Liu T., Li Y., Yang Y., Yi H., Zhang L., He G. (2020). The influence of different lactic acid bacteria on sourdough flavor and a deep insight into sourdough fermentation through RNA sequencing. Food Chem 2020, 307:125529.
Liu T. J., Li Y., Chen J. C., Sadiq F. A., Zhang G. H., Li Y., He G. Q. (2016). Prevalence and diversity of lactic acid bacteria in Chinese traditional sourdough revealed by culture dependent and pyrosequencing approaches. LWT-Food Sci Technol 2016, 68:91-97.
Montemurro M., Celano G., De Angelis M., Gobbetti M., Rizzello C. G., Pontonio E. (2020). Selection of non-Lactobacillus strains to be used as starters for

64
sourdough fermentation. Food Microbiol 2020, 90:103491.
Nachi I., Fhoula I., Smida I., Ben Taher I., Chouaibi M., Jaunbergs J., Bartkevics V., Hassouna M. (2018). Assessment of lactic acid bacteria application for the reduction of acrylamide formation in bread. LWT-Food Sci Technol 2018, 92:435-441.
Nionelli, L., Pontoni, E., Gobbetti, M., & Rizzello, C. G. (2018). Use of hop extract as antifungal ingredient for bread making and selection of autochthonous resistant starters for sourdough fermentation. International Journal of Food Microbiology, 266, 173-182.
Palla M., Cristani C., Giovannetti M., Agnolucci M. (2017). Identification and characterization of lactic acid bacteria and yeasts of PDO Tuscan bread sourdough by culture dependent and independent methods. Int Journal Food Microbiol 2017, 250:19-26.
Petel C., Onno B., Prost C. (2017). Sourdough volatile compounds and their contribution to bread: A review. Trends Food Sci Technol 2017, 59:105-123.
Plessas S., Mantzourani I., Bekatorou A. (2020). Evaluation of Pediococcus pentosaceus SP2 as starter culture on sourdough bread making. Foods 2020, 9:77.
Reale A., Di Renzo T., Boscaino F., Nazzaro F., Fratianni F., Aponte M. (2019). Lactic acid bacteria biota and aroma profile of Italian traditional sourdoughs from the Irpinian area in Italy. Front Microbiol 2019, 10:1621.
Ripari, V., Cecchi, T., & Berardi, E. (2016). Microbiological characterisation and volatiles profile of model, ex-novo, and traditional Italian white wheat sourdoughs. Food Chemistry, 205, 297-307.
Rizzello C. G., Coda R., Wang Y., Verni M., Kajala I., Katina K., Laitila A. (2019). Characterization of indigenous Pediococcus pentosaceus, Leuconostoc kimchii, Weissella cibaria and Weissella confusa for faba bean bioprocessing. Int J Food Microbiol 2019, 302:24-34.
Rogalski E., Vogel R. F., Ehrmann M. A. (2020). Monitoring of Lactobacillus sanfranciscensis strains during wheat and rye sourdough fermentations by CRISPR locus length polymorphism PCR. Int J Food Microbiol 2020, 316:108475.
Saa, D. T., Silvestro, R. D., Dinelli, G., & Gianott, A. (2017). Effect of sourdough fermentation and baking process severity on dietary fibre and phenolic compounds of immature wheat flour bread. LWT - Food Science and Technology, 83, 26-32.
Siepmann F. B., Sousa de Almeida B., Waszczynskyj N., Spier M. R. (2019). Influence of temperature and of starter culture on biochemical characteristics and the aromatic compounds evolution on type II sourdough and wheat bread. LWT-Food Sci Technol 2019, 108:199-206.
Siepmann F.B., Ripari V., Waszczynskyj N., Spier M.R. (2018). Overview of sourdough technology: From production to marketing. Food Bioprocess Technol 2018, 11:242-270
Suo B., Nie W., Wang Y., Ma J., Xing X., Huang Z., Xu C., Li Z., Ai Z. (2020). Microbial diversity of
fermented dough and volatile compounds in steamed bread prepared with traditional Chinese starters. LWT-Food Sci Technol 2020, 126:109350.
Tamba-Berehoiu R., Popa C.N., Vișan L., Popescu S. (2014). Correlations between the quality parameters and the technological parameters of bread processing, important for product marketing. Romanian Biotechnological Letters Vol.19, No 3, 2014.
Tang K. X., Zhao C. J., Gänzle M. G. (2017). Effect of glutathione on the taste and texture of type I sourdough bread. J Agri Food Chem 2017, 65:4321-4328.
Vaccalluzzo A., Pino A., Russo N., De Angelis M., Caggia C., Randazzo C.L. (2020). Food Omics as a new frontier to reveal microbial community and metabolic processes occurring on table olives fermentation. Food Microbiol 2020, 92:103606.
Wang X., Zhu X., Bi Y., Zhao R., Nie Y., Yuan W. (2020). Dynamics of microbial community and changes of metabolites during production of type Ι sourdough steamed bread made by retarded spongedough method. Food Chem 2020, 330:127316.
Wang, X., Yang, L., Yang, X., & Tian, Y. (2014). In vitro and in vivo antioxidant and antimutagenic activities of polyphenols extracted from hops (Humulus lupulus L.). Journal of the Science of Food and Agriculture, 94, 1693-1700.
Weckx S., Van Kerrebroeck S., De Vuyst L. (2019). Omics approaches to understand sourdough fermentation processes. Int J Food Microbiol 2019, 302:90-102.
Weckx S., Van Kerrebroeck S., De Vuyst L. (2019). Omics approaches to understand sourdough fermentation processes. Int J Food Microbiol 2019, 302:90-102.
Xing X., Ma J., Fu Z., Zhao Y., Ai Z., Suo B. (2020). Diversity of bacterial communities in traditional sourdough derived from three terrain conditions (mountain, plain and basin) in Henan Province, China. Food Res Int 2020, 133:109139.
Xing X., Suo B., Yang Y., Li Z., Nie W., Ai Z. (2019). Application of Lactobacillus as adjunct cultures in wheat dough fermentation. J Food Sci 2019, 84:842-847.
Xu D., Tang K., Hu Y., Xu X., Gänzle M. G. (2018). Effect of glutathione dehydrogenase of Lactobacillus sanfranciscensis on gluten properties and bread volume in type I wheat sourdough bread. J Agri Food Chem 2018, 66:9770-9776.
Xu D., Yin Y., Ali B., Zhang Y., Guo L., Xu X. (2019). Isolation of yeast strains from Chinese liquor Daqu and its use in the wheat sourdough bread making. Food Biosci 2019, 31:100443.
Xu D., Zhang Y., Tang K., Hu Y., Xu X., Gänzle M. G. (2019). Effect of mixed cultures of yeast and Lactobacilli on the quality of wheat sourdough bread. Front Microbiol 2019, 10:2113.
Yan B., Sadiq F. A., Cai Y., Fan D., Chen W., Zhang H., Zhao J. (2019). Microbial diversity in traditional type I sourdough and jiaozi and its influence on volatiles in Chinese steamed bread. LWT-Food Sci Technol 2019, 101:764-773.

65
Yan B., Sadiq F. A., Cai Y., Fan D., Zhang H., Zhao J.,
Chen W. (2019). Identification of key aroma compounds in type I sourdough-based Chinese steamed bread: Application of untargeted metabolomics analysisp. Int J Mol Sci 2019, 20:818.
Yang H., Liu T., Zhang G., Chen J., Gu J., Yuan L., He G. (2017). Genotyping of Lactobacillus sanfranciscensis isolates from Chinese traditional sourdoughs by multilocus sequence typing and multiplex RAPD-PCR. Int J Food Microbiol 2017, 258:50-57.
Yang H., Liu T., Zhang G., He G. (2020). Intraspecific diversity and fermentative properties of Saccharomyces cerevisiae from Chinese traditional sourdough. LWT-Food Sci Technol 2020, 124:109195.
Yang L., Fan W.L., Xu Y. (2020). Metaproteomics insights into traditional fermented foods and beverages. Compr Rev Food Sci Food Safety 2020, 19:2506-2529.
Zamfir M., Cornea C. P., De Vuyst L., Grosu Tudor S. S. (2014). Biodiversity and biotechnological potential of lactic acid bacteria. AgroLife Scientific Journal, Volume 3, Number 1, ISSN 2285-5718, 169-176.
Zhang G., Tu J., Sadiq F. A., Zhang W., Wang W. (2019). Prevalence, genetic diversity, and technological functions of the Lactobacillus sanfranciscensis in sourdough: A review. Compr Rev Food Sci Food Safety 2019, 18:1209-1226.
Zhang G., Zhang W., Sun L., Sadiq F. A., Yang Y., Gao J., Sang Y. (2019). Preparation screening, production optimization and characterization of exopolysaccharides produced by Lactobacillus sanfranciscensis Ls-1001 isolated from Chinese traditional sourdough. Int J Biol Macromol 2019, 139:1295-1303.
Zheng J., Wittouck S., Salvetti E., Franz C., Harris H. M. B., Mattarelli P., O'Toole P. W., Pot B., Vandamme P., Walter J. (2020). A taxonomic note on the genus Lactobacillus: Description of 23 novel genera, emended description of the genus Lactobacillus Beijerinck 1901, and union of Lactobacillaceae and Leuconostocaceae. Int J Syst Evol Microbiol 2020, 70:2782-2858.

66
MILK-CLOTTING ENZYMES OBTAINED FROM PLANTS
IN CHEESEMAKING - A REVIEW
Sorin NITU, Mihaela GEICU-CRISTEA, Florentina MATEI
University of Agronomic Sciences and Veterinary Medicine of Bucharest, 59 Mărăşti Blvd,
District 1, Bucharest, Romania
Corresponding author email: [email protected] Abstract The paper aimed to present a review of plant proteases used as milk coagulants in cheesemaking. Plant proteases have been used as milk-clotting enzymes since ancient times. These milk-clotting enzymes are starting to become an alternative to the calf rennet. Due to a high price of the calf rennet and a very limited availability, religious restrictions or lacto-vegetarian diet, milk-clotting enzymes obtained from plants are the subject of extensive research. They are present in a various plants and can be obtained from all plant parts: root, stem, leaves, flowers, fruits, seeds. Most research has shown that plant milk-clotting enzymes belong to aspartic proteases but have been reported also enzymes from serine proteases and cysteine proteases with this activity as well. Plant proteases with milk-clotting activity have been researched in terms of coagulation activity and proteolytic activity. Most plant milk- clotting enzymes develop an excessive proteolytic activity leading to lower yields of cheese, defects of texture and bitter flavours. The research will continue in order to meet the increasing global demand for a good and diversified cheese production. Key words: cheese, milk-clotting activity, plant proteases. INTRODUCTION Milk is a valuable food, but relatively perishable due to its contamination with microorganisms, since milking. Also, milk production is, in many regions of the globe, seasonal, so there are no constant quantities during the year. Methods of preserving milk in various forms and convenient conditions have been discovered and perfectioned. Thus, at present, the milk components are fractionated: the fat is transformed into butter, which can be preserved by freezing, the dry matter in the milk is transformed into powdered milk with variable fat content, which does not require low temperatures. Milk proteins can be separated by precipitation or separation through membranes and preserved by drying in the form of protein concentrates. A most common and historical method of preserving milk is processing in cheese, a more complex process that involves concentrating protein along with a variable fraction of fat and minerals, eliminating a significant amount of water and lactose. The cheeses can be stored for a few weeks to several months. The advantages resulting from the possibility to transform the main components of milk into
cheeses were arguments for the development of this production: storage stability, relatively easy transport and diversification of the human diet. Worldwide, at present, over 35% of the amount of milk obtained on farms is transformed into cheese (Costin, 2003). Cheeses are some of the most complex and dynamic foods. They are results of an applied biotechnology, each piece can be considered a bioreactor in which numerous and complicated reactions take place. Finally, is obtained a product with specific sensory and nutritive characteristics. Cheeses are one of the most valuable sources of protein for the global diet and are an excellent source of nutrients such as fats, minerals and vitamins. They can sometimes have a therapeutic role: patients with reduced gastrointestinal absorption and food allergies are currently treated with casein hydrolysate (milk protein). Casein hydrolysate is a biologically active peptide, which plays an important role in various physiological disorders. Cheeses are dairy products that have played a key role in human nutrition for centuries. Cheese making is essentially a dehydration process, in which milk fat and casein are concentrated 6-10 times (Abebe & Emire,
Scientific Bulletin. Series F. Biotechnologies, Vol. XXV, No. 1, 2021ISSN 2285-1364, CD-ROM ISSN 2285-5521, ISSN Online 2285-1372, ISSN-L 2285-1364

67
2020). From ancient times the animal rennet is used in the manufacture of cheese. Milk coagulation is the main stage for cheese production. Milk-clotting enzymes have been used in cheese making for thousands of years, and they appear to be the oldest known application of enzymes; the earliest indication of cheese making dates back to cave paintings around 5000 BC (Shah et al., 2013). Historically, most enzymatic preparations used for cheese have been extracted from the stomachs of ruminants, but coagulants from microorganisms and plants have also been used at very early dates (Bunty & Nabindra,. 2020). The stomach of the ruminant, especially the calf, is the source of rennet. It contains chymosin (EC 3.4.23.4) as the main enzymatic component and has been widely used in the manufacture of cheeses. Cheese production increased significantly (3.5 times higher than in 1961), but animal rennet production decreased due to the limited availability of herbivore stomachs (Nasr et al., 2017). The animal rennet is obtained on a commercial scale from the stomachs of young ruminants (calves, lambs, kids). A single calf produces only 5 to 10 g of rennet. The enzyme helps to coagulate casein in milk. The property of the enzyme to coagulate milk is important in terms of cheese quality and yield (Mahajan & Chaudhari, 2014). Research has long been focused on the discovery of a milk-clotting enzyme that would satisfactorily replace animal rennet. Various factors, such as the high price of animal rennet, various religious restrictions (e.g. Islam and Judaism), diet (lactovegetarians) or the inter-diction on the use of recombinant calf rennet (in France, Germany and the Netherlands) have encouraged the search for alternatives sources of milk-clotting (Roseiro et al., 2003). Research has been directed towards the discovery of milk-clotting enzymes that would satisfactorily replace calf rennet in cheese making, including microbial, recombinant, and herbal enzymes (Mahajan & Chaudhari, 2014). The most important substitute enzymes that meet the requirements of cheese making include microbial, recombinant enzymes and enzymes that have been isolated from plants. Animal rennet is a complex of enzymes produced in the stomach of any mammal,
including milk-clotting proteases that coagulate milk; belonging to the coagulation process, it produces the separation into a solid part (curd) and a liquid part (whey). The presence of these enzymes is very important in the stomachs of young mammals for digesting the breast milk with which they are breastfed. The main active enzyme in the rennet is chymosin or rennin (EC 3.4.23.4, according with International Union of Biochemistry Enzyme Commission IUB or EC), along with pepsin and lipase. The natural calf rennet is extracted from the inner mucosa of the fourth chamber of the stomach of young, unweaned calves. The rennet extracted from the old calves, fed with grass or cereals, contains less chymosin or not at all, but more pepsin. This rennet can only be used for some special types of milk and cheese. Each ruminant species produces a special type of rennet to digest the milk of its own species, so there is, for example, a goat's rennet for milk-clotting of goat's milk or a lamb's rennet for milk-clotting of sheep's milk. There are many alternative sources of milk- clotting enzymes, from plants and microorganisms, that can replace animal rennet. Fermentation produced chymosin (FPC), by applying genetic engineering tools on the microbial organism, is mainly used in the manufacture of cheese in North America and Europe because it is cheaper and has a better quality than animal rennet. Enzymes produced by microorganisms are suitable as milk-clotting substitutes but there has been a lot of interest in coagulation enzymes extracted from plants. These enzymes are present in almost all types of plant tissues and it appears that all proteolytic enzymes have the ability to coagulate milk under appropriate conditions. Almost all enzymes used to coagulate milk belong to aspartic proteases but enzymes from other groups such as cysteine and serine proteases are also used. Plant extracts have been used since ancient times to coagulate milk to make cheese, especially in Mediterranean countries, West Africa and Southern Europe. Thus, Homer suggested in the Iliad and the Odyssey that the Greeks clotted milk with a fig extract (Ben Amira et al., 2017). Milk-clotting plant proteases have become a subject of growing interest in cheese industry,

68
due to their easy availability and simple purification processes. The use of plant proteases in cheese production promotes the greater acceptability by the vegetarians and may improve their nutritional intake (Ben Amira et al, 2017). The presentation of enzymatic and technological properties of milk-clotting plant proteases, previously studied in literature, could provide a clear vision on key elements for the selection of appropriate plant rennet. Evaluation of enzymatic activities is the main step in the selection of an appropriate substitute of calf rennet which can be successfully used in cheese making. It is achieved by monitoring of Milk-Clotting Activity (MCA) and Proteolytic Activity (PA). Milk-Clotting Activity (MCA) is the most important property of enzymes used in cheese making. It is the ability of the enzyme to specifically hydrolyse of κ-casein. It can be measured by different methods, such as Soxhlet, Berridge and the units used are Soxhlet, Berridge or Rennet Units and International Milk-Clotting Units (IMCU). Proteolytic activity (PA) expresses the degree of proteolysis of the enzyme. High proteolytic activity leads to excessive cheese maturation, with advanced hydrolysis of protein chains and formation of nonspecific bitter-tasting peptides. The MCA/PA ratio is the one that best characterizes a commercially coagulating enzyme: the higher it is, the better the enzyme coagulates the milk, without advanced proteolysis during maturation. Considering that the researches regarding the use of plant proteases as a substitute for animal rennet, carried out so far in Romania, are in the incipient phase, of pioneering, the present review aims to summarize the latest research findings on plant proteases with milk-clotting activity presenting enzyme chemistry, production and techno-functional properties. MILK COAGULATION - THE MAIN STAGE OF CHEESE MAKING The general process of milk coagulation (clotting) into dairy products, such as cheeses and fermented dairy products (yoghurt) is
based on the formation of an aggregate protein network, which consists mainly of a certain group of proteins known as caseins. This network includes water, fat and other constituents of milk. Biochemical processes are quite different between cheese and fermented dairy products, as the production of cheeses involves the separation of whey by casein, while in fermented dairy products the entire composition of milk is included in the final product. Milk coagulation (clotting) in cheese making is of several types, depending on the main agent involved in the biochemical process: enzymatic coagulation, acid coagulation, mixed (enzymatic and acid) coagulation. Enzymatic coagulation of milk Mechanism: the biocatalytic action of coagulating enzymes on casein, leads to the formation of "clot" gel. Enzymatic coagulation of milk represents the modification of casein micelles by limited hydrolysis of casein under the action of milk-clotting enzymes, followed by a network aggregation of micelles induced by the presence of calcium ions (Fox et al., 2004). The first commercial rennet was prepared, standardized and sold by Chr. Hansen A/S, Denmark in 1874, and was probably the first commercial enzyme of any kind, world-wide used (https://www.chr-hansen.com). Animal rennet is, by definition, an extract of ruminant abomasum, ideally containing mainly chymosin, the enzyme that is specific for the hydrolysis of κ-casein and the destabilization of casein. However, depending on the age of the calves from which it is extracted, the rennet may contain pepsin, which is an acidic protease with a wider range of action on the casein substrate. Both chymosin and pepsin, and indeed all milk- clotting enzymes used in cheese technology, are classified as aspartic proteinases with Enzyme Commission number (EC) 3.4.23. Because there are now several different types and sources of milk-clotting enzymes on the market, the International Dairy Federation (IDF) officially defines that the name "rennet" is reserved for ruminant stomach enzyme preparations, and other types of milk- clotting

69
enzymes (especially microbial ones) should be called 'coagulants'. For cheese technology, rennets and coagulants are usefully classified, according to their source, as animal, vegetal, microbial and GMO sources. Chymosin is the most important and active milk-clotting enzyme, involved in cleaving the Phe105-Met106 peptide bond from κ-CN. Coagulation of milk induced by chymosin can be described in three phases: 1. During the primary phase, the enzymatic hydrolysis of κ-CN takes place as follows: Chymosin κ-CASEINE (- Phe105 - Met106 -) para-κ-CASEINE + CMP
The hydrophilic CMP (Casein Macro Peptide) portion is released into the whey. This causes the loss of a negatively charged group and the decrease of steric stabilization. When approxi-mately 70% of k-CN is hydrolysed (Walstra et al., 2006), the colloidal stability of the micelles is low enough to begin the second phase: 2. Spontaneous secondary aggregation phase - gel formation as molecular chains that connect through hydrophobic calcium bonds to form a three-dimensional network, followed by a subsequent solidification. 3. In the third phase, the whey is expelled from casein by syneresis (more cross-linking contraction). Coagulation is improved by lowering the pH, increasing the calcium concentration and temperature (without aggregation below 20°C). Syneresis is increased by increasing temperature, pH and pressure applied, e.g. stirring (Walstra et al., 2006). Acid coagulation of milk Mechanism: selected cultures of lactic acid bacteria ferment lactose from milk and turn it into lactic acid; by lowering the pH to the isoelectric pH of casein, it precipitates and forms a "lactic" gel. Upon acid coagulation of milk, the micellar casein is modified by the low pH of milk. This causes the colloidal calcium phosphate (CCP) to dissociate from the micelles, the negative charges in the casein micelles being neutralized, with aggregation occurring at the
isoelectric point of the micellar casein (pH 4.6). A porous network of weakly bound aggregates is formed. Moreover, the concentration of proteins in the gel network will be increased due to the active participation of denatured whey proteins in the formation of the structure. In the case of the mixed coagulation of milk the mechanism undertakes a symbiosis between the two previous procedures. MILK-CLOTTING PLANT PROTEASES - A GENERAL DESCRIPTION, TYPES AND SOURCES Proteases are enzymes that perform proteolysis, initiating protein catabolism by hydrolysis of the peptide bonds between the amino acids in the structure of the polypeptide chain that make up the protein. Over time, they have evolved several times so that the same reaction can be performed by different classes of proteases by completely different catalytic mechanisms. Proteases are found in all organisms, from prokaryotes to eukaryotes and viruses. These enzymes are multifunctional, having many physiological functions in plants and animals. They are involved in various physiological reactions from the simple digestion of proteins in food to extremely well-regulated cascade reactions such as blood clotting or apoptosis. They also act in germination, biological aging, inflammatory processes, etc. Proteases act either by completely breaking down of peptide into amino acids (unlimited proteolysis) or by breaking down specific peptide bonds (limited proteolysis) depending on the amino acid sequence that makes up the protein. The activity can be a destructive change such as suppressing the function of a protein or digesting the protein to amino acids or it can be an activation of a function, respectively a signal in a signalling pathway. Proteases are classified, according to the catalytic residue, in the following groups: serine proteases, threonine proteases, cysteine proteases, aspartic proteases, glutamic acid proteases and metalloproteases. Plant proteases used as milk-clotting enzymes were reported only in aspartic, cysteine and serine proteases.
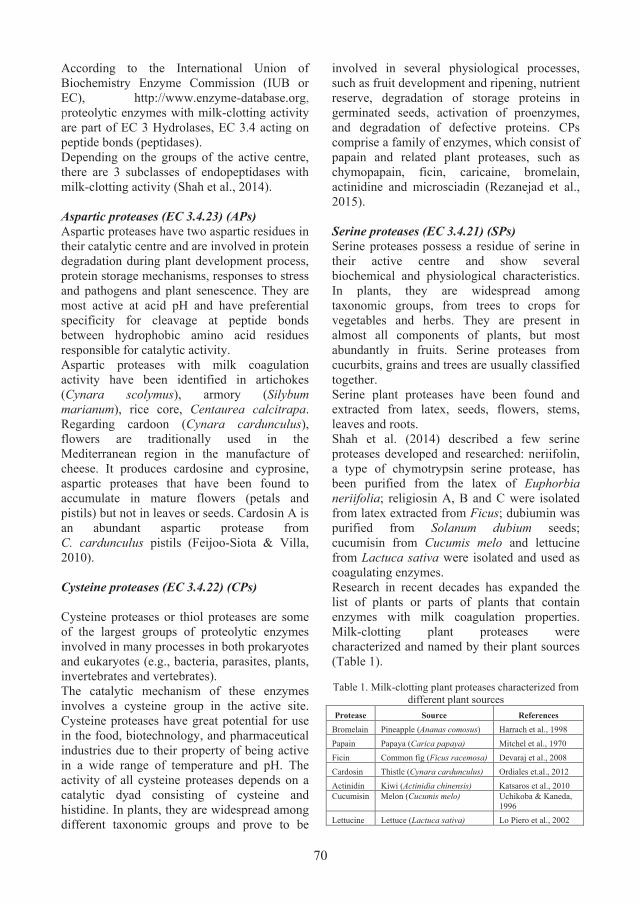
70
According to the International Union of Biochemistry Enzyme Commission (IUB or EC), http://www.enzyme-database.org, proteolytic enzymes with milk-clotting activity are part of EC 3 Hydrolases, EC 3.4 acting on peptide bonds (peptidases). Depending on the groups of the active centre, there are 3 subclasses of endopeptidases with milk-clotting activity (Shah et al., 2014). Aspartic proteases (EC 3.4.23) (APs) Aspartic proteases have two aspartic residues in their catalytic centre and are involved in protein degradation during plant development process, protein storage mechanisms, responses to stress and pathogens and plant senescence. They are most active at acid pH and have preferential specificity for cleavage at peptide bonds between hydrophobic amino acid residues responsible for catalytic activity. Aspartic proteases with milk coagulation activity have been identified in artichokes (Cynara scolymus), armory (Silybum marianum), rice core, Centaurea calcitrapa. Regarding cardoon (Cynara cardunculus), flowers are traditionally used in the Mediterranean region in the manufacture of cheese. It produces cardosine and cyprosine, aspartic proteases that have been found to accumulate in mature flowers (petals and pistils) but not in leaves or seeds. Cardosin A is an abundant aspartic protease from C. cardunculus pistils (Feijoo-Siota & Villa, 2010). Cysteine proteases (EC 3.4.22) (CPs) Cysteine proteases or thiol proteases are some of the largest groups of proteolytic enzymes involved in many processes in both prokaryotes and eukaryotes (e.g., bacteria, parasites, plants, invertebrates and vertebrates). The catalytic mechanism of these enzymes involves a cysteine group in the active site. Cysteine proteases have great potential for use in the food, biotechnology, and pharmaceutical industries due to their property of being active in a wide range of temperature and pH. The activity of all cysteine proteases depends on a catalytic dyad consisting of cysteine and histidine. In plants, they are widespread among different taxonomic groups and prove to be
involved in several physiological processes, such as fruit development and ripening, nutrient reserve, degradation of storage proteins in germinated seeds, activation of proenzymes, and degradation of defective proteins. CPs comprise a family of enzymes, which consist of papain and related plant proteases, such as chymopapain, ficin, caricaine, bromelain, actinidine and microsciadin (Rezanejad et al., 2015). Serine proteases (EC 3.4.21) (SPs) Serine proteases possess a residue of serine in their active centre and show several biochemical and physiological characteristics. In plants, they are widespread among taxonomic groups, from trees to crops for vegetables and herbs. They are present in almost all components of plants, but most abundantly in fruits. Serine proteases from cucurbits, grains and trees are usually classified together. Serine plant proteases have been found and extracted from latex, seeds, flowers, stems, leaves and roots. Shah et al. (2014) described a few serine proteases developed and researched: neriifolin, a type of chymotrypsin serine protease, has been purified from the latex of Euphorbia neriifolia; religiosin A, B and C were isolated from latex extracted from Ficus; dubiumin was purified from Solanum dubium seeds; cucumisin from Cucumis melo and lettucine from Lactuca sativa were isolated and used as coagulating enzymes. Research in recent decades has expanded the list of plants or parts of plants that contain enzymes with milk coagulation properties. Milk-clotting plant proteases were characterized and named by their plant sources (Table 1).
Table 1. Milk-clotting plant proteases characterized from
different plant sources Protease Source References
Bromelain Pineapple (Ananas comosus) Harrach et al., 1998 Papain Papaya (Carica papaya) Mitchel et al., 1970 Ficin Common fig (Ficus racemosa) Devaraj et al., 2008 Cardosin Thistle (Cynara cardunculus) Ordiales et.al., 2012 Actinidin Kiwi (Actinidia chinensis) Katsaros et al., 2010 Cucumisin Melon (Cucumis melo) Uchikoba & Kaneda,
1996 Lettucine Lettuce (Lactuca sativa) Lo Piero et al., 2002

71
ISOLATION AND EVALUATION OF ENZYMATIC ACTIVITY OF MILK-CLOTTING PLANT PROTEASES Obtaining enzymatic preparations - theoretical considerations regarding the extraction of enzymes In order to study the structural and / or bioche-mical properties of an enzyme, the source that best meets the isolation requirements and that meets, as far as possible, the following condi-tions must be chosen: maximum catalytic activity - the enzyme present should not be degraded or inactivated; maximum possible purity - it must not contain other large enzymes or molecules; maximum possible yield - resul-ting from the percentage of activity recovered compared to the activity of the original extract, if the purification of the enzyme is also followed. In the strategy of choosing a biological material for the extraction of an enzyme usable for different purposes or for its study is necessary to consider several factors such as: enzyme abundance, because for any study, experiment or application it is necessary to obtain total protein extracts with high concentrations of the enzyme of interest, biological sources rich in the desired enzyme must be chosen; availability and cost price: the biological source must be accessible both geographically and economically; intracellular localization: of an enzyme is essential to know in order to establish the most convenient method of extraction; source characterization: the chosen source must be perfectly characterized; when the chosen source are plants, it is necessary to know them genus, species and variety. It is often necessary to know the area, the climate in which the plant source developed as well as the harvesting period; comparative studies. Some enzymes have been studied in some species or in different tissues of some species. In such cases it is very important to study the respective enzymes in different other species or tissues in order to evaluate the evolution of the enzyme, its properties compared to similar ones, primary, tertiary structure, different isoenzymes, etc. The stability of the enzyme and the possible difficulties in handling the
source must be considered in all the stages of choosing the source. Certain intracellular enzymes are used commercially without isolation and purification, but most commercial enzymes are produced extracellularly by microorganisms or plants or must be released from cells in solution and subsequently processed (Figure 1). Solid/liquid separation is generally required for the initial separation of cell mass, removal of cell debris after cell rupture, and collection of precipitates. This can be done by filtration, centrifugation or aqueous biphasic partition. In general, filtration or partitioning of aqueous biphasic systems is used to remove unwanted cells or cell debris while centrifugation is the preferred method for collecting the required solid material.
Figure 1. Flow diagram of enzyme preparation
(Chaplin & Bucke, 1990) Evaluation of milk-clotting plant proteases - an important step in validation as a rennet substitute Experimental research to identify plant proteases with milk-clotting activity can be conducted in a variety of ways but must consider the principles described in the previous paragraph.
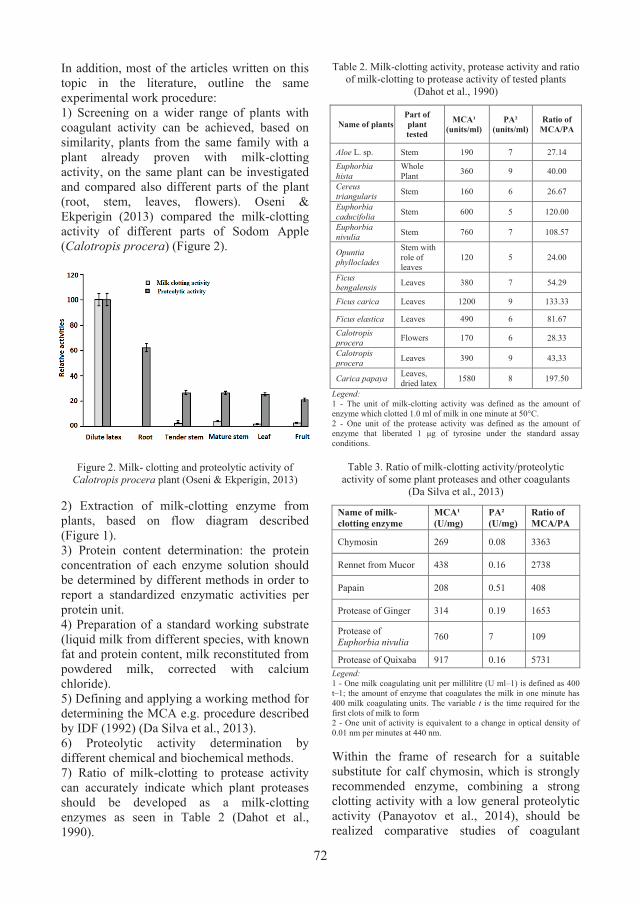
72
In addition, most of the articles written on this topic in the literature, outline the same experimental work procedure: 1) Screening on a wider range of plants with coagulant activity can be achieved, based on similarity, plants from the same family with a plant already proven with milk-clotting activity, on the same plant can be investigated and compared also different parts of the plant (root, stem, leaves, flowers). Oseni & Ekperigin (2013) compared the milk-clotting activity of different parts of Sodom Apple (Calotropis procera) (Figure 2).
Figure 2. Milk- clotting and proteolytic activity of Calotropis procera plant (Oseni & Ekperigin, 2013)
2) Extraction of milk-clotting enzyme from plants, based on flow diagram described (Figure 1). 3) Protein content determination: the protein concentration of each enzyme solution should be determined by different methods in order to report a standardized enzymatic activities per protein unit. 4) Preparation of a standard working substrate (liquid milk from different species, with known fat and protein content, milk reconstituted from powdered milk, corrected with calcium chloride). 5) Defining and applying a working method for determining the MCA e.g. procedure described by IDF (1992) (Da Silva et al., 2013). 6) Proteolytic activity determination by different chemical and biochemical methods. 7) Ratio of milk-clotting to protease activity can accurately indicate which plant proteases should be developed as a milk-clotting enzymes as seen in Table 2 (Dahot et al., 1990).
Table 2. Milk-clotting activity, protease activity and ratio of milk-clotting to protease activity of tested plants
(Dahot et al., 1990)
Legend: 1 - The unit of milk-clotting activity was defined as the amount of enzyme which clotted 1.0 ml of milk in one minute at 50°C. 2 - One unit of the protease activity was defined as the amount of enzyme that liberated 1 μg of tyrosine under the standard assay conditions.
Table 3. Ratio of milk-clotting activity/proteolytic activity of some plant proteases and other coagulants
(Da Silva et al., 2013)
Name of milk- clotting enzyme
MCA¹ (U/mg)
PA² (U/mg)
Ratio of MCA/PA
Chymosin 269 0.08 3363
Rennet from Mucor 438 0.16 2738
Papain 208 0.51 408
Protease of Ginger 314 0.19 1653
Protease of Euphorbia nivulia 760 7 109
Protease of Quixaba 917 0.16 5731 Legend: 1 - One milk coagulating unit per millilitre (U ml–1) is defined as 400 t–1; the amount of enzyme that coagulates the milk in one minute has 400 milk coagulating units. The variable t is the time required for the first clots of milk to form 2 - One unit of activity is equivalent to a change in optical density of 0.01 nm per minutes at 440 nm. Within the frame of research for a suitable substitute for calf chymosin, which is strongly recommended enzyme, combining a strong clotting activity with a low general proteolytic activity (Panayotov et al., 2014), should be realized comparative studies of coagulant
Name of plants Part of plant tested
MCA¹ (units/ml)
PA² (units/ml)
Ratio of MCA/PA
Aloe L. sp. Stem 190 7 27.14 Euphorbia hista
Whole Plant 360 9 40.00
Cereus triangularis Stem 160 6 26.67
Euphorbia caducifolia Stem 600 5 120.00
Euphorbia nivulia Stem 760 7 108.57
Opuntia phylloclades
Stem with role of leaves
120 5 24.00
Ficus bengalensis Leaves 380 7 54.29
Ficus carica Leaves 1200 9 133.33
Ficus elastica Leaves 490 6 81.67 Calotropis procera Flowers 170 6 28.33
Calotropis procera Leaves 390 9 43,33
Carica papaya Leaves, dried latex 1580 8 197.50
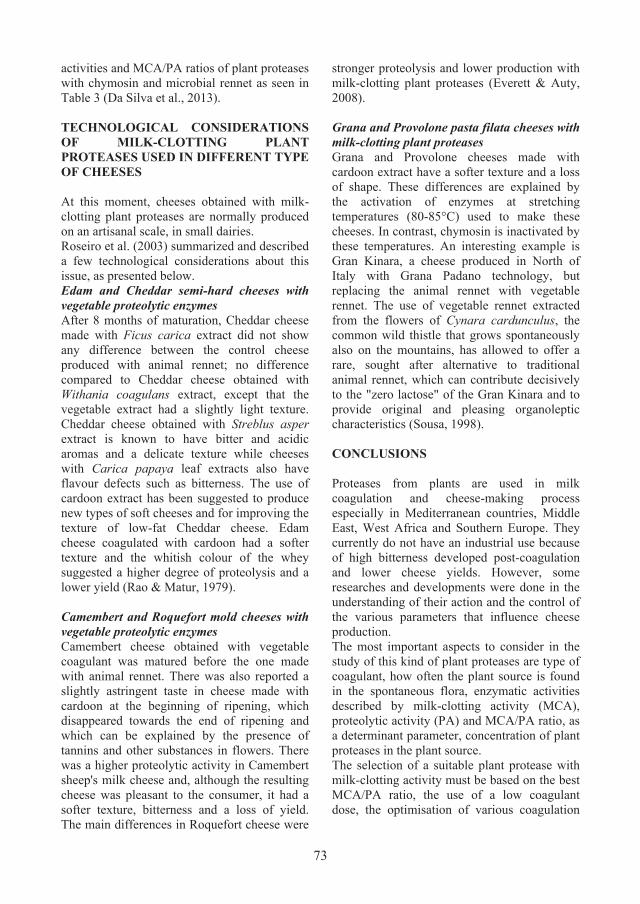
73
activities and MCA/PA ratios of plant proteases with chymosin and microbial rennet as seen in Table 3 (Da Silva et al., 2013). TECHNOLOGICAL CONSIDERATIONS OF MILK-CLOTTING PLANT PROTEASES USED IN DIFFERENT TYPE OF CHEESES At this moment, cheeses obtained with milk-clotting plant proteases are normally produced on an artisanal scale, in small dairies. Roseiro et al. (2003) summarized and described a few technological considerations about this issue, as presented below. Edam and Cheddar semi-hard cheeses with vegetable proteolytic enzymes After 8 months of maturation, Cheddar cheese made with Ficus carica extract did not show any difference between the control cheese produced with animal rennet; no difference compared to Cheddar cheese obtained with Withania coagulans extract, except that the vegetable extract had a slightly light texture. Cheddar cheese obtained with Streblus asper extract is known to have bitter and acidic aromas and a delicate texture while cheeses with Carica papaya leaf extracts also have flavour defects such as bitterness. The use of cardoon extract has been suggested to produce new types of soft cheeses and for improving the texture of low-fat Cheddar cheese. Edam cheese coagulated with cardoon had a softer texture and the whitish colour of the whey suggested a higher degree of proteolysis and a lower yield (Rao & Matur, 1979).
Camembert and Roquefort mold cheeses with vegetable proteolytic enzymes Camembert cheese obtained with vegetable coagulant was matured before the one made with animal rennet. There was also reported a slightly astringent taste in cheese made with cardoon at the beginning of ripening, which disappeared towards the end of ripening and which can be explained by the presence of tannins and other substances in flowers. There was a higher proteolytic activity in Camembert sheep's milk cheese and, although the resulting cheese was pleasant to the consumer, it had a softer texture, bitterness and a loss of yield. The main differences in Roquefort cheese were
stronger proteolysis and lower production with milk-clotting plant proteases (Everett & Auty, 2008). Grana and Provolone pasta filata cheeses with milk-clotting plant proteases Grana and Provolone cheeses made with cardoon extract have a softer texture and a loss of shape. These differences are explained by the activation of enzymes at stretching temperatures (80-85°C) used to make these cheeses. In contrast, chymosin is inactivated by these temperatures. An interesting example is Gran Kinara, a cheese produced in North of Italy with Grana Padano technology, but replacing the animal rennet with vegetable rennet. The use of vegetable rennet extracted from the flowers of Cynara cardunculus, the common wild thistle that grows spontaneously also on the mountains, has allowed to offer a rare, sought after alternative to traditional animal rennet, which can contribute decisively to the "zero lactose" of the Gran Kinara and to provide original and pleasing organoleptic characteristics (Sousa, 1998). CONCLUSIONS Proteases from plants are used in milk coagulation and cheese-making process especially in Mediterranean countries, Middle East, West Africa and Southern Europe. They currently do not have an industrial use because of high bitterness developed post-coagulation and lower cheese yields. However, some researches and developments were done in the understanding of their action and the control of the various parameters that influence cheese production. The most important aspects to consider in the study of this kind of plant proteases are type of coagulant, how often the plant source is found in the spontaneous flora, enzymatic activities described by milk-clotting activity (MCA), proteolytic activity (PA) and MCA/PA ratio, as a determinant parameter, concentration of plant proteases in the plant source. The selection of a suitable plant protease with milk-clotting activity must be based on the best MCA/PA ratio, the use of a low coagulant dose, the optimisation of various coagulation

74
parameters keeping under control of ripening step. Plant proteases with milk-clotting activity have been developed to produce cheeses similar to those made with commercial rennet. The continuous improvements made to counter their proteolytic activity should be based on a good selection of the type of milk for specific cheese variety made with these coagulants, the use of different lactic bacteria cultures which can inhibit the proteolysis. Good results have been observed for certain types of cheeses from Mediterranean countries as Spain and Portugal, but an industrial scale remains marginal. Further studies for identification and characterization of the purified plant milk-clotting enzyme would be interesting to start on large scale also in Romania. Future researches have to start on plants from the spontaneous Romanian flora belonging to the same families as those already studied in other countries or which are already known with proteolytic enzymatic activity. The establishment of efficient formulations of plant milk-clotting enzyme able to replace animal rennet will also be of considerable importance for future uses on an industrial-scale for cheese production. REFERENCES Abebe, B., Emire, S. (2020). Manufacture of fresh
cheese using east African Calotropis procera leaves extract crude enzyme as milk coagulant, Food Sci Nutr., 8:4831–4842.
Ben Amira, A., Besbes, S., Attia, H., Blecker, C. (2017). Milk-clotting properties of plant rennets and their enzymatic, rheological, and sensory role in cheese making: A review, International Journal of Food Properties, VOL. 20, NO. S1, S76–S93.
Bunty, M., & Nabindra, K. S. (2020). Optimization of Crude Papaya (Carica papaya) Protease in Soft-Unripened Cheese Preparation, J. Food Sci. Technol. Nepal, Vol. 12 (1 - 8), 1816‒0727.
Chaplin, M., & Bucke, C. (1990). Enzyme Technology, Cambridge University Pressalirezae.
Costin, G. M., (2003). Știința și ingineria fabricării brânzeturilor, Editura Academica, Galați.
Dahot, M. U., Khan, M. Y., Memon, A. N. (1990). Screening of some Pakistani plants for milk clotting activity, Journal of Islamic Academy of Sciences 3:4, 284‒286.
Da Silva, A. C., Nascimento, T. C. E. S., Da Silva, S. A., Herculano, P. N., Moreira, K. A. (2013). Potential of quixaba (Sideroxylon obtusifolium) latex as a milk-
clotting agent, Food Sci. Technol, Campinas, 33(3): 494‒499.
Devaraj, K. B., Gowda, L. R., Prakash, V. (2008). An unusual thermostable aspartic protease from the latex of Ficus racemosa (L.). Phytochem 69:647–655.
Everett, D.W., & Auty, M.A.E. (2008). Cheese structure and current methods of analysis, International Dairy Journal 18(7):759‒773.
Feijoo-Siota, L., Villa, T. G. (2010). Native and Biotechnologically Engineered Plant Proteases with Industrial Applications, Food Bioprocess Technol. DOI 10.1007/s11947-010-0431-4.
Fox, P. F., McSweeney, P. L., Cogan, T. M. and Guinee, T. P. (2004). Cheese: Chemistry, Physics and Microbiology: General Aspects. (Vol. 1). Academic Press.
Harrach, T., Eckert, K., Maurer, H. R., Machleidt, I., Machleidt, W., Nuck, R. (1998). Isolation and characterization of two forms of an acidic bromelain stem proteinase. Journal of Protein Chemistry, 17(4), 351–361.
http://www.enzyme-database.org Katsaros, G. I., Tavantzis, G., Taoukis, P. S. (2010).
Production of novel dairy products using actinidin and high pressure as enzyme activity regulator. Innov Food Sci Emerg Technol, 11:47–51.
Lo Piero, A. R., Puglisi, I., Petrone, G. (2002). Characterization of “lettucine”, a serine-like protease from Lactuca sativa leaves, as a novel enzyme for milk clotting. J Agric Food Chem, 50:2439–2443.
Mahajan, R. T., & Chaudhari, G. M. (2014). Plant latex as vegetable source for milk clotting enzymes and their use in cheese preparation, International Journal of Advanced Research, Volume 2, Issue 5, 1173‒1181.
Mitchel, R. E. J., Chaiken, I. M., Smith, E. (1970). The complete amino acid sequence of papain. Additions and corrections. The Journal of Biological Chemistry, 245(14), 3485–3492.
Nasr, A. I. A. M., Ahmed, I. A. M., Hamid, O. I. A. (2017). Characterization of partially purified milk-clotting enzyme from sunflower (Helianthus annuus) seeds, Food Science & Nutrition published by Wiley Periodicals, Inc.
Ordiales, E., Martín, A., Benito, M. J., Hernández, A., Ruiz-Moyano, S., Cόrdoba, M. G (2012). Technological characterisation by free zone capillary electrophoresis (FZCE) of the vegetable rennet (Cynara cardunculus) used in “Torta del Casar” cheese-making. Food Chem 133:227–235
Oseni, O. A., Ekperigin, M. M. (2013). Partial characterization of proteolytic and milk clotting enzymes in Sodom Apple Calotropis procera (Ait.) R.Br. (Asclepiadaceae) Plant, American Journal of Biochemistry and Molecular Biology, 3(2): 256‒263.
Panayotov, P., Yoanidou, K., Boyanova, P., Milenkov, B., Danov, K. (2014). Study of the efficiency of the method used for determination of the strain of displacement of rennet gel obtained by various milk clotting enzymes, Scientific Bulletin. Series F. Biotechnologies, Vol. XVIII, 119‒123.
Rao, K. L., & Mathur, D. K. (1979). Assessment of Purified Bacterial Milk Clotting Enzyme from

75
Bacillus subtilis K-26 for Cheddar Cheese Making. Journal of Dairy Science, 62(3): 378‒383.
Rezanejad, H., Karbalaei-Heidari, H. R., Rezaei, S. and Yousefi R. (2015). Microsciadin, a New Milk-Clotting Cysteine Protease from an Endemic Species, Euphorbia microsciadi, Biomacromol. J, Vol. 1, No. 1, 93‒103.
Roseiro, L. B., Barbosa, M., Ames, J. M. and Wilbey, R. A. (2003). Cheesemaking with vegetable coagulants - the use of Cynara L. for the production of ovine milk cheeses. International Journal of Dairy Technology, 56(2): 76‒85.
Shah, M. A., Mir, S. A., Paray, M. A. (2014). Plant proteases as milk-clotting enzymes in cheesemaking: a review, Dairy Sci. & Technol. 94:5–16
Sousa, M. J. C. F. (1998). Characterization of the proteolytic action of the flowers of Cynara cardunculus in ovine, caprine and bovine Role of plant coagulant proteases cheeses. Ph.D. thesis, Escola Superior de Biotecnologia, Porto, Portugal.
Uchikoba, T., & Kaneda, M. (1996). Milk-clotting activity of cucumisin, a plant serine protease from melon fruit.
Appl Biochem Biotechnol, 56:325–330. Walstra, P., Wouters, J. T. M., Geurts, T. J. (2006).
Dairy Science and Technology, Taylor & Francis Group, LLC

76
GLUTEN-FREE PRODUCTS AND POSSIBILITIES OF NEW FORMULATION FOR IMPROVING TEXTURAL AND NUTRITIONAL
CHARACTERISTICS - REVIEW
Elena-Claudia STOICAN1, 2, Claudia-Elena MOȘOIU1, Florentina ISRAEL-ROMING2
1National Institute of Research & Development for Food Bioresources - IBA Bucharest, 6 Dinu Vintila Str., 021102, District 2, Bucharest, România
2University of Agronomic Sciences and Veterinary Medicine of Bucharest, 59 Mărăşti Blvd, District 1, Bucharest, Romania
Corresponding author email: [email protected]
Abstract Because 1-2% of the population suffers from celiac disease and the number increased in the last 20 years, the food industry needs to develop gluten-free products that can be consumed by people with celiac disease. The negative aspect of these products is that they are rich in carbohydrates and deficient in nutrients such as protein, dietary fiber, vitamin B, vitamin D, folate, iron, calcium, copper, zinc, magnesium. The purpose of this paper is to assess from nutritional and textural point of view gluten-free products such as gluten-free bread, gluten-free cookies/biscuits, gluten-free muffins, gluten-free pasta, gluten-free waffles and wafer. For improving nutritional characteristics, gluten-free ingredients rich in nutrients such as rice, buckwheat, quinoa, amaranth, sorghum, oats, corn, teff, inulin, wheat starch, potato starch, milk and soy protein, legumes, chia and flax seeds, microalgae, psyllium, walnuts and almonds are described. For improving textural characteristics, the role of enzymes, microorganisms and hydrocolloids is considered. Possibilities of new formulation for these gluten-free products have been exemplified. For this review, 69 scientific articles from the Science Direct database were studied. Key words: celiac disease, gluten, gluten-free diet, ingredients, products. INTRODUCTION People suffering from celiac disease have to consume gluten-free products (Yılmaz & Koca, 2020), but these products are also preferred by healthy people (Sarabhai et al., 2020) influen-ced by celebrities who use the gluten-free diet as a way to be fit (Xhakollari et al., 2019) and for health benefits to avoid the risk of gastrointestinal diseases (Gobbetti et al., 2018) and to have benefits on digestive health, weight loss and clearer skin (Arslain et al., 2021). Globally, 1-2% of the population suffers from celiac disease (Xhakollari et al., 2019), but the number had constantly increased over time (Xu et al., 2020; Drabinska et al., 2016) in the last 20 years (Jagelaviciute & Cizeikiene, 2020). This resulted in a rapid expansion of the market segment and the specialized companies will be interested to make gluten-free products (Xhakollari et al., 2019). A big challenge for the bakery companies is to obtain gluten-free bread similar to wheat bread
(Zorzi et al., 2020; Gobbetti et al., 2018), with the same flavor and texture (Drabinska et al., 2016). For the formulation of gluten-free products, raw materials have to improve sensory and nutritional characteristics. The aim of this paper is to assess information about the gluten-free diet, gluten-free ingredients and products and the possibilities of new formulation that can be used to improve textural and nutritional characteristics. MATERIALS AND METHODS The materials used are represented by scientific publications from around the world. The methods used are in according with the paper purpose, respectively: to assess from nutritional and textural point of view gluten-free products such as gluten-free bread, gluten-free cookies/biscuits, gluten-free muffins, gluten-free pasta, gluten-free waffles and wafer.
Scientific Bulletin. Series F. Biotechnologies, Vol. XXV, No. 1, 2021ISSN 2285-1364, CD-ROM ISSN 2285-5521, ISSN Online 2285-1372, ISSN-L 2285-1364

77
RESULTS AND DISCUSSIONS CELIAC DISEASE AND ITS IMPLICATIONS Celiac disease is a chronic autoimmune disease characterized by villous atrophy of the small intestine (Atsawarungruangkit et al., 2020; Mohammadi et al., 2014), determined by gluten ingestion (Caio et al., 2020) with a permanent intolerance (De Arcangelis et al., 2020). Gluten is the main structural protein from some cereals, it has a high proline content and resistance in gastrointestinal tract to proteolytic degradation because the specific enzymes do not have post-proline cleavage activity (Olojede et al., 2020). The protein fractions are gliadin and glutenin (Arendt & Dal Bello, 2008). Gliadin influences the viscosity and glutenin influences the elasticity (Drabinska et al., 2016), therefore gluten is defined as a viscoelastic mass (Nutter et al., 2017). The absence of gluten affects the mechanical properties of the dough processing (Moreira et al., 2013). Gluten forms the strong protein network (Liu et al., 2018) with influence on the rheological properties of dough (Andersson et al., 2011) and bread, such as viscoelasticity, consistency, mixing tolerance, tensile strength (Lazaridou et al., 2007; Zorzi et al., 2020), gas retention capacity comprising fiber fragments and starch granules (Arendt & Dal Bello, 2008), being responsible for the total acceptability of the bread (Moghaddam et al., 2020) and having an impact on the quality of wheat products (Li et al., 2019). It is difficult to assess the tolerated amount of gluten by people without developing deleterious effects, but it is considered that less than 10 mg of gluten / day intake do not cause problems (Gobbetti et al., 2018). The ingestion of gluten depending of time and dose (Dotsenko et al., 2020) is related to the intestinal mucosa damage and malabsorption of several important nutrients (Lazaridou et al., 2007). Sarabhai et al. (2020) say that celiac disease is an autoimmune enteropathy with a long-term sensitivity to gluten. The symptoms are weight gain or weight loss, steatorrhea, anemia, abdominal discomfort, severe diarrhea and fatigue (Arendt & Dal Bello, 2008; Olojede et al., 2020).
Celiac disease is most common in pediatric age but it can be developed at any age (Gobbetti et al., 2018). Due to the increased number of patients with this disease it is necessary to avoid gluten throughout life and the processed foods based on wheat (Aoki et al., 2020). A dietary assessment tool can be helpful for this purpose (Atsawarungruangkit et al., 2020). The commune raw materials containing gluten are: wheat, oats, rye and barley (Arendt & Dal Bello, 2008; Olawoye et al., 2020; Drabinska et al., 2016). Gluten is responsible for dough processing and textural characteristics of bread products. The finished products to avoid by people with celiac disease are: bread, pastries and other food products containing wheat flour. Salad dressings, cream sauces, hamburgers, processed cheese and mixtures of dried or canned soups can also contain hidden ingredients as by-products or processed foods containing wheat and gluten-derivatives as fillers agents and thickeners. Due to the gluten sensitivity and prevalence of celiac disease, it is necessary to avoid it (Andersson et al., 2011), by consuming gluten-free products (Bender & Schonlechner, 2020). GLUTEN-FREE DIET The gluten-free diet is the only available solution (Caio et al., 2020), facilitating mucosal recovery (Mohammadi et al., 2014; Lazaridou et al., 2007). The elimination of gluten-containing foods helps to the protection of the intestinal mucosa, the disappearance of inflammation and normal absorption of nutrients (De Arcangelis et al., 2020). A gluten-free diet has a positive impact on autism, intolerance to eggs, soy, wheat and milk (Xhakollari et al., 2019). In order to follow a gluten-free diet is necessary to know information about ingredients and food preparation. A qualified dietitian can monitor these diets (Atsawarungruangkit et al., 2020). Eliminating gluten from the diet, most of the patients have the feeling of life quality limitation as a sacrifice (Caio et al., 2020). Data on the nutritional balance demonstrate controversy (Polo et al., 2020) due to its low content of protein, dietary fiber and essential fatty acids (Moreira et al., 2013) and may

78
present sensory, economic and social difficulties (Gobbetti et al., 2018). The products are characterized by a low intake of protein, dietary fiber, vitamins, and minerals: vitamin B (thiamine, riboflavin, niacin), vitamin D, folate, iron, calcium, copper, zinc, magnesium and a high intake of carbohydrates, calories, fat and sodium (Arslain et al., 2021; Jagelaviciute & Cizeikiene, 2020). The price for gluten-free cereals and bakery products compared to conventional products are + 205% and + 267% higher (Xhakollari et al., 2019). In order to improve the nutritional properties of these products is necessary to fortify them with ingredients rich in micronutrients (legumes and pseudocereals) (Polo et al., 2020). INGREDIENTS FOR OBTAINING GLUTEN-FREE PRODUCTS Gluten-free cereals can be used for nutritional and health benefits in the manufacture of high-quality foods necessary for patients with celiac disease (Ogunsakin et al., 2015). To obtain gluten-free products, cereal flour (rice, sorghum, corn, teff, millet), legume flour (chickpeas, lentils, dried beans, peas, soybeans), pseudocereals flour (amaranth, quinoa, buckwheat) (Polo et al., 2020), oats, chia seeds, alfalfa seed flour, root and tuber flour (potato) and bean flour can be used (Liu et al., 2018; Olawoye et al., 2020). Researchers have used the addition of non-gluten proteins, starch, hydrocolloids, emulsifiers and enzymes to improve the quality of gluten-free products (Sarabhai et al., 2020). RAW MATERIALS Rice has in albumin the highest content of lysine while in globulin there is a major content of sulfur amino acids (Almeida Sá et al., 2020). Lysine could provide added value to some foods (Nutter et al., 2017). Rice flour is suitable for gluten-free bread (Aoki et al., 2020) with a low level of prolamine. Formulations for rice flour bread have been used carboxymethylcellulose (CMC) and hydroxypropylmethylcellulose (HPMC) (Gallagher et al., 2002). Rice flour can be formulated with starch and protein from cereals, pseudocereals and legumes because they provide optimal dough properties and bakery product quality (Xu et al., 2020).
Buckwheat can be useful in treating chronic diseases such as diabetes, hypertension and other cardiovascular diseases (Wijngaard and Arendt, 2006). Buckwheat can be used to obtain high quality gluten-free bread in combination with xanthan gum. The health benefits have been observed because of their high content of dietary fibers such as β-glucan, functional protein with a well-balanced amino acid profile, essential fatty acids, vitamins, antioxidant phytochemicals, including high phenolic compounds and sterols (Flander, 2007; Gangopadhyay et al., 2015) and minerals, (Ahmed et al., 2014; Krkoskova & Mrazova, 2005). Quinoa is an excellent source of energy and nutrients, being rich in proteins, B vitamins, minerals (Jagelaviciute & Cizeikiene, 2020) and fibers (Ceyhun Sezgin & Sanlier, 2019) and it has a high content of saponins, conferring toxicity and bitter taste at a high concentration. Also, quinoa seeds present anti-nutritional factors as tannins, phytic acid, oxalates and trypsin inhibitors (Filho et al., 2017). The content of methionine and lysine is improved with a reduced addition of quinoa compared to corn protein. Quinoa seeds also bring an increased intake of energy and nutrients (Arendt & Dal Bello, 2008). It has a high mineral content and a higher amount of folic acid. The partial replacement of corn and rice flours with quinoa flour can increase the specific volume of the product (Gobbetti et al., 2018). Amaranth is rich in macronutrients (12-22% proteins and 6-13% lipids), dietary fibre (9-14%), minerals, vitamins, polyphenols and phytosterols. It has high lysine and methionine content (Grundy et al., 2020). Amaranth can have positive health effects to the reduction of cardiovascular disease risks. Replacing 10% of the corn starch with amaranth flour can increase protein and fiber content of gluten-free breads (Gambus et al., 2002). Sorghum has a high content of phytosterols, phenolic acids, tannins and anthocyanins. Several studies have reported obtaining of bread with carboxymethyl cellulose, sorghum flour, xanthan gum, skimmed powder milk and eggs (Cauvain, 1998) to improve the quality of gluten-free bread (Arendt & Dal Bello, 2008). Sorghum proteins have a lower nutritional quality compared to milk and legume proteins

79
(Olojede et al., 2020). Combining sorghum flour with potato, rice, cassava starch or corn, studies have shown that the acceptability of the bread improved (Moghaddam et al., 2020). Oat contains phytates, phenolic compounds, vitamins and minerals and it has lower proline content. β-glucans present beneficial effects on diabetes, reduce the risk of coronary heart disease and serum cholesterol (Oomah and Mazza, 1999). A concern for people with celiac disease is that oat could be contaminated with gluten cereals such as rye, wheat or barley during grain harvesting, transport, storage and processing (Xu et al., 2020). Corn is an important source of fats and carbohydrates, but corn flour is not rich in tryptophan, lysine, omega 3 fatty acids, calcium, phosphorus and iron (Yılmaz & Koca, 2020). Corn flour is formed from endosperm with 75-87% starch and 6-8% protein (Shukla and Cheryan, 2001). As binding agents for replacing gluten can be used: guar gum, xanthan and acacia gum with an increased volume of bread. Corn flour can be used to obtain tortillas, pancake and bread premixes, cereals and chips (Arendt & Dal Bello, 2008). Teff, an ancient grain, presents 11% protein, 3% fat, 80% carbohydrate, essential amino acids, especially lysine, the amino acid that is deficient in grain foods, fiber, calcium, iron, potassium. Teff flour can be mixed with millet and sorghum to obtain a flat bread with an improved nutritional value (Villanueva et al., 2021), biscuits, waffles, muffins, cakes, stews, soups and puddings (Ketema, 1993). Inulin is classified as a dietary fiber and it is an indigestible fructooligosaccharide. Studies have shown that the addition of fiber-rich ingredients improve texture, emulsifying, thickening, gelling, stabilizing and prebiotic properties. An addition of 8% inulin in a formulation with wheat starch improved the quality of gluten-free bread (Gallagher et al., 2002). Wheat starch is a carbohydrate the most abundant in wheat, wheat flour and many foods. Research has shown that among wheat starch and additives formulations, the best quality breads were produced with the addition of xanthan gum. (Kulp et al., 1974). Potato starch has high water binding capacity, swelling power and frost-thaw stability (Madsen and Christensen, 1996).
Milk proteins have functional properties similar to gluten, good swelling properties, nutritional and functional benefits including the improve of flavor and texture (Gallagher et al., 2004). Surimi is a concentrate of myofibrillar proteins. Studies have been performed to obtain gluten-free bread based on rice flour, potato starch and surimi (as a structural enhancer and protein substitute) (Gormley et al., 2003). Soy protein is rich in high-quality protein (38-55%) and essential amino-acid, carbohydrates (27.1%) and oil (20.6%) (Osundahunsi et al., 2007). It is a cheap legume crop cultivated in tropical regions. Studies have been conducted for the formulation of gluten-free bread based on wheat starch with 20, 30 and 40% soy protein isolate (Arendt & Dal Bello, 2008). Legumes are sources of energy, protein, carbohydrates, fiber, vitamins and minerals. They are characterized by high lysine content and a limited source of methionine, cysteine and tryptophan. Peas and its protein isolates provide sulphur amino acids (Nutter et al., 2017). Chickpea are excellent sources of protein (23-27%) compared to other legumi-nous plants and they are important sources of the essential nutrients (Olojede et al., 2020). Lupine isolates meet the essential requirements of amino acids (Nutter et al., 2017). Chia seeds contain carotenoids, omega-3 fatty acids, fiber, vitamin E (Jagelaviciute & Cizeikiene, 2020), proteins, minerals and phyto-chemicals such as phenolic compounds (Silva et al., 2017). Studies have shown that a combination of chia seeds and hydrocolloids modified significantly the rheological properties of doughs (Moreira et al., 2013). Chia seed is considered the highest botanical source of alpha linolenic acid (ALA) omega 3 (n-3). Chia, hemp and quinoa flour can be used for fermentation with Lactobacillus sanfranciscensis for the production of gluten-free bread (Jagelaviciute & Cizeikiene, 2020). Flax seeds have low levels of trans fatty acids (especially n-3α-linolenic acid) (Gobbetti et al., 2018) and are a source of protein, fiber, phenolic compounds (Nutter et al., 2017) and active components (Oomah, 2010). Microalgae are natural sources of proteins, essential amino acids, polyunsaturated fatty acids, vitamins, minerals, enzymes, carotenoids and fiber. Studies have used Chlorella

80
sorokiniana, to obtained bread enriched with proteins, polyunsaturated fatty acids and carotenoids. The addition of microalgae did not show an effect on the volume and texture of the bread, but it can affect its sensorial characteristics such as the color that is greenish (Diprat et al., 2020). Psyllium can improve volume, texture, structure, acceptance, appearance, shelf life and it presents fiber enrichment and lowering glycemic index (Santos et al., 2020). The consumption of psyllium can reduce the risks of metabolic conditions by improving glucose levels, insulin response and lipid profile (McRorie, 2015). Walnuts and almonds have a high content of lipids, including fatty acids (Nutter et al., 2017) and they are rich in alpha-linolenic acid (ALA), melatonin, magnesium and antioxidants (Ma et. al., 2010). They can predict lower blood pressure, lower serum total cholesterol and low-density lipoprotein (LDL) cholesterol, greater endothelial function (i.e., flow mediated dilation), and lower risk of developing type 2 diabetes. ENZYMES Transglutaminases are enzymes able to bind proteins of different origins: soy proteins and wheat proteins, proteins from eggs and meat, casein and albumin from milk, improving the quality depending on the enzymatic concentration (Bender & Schonlechner, 2020) and protein source (Kuraishi et al., 1996) and they can contribute to the creation of a protein network similar to gluten (Gobbetti et al., 2018). Oxidases as glucose oxidase and laccase can contribute to the creation of a protein network (Gobbetti et al., 2018) and the dough fermentation, stability and processing can be improved (Bender & Schonlechner, 2020). Oxidases can intensify crust colour, develop finer, crumb structure and can increase the shelf life. The enzymes are denatured during baking process and they cannot be identified in the final product (Sarabhai et al., 2020). MICROORGANISMS Yeast and lactic acid bacteria synthesize metabolites such as vitamins and the use of sourdough containing them is appropriate to
make gluten-free bread by improving processing conditions and product quality (Olojede et al., 2020). Yeast are rich in folate. These determine a fast conversion of sugars into alcohol and CO2 but the main acidification of the dough is made by lactic acid and acetic acid generated by lactic acid bacteria. The ratio of lactic acid to acetic acid is necessary for aroma, texture and shelf life of the bread, but also by-products such as CO2, ethanol, fatty acids, hydrogen peroxide, diacetyl, contributes to conservation. Lactic acid bacteria can degrade phitic acid at pH 5-5.5 (Jagelaviciute & Cizeikiene, 2020). Lactobacillus reuteri produces vitamin B12. Lactobacillus plantarum and Lactococcus lactis synthesize high levels of γ-aminobutyric acid. Lactobacillus plantarum decreases the values of pH (Moghaddam et al., 2020). Lactobacillus plantarum, Lactobacillus fermentum and Lactobacillus paralimentarius are used to make corn and rice products (Bender & Schonlechner, 2020). HYDROCOLLOIDS Hydrocolloids are substances with protein or polysaccharide structure and a high molecular weight being composed of long-chain hydrophilic molecules and can produce gels (Hoefler, 2004). They can be obtained from plant extracts, fruits, seeds, microorganisms and seaweed. They have two basic functions in foods: they improve the texture and stabilize the product (De Arcangelis et al., 2020). The presence of hydrocolloids which are able to bind water determines a shorter shelf life of the product. For gluten-free products can be used hydrocolloids such as hydroxypropyl methylcellulose, pectin, cellulose, xanthan gum, locust gum and guar gum (Arendt & Dal Bello, 2008) to improve the quality (Xu et al., 2020) and water retention capacity (Li et al., 2019). The combination of carboxymethylcellulose and hydroxypropyl methylcellulose gives to the dough viscoelastic properties (Gobbetti et al., 2018). The combination of carboxymethylcellulose (CMC) and other gums and stabilizers improves water absorption capacity.
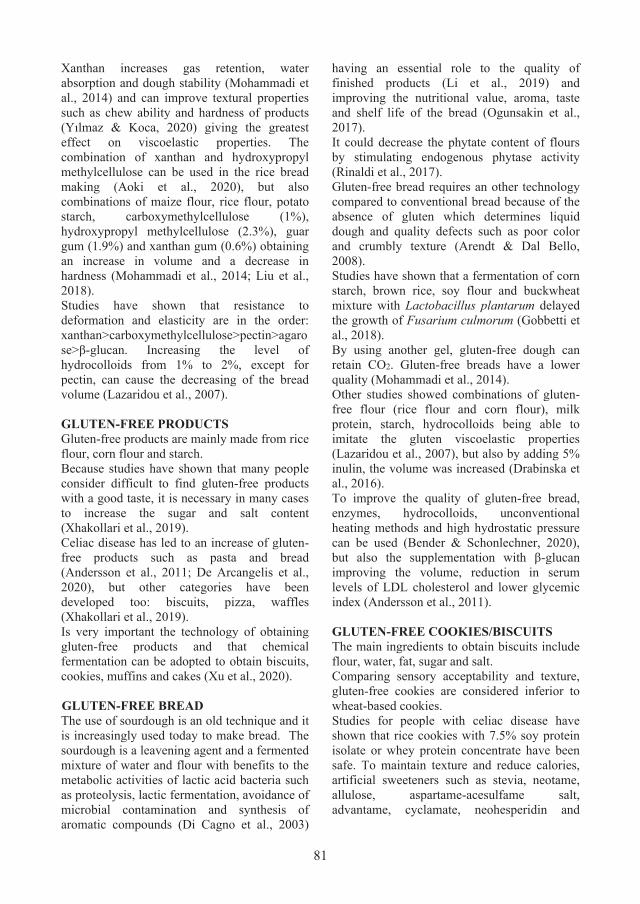
81
Xanthan increases gas retention, water absorption and dough stability (Mohammadi et al., 2014) and can improve textural properties such as chew ability and hardness of products (Yılmaz & Koca, 2020) giving the greatest effect on viscoelastic properties. The combination of xanthan and hydroxypropyl methylcellulose can be used in the rice bread making (Aoki et al., 2020), but also combinations of maize flour, rice flour, potato starch, carboxymethylcellulose (1%), hydroxypropyl methylcellulose (2.3%), guar gum (1.9%) and xanthan gum (0.6%) obtaining an increase in volume and a decrease in hardness (Mohammadi et al., 2014; Liu et al., 2018). Studies have shown that resistance to deformation and elasticity are in the order: xanthan>carboxymethylcellulose>pectin>agarose>β-glucan. Increasing the level of hydrocolloids from 1% to 2%, except for pectin, can cause the decreasing of the bread volume (Lazaridou et al., 2007). GLUTEN-FREE PRODUCTS Gluten-free products are mainly made from rice flour, corn flour and starch. Because studies have shown that many people consider difficult to find gluten-free products with a good taste, it is necessary in many cases to increase the sugar and salt content (Xhakollari et al., 2019). Celiac disease has led to an increase of gluten-free products such as pasta and bread (Andersson et al., 2011; De Arcangelis et al., 2020), but other categories have been developed too: biscuits, pizza, waffles (Xhakollari et al., 2019). Is very important the technology of obtaining gluten-free products and that chemical fermentation can be adopted to obtain biscuits, cookies, muffins and cakes (Xu et al., 2020). GLUTEN-FREE BREAD The use of sourdough is an old technique and it is increasingly used today to make bread. The sourdough is a leavening agent and a fermented mixture of water and flour with benefits to the metabolic activities of lactic acid bacteria such as proteolysis, lactic fermentation, avoidance of microbial contamination and synthesis of aromatic compounds (Di Cagno et al., 2003)
having an essential role to the quality of finished products (Li et al., 2019) and improving the nutritional value, aroma, taste and shelf life of the bread (Ogunsakin et al., 2017). It could decrease the phytate content of flours by stimulating endogenous phytase activity (Rinaldi et al., 2017). Gluten-free bread requires an other technology compared to conventional bread because of the absence of gluten which determines liquid dough and quality defects such as poor color and crumbly texture (Arendt & Dal Bello, 2008). Studies have shown that a fermentation of corn starch, brown rice, soy flour and buckwheat mixture with Lactobacillus plantarum delayed the growth of Fusarium culmorum (Gobbetti et al., 2018). By using another gel, gluten-free dough can retain CO2. Gluten-free breads have a lower quality (Mohammadi et al., 2014). Other studies showed combinations of gluten-free flour (rice flour and corn flour), milk protein, starch, hydrocolloids being able to imitate the gluten viscoelastic properties (Lazaridou et al., 2007), but also by adding 5% inulin, the volume was increased (Drabinska et al., 2016). To improve the quality of gluten-free bread, enzymes, hydrocolloids, unconventional heating methods and high hydrostatic pressure can be used (Bender & Schonlechner, 2020), but also the supplementation with β-glucan improving the volume, reduction in serum levels of LDL cholesterol and lower glycemic index (Andersson et al., 2011). GLUTEN-FREE COOKIES/BISCUITS The main ingredients to obtain biscuits include flour, water, fat, sugar and salt. Comparing sensory acceptability and texture, gluten-free cookies are considered inferior to wheat-based cookies. Studies for people with celiac disease have shown that rice cookies with 7.5% soy protein isolate or whey protein concentrate have been safe. To maintain texture and reduce calories, artificial sweeteners such as stevia, neotame, allulose, aspartame-acesulfame salt, advantame, cyclamate, neohesperidin and

82
others are potential alternatives (Gongora Salazar et al., 2018). The addition of hydrocolloids improves the rheological properties of the dough (Xu et al., 2020). The inulin can be used as a source of dietary fiber (Drabinska et al., 2016). Modifying starch through chemical, physical or enzymatic methods, the nutritional improvement can be achieved (Olawoye et al., 2020). Brown rice and apple pomace can be used as functional ingredients, the obtained biscuits being acceptable in terms of sensory. Biscuits with 9% apple pomace have antioxidant properties, a high content of dietary fiber and polyphenols and are rich in minerals such as chlorine, phosphorus potassium, and sulfur (Mir et al., 2017). GLUTEN-FREE MUFFINS The “bakery products” category includes also the muffins (Belorio & Gómez, 2020). Muffins are made from wheat flour, egg, oil, milk and sugar. Gluten-free muffins can be developed using gluten-free flours such as millet, rice, buckwheat and chickpeas. For the development of muffins, studies have shown combinations of flours, for example: rice flour and quinoa mixture; rice flour, soy flour and corn starch mixture; rice flour and buckwheat flour mixture; rice flour and green banana flour (50/50) mixture; buckwheat flour and corn starch mixture. Green banana flour can improve the aroma, taste, volume, texture, general acceptability and the mineral content of the muffins. To improve the quality of rice muffins, proteins (pea protein isolate, soy protein isolate, egg white protein and casein), enzymes and gums can be used. The protein isolates improve the elasticity, specific volume and cohesion (Xu et al., 2020) and the xanthan gum (0.5 and 1%) increase the viscoelasticity of the dough. GLUTEN-FREE PASTA To achieve balanced formulations, excellent nutritional and quality properties, rice flour as major ingredient (Ribeiro et al., 2018; Bouasla and Wojtowicz, 2019), corn flour, buckwheat flour, emulsifiers and stabilizers (carob flour and guar, fatty acid monoglycerides,
propyleneglycol alginate) can be used. Starch plays a structuring role. Buckwheat flour led to pasta with a high content of dietary fiber and protein (De Arcangelis et al., 2020). The quality of the pasta during cooking is influenced by the protein content which is structural ingredients with role in the structure, sensory and textural properties of pasta. Proteins such as egg whites, dairy ingredients and protein isolates can be used. Some studies have shown that whey proteins determine a strong starch-protein network (Ungureanu-Iuga et al., 2020). Studies have shown that pasta enriched with 5% inulin had a good quality (Drabinska et al., 2016). WAFFLES AND WAFER Gluten-free waffles can be obtained using rice, buckwheat and corn flour and the technology should be adapted for patients with celiac disease. The moisture content for corn and rice flour dough should be reduced compared to the moisture content of wheat flour dough (Nascimento et al., 2013; Paucean et al., 2016). For the dough with buckwheat flour and to obtain high quality waffles, the moisture content should be increased. This dough has maximum viscosity and density, while the rice flour dough has these parameters at a minimum. Wafer sheets from buckwheat and corn flour have specific flavor and color characteristics. Wafer sheets from buckwheat flour have a higher amount of protein compared to wafer sheets from rice and corn flour (Dorohovych et al., 2018). CONCLUSIONS People with celiac disease should avoid gluten-containing ingredients such as: wheat, oats, rye and barley (Drabinska et al., 2016). They should also avoid gluten-containing products such as bread, pastries, by-products or processed foods (Andersson et al., 2011). To obtain gluten-free products with balanced nutritional quality and sensory acceptability (Xu et al., 2020) the ingredients play an important role (De Arcangelis et al., 2020).

83
Gluten-free products are poor in nutrients such as protein, dietary fiber, vitamins, and minerals: vitamin B, vitamin D, folate, iron, calcium, copper, zinc, magnesium (Arslain et al., 2021; Jagelaviciute & Cizeikiene, 2020) and they need to be nutritionally improved, by using ingredients rich in these micronutrients such as legumes and pseudocereals (Polo et al., 2020). Rice flour can be formulated with starch, cereals, pseudocereals and legumes due to their properties for dough and bakery product quality (Xu et al., 2020). Buckwheat can be used in combination with xanthan gum to obtain high quality gluten-free bread. Quinoa flour can be used in combination with corn and rice flour to increase the specific volume of the product (Gobbetti et al., 2018). Amaranth flour can be used in combination with corn starch to increase protein and fiber content of gluten-free breads (Gambus et al., 2002). Sorghum flour can be used in combination with xanthan gum, carboxymethyl cellulose, skimmed powder milk and eggs (Cauvain, 1998) to improve the quality of gluten-free bread (Arendt & Dal Bello, 2008). Corn flour can be used in combination with guar gum, xanthan and acacia gum with an increased volume of bread (Arendt & Dal Bello, 2008). Teff flour can be used in combination with millet and sorghum to obtain a flat bread with an improved nutritional value (Villanueva et al., 2021), biscuits, waffles, muffins, cakes, stews, soups and puddings (Ketema, 1993). Inulin can be used in combination with wheat starch improving the quality of gluten-free bread (Gallagher et al., 2002). Wheat starch can be used in combination with xanthan gum (Kulp et al., 1974). Soy protein isolate can be used in combination with wheat starch (Arendt & Dal Bello, 2008). Legumes such as peas, chickpea and lupine isolates are used to improve the quality of gluten-free products. Chia seeds, hemp and quinoa can be used for fermentation with Lactobacillus sanfranciscensis (Jagelaviciute & Cizeikiene, 2020). Transglutaminases can contribute to the creation of a protein network similar to gluten (Gobbetti et al., 2018). Oxidases can increase the shelf life. Yeast can improve the processing conditions and product quality (Olojede et al., 2020). Lactobacillus plantarum, Lactobacillus fermentum and Lactobacillus paralimentarius
can be used to make corn and rice products (Bender & Schonlechner, 2020). Hydrocolloids such as hydroxypropyl methylcellulose, pectin, cellulose, xanthan gum, locust gum and guar gum (Arendt & Dal Bello, 2008) can improve the quality (Xu et al., 2020) and water retention capacity (Li et al., 2019) of gluten-free products. With the ingredients mentioned above, gluten-free products such as gluten-free bread, gluten-free cookies/biscuits, gluten-free muffins, gluten-free pasta, waffles and wafer can be obtained but these products may require a different technology. In conclusion, it is necessary that the ingredients should be carefully selected so that the resulting products are improved from a textural and nutritional point of view. REFERENCES Ahmed, A., Khalid, N., Ahmad, A., Abbasi, N. A., Latif,
M. S. Z., & Randhawa, M. A. (2014). Phytochemicals and biofunctional properties of buckwheat: A review. Journal of Agricultural Science, 152(3). 349–369.
Almeida Sá, A.G., Moreno, Y.M.F.,Carciofi, B.A.M. (2020). Plant proteins as high-quality nutritional source for human diet. Trends in Food Science & Technology 97. 170–184
Andersson, H., Öhgren, C., Johansson, D., Kniola, M., Stading, M. (2011). Extensional flow, viscoelasticity and baking performance of gluten-free zein-starch doughs supplemented with hydrocolloids. Food Hydrocolloids, 25. 1587‒1595.
Aoki, N., Kataoka, T., Nishiba, Y. (2020). Crucial role of amylose in the rising of gluten- and additive-free rice bread. Journal of Cereal Science, 92 102905. 1‒5.
Arendt, E. K., Dal Bello, F. (2008). Functional cereal products for those with gluten intolerance. Technology of Functional Cereal Products. 446‒475.
Arslain, K., Gustafson, C.R., Baishya, P., Rose, D. J., (2021). Determinants of gluten-free diet adoption among individuals without celiac disease or non-celiac gluten 8ensitivity. Appetite, 156 104958. 1‒8.
Atsawarungruangkit, A., Silvester, J. A., Weiten, D., Green, K. L., Wilkey, K. E., Rigaux, L. N., Bernstein, C. N., Graff, L. A., Walker, J. R., Duerksen, D. R. (2020). Development of the Dietitian Integrated Evaluation Tool for Gluten-free Diets (DIET-GFD). Nutrition, 78 110819. 1‒8.
Belorio, M., Gómez, M. (2020). Gluten-free muffins versus gluten containing muffins: Ingredients and nutritional differences. Trends in Food Science & Technology, 102. 249–253.
Bender, D., Schonlechner, R. (2020). Innovative approaches towards improved gluten-free bread properties. Journal of Cereal Science, 91 102904. 1‒8.

84
Bouasla, A., Wojtowicz, A. (2019). Rice-buckwheat
gluten-free pasta: effect of processingparameters on quality characteristics and optimization of extrusion-cooking process.Foods 8, 1–6.
Caio, G., Ciccocioppo, R., Zoli, G., De Giorgio, R., Volta, U. (2020). Therapeutic options for coeliac disease: What else beyond gluten-free diet?. Digestive and Liver Disease, 52, 130–137.
Carvalho, A.V., Bassinello, P.Z., Rios, A.D.O., Ferreira, T.F., Carvalho, R.N., Koakuzu, S.N. (2013). Characterization of pre-gelatinized rice and beanflour. Food Sci. Technol.(Campinas), 33, 245–250.
Cauvain, S.P. (1998). Other cereals in breadmaking. In: Cauvain, S.P. and Young, L.S. (eds). Technology of Breadmaking. Blackie Academic & Professional, 330–346.
Ceyhun Sezgin, A., & Sanlier, N. (2019). A new generation plant for the conventional cuisine: Quinoa (Chenopodium quinoa Willd.). Trends in Food Science and Technology, 86, 51–58.
De Arcangelis, E., Cuomo, F., Trivisonno, M. C., Marconi, E., Messia, M. C. (2020). Gelatinization and pasta making conditions for buckwheat gluten-free pasta. Journal of Cereal Science, 95, 1‒7.
Diprat, A. B., Thys, R. C. S., Rodrigues, E., Rech, R. (2020). Chlorella sorokiniana: A new alternative source of carotenoids and proteins for gluten-free bread. LWT – Food Science and Technology, 134 109974, 1‒7.
do Nascimento A., Fiates G., dos Anjos A., Teixeira E. (2013). Analysis of ingredient lists of commercially available gluten-free and gluten-containing food products using the text mining technique. International Journal of Food Sciences and Nutrition, 64, 217–222.
Dorohovych, V., Hrytsevich, M., Isakova, N. (2018). Effect of gluten-free flour on sensory, physicochemical, structural and mechanical properties of wafer batter and waffles. Ukrainian Food Journal. 2018. Volume 7. Issue 2. 253‒263.
Dotsenko, V., Oittinen, M., Taavela, J., Popp, A., Peräaho, M., Staff, S., Sarin, J., Leon, F., Isola, J., Mäki, M., Viiri, K. (2020). Genome-Wide Transcriptomic Analysis of Intestinal Mucosa in Celiac Disease Patients on a Gluten-Free Diet and Postgluten Challenge. Cellular and Molecular Gastroenterology and Hepatology, Vol. 11, No. 1, 13‒32.
Drabinska, N., Zielinski, H., Krupa-Kozak, U. (2016). Technological benefits of inulin-type fructans application in gluten-free products - A review. Trends in Food Science & Technology, 56, 149‒157.
Filho, A. M., Pirozi, M. R., Borges, J. T.,Pinheiro Sant'Ana,H. M., Chaves, J. B., &Coimbra, J. S. (2017). Quinoa: Nutritional, functional, and antinutritional aspects. Critical Reviews in Food Science and Nutrition, 57, 1618–1630.
Flander, L., Salmenkallio-Marttila, M., Suortti, T., & Autio, K. (2007). Optimization of ingredients and baking process for improved wholemeal oat bread
quality. LWT - Food Science and Technology, 40, 860–870.
Gallagher, E., Polenghi, O. and Gormley, T.R. (2002). Novel rice starches in gluten-free bread. Proceedings of the International Association of Cereal Chemists Conference, 24–26.
Gallagher, E., Gormley, T.R. and Arendt, E.K. (2004). Recent advances in the formulation of gluten-free cereal-based products. Trends Food Sci. Technol. 15, 143–152.
Gambus, H., Gambus, F. and Sabat, R. (2002). The research on quality improvement of gluten-free bread by amaranthus flour addition. Zywnosc, 9, 99–112.
Gangopadhyay, N., Hossain, M. B., Rai, D. K., & Brunton, N. P. (2015). A Review of Extraction and Analysis of Bioactives in Oat and Barley and Scope for Use of Novel Food Processing Technologies. Molecules, 20(6), 10884–10909.
Gobbetti, M., Pontonio, E., Filannino, P., Rizzello, C. G., De Angelis, M., Di Cagno, R. (2018). How to improve the gluten-free diet: The state of the art from a food science perspective. Food Research International, 110, 22–32.
Gongora Salazar, V. A., Vazquez Encalada, S., Corona Cruz, A., & Segura Campos, M. R. (2018). Stevia rebaudiana : A sweetener and potential bioactive ingredient in the development of functional cookies. Journal of Functional Foods, 44, 183–190.
Gormley, T. R., Elbel, C., Gallagher, E. and Arendt, E. K. (2003). Fish surimi as an ingredient in gluten-free breads. Proceedings of the First Joint Trans Atlantic Fisheries Technology Conference, Iceland, 246–247.
Grundy, M. M. L., Momanyi, D. K., Holland, C., Kawaka, F., Tan, S., Salim, M., Boyd, B. J., Bajka, B., Mulet-Cabero, A. I., Bishop, J., Owino, W. O. (2004). Effects of grain source and processing methods on the nutritional profile and digestibility of grain amaranth. Journal of Functional Foods, 72, 1-10.
Jagelaviciute, J., Cizeikiene, D. (2020). The influence of non-traditional sourdough made with quinoa, hemp and chia flour on the characteristics of gluten-free maize/rice bread. LWT – Food Science and Technology, 1‒9.
Ketema, S. (1993). Tef crop improvement, nutrition and utilization. Advances in Small Millets, 61–65.
Krkoskova, B., & Mrazova, Z. (2005). Prophylactic components of buckwheat. Food Research International, 38(5), 561–568.
Kulp, K., Frank, H.N. and Thomas, L.A. (1974). Preparation of bread without gluten. Baker’s Dig. 48, 34–38.
Kuraishi, C., Sakamoto, J. and Soeda, T. (1996). The usefulness of transglutaminase for food processing. Biotechnology for Improved Foods and Flavours, 29–38.
Lazaridou, A., Duta, D., Papageorgiou, M., Belc, N., Biliaderis, C.G. (2007). Effects of hydrocolloids on dough rheology and bread quality parameters in gluten-free formulations. Journal of Food Engineering, 79, 1033–1047.

85
Li, J., Yadav, M. P., Li, J. (2019). Effect of different
hydrocolloids on gluten proteins, starch and dough microstructure. Journal of Cereal Science, 87. 85–90.
Liu, X., Mua, T., Sun, H., Zhang, M., Chen, J., Fauconnier, M. L. (2018). Influence of different hydrocolloids on dough thermo-mechanical properties and in vitro starch digestibility of gluten-free steamed bread based on potato flour. Food Chemistry, 239, 1064–1074.
Ma, Y, Njike, V., Millet, J., Dutta, S., Doughty, K., Teu, J.A. (2010). Effects of walnut consumption on endothelial function in type 2 diabetic subjects. Diabetes Care, 33:227‒32.
Madsen, M.H. and Christensen, D.H. (1996). Changes in viscosity properties of potato starch during growth. Starch 48, 245–249.
McRorie, J. (2015). Evidence-based approach to fiber supplements and clinically meaningful health benefits: Part 1. What to look for and how to recommend an effective fiber therapy. Nutrition Today, 50(2), 82-89.
Miller, S. S. & Fulcher, R. G. (2011). Microstructure and chemistry of the oat kernel. Oats: Chemistry and technology, 77–94.
Mir, S. A., Bosco, S. J. D., Shah, M. A., Santhalakshmy, S., Mir, M. M. (2017). Effect of apple pomace on quality characteristics of brown rice based cracker. Journal of the Saudi Society of Agricultural Sciences, 16, 25–32.
Moghaddam, M. F. T., Jalali, H., Nafchi, A. M., Nouri, L. (2020). Evaluating the effects of lactic acid bacteria and olive leaf extract on the quality of gluten-free bread. Gene Reports, 21, 1‒8.
Mohammadi, M., Sadeghnia, N., Azizi, M. H., Neyestani, T. R.,. Mortazavian, A. M. (2014). Development of gluten-free flat bread using hydrocolloids: Xanthan and CMC. Journal of Industrial and Engineering Chemistry, 20, 1812–1818.
Moreira, R., Chenlo, F., Torres, M.D. (2013). Effect of chia (Sativa hispanica L.) and hydrocolloids on the rheology of gluten-free doughs based on chestnut flour. LWT – Food Science and Technology, 50, 160‒166.
Navruz-Varli, S., & Sanlier, N. (2016). Nutritional and health benefits of quinoa (Chenopodium quinoa Willd.). Journal of Cereal Science, 69, 371–376.
Nutter, J., Fritz, R., Saiz, A. I., Iurlina, M. O. (2017). Effect of honey supplementation on sourdough: Lactic acid bacterial performance and gluten microstructure. LWT – Food Science and Technology, 77, 119-125.
Ogunsakin, O. A., Banwo, K., Ogunremi, O. R., & Sanni, A. I. (2015). Microbiological and physicochemical properties of sourdough bread from sorghum flour. International Food Research Journal, 22, 2610–2618.
Ogunsakin, A. O., Vanajakshi, V., Anu-Appaiah, K. A., Vijayendra, S. V. N., Walde, S. G., Banwo, K., Sanni, A. I., Prabhasankar, P. (2017). Evaluation of functionally important lactic acid bacteria and yeasts from Nigerian sorghum as starter cultures for gluten-
free sourdough preparation. LWT - Food Science and Technology, 82, 326‒334.
Olawoye, B., Gbadamosi, S. O., Otemuyiwa, I. O., Akanbi, C. T., (2020). Gluten-free cookies with low glycemic index and glycemic load: optimization of the process variables via response surface methodology and artificial neural network. Heliyon 6 e05117, 1‒10.
Olojede, A. O., Sannia, A. I., Banwo, K. (2020). Effect of legume addition on the physiochemical and sensorial attributes of sorghum-based sourdough bread. LWT – Food Science and Technology, 118 108769, 1‒6.
Olojede, A. O., (Ogunsakin, A. O.), Sanni, A. I., Banwo, K. (2020). Rheological, textural and nutritional properties of gluten-free sourdough made with functionally important lactic acid bacteria and yeast from Nigerian sorghum. LWT - Food Science and Technology, 120 108875, 1‒8.
Oomah, B.D. and Mazza, G. (1999). Health benefits of phytochemicals from selected Canadian crops. Trends Food Sci. Technol. 10, 193–198.
Oomah, B.D. (2010). Flaxseed as a functional food source. Journal of the Science ofFood and Agriculture 81. 889–894 .
Osundahunsi, O.F., Amosu, D., Ifesan, B.O.T., (2007). Quality evaluation and acceptability of soy-yoghurt with different colours and fruit flavours. Am. J. Food Technol. 2, 273–280.
Paucean, A., Man, S., Muste, S., Pop, A. (2016). Development of gluten free cookies from rice and coconut flour blends. Food Science and Technology, 73(2), 163–164.
Polo, A., Arora, K., Ameur, H., Di Cagno, R., De Angelis, M., Gobbetti, M. (2020). Gluten-free diet and gut microbiome. Journal of Cereal Science, 95 103058, 1‒10.
Ribeiro, T.H.S., Bolanho, B.C., Montanuci, F.D., Ruiz, S.P., (2018). Physicochemical and sensory characterization of gluten-free fresh pasta with addition of passion fruit peel flour. Rural 48, 1–9.
Rinaldi, M., Paciulli, M., Caligiani, A., Scazzina, F., Chiavaro, E. (2017). Sourdough fermentation and chestnut flour in gluten-free bread: A shelflife evaluation. Food Chemistry, 224, 144–152.
Santos, F. G., Aguiar, E. V., Centeno, A. C. L.S., Rosell, C. M., Capriles, V. D. (2020). Effect of added psyllium and food enzymes on quality attributes and shelf life of chickpea-based gluten-free bread. LWT - Food Science and Technology, 134 110025, 1‒8.
Sarabhai, S., Tamilselvan, T., Prabhasankar, P. (2020). Role of enzymes for improvement in gluten-free foxtail millet bread: It’s effect on quality, textural, rheological and pasting properties. LWT - Food Science and Technology xxx (xxxx) xxx, 1‒7.
Shukla, R. and Cheryan, M. (2001). Zein: the industrial protein from corn. Ind. Crops Prod. 13, 171–192.
Silva, B. P., Anunciação, P. C., Matyelka, J. C. da S., Della Lucia, C. M., Martino, H. S. D.,& Pinheiro-Sant’Ana, H. M. (2017). Chemical composition of Brazilian chia seeds grown in different places. Food Chemistry, 221, 1709–1716.
Ungureanu-Iuga, M., Dimian, M., Mironeasa, S. (2020). Development and quality evaluation of gluten-free pasta with grape peels and whey powders. LWT - Food Science and Technology, 130 109714, 1‒9.

86
Villanueva, M., Abebe, W., Collar, C., Ronda, F. (2021). Tef
[Eragrostis tef (Zucc.) Trotter] variety determines viscoelastic and thermal properties of gluten-free dough and bread quality. LWT - Food Science and Technology, 135 110065, 1‒9.
Wijngaard, H.H. and Arendt, E.K. (2006). Review: Buckwheat. Cereal Chem. 83, 391–401.
Xhakollari, V., Canavari, M., Osman, M. (2019). Factors affecting consumers' adherence to gluten-free diet, a systematic review. Trends in Food Science & Technology, 85, 23–33.
Xu, J., Zhang, Y., Wang, W., Li, Y. (2020). Advanced properties of gluten-free cookies, cakes, and crackers: A
review. Trends in Food Science & Technology, 103, 200–213.
Yılmaz, V. A., Koca, I. (2020). Development of gluten-free corn bread enriched with anchovy flour using TOPSIS multi-criteria decision method. International Journal of Gastronomy and Food Science, 22 100281, 1‒10.
Zorzi, C. Z., Garske, R. P., Flores, S. H., Thys, R. C. S. (2020). Sunflower protein concentrate: A possible and beneficial ingredient for gluten-free bread. Innovative Food Science and Emerging Technologies, 66 102539, 1‒7.

87
IMPROVING NUTRITIONAL VALUE AND SENSORIAL
PROPERTIES OF BAKERY PRODUCTS USING FUNCTIONAL INGREDIENTS
Ioana STANCIU, Mona Elena POPA
University of Agronomic Sciences and Veterinary Medicine of Bucharest, 59 Mărăşti Blvd, District 1, 011464, Bucharest, Romania, Phone: +4021.318.25.64, Fax: + 4021.318.25.67,
Email: [email protected]
Corresponding author email: [email protected] Abstract Research is being done worldwide to improve foods with functional ingredients. In the food industry, the stability of functional ingredients and the type of products in which they are added are taken into account. Bakery products are consumed very frequently and can be improved without much technological effort. Functionalization of this kind of staple food is very important for food security purpose. This paper will assess the scientific literature on this field from the last decade and the state of the art will be described. The objective of this work is to make a short review in using functional ingredients in bakery products, which are used nowadays in industry or are in the research and development phase. The paper presents aspects such as: new sources of functional ingredients (pumpkin seed flour, potato flour, chickpea flour, chia flour, hemp flour, coconut flour, banana flour), new bakery products, new processing inputs to obtain functionalised bakery products, and consumer attitude related to these kind of products. Key words: bakery products, functional ingredients, fortified flour, nutritional value, sensorial properties.
INTRODUCTION In recent years, there has been a significant increase in consumer interest in the quality and safety of food products (Marszałek et al., 2015). Functional foods have been defined several times, being the first time in 1980 in Japan as “food products with special constituents that possess advantageous physiologically effects” (Siro et al., 2008). Such is the example of the International Food Information Council (IFIC) from USA, which states that functional foods are “Foods that may provide health benefits beyond basic nutrition” the Food and Nutrition Board state “Functional Foods as one that encompasses potential healthful products. Including any modified food are food ingredient that may provide a health benefit beyond that of the traditional nutrients it contains” and the European Commission Concerted Action Group of Functional Food Science (FUFOSE) states “Food which could be regarded as functional as being one that has been satisfactorily demonstrated to beneficially affect one or more
functions in the body, beyond adequate nutritional effects, in a way which is either relevant to either and improved state of health and wellbeing and/or a reduction of risk” (Kaur & Das, 2011). Functional foods represent one of the most interesting areas of research and innovation in the food industry (Jones & Jew, 2007; Siro et al., 2008). There are five main markets for functional foods, namely beverages, dairy products, confectionery products, bakery products, and breakfast cereals (Pinto et al., 2014). In developing functional bakery products (including bread), it is important to realize that achieving functional food quality does not simply involve delivering the active principle at the appropriate level for physiological effectiveness, but also supplying a product which meets the consumer’s requirements in terms of appearance, taste and texture (Alldrick, 2007). Studies and clinical trials suggested numerous health effects related to functional food consumption, such as reduction of cancer risk, improvement of heart health, enhancement of
Scientific Bulletin. Series F. Biotechnologies, Vol. XXV, No. 1, 2021ISSN 2285-1364, CD-ROM ISSN 2285-5521, ISSN Online 2285-1372, ISSN-L 2285-1364

88
immune functions, lowering of menopause symptoms, improvement of gastrointestinal health, anti-inflammatory effects, reduction of blood pressure, antibacterial and antiviral activities and reduction of osteoporosis (Shandilya & Sharma, 2017). Additional (optional) ingredients may be used for processing aids which are essential in particular in the bread-making process, in improving the quality and for fortification of bakery products to have more nutritive value (Al-Dmoor, 2012). Taking into account the fact that bakery products are the most commonly consumed, by all categories of people, as well as for all diseases, it has been studied over time to improve them with certain functional ingredients. The functional ingredients used must cover the daily requirement of nutrients, without worsening the health of people with certain diseases. THE GENERAL INGREDIENTS USED IN BAKERY PRODUCTS FLOUR The flour comes from various types of cereal grains, especially wheat (Qarooni et al., 1989). Wheat flour of different types, obtained by grinding wheat is the main raw material used in the bakery industry (Leonte et al., 2016). Flour is a finely ground powder prepared from grain or other starchy plant foods and used in baking. (Mudabbar & Shah, 2015). The chemical composition of the flour depends on the degree of milling. Increasing the degree of milling reduces the percentage of starch and increases the components present in the bark such as inorganic ingredients, insoluble fiber and vitamins (Belitz et al., 2004; Hui, 2006) WATER The main function of water is hydration. Ingredients must have water in order to function as expected. For example, flour must be hydrated in order to form gluten and for the starch to gelatinize (Sârbu, 2009). It would be impossible to produce a loaf of bread without water in some form. There are several types of water. Hard water produces better quality bread than any type of water. Therefore, water quality used in a food manufacturing plant has to be managed not only with respect to product
safety, but also in view of the capability of production processes (e.g. cooling, heating and cleaning) (Winkler & Nikoleski, 2012). Water itself participates as a reactant in hydrolytic processes. By binding it to food by salt or carbohydrates, it can influence how certain microorganisms grow, improving storage tolerance. An important role of water is to form the texture of food following interactions with proteins, polyglucides, lipids and mineral salts (Popa, 2018) YEAST Baker’s yeast is a commercial preparation consisting of dried cells of one or more strains of the yeast Saccharomyces cerevisiae. Baker`s use yeast as a leavening agent in the rising of dough for baking. A secondary contribution of yeast to bread is flavouring and aroma. Baker`s yeast is a high volume, low value product (O’Shea, 2005). The fermentation of baker`s yeast is strongly directed towards maximum biomass production, no by products such as ethanol are desired and so the fermentations are sectioned to obtain this maximum biomass (Van Hoek et al., 2003). SALT Salt (sodium chloride, NaCl) is a unique food ingredient that is used extensively in the home, food service and food manufacture (Beeren et al., 2019). Salt plays a key role in providing typical textural and organoleptic characteristics in a range of foods and hence its removal and/or replacement may have major impacts on quality and processing (Kilcast & Ridder, 2007). Salt is used to taste and to improve the physical properties of the dough. The salt-free dough is soft and sticky (Leonte, 2003). Salt also contributes in controlling and stabilizing yeast fermentation in dough systems. Salt will prevent over-fermentation. Over-fermentation creates dough with excessive gas and sourness, and gives finished baked goods undesirable open grain and poor texture (Michaelides, 2008). MATERIALS AND METHODS This study was based on the description and exploration of functional ingredients that can be added to bakery products. Classic bread-

89
making technology includes flour, water, yeast and salt, without the use of other additives. The bakery technology aims to provide the market with the most digestible products and to bring a high nutritional intake. The search included recent research articles, mainly about types of flour from different plants, vegetables, fruits, which can be mixed with wheat flour. Flour obtained from pumpkin seeds, potatoes, chickpeas, chia, hemp, coconut, bananas, are those that bring a high nutritional intake to bakery products. These flours were added as functional ingredients, not as a raw material in the product. The study was conducted for flour obtained from various fruits, vegetables, which raises the nutritional value of bakery products. RESULTS AND DISCUSSIONS FORTIFICATION OF FLOURS AND BAKERY PRODUCT
Fortification of bakery product refers to addition of certain bioactive or functional ingredients to the bakery product to enhance its nutritional and therapeutic value (Mudgil & Barak, 2020). In developed countries, the practice of adding micronutrients, such as vitamins B1, B2, B3 and iron, is recognized as an effective way to improve the nutritional profile (Grigoriu, 2019). The main active ingredients supplemented to bakery goods include probiotics and prebiotics (dietary fibres), antioxidants and phenolic compounds (Dziki, 2014). Other functional ingredients are oils and lipids, mineral and salts (Pinto et al., 2014). The ingredients play a crucial role for both the quality of the final product and its shelf-life (Difonzo, 2019). Table 1 shows the levels of these nutrients which should be present in the fortified food for each 100 calories contained in the food. The FDA (Food and Drug Administration) guidelines also allow nutrient addition to a food intended to replace a traditional food in the diet. The addition of nutrients to these substitute foods should be designed to prevent nutritional inferiority of the substitute food (Title 21 CFR Part 104, 1980).
Table 1. FDA - recommended fortification levels based on caloric standard (Quick and Murphy)
Nutrient USRDA* Level of nutrients per
100 kcal Protein (PER < casein), g 65 3.25 1/ Protein (PER > casein), g 45 2.25 1/ Vitamin A, IU 5000 250 Vitamin C, mg 60 3 Thiamin, mg 1.5 0.075 Riboflavin, mg 1.7 0.085 Niacin, mg 20 1 Calcium, g 1 0.05 Iron, mg 18 0.9 Vitamin D, IÜ 400 20 1/ Vitamin E, IU 30 1.5 Vitamin B6, mg 2 0.1 Folic acid, mg 0.4 0.02 Vitamin B12, mcg 6 0.3 Phosphorus, g 1 0.05 Iodine, mcg 150 7.5 1/ Magnesium, mg 400 20 Zinc, mg 15 0.75 Copper, mg 2 0.1 Biotin, mg .3 0.015 Pantothenic acid, mg 10 0.5 Potassium, g 2/ 0.125 Manganese, mg 2/ 0.2
1/ Optional 2/ No USRDA has been established for these nutrients *USRDA - Recommended Dietary Allowance (Federal Register 45(18); 6314-6324, 1980) Due to the excessive consumption of increasingly white flour, valuable and indispensable components of wheat are lost. Nutritionists claim that these lost components can be added to bread and bakery products in the baking phase of the technological process (Szilagyi, 2019). You can choose premixes with high quality vitamins and minerals with higher levels of homogeneity, flow and stability (Grigoriu, 2019). The main active ingredients supplemented to bakery goods include probiotics and prebiotics (dietary fibres), antioxidants and phenolic compounds (Dziki, 2014). Other functional ingredients are oils and lipids, minerals and salts, and vitamins (Pinto, 2014). Among these ingredients, probiotics and prebiotics are important in human nutrition because of their influences on the gastrointestinal (GI) microbiota. Probiotics are defined as ‘live microorganisms which confer a health benefit on the host when administered in adequate amounts’ (FAO/WHO, 2002). Prebiotics are short chain carbohydrates which are non-digestible by digestive enzymes in the upper GI

90
tract of humans, but are ‘consumed’ selectively by some types of bacteria (typically bifidobacteria and/or lactobacilli). Prebiotics can therefore enhance the activity of those beneficial bacteria (Al-Sheraji et al., 2013).The alleged health-promoting benefits of the aforementioned functional bakery products are diverse, e.g. reducing serum cholesterol and blood pressure, reducing the risk of coronary heart diseases, lowering the glycaemic response after food consumption, treating human intestinal barrier dysfunctions (Korem et al., 2017; Aleixandre, 2016; Quiros-Sauceda et al., 2014)
INNOVATIVE INGREDIENTS THAT BRING FUNCTIONAL CONTRIBUTION TO BAKERY PRODUCTS PUMPKIN SEED FLOUR Pumpkin seeds also known as pepitas are flat, dark green seeds encased in a yellow-white husk (Younis et al., 2000). The pumpkin seed contain substantial amounts of macro and micro minerals such as phosphorus, magnesium, potassium, calcium, zinc, iron and sodium (El-Adawy, 2001). In pumpkin seed flour, vitamin E is found in all forms: α-tocopherol, γ-tocopherol, σ-tocopherol, α-tocomonoenol and γ -tocomonoenol (Dabija, 2018). Research has shown that pumpkin seed flour can be used as a functional and nutritional ingredient in bakery products. The replacement of wheat flour with pumpkin flour in a proportion of 33% increased the nutritional and gustatory value of the muffins (Dabija, 2018). POTATO FLOUR Potato flour has been associated with the baking of bread for a long time and is known to help maintain the freshness of bread and provide a distinctive flavor. The addition of potato flour improves the interior qualities of bread, such as texture, aroma, and flavor, without significantly affecting exterior attributes (Narpinder, 2011). Potato flour was used successfully in a proportion of 20% to obtain bread, a high percentage of substitution has a negative role on the development of the dough (Dabija, 2018). The use of potato flour in bread results reduction in protein, fat, moisture content. Potato flour in bread increase
in fibre and carbohydrate contents as level of substitution of wheat flour with potato flour increased (Isaac, 2012). CHICKPEA FLOUR Chickpea is considered the 5th valuable legume in terms of worldwide economic standpoint and cheap source of legume protein which can be used as a substitute for animal protein (Ionescu et al., 2009). Chickpea flour is a good source of proteins, fibers, minerals and other bioactive compounds and it could be an ideal ingredient for improve the nutritional value of bread and bakery products (Man et al., 2015). The use of chickpea flour in the proportion of 10-20% in the manufacture of bread has led to improved development time and stability of the dough and the values of the parameters recorded on the dough extensograph (Dabija, 2018). Frequent consumption of chickpea flour products is considered an effective tool to reduce cardiovascular risk, type 2 flow, some cancers and obesity (Dabija, 2018). CHIA FLOUR Chia is grown commercially for its black and white seeds which are naturally rich in omega-3 fatty acids (FA), antioxidants, dietary fibre, protein, calcium and various other essential nutrients (Ixtaina et al., 2008). Chia is an excellent alternative as it is the richest known botanical source of alpha linolenic acid. It is also a low cost alternative for vegetarians (Ayerza & Coates, 2005). Chia seed flour has properties that can be used to improve the bread processing process, as it counterbalances the main problems caused by fiber during the manufacturing process. Chia flour in the proportion of 10% added to the mixture with wheat flour, can potentially be used to replace hydrocolloids that are often needed to make gluten-free bread, to ensure better structure and increased volume for baked goods, to obtain healthy nutritional products (Dabija, 2018). COCONUT FLOUR Coconut is one of the most important commercial crop in tropical areas and usually referred as ‘tree of heaven’ or ‘tree of abundance’. Coconut is also considered as a ‘functional food’ because it provides additional health benefits apart from its nutritional

91
constituents. Coconut flour is a unique product prepared from coconut residue obtained after the extraction of coconut milk. It is a rich healthy source of dietary fiber which can be used as bulking agents, filling agents and as a substitute for wheat, rice and potato flour at certain levels and the flour can also be incorporated into various food products like baked products, snack and extruded foods and steamed products (Rajendran & Mithra, 2013). It was found that the glycemic index of coconut flour supplemented foods decreased with increasing levels of dietary fiber from coconut flour (Trinidad et al., 2003; Trinidad et al., 2006). It was found that the amount of wheat flour used for noodles making in Asia accounts for about 40% of the total flour consumed, hence coconut flour can be incorporated up to 20% into wheat flour noodles in order to improve its health benefits (Gunathilake & Abeyrathne, 2008). HEMP FLOUR Hemp can be used as a raw material in the production of over 40 thousand types of products for the medical, food, textile, paper, construction, aviation, fuel and other lines of industry. The West is seeing a real boom around this culture: not only is it a focus of interest for private businesses, it is also the focus of large-scale government programs (Leizer et al., 2000). Before the hemp is used as a food ingredient, the hull is usually removed and treated seeds have a nutty flavour similar to pine nuts (Muenzing et al., 1999). With about 25% proteins represented by edestin, a highly digestive storage protein, hemp belongs to important source compared to soybean (Tang et al., 2006). Hemp seeds contain 30-32% oil, which is among the best food oils when ranked by their fatty acid profile. Fatty acids participate in the synthesis of prostaglandins, leukotriens and tromboxans, which regulate important bodily functions: arterial blood pressure, individual muscle contractions, body temperature, trombocyte aggregation (Callaway et al., 1996). The quality of the bread obtained by adding 15%, respectively 20% of partially defatted hemp flour was similar to that obtained from whole wheat flour, having a higher nutritional value, ensuring a higher intake of important nutrients, such as protein,
macroelements, microelements, especially iron. (Dabija A., 2019). BANANA FLOUR In Malaysia, not only consumed fresh, bananas are also often processed into several products such as banana crackers, dried banana chips, banana cake, etc. Earlier studies had revealed that banana contained antioxidant substances. Besides that, banana products (BP) also has been found to contain a potentially high amount of dietary fiber (Emaga et al., 2007; Wachirasiri et al., 2008). In addition, it has also been found that banana peel exhibit antibacterial and antifungal properties (Jain et al., 2011; Mokbel et al., 2005; Okonogi et al., 2007). In a study, Nasution (2012) indicated that banana peels contain valuable functional ingredients for human consumption, especially to be incorporated in bakery product such as wholemeal bread. The study was aimed to investigate the effect of substitution of wholemeal flour with banana peel flour on several properties of wholemeal bread. In obtaining bakery products, research was carried out to partially replace wheat flour with banana flour. Thus, by using banana flour in the bread recipe in the proportion of 10%, 15%, 20%, 25% and 30%, the finished product contained a large amount of potassium and fiber, a higher amount of polyphenols and improved antioxidant properties compared to bread obtained only from wheat flour (Dabija, 2019). CONSUMER INTEREST IN NEW BAKERY PRODUCTS Consumers show preference for certain foodstuffs considering the sensory, nutritional and health quality aspects, the same as personal preference and other elements (Pescud & Pettigrew, 2010; Luchs et al., 2011; Mason et al., 2011). Among consumers, the awareness and perceptions of older adults in relation to functional foods is of particular interest, as this population could greatly benefit from the incorporation of functional foods into their diets (Paulionis, 2008). Nutrition information sources on food labels, particularly health claims, are a valuable consumer educational tool that could influence acceptance of functional foods. Consumer

92
studies have demonstrated that the presence of health claims on functional food labels results in more favourable attitudes towards functional foods and has a positive influence on consumers’ perceived healthiness of functional foods (Sabbe et al., 2009). According to Mordor Intelligence forecasting, the global energy and functional food market is set to grow at a CAGR of 4.9% between 2019 and 2024. Plant-based, nutrient dense, prebiotic, probiotic, wholegrain, keto, collagen the healthy living market has soon become saturated by many different functional food types, each offering myriad health benefits, functionalities and flavors (Carnnet, 2020). The main trends in 2015 were: consumption of products with protein additives (vegetables and animals), which address several consumers, such as the elderly and athletes; weight management and well-being; gluten-free products, the area of interest expanding to healthy consumers (Mohan, Culețu, 2018). According to the study conducted by Mordor Intelligence, the following trends were observed globally. In Fortified bakery market - growth, trends, covid-19 impact, and forecasts (2021-2026) North America Dominate the Fortified Bakery Market. Global fortified bakery market is primarily dominated by North America followed by Europe, where the bakery products are considered as a staple food. The Chinese and Indian population are too increasing their demand for fortified bakery products, which are preferring high nutrition level despite being high on cost. The rising young population, along with busy, on-the-go lifestyles often dictates a need for quick meal, many opt for fast food options that are low in calories and high on health benefits and taste too. The Indian consumers want high nutrient content along with the taste such that they want full value for money on their fortified bakery products. Exploring bakery experience - with both global and regional tastes, nutritional authentic preparation method are on the rise in the developing countries, like India and China. CONCLUSIONS Research has shown that the use of fruit and vegetable flours (as pumpkin seed flour, potato flour, chickpea flour, chia flour, hemp flour,
coconut flour, banana flour) can improve the nutritional qualities of bakery products, as they have a high content of nutrients such as (vitamins, proteins, lipids, carbohydrates). The appropriate formula for introduction into the technological process must be found, so that their incorporation leads to finished products accepted by consumers. New techniques or methods need to be explored to improve the stability of the functional ingredients used in fortifying bakery products. The different ingredients assessed in this review have a high intake of nutrients, which are able to enrich the final products. In the last decade, a number of ingredients have been launched that are considered innovative and that meet consumer requirements for certain customized products. Thus, it was necessary to implement new technologies in the bakery industry. REFERENCES Al-Dmoor, H. M. (2012). Flat bread: ingredients and
fortification, Quality Assurance and Safety of Crops & Foods, 4, 2-8.
Alldrick, A. J. (2007). The Bakery: A potential leader in functional food applications. Functional Food News. http://www.functionalfoodnet.eu/images/site/assets/5-bread.pdf.
Altamirano-Fortoul, R., Moreno-Terrazas, R., Quezada-Gallo, A., Rosell, C.M. (2012). Viability of some probiotic coatings in bread and its effect on the crust mechanical properties. Food Hydrocolloids, 29(1):166-174.
Ares G, Gimenez A, Gambaro, A. (2009). Consumer perceived healthiness and willingness to try functional milk desserts. Influence of ingredient, ingredient name and health claim. Food Qual Prefer 2009, 20:50–56.
Ayerza R., & Coates, W. (2005). Ground chia seed and chia oil effects on plasma lipids and fatty acids in the rat. Nutrition Research, 25(11), 995-1003.
Beeren, C., Groves, K., & Pretima, M., 2019 Reducing Salt in Foods.
Belitz, H. D., Grosch, W., & Schieberle, P. (2004). Food Chemistry (3rd ed.). New York: Springer-Verlag Berlin Heidelberg.
Callaway. J. C. (2004). Hempseed as a nutritional resource: an overview. Euphytica: 65-72.
Carnnet L. (2020). Functional food bars have grown in popularity with consumers, as they seek products that help them reach their health and exercise goals. Natural Products Insider
Dabija A. (2018). Innovative raw materials for the bakery industry. Magazine of Bakers, Confectioners, Confectioners and Millers, 20-21.

93
Dabija, A. (2018). Innovative raw materials for the
bakery industry. Magazine of Bakers, Confectioners, Confectioners and Millers, 26-27.
Dabija, A. (2018). Innovative raw materials for the bakery industry (20). Magazine of Bakers, Confectioners, Confectioners and Millers, 28.
Dabija A. (2018). Innovative raw materials for the bakery industry. Magazine of Bakers, Confectioners, Confectioners and Millers, 38-39.
Dabija, A. (2018). Innovative raw materials for the bakery industry (24). Magazine of Bakers, Confectioners, Confectioners and Millers, 22-23.
Dabija, A. (2018). Innovative raw materials for the bakery industry (25). Magazine of Bakers, Confectioners, Confectioners and Millers, 24-25.
Dabija, A. (2018). Innovative raw materials for the bakery industry (32). Magazine of Bakers, Confectioners, Confectioners and Millers, 20-21.
Difonzo et al. (2019). Industrie Alimentari, 58, 2019, 10-15; Cappelli et al., Journal of Cereal Science 90, 2019, 102852.
Dziki, D. (2014). Current trends in the enhancement of antioxidant activity of wheat bread by the addition of plant materials rich in phenolic compounds. Trends in Food Science and Technology, 48-61.
El-Adawy, T. A. (2001). Characteristics and composition of watermelon, pumpkin, and paprika seed oils and flours. Journal of Agricultural and Food Chemistry, 49, 1253-1259.
Emaga, T. H., Andrianaivo, R. H., Wathelet, B., Tchango, J. T. & Paquot, M. (2007). Effects of The Stage of Maturation and Varieties on The Chemical Composition of Banana and Plantain Peels. Food Chemistry 103 (2007), p. 590-600.
Emaga, T. H., Robert, C., Ronkart, S. N., Wathelet, B. & Paquot, M.(2008). Dietary Fbre Components and Pectin Chemical Features of Peels During Ripening in Banana and Plantain Varieties. Bioresource Technology 99 (2008), p. 4346–4354.
Emaga, T.H., Ronkart, S.N., Robert, C., Wathelet, B. & Paquot, M. (2008). Characterisation of Pectins Extracted From Banana Peels (Musa AAA) Under Different Conditions Using an Experimental Design. Food Chemistry 108 (2008), p. 463–471.
Frewer. L., Scholderer. J., Lambert. N. (2003). Consumer acceptance of functional foods: issues for the future. Br Food J 2003, 105:714–731.
Grigoriu, A. M. The basics of fortifying wheat flour (5) Magazine of Bakers, Confectioners, Confectioners and Millers, 22-23.
Gunathilake K.D.P.P., Yalegana C., and Kumara A.A.N., (2009). Use of coconut flour as a source of protein and dietary fiber in wheat bread. Asian J. Food Agro-Industry, 382-391.
Hui, Y. (2006). Bakery Products: Science and Technology. Blackwell Publishing. Ionescu, A., Aprodu, I., Darabă, A., Gurău, G., Baciu,
C., Nichita, A. (2009). Chemical and Functional characterization of chickpea protein derivates. The Annals of the University “Dunarea de Jos” of Galati. Fascicle VI - Food Tehnology, New Series Year III (XXXIII):16-27.
Ixtania, V. Y., Nolasco, S.M., & Tomas, M.C. (2008). Physical proprieties of chia (Salvia hispanica L.) seeds. Industrial Crops and Products, 28(3), 286-293.
Jain, P., Bhuiyan, M .H., Hossain, K. R. & Bachar, S. C. (2011). Antibacterial and Antioxidant Activities of Local Seeded Banana Fruits. African Journal of Pharmacy and Pharmacology Vol. 5(11), 1398-1403.
Jones, P. J., & Jew, S. (2007). Functional food development: Conceptto reality. Trends in Food Science and Technology, 18, 387-390.
Kaur, S., & Das, M. (2011). Functional foods: an overview. Food Sci Biotechnol 20:861-875.
Kilcast D, & den-Ridder C. Sensory Issues in Reducing Salt in Food Products. In: Kilcast D, Angus F Eds. Reducing Salt in Foods: Practical Strategies. Boca Raton Boston, New York, Washinton DC: Woodhead Publishing Ltd. 2007; 201-20.
Leizer, C., D. Ribnicky, A. Poulev, S. Dushenkov & I. Raskin (2000). The Composition of Hemp Seed Oil and Its Potential as an Important Source of Nutrition. Journal Of Nutraceuticals Functional and Medical Foods. 35-53.
Leonte, M.., Moroi, M. A., Vartolomei, N., (2016). Ecological technologies and food products for milling, bakery, pastry, confectionery, Alma Mater Publishing House, Buzău, 133-137.
Leonte, M. (2003). Technologies, Equipment, Recipes and Quality Control, Millennium Publishing House. Piatra Neamț, 35-40.
Leonte, M. (2007). Technologies, Equipment, Recipes and Quality Control, Millennium Publishing House Ecozone, Iasi.
Malmo, C., La Storia, A., Mauriello, G. (2013). Microencapsulation of Lactobacillus reuteri DSM 17938 Cells Coated in Alginate Beads with Chitosan by Spray Drying to Use as a Probiotic Cell in a Chocolate Soufflé. Food Bioprocess Technology. 6(3):795-805.
Man, S., Paucean, A., Sevastița, M., Pop, A. (2015). Effect of the Chickpea (Cicer arietinum L.) Flour Addition on Physicochemical Proprietes of Wheat Bread. Bulletin of University of Agricultural Sciences and Veterinary Medicine Cluj-Napoca Food Science and Tehnology 72(1).
Mithra, A., Rajendran, S., Swamy, G., Chandrasekar, V. (2013). Coconut - Value Added Products: 31-32.
Mokbel, M.S. & Hashinaga, F. (2005). Antibacterial and Antioxidant Activities of Banana (Musa, AAA cv. Cavendish) Fruits Peel. American Journal of Biochemistry and Biotechnology 1(3). 126-132.
Mohan, G., Culețu, A. (2018). Innovative raw materials for the bakery industry. Magazine of Bakers, Confectioners, Confectioners and Millers, 28-29.
Muenzing, K., Twingelberg, H., Wessier, C. (1999). Investigation into the processing of hemp seeds for food. Getreide, Mehl und Brot:180-186.
Mudabbar, S., Shah, H. (2015). Processing of Wheat’s into Flour, https://agrihunt.com/articles/major-crops /processing-of-wheats-into-flour/
Mukhopadhyay, S., & Ramaswamy R. (2012). Application of emerging technologies to control Salmonella in foods: A review. Food Research International, 45, 666-677.

94
Oluwalana, B. I., Malomo, A. S., Ogbodogbo, OE.
(2012). Quality assessment of flour and bread from sweet potato wheat composite flour blends. International Journal of Biological and Chemistrical Sciences.
Okonogi, S., Duangrat, C., Anuchpreeda, S., Tachakittirungrod, S. and Chowwanapoonpohn, S. (2007). Comparison of Antioxidant Capacities and Cytotoxicities of Certain Fruit Peels. Food Chemistry 103, 839-846.
O’Shea, D. (2005). BE401 Industrial Bioprocessing - Module Notes [online] Available from: and Feed, 2nd Edition, Vol. 9.Paulionis L: The changing face of food and nutrition in Canada and the United States: opportunities and challenges for older adults. J Nutr Elder. 2008, 27: 277-295.
Pinto, D., Castro, I., Vicente, A., Bourbon, AI., Cerqueira, M.A. (2014). Chapter 25: Functional Bakery Products: An Overview and Future Perspectives. In: Zhou W, Hui YH, De Leyn I, et al., eds. Bakery Products Science and Technology: Second Edition. 431-452.
Pinto, S. S., Fritzen-Freire, C. B., Mun˜oz. I. B. et al. (2012). Effects of the addition of microencapsulated Bifidobacterium BB-12 on the J Food Sci Technol 123 properties of frozen yogurt. J Food Eng 111:563–569.
Popa, C. N., Tamba Berehoiu, R. M. (2018). Water activity and food stability. Magazine of Bakers, Confectioners, Confectioners and Millers, 24-25.
Rajarathnam. E., Narpinder. S. (2011). Use of potato flour in bread and flat bread. Flour and breads and their fortification in health and disease prevention.
Quick, A. J. & Murphy, W. E. (1982). The Fortification of Foods: A Review, https://naldc.nal.usda.gov/ download/CAT87209052/PDF
Reid, A.A., Champagne, C.P., Gardner, N., Fustier, P., Vuillemard, J.C. (2007). Survival in food systems of Lactobacillus rhamnosus R011 microentrapped in whey protein gel particles. Journal of Food Science. 72(1):31-37.
Sabbe, S., Verbeke, W., Deliza, R., Matta, V., Van Damme, P. (2009). Effect of a health claim and personal characteristics on consumer acceptance of fruit juices with different concentrations of acai (Euterpe oleracea mart). Appetite 2009, 53:84-92.
Sârbu, A. (2009). Food merchandise. Bread and other bakery products. A.G.I.R. Publishing House, Bucharest.
Siro`, I., Kapolna, E., Kapolna, B., & Lugasi, A. (2008). Functional food. Product development, marketing and consumeracceptance - A review. Appetite, 51, 456-467.
Shandilya, U.K. & Sharma, A. (2017). Functional foods and their benefits: an overview, Journal of Nutritional Health and Food Engineering, Vol. 7, No. 4, pp. 2-5.
Szilagyi, J. (2019). Enriching flours with vitamin and iron. Magazine of Bakers, Confectioners, Confectioners and Millers, 34-35. Tang, Ch. H., Ten, Z., Wang, X.S., Yang, X.Q. (2006). Physicochemical and functional proprieties of hemp (Cannabis sativa L.) protein isolate. J. Agri. Food Chem: 8945-8950.
Trinidad, T. P., Valdez, D. H., Loyola, A. S., Mallillin, A. C., Askali, F. C., Castillo, J. C., Masa, D. B., (2003). Glycaemic index of different coconut (Cocos nucifera)-flour products in normal and diabetic subjects. British Journal of Nutrition, 551-556.
Title 21 CFR Part 104, 1980. Nutritional quality of foods; addition of nutrients. Federal Register 45(18):6314-6324, January 25.
Tudoran, A., Olsen, S. O., Dopico, D. C. (2009). The effect of health benefit information on consumers health value, attitudes and intentions. Appetite. 568-579.
Van Hoek, P., A. Aristidou, J. Hahn & A. Patist (2003). Fermentation Goes Large-Scale [online].
Wachirasiri, P., Julakarangka, S. & Wanlapa, S. (2008). The Effects of Banana Peel Preparation on The Properties of Banana Peel Dietary Fibre Concentrate. Journal of Science and Technology. 605-611.
Winkler, A. & Nikoleski, D., EHEDG members, (2012). Ensuring water quality in food processing.Wang, J., Rosell, C.M., Barber, C.B. (2002). Effect of the addition of different fibres on wheat dough performance and bread quality. Food Chemistry. 79(2):221-226.
Younis, Y. M. H., Ghirmy, S. & Al-Shihry, S.S. (2000). African Cucurbita pepo L: Proprieties of seed and variability in fatty acid composition of seed oil. Pytochemistry, 54, 71-75.
Zhang, L., Schutyser, M. A. I. (2018). Recent developments in functional bakery products and the impact of baking on Active ingredients.
https://www.mordorintelligence.com/industry-reports/ fortified-bakery-market

95
HEALTH PROMOTING QUALITY OF THE ROMANIAN HONEY
Andra Lavinia NICHIȚEAN1, Diana CONSTANTINESCU-ARUXANDEI2*, Florin OANCEA2, 1*
1University of Agronomic Sciences and Veterinary Medicine of Bucharest,
59 Mărăști Blvd, District 1, Bucharest, Romania 2INCDCP-ICECHIM, 202 Spl. Independentei, Bucharest, Romania
*Corresponding authors emails: [email protected], [email protected]
Abstract Honey is a nutraceutical and its price is related to consumer perception on the health promoting quality. Last years, in the European Union, Romania was constantly present in the top three honey producers. The honey bee foraging areas from Romania support production of high-quality honey, because of their large biodiversity. The overlapping biogeography of Romania, which connects Central Europe, South-East-Europe and Eastern Europe is associated with a diversity of the agro-pedo-climatic condition, leading to large diversity of plant species producing nectar and pollen. A large area of meadows, still traditionally managed, offer further support for the biodiversity and honey bee foraging. Romania is on the top of the EU producers for entomophile oleaginous crops, rapeseed and sunflower. Forests cover more than one third of Romania, and they include Acacia and Tilia species, and produce large amount of polyphenol rich honeydew. However, the perception of the honey quality by foreign customers is still not in accordance with the Romanian honey quality. The aim of this paper is to review the published data regarding health promoting quality indicators of the Romanian honey, total polyphenols and flavonoids content, antioxidant and anti-bacterial activities, and to discuss the actions which are necessary in order to transform the biological activity into a higher profitability of the Romanian honey value chain. Key words: antioxidant activity, antibacterial activity, health promoting quality, honey, polyphenols. INTRODUCTION Honey is a nutraceutical and its consumption and price are driven by the perception of its health and wellness promoting characteristics (Ajibola et al., 2012). The combination of the bioactive phytochemicals, harvested and con-centrated by honeybee workers, and honeybee active proteins, released during honey formation, such as glucose oxidase (GOX) or defensin-1 (Def-1), were considered as being involved in the biological activity of honey (Kwakman et al., 2011). A special case of phytochemical is the methylglyoxal from New Zealand manuka honey. This type of honey is characterized for its antimicrobial effects and has a high price, proportionally to its biological effect, expressed as UMF (Unique Manuka Factor), which is associated with methylglyoxal (Adams et al., 2008; Mavric et al., 2008). The methylglyoxal was demonstrated to originate from the dihydroxyacetone, which is present in the nectar of manuka flowers Manuka honey, Leptospermum scoparium (Adams et al., 2009).
The honey bee foraging areas from Romania support production of high-quality honey (Juan-Borrás et al., 2014). Romania has a large biodiversity. The overlapping biogeography of Romania, which connects Central Europe, South-East-Europe and Eastern Europe is combined with a landscape which supports a mosaics of plant species, due to the heterogeneity of temperature and water supply (Sutcliffe et al., 2016). A large area of meadows, still traditionally managed (Dahlstrom et al., 2013), and low-intensity farming, further support biodiversity (Loos et al., 2014) and honey bee foraging. Such biodiversity, combined with heterogeneity of microclimatic conditions promotes bioactives accumulation (Oancea et al., 2013). The perennial weedy species, from meadows and step-asides areas, especially those of Lamiaceae and Boraginaceae, provide significant amount of nectars and phytochemicals, and offer opportunities for sustainable development of beekeeping and honey production (Ion et al., 2018).
Scientific Bulletin. Series F. Biotechnologies, Vol. XXV, No. 1, 2021ISSN 2285-1364, CD-ROM ISSN 2285-5521, ISSN Online 2285-1372, ISSN-L 2285-1364

96
Romania is on the top of the EU producers for entomophile oleaginous crops, rapeseed (Vasile et al., 2016) and sunflower (Turek Rahoveanu et al., 2018). Despite its low fructose/glucose ratio, which affects honey manipulation and storage, rapeseed honey contains polyphenols with a high biological value (Samborska et al., 2019). Sunflower honey, appreciated for its delicate flavor, has also a high content of antioxidants (Ozcan et al., 2017). Forests cover more than one third of Romania and have a biomass production potential above European average (Neumann et al., 2016). The melliferous potential of the silver linden tree (Tilia tomentosa) growing in the South of Romania average 318 kg.ha-1 (Ion et al., 2018). Acacia tree (Robinia pseudoaccacia) is considered the most valuable resource of the forests from South-East Romania (Vlad et al., 2012). Honeydew honey samples from North-East (Suceava) and North-West (Bihor) parts of Romania were proven to have a high content on valuable polyphenols, such as pinocembrin, chrysin, p-coumaric acid or myrecitin (Chis et al., 2016; Oroian et al., 2016). Romania is one of the largest producers of honey from the European Union (Pippinato et al., 2019). In the last years, exports significantly exceeded imports (Isopescu et al., 2018). However, this positive trade balance is rather associated with a price lower than the average EU price for honey (Popescu et al., 2018; Terin et al., 2018). Therefore, the profitability of the whole Romanian honey value chain is rather low, despite the fact that Romanian apiculture needs better profitability, to support sustainability and resilience. Beekeeping in Romania faces even more challenges than in other countries. Rainfed crops are predominant in Romanian agriculture. Such crop structure, combined with a increase risks of severe droughts, amplified by climate changes, could significantly affect agricultural yield (Trnka et al., 2010), including nectar and phytochemicals production. Aridity index increased in the last decades for fertile regions of Romania - Dobrogea and Bărăgan (Paltineanu et al., 2007), Oltenia Plain (Prăvălie et al., 2013). Only on Oltenia Plain (South-West of Romania) the area with aridization risk exceeds 700,000 hectares (Prăvălie et al., 2013).
Romanian forest capacity to generate renewable resources is influenced by relatively high share of illegal logging - which resulted also after changing in forest ownership and exploitation management (Bouriaud et al., 2016), legal management rules, which forbid tending and thinning (Bouriaud et al., 2016) and legacies of historical management (Munteanu et al., 2016). The melliferous potential of the main nectar producing trees, the silver linden tree and acacia, is affected not only by such factors, but also by climatic changes, especially drought (Vlad et al., 2012; Ion et al., 2018). The aim of this paper is to review the published data regarding health promoting quality indicators of Romanian honey, total polyphenols, and flavonoids content, individual phenolics, antioxidants, anti-bacterial activities, and to discuss the actions which are necessary in order to transform the biological activity into a higher profitability of the Romanian honey value chain. MATERIALS AND METHODS Data regarding honey production in Romania in the last 6 years (total production, honey production, honey consumption per capita) and competitiveness of Romanian honey production (imported and exported quantities, trade balance index, price of honey on Romanian market and export price) were obtained from Eurostat, International Trade Center, FaoStat and National Institute for Statistics. The data obtained were compared with those from recently published papers (Isopescu et al., 2017; Popescu et al., 2018; Terin et al., 2018). Data regarding Romanian honey composition and effects on human health were obtained from academic bibliographic database (ISI Web of Science Clarivate Analytics, Google Scholars, Scopus) using “polyphenols”, “honey”, “health effects” and “Romania” as the main keywords for queries. The analysis was focused on polyphenols (phenolic acids, flavonoids, polycyclic polyphenols), because the main honey phytochemicals generally accepted as being involved in health effects on humans are polyphenols (Bogdanov et al., 2008; Cianciosi
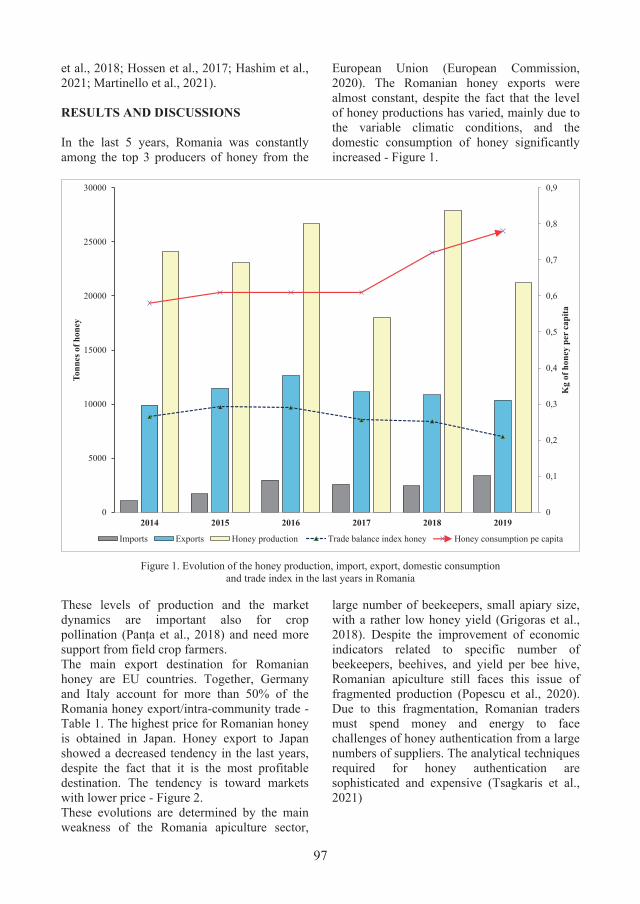
97
et al., 2018; Hossen et al., 2017; Hashim et al., 2021; Martinello et al., 2021). RESULTS AND DISCUSSIONS In the last 5 years, Romania was constantly among the top 3 producers of honey from the
European Union (European Commission, 2020). The Romanian honey exports were almost constant, despite the fact that the level of honey productions has varied, mainly due to the variable climatic conditions, and the domestic consumption of honey significantly increased - Figure 1.
Figure 1. Evolution of the honey production, import, export, domestic consumption
and trade index in the last years in Romania
These levels of production and the market dynamics are important also for crop pollination (Panța et al., 2018) and need more support from field crop farmers. The main export destination for Romanian honey are EU countries. Together, Germany and Italy account for more than 50% of the Romania honey export/intra-community trade - Table 1. The highest price for Romanian honey is obtained in Japan. Honey export to Japan showed a decreased tendency in the last years, despite the fact that it is the most profitable destination. The tendency is toward markets with lower price - Figure 2. These evolutions are determined by the main weakness of the Romania apiculture sector,
large number of beekeepers, small apiary size, with a rather low honey yield (Grigoras et al., 2018). Despite the improvement of economic indicators related to specific number of beekeepers, beehives, and yield per bee hive, Romanian apiculture still faces this issue of fragmented production (Popescu et al., 2020). Due to this fragmentation, Romanian traders must spend money and energy to face challenges of honey authentication from a large numbers of suppliers. The analytical techniques required for honey authentication are sophisticated and expensive (Tsagkaris et al., 2021)
0
0,1
0,2
0,3
0,4
0,5
0,6
0,7
0,8
0,9
0
5000
10000
15000
20000
25000
30000
2014 2015 2016 2017 2018 2019
Kg
of h
oney
per
cap
ita
Tonn
es o
fhon
ey
Imports Exports Honey production Trade balance index honey Honey consumption pe capita

98
Table 1. The main destination of Romanian honey export
Source: www.trademap.org, accessed at 21.04.2021
Figure 2. The evolution of the Romanian honey export
price. Source: www.trademap.org, accessed at 21.04.2021
In order to better valorize Romanian honey, it is important to emphasize its quality. The willingness-to-pay a higher price was demonstrated to be related to the perception of the high-quality and not to other sustainability indicators such as organic certified production or biodegradable packaging (Bissinger et al., 2021). Therefore, efforts are needed to demonstrate the quality of Romanian honey. Because honey is a nutraceutical, its quality must be related to the biological properties such as the antioxidant and antimicrobial activity, which are further correlated with honey bioactives, especially polyphenols. There are several examples of honey which reached high price after scientific publications of papers which demonstrated their beneficial effects for human health. We already mentioned manuka honey and its UMF (Unique
Manuka Factor), which is associated with methylglyoxal and the antibacterial properties of this honeydew honey (Adams et al., 2009). Another example of expensive honey, due to its effects on human health, is the Mediterranean bitter honey, originating from strawberry-tree (Arbutus unedo L.). This type of honey has a high content of arbutin and polyphenols (Oses et al., 2020). Arbutin undergoes in vivo a hydrolysis to its aglycone, which is a hydroquinone, i.e., an oxidized polyphenol. Therefore, the antibacterial and anti-oxidant activity of honey could be related mainly to its polyphenols content. The polyphenols content, in relation to the specific colloidal structure of honey, which generates a crowded space of the aqueous pockets. In this crowded water pocket polyphenols interact with honey specific proteins, glucose-oxidase (GOX) or defensin-1 (Def-1). This interaction is believed to be essential for the biological activity of honey (Brudzynski, 2020; Brudzynski & Sjaarda, 2021). One of the first studies to characterize the antioxidant properties and polyphenols content of Romania honey was the work of Marghitas et al. (Al et al., 2009). The honeydew had by far the highest polyphenols content, similar to other honey samples from European reports, while the content for floral honey was reported to be lower than the samples reported by other Non-European and European groups. We compared the values of polyphenols content for honey from Romania and other countries and we think that the conclusion was a little bit hasty, as the values reported by Beretta et al., 2005 were both higher and lower than those reported for Romania samples. Indeed, the honey samples from more “exotic” sources such as Malaysian Gelam and Coconut honeys or African samples presented an apparent higher content of polyphenols. We believe that a more reliable comparison could be obtained by analyzing the samples simultaneously and with exactly the same protocol, being known that the Folin-Ciocâlteau method is a very sensitive to interferences and not very specific to polyphenols. Cimpoiu et al. (2013) performed a detailed investigation on the characteristics of 26 commercial Romanian honeys with different
Export destination
% of Export 2019 Average price
Price evolution 2019 vs average price 2015-2019
World 100% 3,76€ 5%
Germany 37% 3,61€ 5%Italy 17% 3,70€ 4%Japan 8% 5,54€ -17%Denmark 4% 3,86€ 16%France 8% 3,90€ 20%Spain 6% 3,97€ 10%Poland 5% 3,47€ -7%Austria 4% 3,30€ 4%United Kingdom 4% 3,68€ 2%Belgium 1% 3,06€ -11%Others 5% 4,08€ -27%
37,34%
17,26%
7,56%4,26%
8,34%6,18%5,18%3,88%3,72%1,10%5,00%
€ 3,61€ 5,54
€ 3,86 € 3,97 € 3,47 € 3,68
€ -€ 1,00 € 2,00 € 3,00 € 4,00 € 5,00 € 6,00
0%5%
10%15%20%25%30%35%40%
Romania honey exportsaverage 2014-2019
% of Export 2019 Average price

99
floral origins. Several physical (color intensity, pH, ash content) and biochemical (protein, free amino acid and total phenolic content (TPC), antioxidant activity) were measured and statistically analyzed, and the correlation between TPC and the antioxidant activity was performed. The results showed that Romanian honey has a high antioxidant activity and contains high amounts of valuable compounds. The study also showed that, based on their characteristics, the honeys investigated could be separated in clusters depending on their floral origin. Moreover, high correlation between TPC and the antioxidant activity was obtained, polyphenols contributing with 85.6% to the antioxidant activity. The results from a more recent study, in which honeydew honey samples from Romania were compared with honey samples from Poland and previous studies confirm that the geographical area and specific climate conditions also influence the phenolic content, beside the origin of honey. The total phenolic and flavonoids content were high and similar between the two countries and highly correlated with the radical scavenging activity (Ma et al., 2016). Oroian et al. (2016) determined for the first time a detailed phenolic profile of honeydew honey samples from the N-E region of Romania (Suceava county) and identified many important polyphenols, with quercetin and pinocembrin in the highest amount (Oroian et al., 2016). Unfortunately, neither the antioxidant activity nor a comparison with other honey samples was performed, so an interpretation from a correlation point of view is not possible. Nevertheless, the high content of polyphenols suggests high antioxidant capacity. Other parameters responsible for establishing the quality of Romanian honey have been also investigated: composition (total water insoluble matter, diastase and invertase, reducing and easily hydrolysable sugars, volatile organic compounds, and palynological evaluation, as well as the hydroxymethyl furfural (HMF) content, the level of polycyclic aromatic hydrocarbons, and metal levels, adulteration degree, presence of antibiotics and physico-chemical parameters (moisture, electrical conductivity, rheological parameters). These
quality parameters were recently reviewed by Isopescu et al., 2017. Another important biological effect of Romanian honey, the antimicrobial activity, has been also studied in various research papers. It is long known that honey can have significant antimicrobial activity, but its effectiveness was generally shown to depend on honey type and strain specificity. In general, the antibacterial activity is more studied than the antifungal activity of honey, due to the risks raised by the antibiotic resistant bacteria, and this is the case also for the Romanian honey. There is a high demand for new antibacterial formulations to be used in treating or preventing wounds infections. Most Romanian honey types were found to be active against most of the pathogenic bacteria investigated. The most active anti-bacterial honey types were found to be the poly-floral, forest, manna and sunflower honey, while the acacia and linden are generally reported to have moderate antibacterial effects (Fiț et al., 2010; Bobis et al., 2011; Vica et al., 2014; Junie et al., 2016). Some groups reported antibacterial activity against certain strains comparable to the best antibiotics, for some honey types such as forest and poly-floral ones (Fiț et al., 2010). The exact mechanism of the antibacterial activity of honey is not completely known, but there seem to be numerous factors contributing such as enzymatic production of hydrogen peroxide, acidity, pH, high viscosity, low water activity, phytochemicals and other biomolecules, defensin-1, osmotic pressure caused by sugars, etc. A group of Romanian researchers compared several types of honey samples with an artificial honey sample composed of 40.5% fructose, 33.5% glucose, 7.5% maltose, 1.5% sucrose and 17% sterile deionized water. The artificial honey samples, which could be called a natural deep eutectic solvent (NaDES), had no inhibitory effect on any of the eight bacterial species investigated. Contrary to this, all honey samples inhibited to some degree the bacteria strains, the best antibacterial activity capacity was observed for the poly-floral, manna and sunflower and the lowest capacity had the linden and acacia honey. There was a strong correlation between the antibacterial activity and the honey color, the darker honey samples being more effective than the lighter honey

100
(Junie et al., 2016). The dark color has been shown to be related to pigments and phytochemicals such as carotenoids and flavonoids, based on good correlations between the color and these components (Alvarez-Suarez et al., 2010), which indicates that their contribution to the antibacterial activity is significant.
Table 2. Polyphenols content of Romania honey Honey type Region Pollen type
(%) Polyphenols (mg/100g)
Acacia Lime
Sun-flower Honeydew1
- -
TPH (2.00-39.00) TPH (16.00-38.00) TPH (20.00-45.00) TPH (23.00-125.00)
Honeydew2 Bihor County - TPH (147.0 ± 25.4)
FV (15.5 ± 0.5)
Honeydew3 N-E
Romania (Suceava)
B. napus (18.1) Quercus (14.3) T. repens(11.8) C. sativa (8.6) H. annuus
pinocembrin (0.3-4.4) quercetin (0.1-2.8) gallic acid (0.02-0.3) galangin (0.02-0.5) myricetin (0-0.4) p-coumaric acid (0-4.4) chrysin (0-0.16) caffeic acid (0-1.9) apigenin (0-1.1) kaempferol (0-0.6) isorhamentin (0-0.12) luteolin (0-0.11)
Acacia Polyflora Lime Forest Sea Buckthorne Sunflower4
- -
TPH (0.76 ± 0.12) TPH (0.78 ± 0.07) TPH (1.04 ± 0.13) TPH (2.38 ± 0.37) TPH (1.33 ± 0.17) TPH (1.17 ± 0.23)
1(Al et al., 2009) 2(Ma et al., 2016) 3(Oroian et al., 2016) 4(Cimpoiu et al., 2013) Table 2 summarizes some of the mentioned values for polyphenols content reported in different Romania honey samples. All studies on Romania honey samples indicate that the majority of them conform to the regulation of the European Union, having similar physico-chemical properties to other European honey samples (Isopescu et al., 2014), and that they present high content of valuable bioactive compounds and high antioxidant activities, which mainly correlate with the total content of polyphenols (Cimpoiu et al., 2013). The antioxidant activity, together with the total phenolic content and individual phenolics, were recently demonstrated to be effective for authentication of Romanian honey (Pauliuc et al., 2020). The presented data demonstrate that it is possible to improve the perception of the Romanian honey as being a high quality honey,
with significant health benefits. Association of the health benefits with the polyphenols content and antimicrobial and/or antioxidant activity could offer a tool similar to UMF, which could further improve the Romanian honey export price. CONCLUSIONS Romania is constantly among the top 3 honey producers in European Union. The export price for Romanian honey is rather low, mainly because the traders’ efforts are orientated towards counter-acting the structural honey market weakness, such as large number of beekeepers and small apiary size, with a rather low honey yield. The perception of honey quality by the foreign customers is still not in accordance with the Romanian honey quality. Manuka honey and Mediterranean bitter honey are examples of honey with high price generated by scientific knowledge. Such examples could be followed also for Romanian honey. The content of polyphenols and antioxidant activity could be used not only for the authentication of Romanian honey, but also for substantiation of the beneficial effects on human health. ACKNOWLEDGEMENTS This work was funded by the project POC-A1-A1.2.3-G-2015- P_40_352-SECVENT, Sequential processes to close bioeconomy side stream and innovative bioproducts resulted from these, contract 81/2016, funded by cohesion funds of the European Union, subsidiary project 2236/2017. REFERENCES Adams, C. J., Boult, C. H., Deadman, B. J., Farr, J. M.,
Grainger, M. N. C., Manley-Harris, M., & Snow, M. J. (2008). Isolation by HPLC and characterisation of the bioactive fraction of New Zealand manuka (Leptospermum scoparium) honey. Carbohydrate Research, 343(4), 651-659. https://doi.org/10.1016/j.carres.2007.12.011
Adams, C. J., Manley-Harris, M., & Molan, P. C. (2009). The origin of methylglyoxal in New Zealand manuka (Leptospermum scoparium) honey. Carbohydrate Research, 344(8), 1050-1053. https://doi.org/10.1016/j.carres.2009.03.020
Ajibola, A., Chamunorwa, J. P., & Erlwanger, K. H. (2012). Nutraceutical values of natural honey and its

101
contribution to human health and wealth. Nutrition & Metabolism, 9(1), 61. doi:10.1186/1743-7075-9-61
Al, M. L., Daniel, D., Moise, A., Bobis, O., Laslo, L., & Bogdanov, S. (2009). Physico-chemical and bioactive properties of different floral origin honeys from Romania. Food Chemistry, 112(4), 863-867. https://doi.org/10.1016/j.foodchem.2008.06.055
Alvarez-Suarez, J. M., Tulipani, S., Díaz, D., Estevez, Y., Romandini, S., Giampieri, F., . . . Battino, M. (2010). Antioxidant and antimicrobial capacity of several monofloral Cuban honeys and their correlation with color, polyphenol content and other chemical compounds. Food and Chemical Toxicology, 48(8), 2490-2499. https://doi.org/10.1016/j.fct.2010.06.021
Beretta, G., Granata, P., Ferrero, M., Orioli, M., & Maffei Facino, R. (2005). Standardization of antioxidant properties of honey by a combination of spectrophotometric/fluorimetric assays and chemometrics. Analytica Chimica Acta, 533(2), 185-191. https://doi.org/10.1016/j.aca.2004.11.010
Bissinger, K., & Herrmann, R. (2021). Regional Origin Outperforms All Other Sustainability Characteristics in Consumer Price Premiums for Honey: Empirical Evidence for Germany. Journal of Economic Integration, 36(1), 162-184. doi:10.11130/jei.2021.36.1.162
Bobis, O., Al, L., Mărghitaş, Dezmirean, D., Chirilă, F., & Moritz, R. (2011). Preliminary Studies Regarding Antioxidant and Antimicrobial Capacity for Different Types of Romanian Honeys (Vol. 68).
Bogdanov, S., Jurendic, T., Sieber, R., & Gallmann, P. (2008). Honey for Nutrition and Health: A Review. Journal of the American College of Nutrition, 27(6), 677-689. doi:10.1080/07315724.2008.10719745
Bouriaud, L., & Marzano, M. (2016). Conservation, Extraction and Corruption: Is Sustainable Forest Management Possible in Romania? Natural Resource Extraction and Indigenous Livelihoods: Development Challenges in an Era of Globalization, 221-240.
Bouriaud, O., Marin, G., Bouriaud, L., Hessenmöller, D., & Schulze, E.-D. (2016). Romanian legal management rules limit wood production in Norway spruce and beech forests. Forest Ecosystems, 3(1), 20. doi:10.1186/s40663-016-0079-2
Brudzynski, K. (2020). A current perspective on hydrogen peroxide production in honey. A review. Food Chemistry, 332, 127229. https://doi.org/10.1016/j.foodchem.2020.127229
Brudzynski, K., & Sjaarda, C. P. (2021). Colloidal structure of honey and its influence on antibacterial activity. Comprehensive Reviews in Food Science and Food Safety, 20(2), 2063-2080.
Chis, A. M., Purcarea, C., Dzugan, M., & Teusdea, A. (2016). Comparative Antioxidant Content and Antioxidant Activity of Selected Romanian and Polish Honeydew Honey. Revista De Chimie, 67(2), 214-218. Retrieved from <Go to ISI>://WOS:000372170700002
Cianciosi, D., Forbes-Hernandez, T. Y., Afrin, S., Gasparrini, M., Reboredo-Rodriguez, P., Manna, P. P., . . . Battino, M. (2018). Phenolic Compounds in Honey and Their Associated Health Benefits: A
Review. Molecules, 23(9), 20. doi:10.3390/molecules23092322
Cimpoiu, C., Hosu, A., Miclaus, V., & Puscas, A. (2013). Determination of the floral origin of some Romanian honeys on the basis of physical and biochemical properties. Spectrochimica Acta Part A: Molecular and Biomolecular Spectroscopy, 100, 149-154. https://doi.org/10.1016/j.saa.2012.04.008
Dahlstrom, A., Iuga, A.-M., & Lennartsson, T. (2013). Managing biodiversity rich hay meadows in the EU: a comparison of Swedish and Romanian grasslands. Environmental Conservation, 40(2), 194-205. doi:10.1017/S0376892912000458
Fiț, N., Răpuntean, G., Pantrea, S. L., Nadăș, G., Chirilă, F., Roba, D., . . . Criste, A. (2010). Antibacterial Effect of Honey on Staphylococci Species Isolated. Bulletin of University of Agricultural Sciences and Veterinary Medicine Cluj-Napoca. Veterinary Medicine, 66(1). doi:10.15835/buasvmcn-vm:66:1:3939
Grigoras, M. A. (2018). SWOT analysis of Romania's apiculture. Scientific Papers-Series Management Economic Engineering in Agriculture and Rural Development, 18(4), 129-141. Retrieved from <Go to ISI>://WOS:000454318300020
Hashim, K. N., Chin, K. Y., & Ahmad, F. (2021). The Mechanism of Honey in Reversing Metabolic Syndrome. Molecules, 26(4), 16. doi:10.3390/molecules26040808
Hossen, M. S., Ali, M. Y., Jahurul, M. H. A., Abdel-Daim, M. M., Gan, S. H., & Khalil, M. I. (2017). Beneficial roles of honey polyphenols against some human degenerative diseases: A review. Pharmacological Reports, 69(6), 1194-1205. doi:10.1016/j.pharep.2017.07.002
Ion, N., Coman, R., & Ion, V. (2018). Melliferous potential of silver linden trees (Tilia tomentosa moench.) growing in the forests from south Romania. Scientific Papers-Series A-Agronomy, 61, 474-480.
Ion, N., Odoux, J.-F., & Vaissière, B. E. (2018). Melliferous Potential of Weedy Herbaceous Plants in Crop Fields of Romania from 1949 to 2012. 62(2), 149. https://doi.org/10.2478/jas-2018-0017
Isopescu, R., Josceanu, A., Minca, I., Colta, T., Postelnicescu, P., & Mateescu, C. (2014). Characterization of Romanian Honey Based on Physico-Chemical Properties and Multivariate Analysis. Revista De Chimie, 65, 381-385.
Isopescu, R. D., Josceanu, A. M., Colta, T., & Spulber, R. (2017). Romanian Honey: Characterization and Classification. In V. D. A. A. D. Toledo (Ed.), Honey Analysis (pp. 27-62): IntechOpen.
Jean Vasile, A., Raluca Andreea, I., Popescu, G. H., Elvira, N., & Marian, Z. (2016). Implications of agricultural bioenergy crop production and prices in changing the land use paradigm—The case of Romania. Land Use Policy, 50, 399-407. https://doi.org/10.1016/j.landusepol.2015.10.011
Juan-Borrás, M., Domenech, E., Hellebrandova, M., & Escriche, I. (2014). Effect of country origin on physicochemical, sugar and volatile composition of acacia, sunflower and tilia honeys. Food Research

102
International, 60, 86-94. https://doi.org/10.1016/j.foodres.2013.11.045
Junie, L., Vica, M., Mirel, G., & Matei, H. (2016). Physico-chemical characterization and antibacterial activity of different types of honey tested on strains isolated from hospitalized patients. J. Apic. Sci, 60, 5-18. doi:10.1515/jas-2016-0013
Kwakman, P. H. S., te Velde, A. A., de Boer, L., Vandenbroucke-Grauls, C. M. J. E., & Zaat, S. A. J. (2011). Two Major Medicinal Honeys Have Different Mechanisms of Bactericidal Activity. PLOS ONE, 6(3), e17709. doi:10.1371/journal.pone.0017709
Loos, J., Dorresteijn, I., Hanspach, J., Fust, P., Rakosy, L., & Fischer, J. (2014). Low-Intensity Agricultural Landscapes in Transylvania Support High Butterfly Diversity: Implications for Conservation. PLOS ONE, 9(7), e103256. doi:10.1371/journal.pone.0103256
Ma, C., Purcarea, C., Dzugan, M., & Teuşdea, A. (2016). Comparative antioxidant content and antioxidant activity of selected Romanian and Polish honeydew honey. Revista De Chimie, 2, 214-218.
Martinello, M., & Mutinelli, F. (2021). Antioxidant Activity in Bee Products: A Review. Antioxidants, 10(1), 37. doi:10.3390/antiox10010071
Mavric, E., Wittmann, S., Barth, G., & Henle, T. (2008). Identification and quantification of methylglyoxal as the dominant antibacterial constituent of Manuka (Leptospermum scoparium) honeys from New Zealand. Molecular Nutrition & Food Research, 52(4), 483-489. doi:10.1002/mnfr.200700282
Munteanu, C., Nita, M. D., Abrudan, I. V., & Radeloff, V. C. (2016). Historical forest management in Romania is imposing strong legacies on contemporary forests and their management. Forest Ecology and Management, 361, 179-193. http://dx.doi.org/10.1016/j.foreco.2015.11.023
Neumann, M., Moreno, A., Thurnher, C., Mues, V., Härkönen, S., Mura, M., . . . Hasenauer, H. (2016). Creating a Regional MODIS Satellite-Driven Net Primary Production Dataset for European Forests. Remote Sensing, 8(7), 554. Retrieved from http://www.mdpi.com/2072-4292/8/7/554
Oancea, A., Roată, G., Popescu, S., Păun, L., Mateescu, I., Toma, A. E., . . . Sidoroff, M. (2013). Phytochemical screening of the bioactive compounds in the most widespread medicinal plants from calarasi - silistra cross -Border area. Bulletin of the Transilvania University of Brasov, Series II: Forestry, Wood Industry, Agricultural Food Engineering, 6(2), 135-142. Retrieved from https://www.scopus.com/inward/record.uri?eid=2-s2.0-84916627820&partnerID=40&md5=cb3cf24457010bb603398ff26b25ff07
Oroian, M., Ropciuc, S., Amelia, B., Paduret, S., & Sanduleac, E. (2016). PHENOLIC PROFILE OF HONEYDEW HONEYS FROM THE NORTH-EAST PART OF ROMANIA. Bulletin UASVM Food Science and Technology, 73, 105-110. doi:10.15835/buasvmcn-fst:12316
Oroian, M., Ropciuc, S., Buculei, A., Paduret, S., & Todosi, E. (2016). Phenolic Profile of Honeydew
Honeys from the North-East Part of Romania. Bulletin of University of Agricultural Sciences and Veterinary Medicine Cluj-Napoca-Food Science and Technology, 73(2), 105-110. doi:10.15835/buasvmcn-fst:12316
Oses, S. M., Nieto, S., Rodrigo, S., Perez, S., Rojo, S., Sancho, M. T., & Fernandez-Muino, M. A. (2020). Authentication of strawberry tree (Arbutus unedo L.) honeys from southern Europe based on compositional parameters and biological activities. Food Bioscience, 38, 9. doi:10.1016/j.fbio.2020.100768
Ozcan, M. M., Al Juhaimi, F., Uslu, N., Ghafoor, K., & Babiker, E. F. (2017). A traditional food: Sunflower (Helianthus annuus L.) and Heather Calluna vulgaris (L.) Hull honeys. Indian Journal of Traditional Knowledge, 16(1), 78-82. Retrieved from <Go to ISI>://WOS:000392163800009
Paltineanu, C., Mihailescu, I. F., Seceleanu, I., Dragota, C., & Vasenciuc, F. (2007). Using aridity indices to describe some climate and soil features in Eastern Europe: a Romanian case study. Theoretical and Applied Climatology, 90(3), 263-274. doi:10.1007/s00704-007-0295-3
Panța, N. D. (2018). Honey Market Dynamics. The Case of Romania. Management of Sustainable Development, 10(2), 13-16.
Pauliuc, D., Dranca, F., & Oroian, M. (2020). Antioxidant Activity, Total Phenolic Content, Individual Phenolics and Physicochemical Parameters Suitability for Romanian Honey Authentication. Foods (Basel, Switzerland), 9(3), 306. doi:10.3390/foods9030306
Pippinato, L., Di Vita, G., & Brun, F. (2019). Trade and comparative advantage analysis of the EU honey sector with a focus on the Italian market. Quality-Access to Success, 20(S2), 485-492.
Popescu, A. (2018). Honey production and trade before and after Romania's accession into European Union. Scientific Papers-Series Management, Economic Engineering in Ariculture and Rural Development, 18(4), 10.
Popescu, A., Dinu, T. A., Stoian, E., & Serban, V. (2020). Bee honey production concentration in Romania in the EU-28 and global context in the period 2009-2018. Scientific Papers-Series Management Economic Engineering in Agriculture and Rural Development, 20(3), 413-429. Retrieved from <Go to ISI>://WOS:000581113800047
Prăvălie, R., Peptenatu, D., & Sirodoev, I. (2013). The impact of climate change on the dynamics of agricultural systems in south-western Romania. Carpathian Journal of Earth and Environmental Sciences, 8(3), 175-186.
Samborska, K., Jedlińska, A., Wiktor, A., Derewiaka, D., Wołosiak, R., Matwijczuk, A., . . . Witrowa-Rajchert, D. (2019). The Effect of Low-Temperature Spray Drying with Dehumidified Air on Phenolic Compounds, Antioxidant Activity, and Aroma Compounds of Rapeseed Honey Powders. Food and Bioprocess Technology. doi:10.1007/s11947-019-02260-8
Sutcliffe, L. M. E., Germany, M., Becker, U., & Becker, T. (2016). How does size and isolation affect patches

103
of steppe-like vegetation on slumping hills in Transylvania, Romania? Biodiversity and Conservation, 25(12), 2275-2288. doi:10.1007/s10531-016-1108-8
Terin, M., Yıldırım, İ., Aksoy, A., & Sarı, M. (2018). Competition power of Turkey’s honey export and comparison with Balkan Countries. Bulgarian Journal of Agricultrual Sciences, 24(1), 17-22.
Trnka, M., Eitzinger, J., Dubrovsky, M., Semeradova, D., Stepanek, P., Hlavinka, P., . . . Zalud, Z. (2010). Is rainfed crop production in central Europe at risk? Using a regional climate model to produce high resolution agroclimatic information for decision makers. Journal of Agricultural Science, 148, 639-656. doi:10.1017/s0021859610000638
Tsagkaris, A. S., Koulis, G. A., Danezis, G. P., Martakos, I., Dasenaki, M., Georgiou, C. A., & Thomaidis, N. S. (2021). Honey authenticity: analytical techniques, state of the art and challenges.
Rsc Advances, 11(19), 11273-11294. doi:10.1039/d1ra00069a
Turek Rahoveanu, A., Turek Rahoveanu, M. M., & Ion, R. A. (2018). Energy crops, the edible oil processing industry and land use paradigms in Romania–An economic analysis. Land Use Policy, 71, 261-270. https://doi.org/10.1016/j.landusepol.2017.12.004
Vica, M. L., Glevitzky, M., Dumitrel, G.-A., Junie, L. M., & Popa, M. (2014). Antibacterial activity of different natural honeys from Transylvania, Romania. Journal of environmental science and health. Part. B, Pesticides, food contaminants, and agricultural wastes, 49(3), 176-181. doi:10.1080/03601234.2014.858008
Vlad, V., Ion, N., Cojocaru, G., Ion, V., & Lorent, A. (2012). Model and support system prototype for scheduling the beehive emplacement to agricultural and forest melliferous resources. Scientific Papers. Series A. Agronomy, LV, 410-415.

104
COMPARATIVE ANALYSIS OF ESTIMATED SHELF LIFE,
APPROACHING ACCELERATED AGING METHODS
Catalin BILBIE1, Andra GHIZDAREANU1, 2
1Expergo Business Network SRL, 6 Radu Calomfirescu, District 3, 030216, Bucharest, Romania
2Politehnica University of Bucharest, Faculty of Material Science and Engineering, District 6, 060042, Bucharest, Romania
Corresponding author email: [email protected]
Abstract The aim of the research was to compare the shelf life of fruit smoothies, obtained by two different accelerated aging methods. An accelerated shelf life test (ASLT) was conducted, and various quality indicators were measured during this time, such as: pH, titratable acidity, colour, total aerobic count (TAC) and sensory analysis. The test was performed on smoothie beverages purchased from Romanian market for 24 days, the samples being stored at three different temperatures: 5°C, 10°C and 15°C. The analysis of the quality parameters showed that the pH, titratable acidity and the measurement of colour suffered a minor value modification, while the TAC number increased as the storage temperature increased. The results of the research were analysed using Arrhenius equation and Q10 Rule. The TAC changes followed an apparent first-order kinetics, their rates and activation energies were estimated from the experimental data (as a plot of temperature vs time). The fruit smoothies had an estimated shelf life of about 57 days (at 5°C) and 50 days (at 7°C) using the Arrhenius equation and an estimated shelf life about 49 days using the Q10-Rule, after extrapolating the data to real temperature conditions. Key words: Accelerated shelf life, Arrhenius, Q10. INTRODUCTION Shelf life may be defined as the time in which a food product is considered safe for consump-tion. Consumer acceptability of a food product may be a critical parameter to determine its shelf life (Freitas & Costa, 2006). Shelf life is commonly estimated by two different stability testing procedures: real time stability tests (which are time consuming and expensive if the product has a long-term shelf life) and accelerated stability tests (those can be successfully used for stable products having short and long expected shelf life). Therefore, the products are tested under accelerated conditions to increase the rate of chemical, microbiological and/or physical degradation (Haouet et al., 2018). Sensory tests are the most important tests to be carried out during a shelf life study to assess the changes in perceived product attributes during storage. The changes in the attributes will relate directly to the stability of the product. If the sensory changes are not caused by microbial growth and spoilage, as for the
most part of the cases, the degree of change in sensory characteristics must be directly related to product acceptability. Both analytical and hedonic sensory tests can be used to gain knowledge about product stability (Kilcast, 2000). In ASLT, a product is stored at elevated stress conditions (such as temperature, humidity, and pH) (Man, 2002). The simplest and most used method of ASLT is based on employing only a single factor to expedite the deterioration process. The sim-plicity of such a method is related to both the experimental procedure and the extrapolation of data (Steele, 2004). ASLT is applicable to any deterioration process that has a valid kinetic model. That process may be chemical, physical, biochemical or microbiological. The principles of the ASLT will be the same in all cases. To predict the actual shelf life, one needs to know or to evaluate how the deterioration process behaves as a function of time (Mizrahi, 2004). In order to determine the shelf life of a product, it is important to understand the relationship
Scientific Bulletin. Series F. Biotechnologies, Vol. XXV, No. 1, 2021ISSN 2285-1364, CD-ROM ISSN 2285-5521, ISSN Online 2285-1372, ISSN-L 2285-1364

105
between different factors affecting its shelf life (Subramaniam, 2007). Among many potential accelerating factors, temperature is the most used within ASLT (Fu, 1997). ASLT using various kinetic models are useful for assessing the effects of temperature changes on product quality (Jedermann et al., 2009). Each product has a specific mode of spoilage (i.e. rancidity, moisture loss/gain, organoleptic changes), so every study is tailored to the specific product (Haouet et al., 2018). The aim of this study was to compare the shelf life of the smoothie beverage with the estimated results obtained by two different accelerated aging methods. Another objective was to study the influence of the temperature difference (increased in small stages) over the shelf life. The fruit smoothies were tested for about a month at various temperatures (5C, 10C and 15C) and data obtained with ASLT was calculated through reaction order, Arrhenius equation and Q10 Rule.
MATERIALS AND METHODS All reagents used in the experiments were of analytical grade. Fruit smoothies generally have a short shelf life (of about 20 days) and are usually preserved by mild pasteurization. The samples tested in this study, were preserved by HPP technology and had a shelf life of 60 days, according to the package. The fruit smoothies can deteriorate by microbiological growth, physical-chemical degradation and sensory changes like: loss of colour and flavour. The composition of the tested samples was as follows: 40% banana, 31% pineapple juice, 10% orange juice, 7% apple juice, 7% coconut milk, 5% lemon juice. After purchasing the fruit smoothies (from Romanian market) the samples were immediately analysed and then stored under refrigeration conditions (at 5C) in a refrigerator and thermal stress conditions at 10C and 15C (under UV light) in a climatic test cabinet TK 120 (Nuve). During storage, analyses were performed every six days for 24 days. The parameters affecting the microbiological, chemical and sensory quality of the smoothie were analysed in triplicates.
A. Physical-chemical analyses Colour measurement (spectrophotometric method) The colour of a fruit smoothie is an important quality criterion. In some fruit smoothies a relatively light colour is expected for a good quality, such as apple or grape juices. However, in red/black fruit smoothie a deep red/purple colour is expected (Turker, 2004; Rocha, 2003). The colour was determined spectrophotometrically by measuring the absorbance or transmission in the visible region of the spectrum using a UV-VIS (Shimandzu) spectrophotometer. For products having a yellow/brown colour (apple, pear, white grape juices) the absorbance is measured at 430 nm, while for products having a red/black colour (blackcurrant, raspberry juices) the absorbance is measured at 520 nm, according to IFU Analysis No. 80/2010. Determination of colour index To give an indication of the extent of oxidative browning of the anthocyanin pigments in red/black juices, the measurement of the “brown index” is employed. It is determined by the next formula (1) using the ratio between the absorbances of the product at 430 nm and 520 nm (Muche et al., 2018). Brown Index=𝑨𝑨𝑨𝑨𝑨𝑨𝑨𝑨𝑨𝑨𝑨𝑨𝑨𝑨𝑨𝑨𝑨𝑨𝑨𝑨𝑨𝑨𝑨𝑨 (1) For products of a red/black colour the “blue index” is also measured, which is the ratio between the absorbances at 580 nm and 520 nm (2). Absorbance was measured after diluting the fruit smoothies with distilled water (1:10). Blue Index=𝑨𝑨𝑨𝑨𝑨𝑨𝑨𝑨𝑨𝑨𝑨𝑨𝑨𝑨𝑨𝑨𝑨𝑨𝑨𝑨𝑨𝑨𝑨𝑨 (2) The conductivity and the pH determination A 50 ml volume of each sample were placed in Berzelius flask. The conductivity and the pH of the smoothie samples were determined using a digital pH/EC/TDS/Temperature Meter-HI 991301 (Hanna Instruments). Acidity value (AV) The method is used for the determination of the citric acid in liquid food products by titration with sodium hydroxide 0.1 N. Each 10 ml of
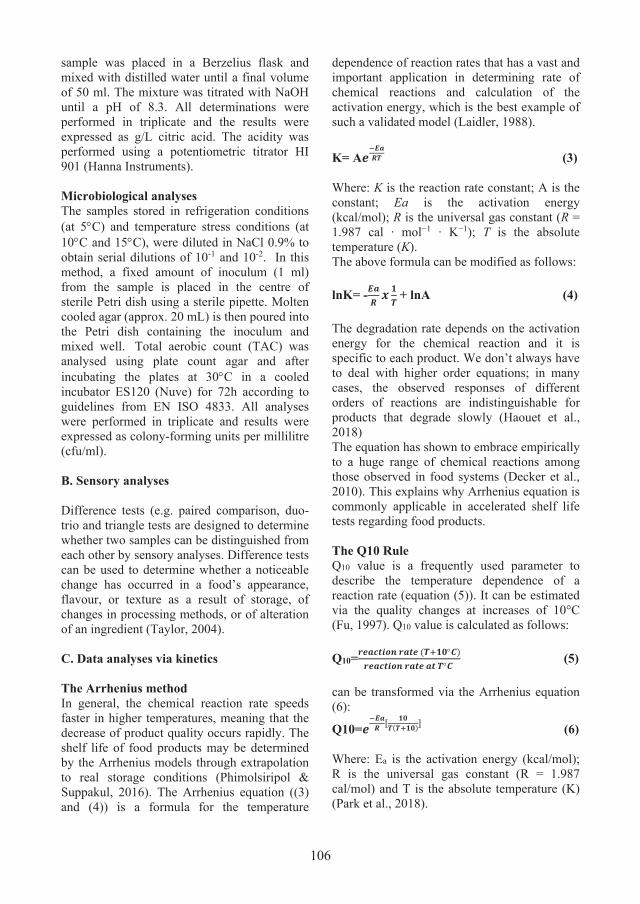
106
sample was placed in a Berzelius flask and mixed with distilled water until a final volume of 50 ml. The mixture was titrated with NaOH until a pH of 8.3. All determinations were performed in triplicate and the results were expressed as g/L citric acid. The acidity was performed using a potentiometric titrator HI 901 (Hanna Instruments). Microbiological analyses The samples stored in refrigeration conditions (at 5C) and temperature stress conditions (at 10C and 15C), were diluted in NaCl 0.9% to obtain serial dilutions of 10-1 and 10-2. In this method, a fixed amount of inoculum (1 ml) from the sample is placed in the centre of sterile Petri dish using a sterile pipette. Molten cooled agar (approx. 20 mL) is then poured into the Petri dish containing the inoculum and mixed well. Total aerobic count (TAC) was analysed using plate count agar and after incubating the plates at 30C in a cooled incubator ES120 (Nuve) for 72h according to guidelines from EN ISO 4833. All analyses were performed in triplicate and results were expressed as colony-forming units per millilitre (cfu/ml). B. Sensory analyses Difference tests (e.g. paired comparison, duo-trio and triangle tests are designed to determine whether two samples can be distinguished from each other by sensory analyses. Difference tests can be used to determine whether a noticeable change has occurred in a food’s appearance, flavour, or texture as a result of storage, of changes in processing methods, or of alteration of an ingredient (Taylor, 2004). C. Data analyses via kinetics The Arrhenius method In general, the chemical reaction rate speeds faster in higher temperatures, meaning that the decrease of product quality occurs rapidly. The shelf life of food products may be determined by the Arrhenius models through extrapolation to real storage conditions (Phimolsiripol & Suppakul, 2016). The Arrhenius equation ((3) and (4)) is a formula for the temperature
dependence of reaction rates that has a vast and important application in determining rate of chemical reactions and calculation of the activation energy, which is the best example of such a validated model (Laidler, 1988). K= A𝒆𝒆
−𝑬𝑬𝑬𝑬𝑹𝑹𝑹𝑹 (3)
Where: K is the reaction rate constant; A is the constant; Ea is the activation energy (kcal/mol); R is the universal gas constant (R = 1.987 cal ∙ mol−1 ∙ K−1); T is the absolute temperature (K). The above formula can be modified as follows: lnK= -𝑬𝑬𝑬𝑬
𝑹𝑹 𝒙𝒙 𝟏𝟏𝑹𝑹 + lnA (4)
The degradation rate depends on the activation energy for the chemical reaction and it is specific to each product. We don’t always have to deal with higher order equations; in many cases, the observed responses of different orders of reactions are indistinguishable for products that degrade slowly (Haouet et al., 2018) The equation has shown to embrace empirically to a huge range of chemical reactions among those observed in food systems (Decker et al., 2010). This explains why Arrhenius equation is commonly applicable in accelerated shelf life tests regarding food products. The Q10 Rule Q10 value is a frequently used parameter to describe the temperature dependence of a reaction rate (equation (5)). It can be estimated via the quality changes at increases of 10°C (Fu, 1997). Q10 value is calculated as follows: Q10=
𝒓𝒓𝒆𝒆𝑬𝑬𝒓𝒓𝒓𝒓𝒓𝒓𝒓𝒓𝒓𝒓 𝒓𝒓𝑬𝑬𝒓𝒓𝒆𝒆 (𝑹𝑹+𝟏𝟏𝟏𝟏𝑪𝑪)𝒓𝒓𝒆𝒆𝑬𝑬𝒓𝒓𝒓𝒓𝒓𝒓𝒓𝒓𝒓𝒓 𝒓𝒓𝑬𝑬𝒓𝒓𝒆𝒆 𝑬𝑬𝒓𝒓 𝑹𝑹𝑪𝑪 (5)
can be transformed via the Arrhenius equation (6):
Q10=𝒆𝒆−𝑬𝑬𝑬𝑬
𝑹𝑹 [ 𝟏𝟏𝟏𝟏𝑹𝑹(𝑹𝑹+𝟏𝟏𝟏𝟏)] (6)
Where: Ea is the activation energy (kcal/mol); R is the universal gas constant (R = 1.987 cal/mol) and T is the absolute temperature (K) (Park et al., 2018).

107
RESULTS AND DISCUSSIONS Triangle test and the training program for panellists - this is a critical element in achieving the successful operation of the program. Without sensory training the panellist’s judgements will be based on their own preferences. The panellists were trained using a reference product to illustrate the target quality, also varying degrees of deviation (Kilcast, 2010). Panellists are provided with three coded samples, one different and two identical, and asked to select the different sample. Panellists are required to select the different sample even if they cannot discern any differences among the samples. The panellists received 2 sets of samples:
- In the first set of samples they received two glasses with the fruit smoothie at 5°C and one glass with the fruit smoothie at 10°C (as the different sample). - In the second set of samples they received two glasses with the fruit smoothie at 5°C and one glass with the fruit smoothie at 15°C (as the different sample). The two different samples (A and B) are presented to the panellists in sets of three. Panellists receive either two A's and one B, or two B's and one A. The three samples are presented in identical sample containers coded with 3-digit random numbers. All three code numbers on the samples presented to each panellist must be different, even though two of the samples are identical. The responses of the panellists are presented in Table 1.
Table 1. The number of the correct responses for the triangle test
Where: n - the number of panellists; - risk level; x - the number of correct responses for the first set of samples; y - the number of correct responses for the second set of samples.
If the number of correct responses is greater than or equal to 10, according to SR EN ISO 4120:2007 (value corresponding to the number of panellists - n, and to the risk level chosen for the test - α), it was concluded that perceptible difference exists between the samples. Under a null hypothesis the test statistic follows an F distribution to each source of variability, we can associate a p-value (significance level of 5%) that indicates the consensus amongst panellists for the sensory attributes (Lê, 2014). It was concluded that perceptible difference exists between the samples. From Table 1 it was concluded that there is a perceptible difference in the last day of the test
for the samples stored at 10°C and 15°C. The changes in colour The increase of temperature and longer storage periods caused not only reduced anthocyanin concentrations (the blue index decreased) but also other changes including, brown colour development and haze formation. The correlation between the changes of colour and temperatures is presented in Table 2. The colour of the samples was monitored during storage at 5°C, 10°C and 15°C for 24 days. The brown colour and blue colour development are presented in Figure 1 and Figure 2.
Day n X Y 0 18 0.05 1 2 6 18 0.05 5 6
12 18 0.05 5 8 18 18 0.05 9 10 24 18 0.05 13 15

108
Figure 1. Change of browning index during storage at different temperatures for 24 days
Figure 2. Change of blue index during storage at different temperatures for 24 days
The chemical and microbiological changes Extrapolation from stressed testing conditions to ambient conditions is usually performed ba-sed on established relationships between kinetic parameters and the storage environment. In general, the rate of chemical reactions will accelerate at higher temperatures, which means the decrease in product quality is faster. TAC
and AV are critical quality parameters that affect the changes in fruit smoothies. The correlation between the chemical and microbiological parameters and temperature is presented in Table 2. The shelf life is determined based on extrapolation to the storage temperature in the reaction order equation (Nurhayati et al., 2017).
Table 2. Chemical and microbiological properties (pH, conductivity, TAC and AV) of fruit smoothies during storage at different temperatures (5°C, 10°C and 15°C) for 24 days
The zero-order reaction is obtained by plotting the quality changes with time (TAC vs Storage time) and (AV vs Storage time). The first order reaction is obtained by plotting (1/TAC vs Storage time) and (1/AV vs Storage time). The second order reaction is obtained by plotting (ln (TAC) vs Storage time) and (ln (AV) vs Storage time). From these plots we obtain the
rate of degradation (k) for the samples stored in stress condition. The selection of reaction order of TAC and AV, in fruit smoothies is done by obtaining a determination coefficient (R2>0.9) in each linear regression equation. The R2 values were higher than 0.9 for the zero-order reaction, values presented in Figure 3 and Figure 4.
Temperature Day pH AV [g/L] TAC [cfu/ml] Conductivity [mS]
5°C
0 3.95 5.268 <1
>3,999 6 3.94 5.290 <1
12 3.94 5.321 <1 18 3.92 5.382 <1 24 3.92 5.401 19
10°C
0 3.95 5.268 <1
>3,999 6 3.93 5.290 <1
12 3.91 5.374 10 18 3.90 5.391 17*103 24 3.89 5.421 1.03*104
15°C
0 3.95 5.268 <1
>3,999 6 3.92 5.301 17
12 3.90 5.395 1.06*104 18 3.89 5.505 2.3*105 24 3.87 5.390 15.91*106

109
Figure 3. Change of TAC values, during storage at different temperatures
Figure 4. Change of AV values, during storage at different temperatures
The correlation between temperature and rate of degradation can be seen after determining the value of K (rate constant) and Ea (activation energy) in the Arrhenius plot equation for the TAC and AV changes, seen in Figure 5 and Figure 6. For the Arrhenius model we plot the k (degradation rate) from the Zero Order kinetic
equation with 1/T (temperature in Kelvin) obtaining the following linear regression equation: ln K = −𝐸𝐸𝐸𝐸𝑅𝑅
1𝑇𝑇 − ln 𝐴𝐴 (7)
where ln A is intercept and Ea/R is the slope (Wahyuni et al., 2018).
Figure 5. Linear regression curve for Arrhenius plot (TAC)
Figure 6. Linear regression curve for Arrhenius plot (AV)
Q10 and Ea were calculated allowing to obtain a predictive evaluation of the product shelf life at the recommended temperature. The
parameters for the kinetic model are presented in Table 3.
Table 3. The parameters for the kinetic model Quality indicator Temperature T (°Kelvin) Reaction order Constant K Ea (kcal/mol) Q10
TAC 278.15
Zero order 0.1509
13.71 2.05
279.15 0.1615 1.90 280.15 0.1748 1.77
AV 278.15
Zero order 0.0033
22.63 3.26
279.15 0.0037 2.89 280.15 0.0042 2.56

110
We extrapolated the data to the real temperature conditions and estimated the shelf life by using both Arrhenius equation and Q10 Rule equation (we used only the
microbiological changes, because these had a faster evolution than the acidity value). The results are presented in Table 4.
Table 4. Estimated shelf life according to storage temperature using the Arrhenius equation and Q10 Rule equation
CONCLUSIONS After analysing the quality changes associated with increased values of the temperature and estimated the shelf life by using these two methods (based on extrapolation to storage temperature), we obtained a minimum shelf life of the fruit smoothies of 49 days at 5°C for the Q10 Rule and 58 days for the Arrhenius equation. If the temperature increases by 1°C the estimated shelf life of fruit smoothie decreases by 3-4 days and if the temperature increases by 2°C the estimated shelf life of fruit smoothie decreases by 7-8 days. From the data obtained we observed that the Q10 Rule equation can provide us the minimum durability of the product and that the Arrhenius equation can provide us the maximum shelf life. REFERENCES Decker, E. A., Elias, R. J., & McClements, D. J. (Eds.).
(2010). Oxidation in foods and beverages and antioxidant applications: management in different industry sectors. Elsevier.
Fu, B., & Labuza, T. P. (1997). Shelf-life testing: procedures and prediction methods. In Quality in frozen food (pp. 377-415). Springer, Boston, MA.
Freitas, M. A., & Costa, J. C. (2006). Shelf life determination using sensory evaluation scores: A general Weibull modeling approach. Computers & Industrial Engineering, 51(4), 652-670.
Haouet, M. N., Tommasino, M., Mercuri, M. L., Benedetti, F., Di Bella, S., Framboas, M., ... & Altissimi, M. S. (2018). Experimental accelerated shelf life determination of a ready-to-eat processed food. Italian journal of food safety, 7(4).
IFU Analysis No. 80:2010 - International Federation of Fruit Juice Producers.
Jedermann, R., Ruiz-Garcia, L., & Lang, W. (2009). Spatial temperature profiling by semi-passive RFID loggers for perishable food transportation. Computers and Electronics in Agriculture, 65(2), 145-154.
Kilcast, D. (2000). Sensory evaluation methods for shelf-life assessment. In The stability and shelf-life of food (pp. 79-105). Woodhead Publishing.
Kilcast, D. (Ed.). (2010). Sensory analysis for food and beverage quality control: a practical guide. Elsevier
Laidler, K. J. (1988). Chemical Kinetics, (Harper and Row, New York, 1987). b) AA Frost, RG Pearson, Kinetics and Mechanism, second ed., Wiley, New York, 88.
Lê, S., & Worch, T. (2014). Analyzing sensory data with R. CRC Press.
Man, D. (2002). Food Industry briefing series: Shelf life. Blachwell Science Ltd Ed. UK.
Mizrahi, S. (2004). Accelerated shelf-life tests. Understanding and measuring the shelf-life of food, 318-339.
Muche, B. M., Speers, R. A., & Rupasinghe, H. P. (2018). Storage temperature impacts on anthocyanins degradation, color changes and haze development in juice of “Merlot” and “Ruby” grapes (Vitis vinifera). Frontiers in nutrition, 5, 100.
Nurhayati, R., NH, E. R., Susanto, A., & Khasanah, Y. (2017, April). Shelf Life Prediction for Canned Gudeg using Accelerated Shelf Life Testing (ASLT) Based on Arrhenius Method. In IOP Conference Series: Materials Science and Engineering (Vol. 193, No. 1, p. 012025). IOP Publishing.
Park, J. M., Lee, S. H., Koh, J. H., & Kim, J. M. (2018). Determination of Shelf Life Model of Pork Cutlet and Pork Lard during Accelerated Storage Conditions. Korean journal for food science of animal resources, 38(4), 664
Phimolsiripol, Y., & Suppakul, P. (2016). Techniques in shelf life evaluation of food products.
Rocha, A. M. C. N., & Morais, A. M. M. B. (2003). Shelf life of minimally processed apple (cv. Jonagored) determined by colour changes. Food control, 14(1), 13-20
Steele, R. (Ed.). (2004). Understanding and measuring the shelf-life of food. Woodhead Publishing.
SR EN ISO 4120:2007 - Sensory Analysis-Methodology- Triangle test.
Subramaniam, P. (2007). Determining Shelf Life of Confectionery Products. Manufacturing Confectioner, 87(6), 85.
Taylor, S. L. (2004). Sensory evaluation practices. Turker, N., Aksay, S., & Ekiz, H. İ. (2004). Effect of
storage temperature on the stability of anthocyanins of a fermented black carrot (Daucus carota var. L.)
Temperature (°C) Estimated shelf life (days) Estimated shelf life (days) using Arrhenius eq using Q10 eq
5°C 57.51 49.12 6°C 53.41 45.62 7°C 49.41 42.62

111
beverage: shalgam. Journal of Agricultural and Food Chemistry, 52(12), 3807-3813.
Wahyuni, S. et al. (2018, February). Estimation of shelf life of wikau maombo brownies cake using
Accelerated Shelf Life Testing (ASLT) method with Arrhenius model. In IOP Conference Series: Earth and Environmental Science (Vol. 122, No. 1, p. 012082). IOP Publishing.

112

113
MEDICAL AND PHARMACEUTICAL BIOTECHNOLOGY

114

115
A REVIEW OF CONTAMINATION CONTROL IN PHARMACEUTICAL
INDUSTRY IN THE CURRENT SARS-COV-2 PANDEMIC CONTEXT
Ruxandra-Daniela DUMITRU, Oana LIVADARIU*
University of Agronomic Sciences and Veterinary Medicine of Bucharest, 59 Mărăști Blvd, District 1, Bucharest, Romania
*Corresponding author email: [email protected]
Abstract The objective of this paper is to assess whether the contamination control measures already being applied in the pharmaceutical industrial production are efficient enough in the context of a viral pandemic, such as the SARS-CoV-2 pandemic of 2020-2021. The questions that must be asked are linked to the efficacy of already existing virucides against the newly discovered viral strand and whether there is a need for supplementary precautions in regards with the workers that have direct contact with the finished product or operate the machines that package the finished goods. The discussion will revolve around the efficacy of current protocols of disinfection, the need for workers’ continuous and rigorous training, and the transparency in which quality control must be implemented, as to ensure the public’s trust in the industrial process. Key words: SARS-CoV-2 pandemic, protocols of disinfection, pharmaceutical industrial production. INTRODUCTION The importance of discussing the safety of industrially obtained goods in the context of a viral pandemic is immediate, especially since the SARS-CoV-2 pandemic still has a great deal or resonance at a global scale. Moreover, the repercussions of this pandemic are yet to be felt in the coming months. The pharmaceutical industry has always been harshly conditioned by the law and in regards to protocols that need to be followed for a rigorous contamination and quality control and assurance, these laws are quite explicit – the European Pharmacopoeia would be a good reference (Council of Europe, 2021). The FMEA (Failure Mode and Effects Analysis) systems of all pharmaceutical production facilities have a great contribution to not only delivering safe products to the patients, but also, in ensuring the protection of their own employees (Greulich & Hardy, 2009; American Bureau of Shipping, 2015). However, in the previously mentioned context of a viral pandemic the question that arises is whether all these measures are enough in order to ensure the stop of the viral spread. Even though the world has experienced previous challenges with similar viruses, such as SARS-CoV and MERS-CoV, the novel SARS-CoV-2 has been proven to be a lot more contagious,
thus making its spread, a lot harder to control (Wang et al., 2020) causing this pandemic to become an unprecedented worldwide situation. In the case of MERS-CoV, for example, even though the mortality rate was considerably higher than for SARS-CoV-2 (36% for MERS-CoV and 2.84% for SARS-CoV-2), the transmission did not occur at such intensity, most of the world never really having to deal with it (Sun et al., 2020; Liang et al., 2018). It is important to understand that most manufacturers do have strict hygiene norms that are meant to protect employees from accidental poisonings and prolonged exposure to chemicals and to ensure that no contamination becomes the products, neither within their production, nor upon their packaging (Vijay et al., 2020). Another aspect that deserves attention is the fact that some studies have demonstrated that the new Coronavirus can remain viable for quite a relevant period of time on various surfaces and in wastewater, thus it is transmission does not necessary have to be immediate, from infected human to a healthy human via droplet route (Wiktorczyk-Kapische et al., 2021). It is clear that the purity standards that all the products being manufactured in a pharmaceutical facility are being subjected to,
Scientific Bulletin. Series F. Biotechnologies, Vol. XXV, No. 1, 2021ISSN 2285-1364, CD-ROM ISSN 2285-5521, ISSN Online 2285-1372, ISSN-L 2285-1364

116
render a very low possibility on the finished good being a SARS-CoV-2 transmission vector. However, in order to prevent a viral outbreak within the factory, the staff must comply not only with the usual hygiene protocol, but to understand the implications of not respecting it, since even the PPE (Personal Protection Equipment) can carry a viral load for quite some time if not properly disinfected, as demonstrated on single-use masks, nitrile gloves, plastic and more by Kasloff et al. (2021). The objective of this review is to assess the risk that is linked to the SARS-CoV-2 virus paths of transmission and hopefully provide manufacturers with much more compiled, reliable information, so that they may protect not only their businesses but also the very important work force that effectively conducts the activity on site and whose presence is impetuous.
MATERIALS AND METHODS This review was based strictly on theoretical research. The materials used are represented by scientific publications of researchers and authorities from around the world which were compared in order to reach a common ground and draw the necessary conclusions in order to formulate some recommendations that are relevant to the pharmaceutical production in the context of the SARS-CoV-2 pandemic.
RESULTS AND DISCUSSIONS LEGAL SURROUNDINGS After scrutinizing the legal aspects presented on different official EU websites, such as www.ema.europa.eu, as well as US websites, such as www.osha.gov it is clear that the authorities have not deemed necessary to enforce any special protocols, in regards to the SARS-CoV-2 pandemic, other than minimizing the risk of spreading the virus through physical contact, which would have been needed in order to obtain different kinds of authorisations. Therefore, existing documents may have received a validity extension, while the process of obtaining new such documents has either been postponed to a safer ulterior period or has
been enabled via electronic online methods (EMA, 2020). It is clear that the production process in itself, especially when it comes to pharmaceuticals is very well regulated and clean, including from a microbiological standpoint. The manufacturers therefore need to be responsible and have been allowed to carry on with their very important activities, provided that they prevent outbreaks. In order to do such thing each manufacturer has been given a free hand in managing their own plants. Of course, the WHO (World Health Organization) recommendations are a very helpful start point (WHO, 2021), but if one is to ask more than one producer what steps they have been taking in stopping the spread of the virus inside their facilities, one may notice that the strategies can be very different from one another. RECOMMENDATIONS ON MANAGING ESSENTIAL WORKERS In the United States of America, the CDC (Center for Disease Control) has issued a number of recommendations from OSHA (Occupational Safety and Health Administration) with the intention of helping the manufacturers that operate in the essential industries better manage the pandemic situation (OSHA, 2021). Amongst other, recommendations such as wearing a mask, practicing social distancing and disinfection of shared working spaces are indeed a must. However, any employee that has had recent contact with another person that has been tested positive should not attend work for 5 to 6 days (OSHA, 2021) even if the employee does not have any symptoms, as it has been demonstrated that the incubation period for the virus can vary. The pool average incubation period for SARS-CoV-2 discovered through a review which includes numerous peer reviewed studies was about 6 days (Wassie et al., 2020). Another research showed that even though the rate of transmission for asymptomatic carriers was much lower than for symptomatic carriers, there is still a hard to ignore risk for the spread of the disease (Liu et al., 2020). Therefore, the working space should be redesigned as to help in respecting the

117
recommended social distance between workers, the work stations should be thoroughly disinfected before each shift begins and the facility should be well ventilated in order to minimize spread via droplets (ECDC, 2020). There is extended research demonstrating the viability of the virus on different types of materials, such as: cardboard (24 hours), steel and plastics (2-3 days); and also in aerosols - 3-4 hours (Aghalari et al., 2021). This piece of information underlines the extreme necessity of strict disinfection protocols and of air ventilation in the workplace, even if the effective infection of an individual can only occur when the virus reaches some type of mucus membranes (nose, eyes, mouth) as sustained by Fernández-Raga et al. (2020). The personnel should always have at hand some kind of efficient disinfectant and should be instructed to use it as often as possible during their shift. Substances that have proven themselves efficient against the COVID-19 virus include: >70% concentration alcohol based solutions, 0.1% sodium hypochlorite, 0.5% hydrogen peroxide (Wiktorczyk-Kapischke et al., 2021). The National Institute of Technology and Evaluation (NITE), in a study conducted in 2020 have presented other substances that have been proven effective in neutralizing the virus such as: sodium linear alkylbenzene sulfonates (0.1% or more), alkyl glycosides (0.1% or higher), alkyldimethylamine oxide (0.05% or higher), benzalkonium chloride (0.05% or higher), benzethonium chloride (0.05% or higher), dialkyldimethylammonium chloride (0.01% or higher), polyoxyethylene alkyl ether (0.2% or higher), potassium soap (0.24% or higher), sodium soap (0.22% or higher).It should be emphasized that a recommendable exposure time of the possibly infected surface to the disinfectant is at least 30 seconds (Rabenau et al., 2004; Kampf et al., 2020). Even though SARS-CoV-2 is very adaptable to a wide range of pH values (3-10), at room temperature, it is also highly susceptible to standard disinfection protocols (Chin et al., 2020). Also, any objects or pieces of equipment that are not individual, but shared, such as phones, keyboards, mouses, barcode scanners etc., present a higher risk to become a transmission path for the disease and therefore it is strongly
recommended that they be disinfected after each use (Bloise et al., 2020). Another important issue that needs to be addressed is the traceability of any confirmed cases within the facility. For this, the employer must not only inform all of their employees of the known symptoms of the disease, but also to ensure that they trace every person that may have come in contact with the infected person and advise them to remain at home for the recommended time period, and if possible test themselves. Any worker that presents any kind of symptoms either when presenting at the facility to start their shift, or developing them during their shift should be sent home immediately along with any other worker that may have been put at risk (OSHA, 2021). To be noticed that the planning of the shifts should also be made in such a way that allows the employer to be able to continue the production process even if some of the workers have to be sent home, by each department. COVID-19 symptoms include: coughing, dyspnoea, fever, anosmia, headaches and fatigue; and this information should be on display at all times. (Antonelli et al., 2021). If any employees have been traveling to a red or dark red zone, they should be advised to undergo testing or self-isolate, though traveling is not recommended unless there is an immediate need for it (Council of the EU, 2021). Even though there have previously been certain confrontations with viral pandemics (6 influenza pandemics between 1889 and 2009 for example), since the SARS-CoV-2 pandemic is present on a global scale and the modern world we live in is the perfect environment for a much faster spread rate, some manufacturers around the world have never been involved in the efforts to stop such a spread as per the present scenario (Monto & Webster, 2013). A comparison between WHO recommendations, OSHA recommendations and CDC recommendations can be observed in Table 1. By this comparison, one can observe that OSHA (OSHA, 2021) did concentrate on workplace aspects, while WHO (WHO, 2021) and CDC (CDC, 2021) have a more general approach, with recommendations that may suit the general public in all possible endeavours.
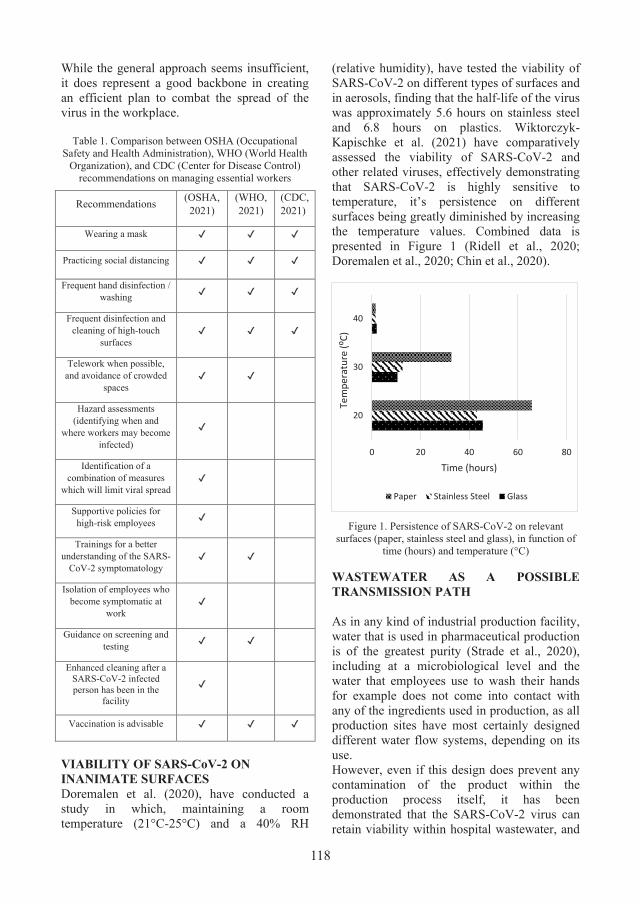
118
While the general approach seems insufficient, it does represent a good backbone in creating an efficient plan to combat the spread of the virus in the workplace.
Table 1. Comparison between OSHA (Occupational Safety and Health Administration), WHO (World Health
Organization), and CDC (Center for Disease Control) recommendations on managing essential workers
Recommendations (OSHA, 2021)
(WHO, 2021)
(CDC, 2021)
Wearing a mask ✔ ✔ ✔
Practicing social distancing ✔ ✔ ✔
Frequent hand disinfection / washing ✔ ✔ ✔
Frequent disinfection and cleaning of high-touch
surfaces ✔ ✔ ✔
Telework when possible, and avoidance of crowded
spaces ✔ ✔
Hazard assessments (identifying when and
where workers may become infected)
✔
Identification of a combination of measures
which will limit viral spread ✔
Supportive policies for high-risk employees ✔
Trainings for a better understanding of the SARS-
CoV-2 symptomatology ✔ ✔
Isolation of employees who become symptomatic at
work ✔
Guidance on screening and testing ✔ ✔
Enhanced cleaning after a SARS-CoV-2 infected person has been in the
facility
✔
Vaccination is advisable ✔ ✔ ✔
VIABILITY OF SARS-CoV-2 ON INANIMATE SURFACES Doremalen et al. (2020), have conducted a study in which, maintaining a room temperature (21°C-25°C) and a 40% RH
(relative humidity), have tested the viability of SARS-CoV-2 on different types of surfaces and in aerosols, finding that the half-life of the virus was approximately 5.6 hours on stainless steel and 6.8 hours on plastics. Wiktorczyk-Kapischke et al. (2021) have comparatively assessed the viability of SARS-CoV-2 and other related viruses, effectively demonstrating that SARS-CoV-2 is highly sensitive to temperature, it’s persistence on different surfaces being greatly diminished by increasing the temperature values. Combined data is presented in Figure 1 (Ridell et al., 2020; Doremalen et al., 2020; Chin et al., 2020).
Figure 1. Persistence of SARS-CoV-2 on relevant
surfaces (paper, stainless steel and glass), in function of time (hours) and temperature (°C)
WASTEWATER AS A POSSIBLE TRANSMISSION PATH As in any kind of industrial production facility, water that is used in pharmaceutical production is of the greatest purity (Strade et al., 2020), including at a microbiological level and the water that employees use to wash their hands for example does not come into contact with any of the ingredients used in production, as all production sites have most certainly designed different water flow systems, depending on its use. However, even if this design does prevent any contamination of the product within the production process itself, it has been demonstrated that the SARS-CoV-2 virus can retain viability within hospital wastewater, and
0 20 40 60 80
20
30
40
Time (hours)
Tem
pera
ture
(⁰C)
Paper Stainless Steel Glass
119
therefore it is possible for it to remain viable in at least one type of wastewater that the site produces (Achack et al., 2020). This not only implies how imperative it is for the staff to respect the hygiene implemented norms when visiting the restrooms or any other common areas, but also the need for a responsible disinfection of the potentially infected wastewater. Since hydrogen peroxide and chlorine based substances have been proven effective against the virus, perhaps such a treatment would be recommended for the facilities (Chen et al.,2014; Achack et al.,2020). CONCLUSIONS Never before has the science of epidemiology has been more needed than in the era of transportation in which we currently live and never before has it been more important for leaders and individuals to understand what combat strategies to adopt, in relation to the area they live in (Widdowson & Monto, 2013). All of the recommendations made in the present review were made with the intention of establishing a general protocol which should be applicable to all industrial production sites, a general protocol that is unprecedented, due to the newly discovered relation between the concept of a viral pandemic and the role that industrial manufacturers have to play in a global scale sanitary crisis. The pre-SARS-CoV-2 pandemic contamination control protocols are efficient up to a certain levels and supplementary measures are needed in order to ensure the protection of employees. To conclude this review, the final recommendations upon efficiently managing a pharmaceutical production site in the context of the SARS-CoV-2 pandemic may revolve around the need for transparency and ethical decisions. All points considered, a thorough training of the employees and recurrent informational campaigns should run through the facility, the management should redesign the shifts and ensure the protection of their employees within their facilities produce. Human contact with the finished goods should be limited to a maximum if not even completely eliminated from any production or packaging process. A skilful combination of the presented data should ensure a healthy
continuation of production in the safest possible environment. REFERENCES Achak, M., Alaoui Bakri, S., Chhiti, Y., M'hamdi Alaoui,
F., Barka, N., Boumya, W. (2021). SARS-CoV-2 in hospital wastewater during outbreak of COVID-19: A review on detection, survival and disinfection technologies. Science of The Total Environment, 761, 143192.
Aghalari, Z., Dahms, H., Sosa-Hernandez, J., Oyervides-Muñoz, M., Parra-Saldívar, R. (2021). Evaluation of SARS-CcV-2 transmission through indoor air in hospitals and prevention methods: A systematic review. Environmental Research, 195, 110841.
American Bureau of Shipping (2015). Guidance Notes on Failure Mode and Effects Analysis for Classification. Houston, USA: American Bureau of Shipping.
Antonelli, M., Capdevila, J., Chaudhari, A., Granerod, J., Canas, L., Graham, M., Klaser, K., Modat, M., Molteni, E., Murray, B., Sudre, C., Davies, R., May, A., Nguyen, L., Drew, D., Joshi, A., Chan, A., Cramer, J., Spector, P., Wolf, J., Ourselin, P., Steves, C., Loeliger, A. (2021). Optimal symptom combinations to aid COVID-19 case identification: analysis from a community-based, prospective, observational cohort. Journal of Infection Retrieved February 24, 2021, from https://www.sciencedirect.com/science/article/pii/S0163445321000797.
Bloise, I., Gómez-Arroyo, B., García-Rodríguez, J. (2020). Detection of SARS-CoV-2 on high touch surfaces in a clinical microbiology laboratory. Journal of Hospital Infection 105, 784‒486.
Chen, L., Zhou, H., Yu, B., Huang, Z. (2014). Comparison Study on Hospital Wastewater Disinfection Technology. Advanced Materials Research, 884-885, 41‒45.
Chin, A. W. H., Chu, J. T. S., Perera, M. R. A., Hui, K. P. Y., Yen, H.-L., Chan, M. C. W., Poon, L. L. M. (2020). Stability of SARS-CoV-2 in different environmental conditions. The Lancet Microbe 1(4), e146.
Council of Europe (2021). Introduction. European Pharmacopoeia (Ph. Eur.) 10. v-viii. Retrieved from https://www.edqm.eu/sites/default/files/medias/fichiers/European_Pharmacopoeia/The_European_Pharmacopoeia/European_Pharmacopoeia_10th_Edition/Introduction/european_pharmacopoeia_introduction_to_the_10th_edition.pdf.
Council of the EU (2021, February 1). COVID-19: Council updates recommendation on measures affecting free movement. Press release. Retrieved from https://www.consilium.europa.eu/en/press/press-releases/2021/02/01/covid-19-council-updates-recommendation-on-measures-affecting-free-movement/.
Fernández-Raga, M., Díaz-Marugán, L., García Escolano, M., Bort, C., Fanjul, V. (2021). SARS-CoV-2 viability under different meteorological

120
conditions, surfaces, fluids and transmission between animals. Environmental Research, 192, 110293.
Greulich, F. & Hardy., J. (2009, August 11). Managing Process Risk Line by Line: An FMEA Case Study. Pharma Manufacturing. Retrieved from www.pharmamanufacturing.com/articles/2009/115.
Guidance for medicine developers and other stakeholders on COVID-19. (n.d.) European Medicine Agency. Retrieved from https://www.ema.europa.eu/en/human-regulatory/overview/public-health-threats/coronavirus-disease-covid-19/guidance-medicine-developers-other-stakeholders-covid-19.
Heating, ventilation and air-conditioning systems in the context of COVID-19: first update. (n.d.) Retrieved from https://www.ecdc.europa.eu/en/publications-data/heating-ventilation-air-conditioning-systems-covid-19
Kampf, G., Todt, D., Pfaender, S., Steinmann, E. (2020). Persistence of coronaviruses on inanimate surfaces and their inactivation with biocidal agents. Journal of Hospital Infection, 104(3), 246‒251.
Kasloff, S., Leung, A., Strong, J., Funk, D., Cutts, T. (2021). Stability of SARS-CoV-2 on critical personal protective equipment. Scientific Reports, 11(1). Retrieved February 24, 2021, from www.nature.com/articles/s41598-020-80098-3.
Liang, R., Wang, L., Zhang, N., Deng, X., Su, M., Su, Y., Hu, L., He, C., Ying, T., Jiang, S., Yu, F. (2018). Development of Small-Molecule MERS-CoV Inhibitors. Viruses, 10(12), 721.
Liu, Z., Chu, R., Gong, L., Su, B., Wu, J. (2020). The assessment of transmission efficiency and latent infection period in asymptomatic carriers of SARS-CoV-2 infection. International Journal of Infectious Diseases, 99, 325‒327.
Marquès, M. & Domingo, J. (2021). Contamination of inert surfaces by SARS-CoV-2: Persistence, stability and infectivity. A review. Environmental Research, 193, 110559.
Monto, A. S., & Webster, R. G. (2013). Influenza pandemics: History and lessons learned. Textbook of Influenza, 2, 20‒34.
National Institute of Technology and Evaluation (NITE) (2020, June) Report on Efficacy Assessment of Disinfecting Substances Alternative to Alcohol Against SARS-CoV-2. Executive Summary. Retrieved from https://www.nite.go.jp/data/000115862.pdf.
Occupational Safety and Health Administration (2021, January 29). Protecting Workers: Guidance on Mitigating and Preventing the Spread of COVID-19 in the Workplace. Retrieved from https://www.osha.gov/coronavirus/safework.
Occupational Safety and Health Administration (2021, January 29). Protecting Workers: Guidance on Mitigating and Preventing the Spread of COVID-19 in the Workplace. Retrieved from https://www.osha.gov/coronavirus/safework#instruct-workers.
Rabenau, H., Cinatl, J., Morgenstern, B., Bauer, G., Preiser, W., Doerr, H. (2004). Stability and inactivation of SARS coronavirus. Medical Microbiology and Immunology, 194(1-2), 1-6.
Riddell, S., Goldie, S., Hill, A., Eagles, D., Drew, T. (2020). The effect of temperature on persistence of SARS-CoV-2 on common surfaces. Virology Journal, 17(1). Retrieved February 24, 2021, from https://virologyj.biomedcentral.com/articles/10.1186/s12985-020-01418-7.
Strade, E., Kalnina, D., Kulczycka, J. (2020). Water efficiency and safe re-use of different grades of water - Topical issues for the pharmaceutical industry. Water Resources and Industry, 24, 100132.
Sun, P., Lu, X., Xu, C., Sun, W., Pan, B. (2020). Understanding of COVID-19 based on current evidence. Journal of Medical Virology, 92(6), 548–551.
van Doremalen, N., Bushmaker, T., Morris, D. H., Holbrook, M. G., Gamble, A., Williamson, B. N., Tamin, A., Harcourt, J. L., Thornburg, N. J., Gerber, S. I., Lloyd-Smith, J. O., de Wit, E., Munster, V. J. (2020). Aerosol and surface stability of SARS-CoV-2 as compared with SARS-CoV-1. New England Journal of Medicine, 382(16), 1564–1567.
Vijay, S., G., Choudhary, S., Venugopal, S. S., Rohith, A. R., Pal, S. S., Akshatha Jain, Albert, A., Sivashankar, R. (2020). Industrial Hygiene in the Pharmaceutical Industry. Advances in Industrial Safety, 305–316.
Wang, Y., Wang, Y., Chen, Y., Qin, Q. (2020). Unique epidemiological and clinical features of the emerging 2019 novel coronavirus pneumonia (COVID‐19) implicate special control measures. Journal of Medical Virology, 92 (6), 568–576.
Wassie, G., Azene, A., Bantie, G., Dessie, G., Aragaw, A. (2020). Incubation Period of Severe Acute Respiratory Syndrome Novel Coronavirus 2 that Causes Coronavirus Disease 2019: A Systematic Review and Meta-Analysis. Current Therapeutic Research, 93, 100607.
Widdowson, M. A., & Monto, A. S. (2013). Epidemiology of influenza. Textbook of Influenza, 2, 250–266.
Wiktorczyk-Kapischke, N., Grudlewska-Buda, K., Wałecka-Zacharska, E., Kwiecińska-Piróg, J., Radtke, L., Gospodarek-Komkowska, E., Skowron, K. (2021). SARS-CoV-2 in the environment - Non-droplet spreading routes. Science of The Total Environment, 770, 145260.
World Health Organization (2021, February 24). Coronavirus disease (COVID-19) advice for the public. Retrieved from https://www.who.int/emergencies/diseases/novel-coronavirus-2019/advice-for-public.

121
INFLUENCE OF PRESERVATION METHOD ON PEPPERMINT, BASIL AND ROSEMARY PLANT EXTRACTS CHEMICAL COMPOSITION
Denisa CIOTEA, Mona Elena POPA University of Agronomic Sciences and Veterinary Medicine of Bucharest,
59 Mărăşti Blvd, District 1, Bucharest, Romania
Corresponding author email: [email protected] Abstract The aim of this paper is to present the most used preservation methods and their impact on the content and composition of following plant materials: Mentha piperita, Ocimum basilicum and Rosmarinus officinalis. The preservation methods used in this work were natural drying, freezing storage and gamma rays irradiation. Steam distillation method was used to extract the essential oils from the preserved samples. Essential oil content varied according to the preservation method tested on the plant materials. Fresh plant distillation yield for peppermint and rosemary were 0.35% and for basil was 0.88%. Dried plant and gamma rays irradiated plant distillation yield for rosemary was 1.94%, for peppermint was 0.55%, and for basil was 0.29%. Frozen plant distillation yield for rosemary was 0.50%, for peppermint was 0.15%, and for basil was 0.05%. Chemical composition of studied essential oils are analyzed by Gas Chromatography coupled with Mass Spectrometry Detector (GC-MSD). The primary constituent detected in peppermint oil was menthan-ol, in rosemary oil was eucalyptol and in basil essential oil was estragole. As the main conclusion is the preservation methods clearly influence the content and the chemical composition of essential oils obtained from plant material. Key words: drying, essential oils, freezing, gamma rays irradiation, plant material preservation. INTRODUCTION For centuries, plant materials have been used for a wide variety of purposes in different industries like perfumery, cosmetics, medicines and food industry. In food industry, aromatic plants are used to season the meat products, beverages and sweets. Lelieveld (2015) found that below a certain dose of food (vegetables, spices), there is no effect to humans, so it can be used safely. Plants degrade easily and lose their volatile compounds quickly, so they need to be preserved immediately after the harvesting process. The preservation methods used in this study are natural drying, freezing and gamma irradiation. Drying is one of the oldest techniques for plant storage. Drying is a thermodynamic process involving heat and mass transfer, like diffusion, where the water is evaporated into the environment (Sultanova et al., 2020). Medicinal plants are composed of more water than dry substances. The moisture content in plant is approximately 10-12% (Safarov J., 2017). Natural drying process influences the color of the leaves, the weight of herbs, the volume of herbs and their volatile content (Qiaoxian, 2019; Chakraborty & Dey, 2016).
Freezing is also a thermodynamic process which involves cooling the herbs to their freezing point. Freezing is a preservation technique, where plant cells and membranes are breaking down at low temperature and the water is crystallizing in the form of ice. The metabolic process slows down and the microbiological growth is stopped. Harvesting factors also contribute to the freezing performance (Celli et al., 2016; Neri et al., 2020). Gamma irradiation is a preservation method because it is used to extend the shelf-life of plant materials. Gamma irradiation is also used in decontamination of dried plants (Pereira et al., 2018). Plant irradiation using ionizing radiation is known to be a safe method of treatment (Gerolis et al., 2017). In recent years, research has focused on different methods to extract essential oils from plant materials like hydrodistillation, steam distillation, solvent extraction, microwave extraction and extraction with supercritical CO2. The most used method to extract the essential oils is steam distillation, because it has a great efficiency and the oil quality is higher than other extractive methods. Steam distillation method uses heat from water steam to extract the oil through vaporization. The oil is then separated
Scientific Bulletin. Series F. Biotechnologies, Vol. XXV, No. 1, 2021ISSN 2285-1364, CD-ROM ISSN 2285-5521, ISSN Online 2285-1372, ISSN-L 2285-1364

122
from the water (Radwan et al., 2020; Salamon et al., 2019). The purpose of this study was to determine how preservation method influence the chemical composition of Mentha piperita, Ocimum basilicum and Rosmarinus officinalis. MATERIALS AND METHODS This study was performed to evaluate the effect of preservation methods like drying, freezing and gamma irradiation on the chemical composition of peppermint (Mentha piperita), basil (Ocimum basilicum) and rosemary (Rosmarinus officinalis) essential oil. The studied plants were cultivated by established growers in Constanta area, in spring of 2020. Immediately after harvest two quarters of the plant material was stored in a drying room at 21oC, a quarter of the plant material was freezing at -21oC in a Samsung (RB31FERNDSA) freezer and a quarter remained fresh. Half of the dried plant material was gamma irradiated in a Gamma Irradiator GC5000 with a 60Cobalt source at a dose rate of 10Gy. The 12 samples of essential oils were extracted by steam distillation. The distillation process was made in lab. To proceed to steam distillation, the plant material was placed in a recipient. This recipient was connected to water and a condenser. The water vapour crosses the plant material and then it goes to the condenser equipment. The essential oil is easily separated by decantation (Radwan et al., 2020). After the distillation proccess, the essential oils were kept in a refrigerator until the analysis. GC-MS analysis was performed on GC 7890A chromatograph using Zebron capillary. The parameters are: - Inlet temperature: 250oC; - Helium flow rate: 0.8 ml/min; - 50:1 split ratio; - Column temperature: 50oC for 1 min; - Rate of expansion: 8ºC/min up to 100oC, 2
min; - Maintain at 110°C for 2 min; - Rate of expansion: 5°C/min up to 185ºC; - Maintain at 280°C for 10 min. The Mass Spectrometry (MS) detection was performed on 7000A TQMSA detector and Zebron capillary (Deleanu et al., 2018).
The Electron Ionization used was 70 eV (electron Volt). The source temperature was set at 230°C, the transfer temperature was set at 280°C and the quadrupole temperature was set at 150°C (Deleanu et al., 2018). The antioxidant activity of these oils is evaluated using DPPH method. The DPPH ethanol solution was mixed with each sample of oil (Deleanu et al., 2018). The control used at this analysis is DPPH - ethanol solution. The plate with the oil samples and the control sample were incubated. Incubate condition were: a dark room and maintained for 30 minutes. The plates were read at 518 nm. The anti-radical activity (XY) of the oil samples were determined using the formula:
𝑋𝑋𝑋𝑋% = 100 − ((𝐵𝐵𝑂𝑂𝑂𝑂 − 𝐵𝐵𝑂𝑂𝑂𝑂𝑂𝑂) 𝑥𝑥 100
𝐵𝐵𝐶𝐶)
Where: XY = Anti-radical Activity; BOS = oil sample absorbance; BOSD = oil sample absorbance without DPPH; BC = control sample absorbance (Deleanu et al., 2018). RESULTS AND DISCUSSIONS The chemical composition of fresh (FrP), dried (DrP), irradiated (IrP) and frozen (FroP) extracted peppermint essential oils are presented in Table 1. Terpenes alcohols (Menthan-ol) and terpenes (Limonene) were found in high concentrations in Fresh peppermint oil, where Menthan-ol is 40.52% and Limonene is 14.6%, in Dried peppermint oil Menthan-ol is 44.6% and Limonene is 16.5%, in Irradiated peppermint oil Menthan-ol is 44.1% and Limonene is 16.3%, in Frozen peppermint oil Menthan-ol is 43.7% and Limonene is 15.86%. Other terpenes found in low concentrations in peppermint oil were Cymene, Eucalyptol, L-β-Pinene, Terpinene, α-Pinene, Terpinolene, 3-Carene and ketones like Menthone. The results obtained for Menthan-ol found in M. piperita extracted oil are in agreement with those reported by Bishr & Salama (2017) - 32.24%; Salamon et al. (2019) - 39%; Mattazi et al. (2015) - 41.23%. The chemical composition of fresh (FrB), dried (DrB), irradiated (IrB) and frozen (FroB)

123
extracted basil essential oils are presented in Table 2.
Table 1. Chemical composition of fresh (FrP), dried (DrP), irradiated (IrP) and frozen (FroP) extracted
peppermint essential oils
No Detected Compound
Retention Time (min)
FrP (%)
DrP (%)
IrP (%)
FroP (%)
1 Menthan-ol 14.7 40.52 44.6 44.1 43.7 2 Limonene 9.8 14.6 16.5 16.3 15.86 3 Cymene 8.7 8.2 7.2 6.75 6.7 4 L-β-Pinene 8.4 4.8 4.8 4.6 4.54 5 Eucalyptol 9.7 4.8 3.5 4.6 4.56 6 Terpinene 9.8 3.9 2.9 3.85 3.8 7 α-Pinene 6.8 2.9 3.15 3.1 2.9 8 Menthone 15.4 2.6 1.7 2.51 2.5 9 Terpinolene 12.1 2.5 1.6 2.25 2.24
10 3-Carene 8.7 2.1 2.1 2.1 2 11 D-Menthone 15.3 1.6 1.65 0.52 0.5 12 β-Pinene 9.2 1.47 1.5 1.7 1.68 13 Octanol 8.7 1.1 1.1 1.01 1 14 Isomenthol 16.4 1 1 - 0.96 15 Caryophyllene 24.5 1 1 1.1 1 16 O-Menthone 13.2 0.9 0.95 0.9 0.88 17 Neo-menthol 13.4 0.9 0.8 0.9 0.88 18 β-Phellandrene 7.6 0.77 0.9 0.9 0.88 19 α-Terpinene 8.5 0.7 0.86 0.85 0.72 20 2-Menthene 8.9 0.52 0.63 0.62 0.6 21 Camphene 7.5 0.35 0.42 0.41 0.4 22 Isopulegol 14.6 0.35 0.2 0.33 0.32 23 Fenchone 10.4 0.25 0.26 0.25 0.24 24 Germa-crene 26.2 0.09 0.1 0.07 0.07
25 Caryophyllene oxide 28.4 0.09 0.1 0.02 0.1
26 Pulegone 18.4 - - - -
27 Isomenthol acetate 18.7 - - - -
Total 98.01 99.52 99.74 99.03
Table 2. Chemical composition of fresh (FrB), dried (DrB), irradiated (IrB) and frozen (FroB) extracted basil
essential oils
No Detected Compound
Retention Time (min)
FrB (%)
DrB (%)
IrB (%)
FroB (%)
1 Estragole 15.8 75.5 78.3 76.5 77.2 2 β-Linalool 11.5 17.8 16.3 18.1 17.3
3 1599Tetramethy1.4.7-cycl-cat. 27.3 1.6 1.2 1.1 1.2
4 Humulene 23.4 0.7 0.2 0.19 0.24 5 β-Citral 18.5 0.6 0.2 0.31 0.24 6 Bergamotene 24.6 0.59 0.6 0.55 0.5 7 Caryo-phyllene 21.4 0.51 0.56 0.48 0.42 8 Isomenthol 14.8 0.36 0.3 0.28 0.24 9 Farnesene 22.7 0.3 0.1 0.2 0.23 10 β-Cubebene 26.8 0.3 0.4 0.2 0.25 11 3-Carene 9.7 0.16 0.17 0.16 0.16 12 β-Pinene 8.5 0.15 0.15 0.15 0.15 13 Limonene 11.3 0.14 0.16 0.14 0.14 14 Eucalyptol 11.6 0.14 0.16 0.14 0.14 15 Menthone 13.6 0.12 0.13 0.12 0.12 16 Methoxycinnamald. 28.3 0.11 - - - 17 α-Pinene 8.3 0.09 0.08 0.09 0.09 18 Bisabolene 26.7 0.03 0.05 0.04 0.03 19 Ethylhexanol 8.7 - - - - 20 Cymene 8.6 - - - - 21 Dimethyl-octadienol 16.5 - - - - 22 Citral 15.3 - - - - 23 Caryophyllene oxide 25.3 - - - -
Total 99.2 99 98.7 98.65
Phenolics derivatives (Estragole) and terpene alcohols (Linalool) were found in high concentrations in Fresh basil oil, where Estragole is 75.5% and Linalool is 17.8%, in Dried basil oil Estragole is 78.3% and Linalool is 16.3%, in Irradiated basil oil Estragole is 76.5% and Linalool is 18.1%, in Frozen basil oil Estragole is 77.2% and Linalool is 17.3%. Other study obtained as principal constituent, Linalool: Abou El-Soud et al. (2015) - 48.4%; Rezzoug et al. (2019) -52.1%; Stanojevic et al. (2017) - 31.6%. The chemical composition of fresh (FrR), dried (DrR), irradiated (IrR) and frozen (FroR) extracted rosemary essential oils are presented in Table 3.
Table 3. Chemical composition of fresh (FR), dried (DR), irradiated (IR) and frozen (FRR) extracted
rosemary essential oils
No Detected Compound
Retention Time (min)
FrR (%)
DrR (%)
IrR (%)
FroR (%)
1 Eucalyptol 11.2 40.5 40.2 39.5 37.3 2 Camphor 12.6 18.4 17.9 16.7 16.3 3 α-Pinene 6.8 11.3 9.51 8.9 7.7 4 Safrole 20.1 4.87 5.23 4.23 4.5 5 Phellandrene 9.2 4.8 4 4.2 3.9 6 Limonene 11.2 3.27 3.5 3.21 3.33 7 Camphene 7.5 2.7 2.1 1.8 1.9 8 Linalool 11.6 2.6 2.8 2.44 2.34 9 β-Pinene 7.9 2.5 2 1.7 1.65 10 L-β-Pinene 9.2 2.4 2.6 2.1 2.3 11 Terpineol 16.5 2.3 5.01 4.5 4.3 12 Terpinen-4-ol 16.3 1.23 1.5 1.32 1.43 13 Isoborneol 13.5 0.98 1.21 0.74 0.68 14 Cymene 8.7 0.68 0.6 0.56 0.51 15 Terpinene 8.6 0.65 0.7 0.6 0.57 16 Tricyclene 6.9 0.4 0.6 0.5 0.3 17 α-Phellandrene 10.4 0.4 0.5 0.35 0.33
Total 99.98 99.96 93.35 89.34
Terpenes (Eucalyptol and α-Pinene) and terpenoids (d-Camphor) were found in high concentrations in Fresh rosemary oil, where Eucalyptol is 40.5%, d-Camphor is 18.4% and α-Pinene is 11.3%, in Dried rosemary oil Eucalyptol is 40.2%, d-Camphor is 17.9% and α-Pinene is 9.51%, in Irradiated rosemary oil Eucalyptol is 39.5%, d-Camphor is 16.7% and α-Pinene is 8.9%, in Frozen rosemary oil Eucalyptol is 37.3%, d-Camphor is 16.3% and α-Pinene is 7.7%. Terpene alcohols are also found in low concentrations in rosemary oil like α-Terpineol, Linalool, Terpinen-4-ol and terpenes like β-Phellandrene, Limonene, Camphene and β-Pinene.

124
Salamon et al. (2019), Ojeda-Sana et al. (2012) and Mattazi et al. (2015) found that the major constituents of rosemary oil were Cineole, Camphor and α-Pinene. Essential oils antioxidant activity is expressed as the essential oil concentration needed to inhibit the formation of radicals by 50%. The antioxidant activities of Fresh, Dried, Irradiated and Frozen Peppermint essential oils are presented in Figure 1. Dried peppermint oil (IC50DrP = 40.27 mg/ml) has higher antioxidant potential than irradiated peppermint oil (IC50IrP
= 47.56 mg/ml), frozen peppermint oil (IC50FroP = 51.75 mg/ml) and fresh peppermint oil (IC50FrP = 53.43 mg/ml).
Figure 1. Inhibitory Concentration of Peppermint oil (FrP-fresh peppermint oil; DrP- dried peppermint oil;
IrP- irradiated peppermint oil; FroP- frozen peppermint oil)
The antioxidant activities of Fresh, Dried, Irradiated and Frozen Basil essential oils are presented in Figure 2. Dried basil oil (IC50DrB = 45.3 mg/ml) has higher antioxidant potential than frozen basil oil (IC50FroB = 47.6 mg/ml), irradiated basil oil (IC50IrB = 51.7 mg/ml) and fresh basil oil (IC50FrB = 53.5 mg/ml).
Figure 2. Inhibitory Concentration of Basil oil (FrB-fresh basil oil; DrB- dried basil oil; IrB- irradiated basil oil;
FroB- frozen basil oil)
The antioxidant activities of Fresh, Dried, Irradiated and Frozen Rosemary essential oils are presented in Figure 3. Dried rosemary oil (IC50DrR = 14.3 mg/ml) has higher antioxidant potential than fresh rosemary oil (IC50FrR = 18.2 mg/ml), irradiated rosemary oil (IC50IrR = 19.4 mg/ml) and frozen rosemary oil (IC50FroR = 21.8 mg/ml).
Figure 3. Inhibitory Concentration of Rosemary oil (FrR-fresh rosemary oil; DrR- dried rosemary oil; IrR-
irradiated rosemary oil; FroR- frozen rosemary oil)
In their research, Hossain et al. (2010) obtained that dried rosemary and basil samples achieved higher antioxidant activity while fresh samples has loss of antioxidants. CONCLUSIONS In conclusion, the principal compounds obtained by Gas-cromatography for peppermint essential oil (98.01-99.74%) were: Menthan-ol, Limonene, Cymene, L-β-Pinene, Eucalyptol, α-Pinene and Menthone; for basil essential oil (98.65-99.2%) were: Estragole, Linalool and 1.5.9.9-Tetramethyl-1.4.7-cycloundecatriene; for rosemary essential oil (93.35-99.98%) were: Eucalyptol, Camphor, α-Pinene, Safrole, β-Phellandrene, Limonene, Camphene, Linalool and β-Pinene. The preservation method influence the composition of the essential oil. Fresh plants components are very unstable and easily evaporate, while dried plants components are stable and concentrated. Irradiated plants show no differences in composition compared with the dried ones. Frozen plants components are easily disintegrated because of the lower temperature.
0
20
40
60
DrP FrP FroP IrPIC 5
0% (m
g/m
L
Peppermint essential oils
40
45
50
55
FrB DrB IrB FroB
IC 5
0%(m
g/m
l)
Basil essential oils
0
10
20
30
DrR FrR IrR FroRIC
50%
(mg/
mL)
Rosemary essential oils

125
The dried samples of studied aromatic plants (peppermint, basil and rosemary) has the highest antioxidant activity. REFERENCES Abou El-Soud, N. H., Deabes, M., Abou El-Kassem, L.,
& Khalil, M. (2015). Chemical Composition and Antifungal Activity of Ocimum basilicum L. Essential Oil. Macedonian Journal of Medical Sciences, 3(3), 374. doi:10.3889/oamjms.2015.082.
Bishr, M. M., & Salama, O. M. (2017). Inter and intra GC-MS differential analysis of the essential oils of three Mentha species growing in Egypt. Future Journal of Pharmaceutical Sciences, Vol. 4 (2018), 53-56.
Calin-Sanchez, A., Lech, K., Szumny, A., Figiel, A., & Carbonell-Barrachina, A.A. (2012). Volatile composition of sweet basil essential oil (Ocimum basilicum L.) as affected by drying method. Food Research International 48, 217-225.
Celli, B. G., Ghanem, A. & Su-Ling Brooks, M. (2016). Influence of freezing process and frozen storage on the quality of fruits and fruit products. Food Rev. Int., 32, 280-304.
Chakraborty, R., & Dey, T. (2016). Drying protocols for traditional medicinal herbs: a critical review, Int. J. of Engineering Technology, Manage Appl. Sci. 4 (4), 311-319.
Deleanu, M., Popa, E. E., & Popa, M. E. (2018). Composition and active property evaluation of ginger (Zingiber officinale-roscoe) and wild oregano (Origanum vulgare) essential oils, Revista de Chimie, 69(8), 1927-1933.
Gerolis, L. G. L., Lameiras, F. S., Krambrock, K. & Neves, M. J. (2017). Effect of gamma radiation on antioxidant capacity of green tea, yerba mate, and chamomile tea as evaluated by different methods. Radiation Physics and Chemistry, vol. 130, 177-185.
Hossain, M. B., Barry-Ryan, C., Martin-Diana, A. B., & Brunton, N. P. (2010). Effect of drying method on the antioxidant capacity of six Lamiaceae herbs. Food Chemistry, 123(1), 85-91.
Lelieveld H. (2015). Food safety regulations based on real science. Scientific Papers. Series AgroLife Scientific Journal, Vol. 4 Issue 1.
Mattazi, N., Farrah, A., Fadil, M., Chraibi, M., & Benbrahim, K. F. (2015). Essential oils analysis and antibacterial activity of the leaves of Rosmarinus officinalis, Salvia officinalis and Mentha piperita cultivated in Agadir (Morocco). Int J Pharm Pharm Sci, Vol 7, Issue 9, 73-79.
Neri, L., Faieta, M., Di Mattia, C., Sacchetti, G., Mastrocola, D. & Pittia, P. (2020). Antioxidant
activity in frozen plant foods: effect of cryoprotectants, freezing process and frozen storage. Foods, 9, 1886. doi:10.3390/foods9121886.
Pereira, E, Antonioa, A, João, C. M., Celestino S. B., Barrosa, L. & Ferreiraa, I. C. F. R. (20018). How gamma and electron-beam irradiations modulate phenolic profile expression in Melissa officinalis L. and Melittis melissophyllum L. Food Chemistry, vol. 240, 253-258.
Qiaoxian, L. (2019). Study on a drying method of Herbarium specimen. Anhui Agricultural Science Bulletin.
Ojeda-Sana, A. M., Baren, C. M., Elechosa, M. A., Juarez, M. A., & Moreno, S. (2012). New insights into antibacterial and antioxidant activities of rosemary essential oils and their main components. Food Control 31: 189-195.
Radwan, M. N., Morad, M. M., Ali, M. M. & Wasfy, I. K. (2020) Extraction of peppermint volatile oil using a simple constructed steam distillation system. Plant Archives, Vol. 20(2), 1487-1491.
Rezzoug, M., Bakchiche, B., Gherib, A., Roberta, A., Flamini, G., Kilinçarslan, O., & Bardaweel, S. K. (2019). Chemical composition and bioactivity of essential oils and Ethanolic extracts of Ocimum basilicum L. and Thymus algeriensis Boiss. & Reut. from the Algerian Saharan Atlas. BMC Complementary and Alternative Medicine, 19(1). doi:10.1186/s12906-019-2556-y .
Safarov, J. (2017). Research drying process with herbal gelio accumulation drying equipment. Journal of Food Process Technol, 8(2) DOI: 10.4172/2157-7110.1000654
Salamon, I., Kryvtsova, M., Bucko, D. & Tarawneh, A. H. (2019). Chemical characterization and antimicrobial activity of some essential oils after their industrial large-scale distillation, Journal of microbiology, biotechnology and food sciences, doi: 10.15414/jmbfs.2018.8.3.965-969.
Stanojevic, L. P., Marjanovic-Balaban, Z. R., Kalaba, V. D., Stanojevic, J. S., Cvetkovic, D. J., & Cakic, M. D. (2017). Chemical Composition, Antioxidant and Antimicrobial Activity of Basil (Ocimum basilicum L.) Essential Oil. Journal of Essential Oil Bearing Plants, 20(6), 1557-1569. doi:10.1080/0972060x.2017.1401963.
Sultanova, S. A., Safarov, J. E. & Raxmanova, T. T. (2020). Study of temperature profile in drying process, Chemical Technology, Control and Management: Vol. 2020(3), Article 5. DOI: https://doi.org/10.34920/2020.3.29-34.

126
USE OF SACCHAROMYCES CEREVISIAE
AS AN ANTI-AGING STUDY TOOL
Mircea-Cosmin PRISTAVU1, 2, Camelia Filofteia DIGUŢĂ1, Ionuţ MORARU2, Florentina MATEI1
1University of Agronomic Sciences and Veterinary Medicine of Bucharest, 59 Mărăşti Blvd, District 1, Bucharest, Romania
2SC Laboratoarele Medica SRL, 11 Frasinului Street, Otopeni, Ilfov, Romania
Corresponding author email: [email protected] Abstract The paper aims to present the review of the recent research on anti-aging effect of bioactive plant compounds studied by the use of Saccharomyces cerevisiae as a model organism. Numerous features, such as the chronological lifespan (CLS) and / or the replicative lifespan (RLS) or the measurement of the yeast telomere length, associated with the aging process have been the targets of many studies around the world. The yeast, S. cerevisiae has emerged as a powerful genetic and chemical screening platform because it combines a fast workflow with experimental facilities and the availability of a wide range of mutants. Given these aspects and the mechanisms of aging between yeast and humans, the testing of candidate anti-aging substances has proven to be very successful in finding potential molecular targets. The mentioned methods are very difficult to apply in humans and therefore the side effects are unpredictable and because of this it is very important to quickly discover biologically active plant compounds that can mimic the anti-aging action as close to the truth as possible. Key words: anti-aging, yeast, chronological lifespan, replicative lifespan, telomere. INTRODUCTION
Older people tend to have costly chronic diseases that negatively impact their quality of life and functional output. In fact, aging itself is the leading risk factor for an array of diseases that increasingly plague the world population. If researchers can understand aging and modify its rate, the consequences are likely to be a reduced incidence or progression of disease leading to increased health span, allowing older people to keep working and avoid high health care costs. The potential of interventional approaches targeted at aging has yet to be realized in part because aging is a complicated multisystem process that has remained enigmatic. However, research over the last two decades has led to significant excitement. Model organisms are key species, used by researchers to investigate and unravel various biological processes which lead understanding certain human diseases mechanisms. The most studied and cited organisms in numerous reviews and research articles within Google scholar comprise yeast (Saccharomyces
cerevisiae) (see reviews Karathia et al., 2011; Sudiyani et al., 2021), fruit fly (Drosophila melanogaster) (see review Lee and Min, 2019), nematode worm (Caenorhabditis elegans) (see review Mack et al., 2018), and mouse (Mus musculus) (see review Vanhooren and Libert, 2013). A great deal of attention has been focused to Saccharomyces cerevisiae as useful model organism to investigate anti-aging com-pounds and understand the aging mechanisms (Longo et al., 2012; Zimmermann et al., 2018; Sudiyani et al., 2021). S. cerevisiae is easy of and safety to manipulate and breed in a laboratory conditions, are relatively inexpen-sive, have short generation periods, does not have any ethical constraints, has the whole genome sequenced (≈12-Mb bp, 16 chromoso-mes and 6000 genes) and an appreciable homologous of yeast genes with human genes associated with aging and/or longevity (see http://genomics.senescence.info/genes/models.html), making them ideal for experimentation (Goffeau et al., 1997; Sherman, 1998; Goffeau, 2000; Longo et al., 1996; Longo et al., 1997; Fabrizio et al., 2003; Fabrizio et al., 2004; Fabrizio et al., 2005; Fabrizio et al., 2007;
Scientific Bulletin. Series F. Biotechnologies, Vol. XXV, No. 1, 2021ISSN 2285-1364, CD-ROM ISSN 2285-5521, ISSN Online 2285-1372, ISSN-L 2285-1364

127
Burtner et al., 2009; Karathia et al., 2011; Murakami et al., 2011; Longo et al., 2012). S. cerevisiae is a flexible and stable model system of eukaryotic genetics. Mutant screening and study of division is simpler and easier than in multicellular species in the yeast and is well preserved across eukaryotic taxa for basic eukaryotic biodiversity, such as cell cycling regulation and generating alternation. Yeast has high endogenous recombination rates, and a variety of extrachromosomal DNA elements can turn yeast cells steadily. The study and cloning of genes are therefore considerably simpler than in more complex eukaryotes in this organism (Madia et al., 2007; Greig et al., 2009; Hanson, 2018). People have been cultivating yeast to produce beer, bread and wine since the dawn of agricul-ture. The budding yeast S. cerevisiae has grown into an outstandingly tractable eukaryotic model structure, as a domesticated microorga-nism and as a reproductive eukaryote. S. cerevisiae contributed actively and implicitly to the discovery of supposedly more aging genes than other models (Longo et al., 2012). The lifespan in yeast is classified as replicative lifespan (RLS) and chronological lifespan (CLS). RLS is defined as the number of daughter cells an individual yeast mother can produce before cell enters senescence and eventually dies (Mortimer and Johnston, 1959).
CLS is defined as the period of time that a cell can stay alive without dividing in a stationary phase (Longo et al., 2012). The reality is that the scientific community share the opinion that both yeast assays have good models for understanding aging and will continue to be strong. In this respect, we have therefore tried to construct a review describing the consensus opinion of the employed tools, but also not shying away from the points of disagreement and the technical issues that should be considered when studying aging in yeast. In search of new anti-aging agents, several extracts have been reported that possess multiple anti-aging activities relevant on S. cerevisiae as model organisms. Lutchman et al. (2016) reported 6 plant extracts induced a dramatic delay yeast chronological aging through different signalling pathways. Hesperidin has been reported to produce anti-aging effects in yeast via inhibition of ROS and the UTH1 gene expression, and increase in SIR2 (Silent information regulator 2) activity. Apple extract (Stirpe et al., 2017), herb plant Gastrodia elata (Orchidaceae) (Lin et al., 2016), Roselle petal extract (Sarima et al., 2019), and clover bud extract (Astuti et al., 2019), rice bran extract (Sunthonkun et al., 2019) were reported also to increase the life span in yeast (Table 1).
Table 1. Plants or plant derived extracts used as anti-aging agents on the yeast S. cerevisiae, mentioned in the paper
Plant subjects References Curcumin isolated from rhizomes of Turmeric (Curcuma longa) Stępień et al., 2020 Roselle Petal Hydroethanolic Crude Extract (Hibiscus sabdariffa L.) Sarima et al., 2019 Ethanol derived clove bud extract Astuti et al., 2019 Rice bran extract (Oryza sativa) Sunthonkun et al., 2019 Annurca apple (M. pumila Miller cv Annurca) extract Stirpe et al., 2017 Parishin extracted from Gastrodia elata Lin et al., 2016 Galinsoga parviflora and Fumaria officinalis extracts Chanaj-Kaczmarek et al., 2015 Hesperidin derived from Citrus genus Sun et al., 2012
Hesperidin derived from Citrus genus increased the lifespan of yeast by inhibition ROS (Reactive Oxygen Species) level and extention of UTH1 gene expression (Sun et al., 2012). Stępień et al. (2020) reported the anti-oxidative and anti-aging effects of curcumin and can delays aging process in the S. cerevisiae through hormesis effect. Aging studies such as, testing the antioxidant power or the H2O2
sensitivity of a plant subject, are becoming
increasingly prominent in biomedical research (Astuti et al., 2016; Stirpe et al., 2017). The reasons for this are obvious. The demographics of the world are rapidly changing, leaving a population with an increasing number of elders and a declining number of working-age individuals to support them. It is our hope that readers interested in aging will be able to gain a strong understanding of the state of play in one article, and that clearly

128
articulated points of lack of consensus will serve to stimulate further experimentation leading to clarification as other authors have performed before (Longo et al., 2012). There are more advantages than disadvantages in using yeast S. cerevisiae as a model organism in demonstrating the anti-aging effects of certain plants (Figure 1).
Figure 1. Advantages and disadvantages of using Saccharomyces cerevisiae as a model organism (adapted after Zimmermann et al., 2018) GRAS - Generally Recognized as Safe; FDA - Food and Drug Administration; SGD- Saccharomyces Genome database
MATERIALS AND METHODS The materials used are represented by scientific publications from around the world. The methods used are in according with the paper aims, respectively: to present the review of the recent research on anti-aging effect of bioactive plant compounds studied by the use of Saccharomyces cerevisiae as a model organism. RESULTS AND DISCUSSIONS METHODS USED IN ANTI-AGING STUDIES BASED ON S. CEREVISIAE CELL MODEL To determine the potential anti-aging effect of certain plant extracts using the yeast S. cerevisiae, many methods have been tested some with good results others less but are of interest in the future (Table 1). In the following will be grouped and described the methods used in the anti-aging studies on S. cerevisiae, respectively (1) culture dependent methods; (2) microscopy methods and (3) genetic and molecular tools.
Figure 2. Methods to study anti-aging of S. cerevisiae
Culture dependent methods Viability (defined as percentage of viable cells in a whole population) and vitality (defined as physiological capabilities of a cell) represent two different aspects of yeast cell. In the following paragraph will be described the culture dependent methods, respectively: cell viability assay, chronological life span (CLS)
assay, the phenotypic analysis, mean doubling time, antioxidant activity and oxidative stress assays. Cell viability assay Cell viability is the most commonly method to investigate the response of Saccharomyces cerevisiae yeast cell after exposure to various

129
stimuli (e.g plant extract). Kwolek-Mirek and Zadrag-Tecza (2014) have proposed a classification of available methods to determine viability, namely: (i) methods based on the yeast cells ability to grow on solid or liquid media and (ii) stain-based methods, respectively (see below). Cell viability can be determined by different methods such colony formation assay (colony forming unit/mL or CFU/ml) (Chanaj-Kaczmarek et al., 2015) or spot dilution assays (Astuti et al., 2019; Sunthonkun et al., 2019); cells culture in liquid medium (turbidity assay) (Kwolek-Mirek and Zadrag-Tecza, 2014). These methods are the easy way of use at a reasonable cost and reliably give accurate results, but it is required longer time to obtain the results and fails to provide an accurate estimation of viable cells or of the ability of cells to reproduce (bud). The most classical method to determine growth curves is based by cultivation the cells in a standard liquid with or without stimuli treatment and counting the proliferating cells over at different time intervals. The turbidity assay was the main method used to measure the absolute number of S. cerevisiae cells at optical densities at 600 nm (OD600) by performing measurements at 1 h intervals for 12 - 24 h. Curcumin supplementation led to a direct inhibition of the growth rate in all the analyzed strains (Stępień et al., 2020). The growth curve study should be highlighted as showing the behaviour of the whole population of the cells (Molon et al., 2016). Also, Lin et al. (2016) performed kinetics of growth assay of yeast under the influence of parishin which is a phenolic glucoside isolated from Gastrodia elata, an important traditional Chinese medicine plant. Unfortunately, significant changes were not observed in resveratrol treatment group and parishin treatment group. Chanaj-Kaczmarek et al. (2015) reported that the extracts of G. parviflora and F. officinalis that contained phenolic compounds improved the viability of Δsod1 mutant cells, using colony formation assay. The yeast’s cells viability clearly differed from the isogenic wild type and was distinctly affected by pretreatment with the studied extracts in a concentration dependent manner. Moreover, the observed effects of both extracts were analogous to the reference substances used in
the experiment, i.e., gallic acid, rutin and Trolox (vitamin E analogue). It appears that the changes in the cell energy status caused by the tested extracts affected the cell viability (Chanaj-Kaczmarek et al., 2015). Stirpe et al. (2017) tested the S. cerevisiae’s cells viability treated with extract of Annurca apple variety. They reported that the viability of untreated cells significantly reduced during cultivation and the presence of the extract at the concentration of 10 mg/ml clearly prevented cell death while lower doses of the extract, such as 1 mg/ml, were almost ineffective. Chronological life span (CLS) assay The period that the non-dividing yeast cell lasts is the Chronological Life Cycle (CLS). CLS is usually determined by growing a culture of yeast cells that exit most cells from the cell cycle into the postdiauxic state (Longo et al., 1996). The postdiauxic process begins approximately 24 hours after initial inoculation, when cells deplete extracellular glucose, reduce growth dramatically, and turn to an ethanol-dependent mitochondrial respiratory model (Werner-Washburne et al., 1996). The stationary phase is characterized by lower metabolism rates and stress-resistance up regulation at the end of the postdiauxic phase between days 2-7 depending on the medium used in their experiment. In addition to the RLS test, the yeast CLS assay was designed to provide the ability to model the aging of non-splitting organism cells (Longo et al., 1996; Longo et al., 1997; Fabrizio et al., 2003; Fabrizio et al., 2004; Fabrizio et al., 2007; Burtner et al., 2009; Murakami et al., 2011). The extract of Hom Dang rice bran or antioxidants quercetin or protocatechuic acid prolonged life-span of pre-treated wild-yeast cells (Sunthonkun et al., 2019). The studies of Stępień et al. (2020) indicate that curcumin isolated from Curcuma longa rhizome can affect chronological and replicative aging of the yeast. Curcumin accelerates without anti-oxidant protection and without pathways the DNA repair. They also showed that hypertrophic cells are likely to enable yeast to live during chronological aging because of high tolerance to environmental stress factors.

130
Dakik (2020) discovered fifteen new geroprotective plant extracts that extend the chronological lifespan of budding Saccharomyces cerevisiae. Determination of mean doubling time For each examined cell as stated before, the mean doubling time can be calculated. When assessing the reproductive capacity, the doubling time can be also determined. The periods of the first two developmental stages have not been considered (the first and second doubling times are longer than those of older cells) in the case of Molon et al. (2016). Curcumin was added to cultures and the development of cell cycle, according to iron availability, was extended and delayed, as the concomitant enrichment of iron and curcumin had a detrimental effect on growth delay (Minear et al., 2011). Antioxidant activity 2,2-Diphenyl-1-picrylhydrazyl (DPPH) radical scavenging and 2,2-azinobis-(3-ethylbenzothiazoline-6-sulfonic acid) (ABTS) assays have been widely used to assess the antioxidant activity of plant extracts. The IC50, known as the concentration of substance that reduces the free radicals by 50% should be determined. Anti-oxidant activity of ethanol-derived roselle petal extract based on DPPH and ABTS assays were 367.6 ppm and 921.4 ppm, respectively, which indicates that the extract is promising as antioxidant agent (Re et al., 1999; Sarima et al., 2019) The results revealed that the DPPH-based IC50
value and the ABTS value were different. This proved that each sample would apply different pathways of scavenging the free radicals. The raw extract of roselle petals shows the highest activity of antioxidants for scavenging DPPH radicals based on the in-vitro analysis of antioxidants. This shows that the extract as an antioxidant is promising (Sarima et al., 2019). Lin et al. (2016) focused to measure the parameters related to antioxidation in yeast using parishin extracted from Gastrodia elata. Parishin significantly increased the number of colonies of yeast. Moreover, the viability of yeast after treatment with parishin was notably increased compared with positive control group
under oxidative stress condition. These results suggested that antioxidation played an important role in the antiaging effect of parishin. Sunthonkun et al. (2019) reported that rice bran extract, antioxidants quercetin or protocatechuic acid delays chronological aging and extend the life-span of S. cerevisiae wild-type BY4742 via reduction of the ROS accumulation.
Oxidative stress assay Environmental/abiotic stress conditions are contributing in inducing oxidative stress through overaccumulation of reactive oxygen species (ROS), causing potential damage to the biomolecules (DNA, proteins and lipids). To verify the anti-oxidative properties of plant extracts, in order to evaluate the impact of oxidative stress provoked by plant extract, S. cerevisiae cells were cultured on specific medium with addition various concentrations of H2O2. Xiang et al. (2011) evidenced that phloridzin (or phlorizin), major phenolic compound present in apple and apple juice, increased the viability of the yeast dose-dependently under oxidative stress by H2O2 (7.5 mM), and a low dose of phloridzin reduced the reactive oxygen species (ROS) level in cells exposed to oxidative stress. Sarima et al. (2019) reported that the roselle petals extracts at 300 ppm concentration increased the life span in yeast against oxidative stress with a high concentration of H2O2 (9 mM). In another study, the ethanol-derived clove bud extract (100 ppm) improved S. cerevisiae viability following H2O2-induced oxidative stress (Astuti et al., 2019). Stępień et al. (2020) verified the sensitivity of the S. cerevisiae wild-type strain BY4741 and isogenic mutant strains sod1Δ, sod2Δ, rad52Δ treated with curcumin under stressed factors such as Congo red, methyl methanesulfonate, sodium chloride (NaCl), hydrogen peroxide (H2O2), dodecyl sodium sulfate (SDS), acetic acid and subjected to thermal shock. The authors demonstrated the growth on the YPD medium with addition of curcumin after cell incubation with H2O2 (5 mM), which is a strong oxidant. In all analyzed strains, it would also seem that curcumin increases cell resistance to Congo Red, especially in the highest concentration that shows the effect of

131
biogenesis in the yeast cell walls. The tolerance of yeast cells to acetic acid decreases even with curcumin. Curcumin has a minor or no effect at all on osmotic and thermal stress. One or more MOO (Multi Objective optimization) affect-tability is normal in yeast, since growth barriers at high concentrations have been achieved, as shown (Stępień et al., 2020). Microscopy related methods Different assays may use the microscopy tools. For example, it can be studied the yeast budding lifespan or vacuole morphology by the use of different types of microscopes, or the visualisation of nuclei fragmentation or mitochondrial activity by fluorescence microscopy. Stain-based methods Stain-based methods can provide the differential identification of dead cells in a culture as well as the percentage of viable cells. Dyes penetrate yeast with damaged cell membrane. Commonly used dyes includes colorimetric dyes such as methylene blue, trypan blue (Krzepiłko, 2009; Sunthonkun et al., 2019) or the fluorescent nucleic acid dyes such as dihydrorhodamine 123, fluorescein diacetate (FDA)/propidium iodide (PI) (Madeo et al., 1999; Stirpe et al., 2017; Stępień et al., 2020). These methods are easy to perform, reliable, efficient, cost-effective and rapid (from a few minutes to a few hours). Fluorometric assays have been extensively used to assess the viability of yeast cells by fluorescence microscopy or flow cytometry, and they offer many advantages compared with colorimetric assay (Kwolek-Mirek and Zadrag-Tecza, 2014). By co-staining the cells with PI/FDA for 15-20 minute in the dark at room temperature, viable yeast cells were green fluorescent, and dead cells were red fluorescent, when was examined under a fluorescence microscope using a selective wavelength (Sun et al., 2012; Lin et al., 2016; Sunthonkun et al., 2019; Stępień et al., 2020). Commercial kits have been developed by several companies, which provide simple and sensitive assays for distinction viable yeast cells in mixtures cultures or in pure cultures (Krzepiłko, 2009).
Estimation of cell diameter Measuring the cell dimensions is a standard test conducted across several disciplines by researchers. Stępień et al. (2020) analyzed the samples by optical microscopy and the images obtained during the routine lifespan determi-nation procedure used to estimate cell diameter (treated with curcumin) within 2, 5, 8, 12 days. It was observed that during the chronological lifespan, only hypertrophic cells were able to survive. Cell size is a physical parameter that, by the surface to volume ratio, determines the size of the cell. The studies conducted by Zadrag-Tecza et al. (2018) demonstrate the existence of two size thresholds: the first leads to cessation of reproduction, but cells are still alive; the second leads to cell death. So, cell size may affect not only the reproductive potential but also the total lifespan of cells by shortening the postreproductive phase. Cell cycle analyses The cell lifetime is known as the number of daughters that are manufactured by the mother cell until the cells irrevocably stop in the traditional replication aging model. Analyzes based on this model can be carried out using a microscope with a micromanipulator to separate daughter cells from the mother cell (Kaeberlein, 2010). As example, can be provided the testing of curcumin (Minear et al., 2011); it was shown in the culture extends and slows development in the cell cycle based on supply of iron, as simultaneous supplementing iron and curcumin alleviates the detrimental effects of the growth delay. Curcumin against a range of tumour forms has been also shown to be biologically active. The G2/M cell cycle stops the sprays of the head and neck and in colorectal cancer carcinoma (Jaiswal et al., 2002; Hu et al., 2017). Comparison between budding lifespan and total lifespan A routine micromanipulatory procedure discussed above specified the budding period of individual mother yeast cells as the number of mitotic cycles (budding) during the cell life (Molon et al., 2018). Each mother's number of buds indicates its reproductive capability (budding lifespan) (Kaeberlein et al., 2006; Lee et al., 2006; Wei et al., 2008; Wei et al., 2009).

132
The total lifetime of the single mother cell was described as the life cycle of a single mother cell. The cumulative longevity was measured as the total of all maternal and reproductive lives. The reproductive lifespan was described as the period from the first to the last budding, and the lifespan from the last budding to the cell death. The lifespan of the S. cerevisiae yeast was determined as previously described by Minois et al. (2005) with small modification (Molon et al., 2018). Therefore, a new unit, namely the total lifespan (TLS), may be divided into two phases: the reproductive phase, during which the cell undergoes mitosis cycles to produce successive buds, and the postreproductive phase, which extends from the last division to cell death or can be described as the amount of asexual reproductor's lifetime and post-reproductory lifespan and lifetime passing from the last one to the death of the cell, was suggested with a view to determining the actual life period of mitotically active cells (Zadrag-Tecza et al., 2008). In this experiment, they used a wild-type strain (BY4741) and some mutants sod1Δ and rad52Δ. In the case of wild strains only the curcumin supplementation has an effect on the reproductive capacity, while in the case of the mutants, the cell reproduction potential of curcumin decreased statistically substantially. Addition of curcumin had a positive influence on the wild-type S. cerevisiae BY4741 cells' mean and full life spans. For other strains, no major effect on the average lifetime of curcumin was noted. Moreover, the length of the time of the cells' ability to bud (reproductive life) and the period of their life but unable to bud was determined (post-reproductive lifespan). The supplementation of curcumin greatly prolonged the reproductive life for the wild-type strain BY4741. In the case of the mutant strain rad52Δ, the addition of curcumin will reduce reproductive life significantly (Stępień et al., 2020). The experimental data obtained by Zadrag-Tecza et al. (2018) for cells with higher ploidy do not indicate that the reproductive potential increases proportionally to the number of the genome copies. Moreover, in this case, the genetic background may also be an important factor. When the reproductive phase of cell life
was expressed in units of time differences in the reproductive potential between cells differ-ring in ploidy were significantly lower than when the reproductive phase was expressed in the number of daughters produced by these cells. Mitochondrial membrane potential assay Mitochondria is deeply implicated in aging and age-related diseases (Bratic & Larsson, 2013) by generation reactive oxygen species (ROS) as a consequence of the electron transport that drives oxidative ATP synthesis. Rhodamine B (red-fluorescent stain), rhodamine 123 (green fluorescent stain), DAPI (4′,6-diamidino-2-phenylindole) 2′,7′-dichlorodihydrofluorescein diacetate are the widely used mitochondrial fluorescent markers to assess the mitochondria-dependent oxidative stress response following extract treatment (Xiang et al, 2011; Sun et al., 2012; Lin et al., 2016; Kwolek-Mirek and Zadrag-Tecza, 2014; Sarima et al., 2019; Sunthonkun et al., 2019; Stępień et al., 2020). The mitochondrial activity is observed using fluorescence microscope. A low clove extract therapy level concentration was found not to cause activity of mitochondrial yeasts, like with no extract. On the other hand, high extract concentrations contributed to heavy fluorescence intensity and their effect on mitochondrial activity induced. Clove extract is therefore susceptible to mediating antioxidant cell reaction independently, as indicated by calory-reduction-mediated antioxidant stress response, from the adaptive ROS signalling. Bioactive compounds such as quercetin, resveratrol and curcumin, previously studied could specifically scavenge reactive oxygen species (Metodiewa et al., 1996; Guha et al., 2010; Barzegar et al., 2011; Pan et al., 2011). Thus, the findings from Astuti et al. (2019) clearly indicate that large dose of clove extract has prooxidant behaviour and probably interferes with adaptive mitochondrial ROS signalling in cellular yeast systems, which results in an oxidative stress-sensitive phenotype. In the previous research, quercetin, a compound within antioxidants, was involved in promoting activity in mitochondria (Ortega et al., 2009). By inducing fluorescence from rhodamine B showed that the addition of
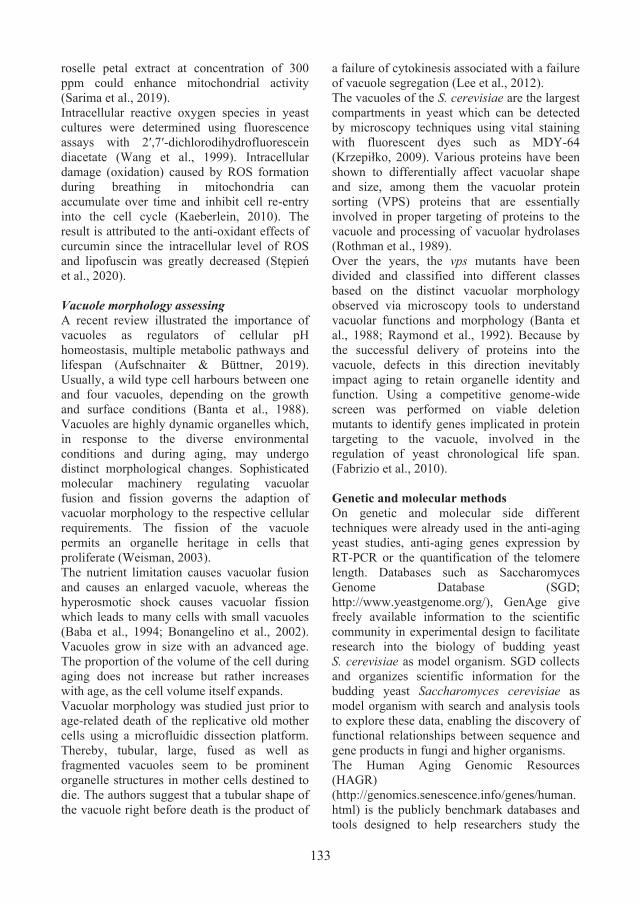
133
roselle petal extract at concentration of 300 ppm could enhance mitochondrial activity (Sarima et al., 2019). Intracellular reactive oxygen species in yeast cultures were determined using fluorescence assays with 2′,7′-dichlorodihydrofluorescein diacetate (Wang et al., 1999). Intracellular damage (oxidation) caused by ROS formation during breathing in mitochondria can accumulate over time and inhibit cell re-entry into the cell cycle (Kaeberlein, 2010). The result is attributed to the anti-oxidant effects of curcumin since the intracellular level of ROS and lipofuscin was greatly decreased (Stępień et al., 2020). Vacuole morphology assessing A recent review illustrated the importance of vacuoles as regulators of cellular pH homeostasis, multiple metabolic pathways and lifespan (Aufschnaiter & Büttner, 2019). Usually, a wild type cell harbours between one and four vacuoles, depending on the growth and surface conditions (Banta et al., 1988). Vacuoles are highly dynamic organelles which, in response to the diverse environmental conditions and during aging, may undergo distinct morphological changes. Sophisticated molecular machinery regulating vacuolar fusion and fission governs the adaption of vacuolar morphology to the respective cellular requirements. The fission of the vacuole permits an organelle heritage in cells that proliferate (Weisman, 2003). The nutrient limitation causes vacuolar fusion and causes an enlarged vacuole, whereas the hyperosmotic shock causes vacuolar fission which leads to many cells with small vacuoles (Baba et al., 1994; Bonangelino et al., 2002). Vacuoles grow in size with an advanced age. The proportion of the volume of the cell during aging does not increase but rather increases with age, as the cell volume itself expands. Vacuolar morphology was studied just prior to age-related death of the replicative old mother cells using a microfluidic dissection platform. Thereby, tubular, large, fused as well as fragmented vacuoles seem to be prominent organelle structures in mother cells destined to die. The authors suggest that a tubular shape of the vacuole right before death is the product of
a failure of cytokinesis associated with a failure of vacuole segregation (Lee et al., 2012). The vacuoles of the S. cerevisiae are the largest compartments in yeast which can be detected by microscopy techniques using vital staining with fluorescent dyes such as MDY-64 (Krzepiłko, 2009). Various proteins have been shown to differentially affect vacuolar shape and size, among them the vacuolar protein sorting (VPS) proteins that are essentially involved in proper targeting of proteins to the vacuole and processing of vacuolar hydrolases (Rothman et al., 1989). Over the years, the vps mutants have been divided and classified into different classes based on the distinct vacuolar morphology observed via microscopy tools to understand vacuolar functions and morphology (Banta et al., 1988; Raymond et al., 1992). Because by the successful delivery of proteins into the vacuole, defects in this direction inevitably impact aging to retain organelle identity and function. Using a competitive genome-wide screen was performed on viable deletion mutants to identify genes implicated in protein targeting to the vacuole, involved in the regulation of yeast chronological life span. (Fabrizio et al., 2010). Genetic and molecular methods On genetic and molecular side different techniques were already used in the anti-aging yeast studies, anti-aging genes expression by RT-PCR or the quantification of the telomere length. Databases such as Saccharomyces Genome Database (SGD; http://www.yeastgenome.org/), GenAge give freely available information to the scientific community in experimental design to facilitate research into the biology of budding yeast S. cerevisiae as model organism. SGD collects and organizes scientific information for the budding yeast Saccharomyces cerevisiae as model organism with search and analysis tools to explore these data, enabling the discovery of functional relationships between sequence and gene products in fungi and higher organisms. The Human Aging Genomic Resources (HAGR) (http://genomics.senescence.info/genes/human. html) is the publicly benchmark databases and tools designed to help researchers study the

134
genetics of human aging, divided into two main sections: human potential aging-associated genes and longevity-associated genes in model organisms. Gene expression using Real Time – Polymerase Chain Reaction Presently (27.04.2021), GenAge database (https://genomics.senescence.info/genes/search.php?organism=Saccharomyces+cerevisiae&show=5) contains 911 aging-associated genes in Saccharomyces cerevisiae as model organism, based on current evidence. The most studied aging-associated genes in S. cerevisiae are presented in Table 2. SIR2 from S. cerevisiae plays a significantly role in modulation of cellular senescence and increasing ribosomal
DNA (rDNA) longevity and stability under the TOR inhibition (Ha and Huh, 2011). The involvement of the TOR (target of rapamycin) pathway in aging and lifespan regulation, by gene deletion of Sch9 (functional ortholog of mammalian S6K) has been studied extensively (see review Papadopoli et al., 2019). GLR1 has a significant role to play in protecting and avoiding cellular oxidative stress and GPX1 is recognized as one of the antioxidant enzymes that removes the free radicals and lipid peroxide (Grant et al., 1996; Harrison et al., 2009; Shirazi et al., 2013). The RT-PCR assay was carried out to investigate the effects of plant extracts on several aging-associated genes expression level.
Table 2. List of some aging-associated genes in S. cerevisiae from GenAge database, mentioned in this paper
Gene Known functions and activities Lifespan Effect
TOR1 PIK-related protein kinase and rapamycin target
Deletion increased mean and maximum lifespan by 20%
SCH9 Controls cAPK activity, required for nitrogen activation of the FGM pathway
Mutations increase resistance to oxidants and extend lifespan by up to threefold. Stress-resistance transcription factors Msn2/Msn4 and protein kinase Rim15 are required for this life-extension.
SIR2 Conserved NAD+ dependent histone deacetylase of the Sirtuin family
Involve in the regulation of the aging process
URH1 URidine Hydrolase Replicative lifespan increased UTH1 Uth1p Mutation increases lifespan and stress resistance. SOD1/SOD2 Cytosolic/mitochondrial superoxide
dismutases. Protects cells against oxygen toxicity
Overexpression of Sod1 and Sod2 extends survival
Natural overexpression of SIR2 gene could be correlated with the replicative life spans of yeast cells (Guo et al., 2011). Hesperidin derived from Citrus genus has been reported to produce anti-aging effects in yeast via the UTH1 gene expression, and increase in SIR2 activity (Sun et al., 2012). In another study was evidenced the anti-aging effects of the polyphenolic compound in apple extract by upregulation gene expression of aging pathway (SIR2) and antioxidant (SOD1 and SOD2) in yeast via RT-PCR (Xiang et al., 2011). Parishin from Gastropodia elata extends the lifespan of yeast by increasing of the SIR2 gene expression, and inhibition of the UTH1/TOR signalling pathway (Lin et al., 2016). By using RT-PCR have been demonstrated that the potential of roselle petal extract at 300 ppm concentration was able to upregulate of genes involved in tolerance mechanism opposed to oxidative stress (GLR1 and GPX1) and key
genes in aging pathway like SIR2 (Sarima et al., 2019). Quantifying telomere length Examination of the end fragment of the Terminal Restriction (TRF) is the initial technique established for telomere duration and is thus often referred to as a form of "gold standard." This technique uses a cocktail of regular cutting restriction enzymes to exhaustively digest genomic DNA that do not have recognition positions in the telomeric and subtelomeric region (and thus do not "recut" telomerical DNA). The preserved telomeres are then resolved by size of all chromosomes. The various lengths of telomeres, the size and strength of the strain are compared to a DNA ladder consisting of defined fragment dimensions (Allshire et al., 1989; Harley et al., 1990; Kimura et al., 2010).

135
For this technique and for all other approaches for quantifying telomere length, the integrity of derived genomic DNA is important. Clearly, the degradation of DNA - a mechanism by which DNA is fragmented into smaller fragments - can contribute to inaccuracies in telomere length evaluation and to a tendency towards shorter lengths. DNA degradation may be caused by many different factors, including the frequent thawing and freezing of the DNA, long time-out of DNA at room temperature and incorrect purification of residual nuclears. Cautionary steps must also be taken to avoid deterioration in the handling and extraction of genomic DNA (Aubert et al., 2012). This provides the ability to compare findings from other investigators and to include an estimation of the kilobase size for the telomere period. Furthermore, since this approach does not entail the use of expensive advanced equipment, proof-of-concept experiments can be an appropriate technique. A drawback is to use subtelomeric DNA contiguous to the telomere, thus over-estimating the true telomere length, by using the restriction enzymes. Subtelomeric and telomeric areas can also contain polymorphisms that may confuse data understanding. Even if various restriction enzymes are used, the findings can vary from laboratory to laboratory. Other shortcomings of the TRF test include a large quantity of DNA (micrograms) needed for which this procedure is more commonly used than other tissue samples for the analysis of telomere length in blood samples. This technique is intensive and cannot detect short telomeres on a limited number of chromosomes, which represent hybridizing limitations because very short telomeres cannot connect the sample efficiently (Martin-Ruiz et al., 2015). These short coming are significant limits for using the TRF method for evaluating telomeres for studies involving large numbers of people using epidemiological study design approaches, and for the fact that the TRF value is expressed as a mean of the smear dimension not providing information on single telomeres (non-clear recognition of the range or values at the extremities of the smears spectrum) (Aubert et al., 2012). Zubko et al.
(2016) developed an advanced PCR-method refined as ATLAS (A-dvanced T-elomere L-ength A-nalysis in S. cerevisiae) for direct visualization of telomere length differences in routine experiments with Saccharomyces cerevisiae, showing strong correlation of results with data obtained by Southern blot hybridization.
CONCLUSIONS The results which we reviewed prove that S. cerevisiae is the ideal candidate to demonstrate the anti-aging effects of various plant extracts or active substances isolated from plant sources. The small and relatively well-defined genome makes yeast a prime model in a basic setting for researching complex cellular processes. Initial drug development using yeast was initiated by several pharmacological scans; often with other laboratory models the screening technique is unworkable. As a screening medium for anti-aging compounds, yeast has been long time underestimated. The increasing number of instruments and methods available to measure lifetime in a high-performance manner further opens up the opportunity for anti-aging screens dependent on the yeast. Therefore, it is recommended using that more than one method for the study of the influence of anti-aging effect of the plant extracts on yeast cells. In this way, it will obtain full and complexes results that can be helpful to understand the mechanisms of the aging process. Yeast viability is a powerful readout which makes translative use in research fields of bioactive compounds apart from aging based on the hypothesis that compounds that reduce viability might be good and applicable against development of anarchic cells. Although the categorical anti-aging effects of certain plants have been proven on S. cerevisiae and rarely on small animals, we must not interpret this fact as being categorical for the human body as well. Yeast has a wide capacity to unveil innovative pharmacological approaches against aging and we are confident that they will remain substantially involved in drug development in the field.

136
REFERENCES Allshire, R. C., Dempster, M., Hastie, N. D. (1989).
Human telomeres contain at least three types of G-rich repeat distributed non-randomly. Nucleic Acids Research, 17. 4611–4627.
Astuti, R. I., Watanabe, D., Takagi, H. (2016). Nitric oxide signaling and its role in oxidative stress response in Schizosaccharomyces pombe. Nitric Oxide, 52. 29‒40.
Astuti, R. I., Listyowati, S., Wahyuni, W. (2019). Life span extension of model yeast Saccharomyces cerevisiae upon ethanol derived-clover bud extract treatment. IOP Conference Series: Earth and Environmental Science, 299. 012059.
Aubert, G., Hills, M., Lansdorp, P. M. (2012). Telomere length measurement—Caveats and a critical assessment of the available technologies and tools. Mutation Research/Fundamental and Molecular Mechanisms of Mutagenesis, 730. 59–67.
Aufschnaiter, A., Büttner, S. (2019). The vacuolar shapes of ageing: From function to morphology. Biochimica et Biophysica Acta (bba) - Molecular Cell Research, 1866, 957–970.
Baba, M., Takeshige, K., Baba, N., Ohsumi, Y. (1994). Ultrastructural analysis of the autophagic process in yeast: detection of autophagosomes and their characterization, Journal of Cell Biology, 124. 903–913.
Banta, L. M., Robinson, J. S., Klionsky, D. J., Emr, S. D. (1988). Organelle assembly in yeast: characterization of yeast mutants defective in vacuolar biogenesis and protein sorting, Journal of Cell Biology, 107. 1369–1383.
Barzegar, A., Moosavi-Movahedi, A. A. (2011). Intracellular ROS protection efficiency and free radical-scavenging activity of curcumin. PloS ONE,6. e26012.
Bonangelino, C. J., Nau, J. J., Duex, J. E., Brinkman, M., Wurmser, A. E., Gary, J. D., Emr, S., D., Weisman, L. S. (2002). Osmotic stress-induced increase of phosphatidylinositol 3,5-bisphosphate requires Vac14p, an activator of the lipid kinase Fab1p, Journal of Cell Biology, 156. 1015–1028.
Bratic, A., Larsson, N.G. (2013). The role of mitochondria in aging. The Journal Clinical Investigation, 123(3), 951–957.
Burtner, C. R., Murakami, C. J., Kennedy, B. K., Kaeberlein, M. (2009). A molecular mechanism of chronological aging in yeast. Cell Cycle, 8. 1256–1270.
Chanaj-Kaczmarek, J., Wysocki, M., Karachitos, A., Wojcińska, M., Bartosz, G., Matławska, I., Kmita, H. (2015). Effects of plant extract antioxidative phenolic compounds on energetic status and viability of Saccharomyces cerevisiae cells undergoing oxidative stress, Journal of Functional Foods, 16, 364-377.
Dakik, P. (2020). Prolonging the Longevity of Budding Yeast: New Aging-Delaying Plant Extracts and the Identification of their Cellular Signaling Pathways. PhD thesis, Concordia University.
Fabrizio, P., Longo, V.D. (2003). The chronological life span of Saccharomyces cerevisiae. Aging Cell, 2. 73–81.
Fabrizio, P., Battistella, L., Vardavas, R., Gattazzo, C., Liou, L.L., Diaspro, A., Dossen, J.W., Gralla, E. B., Longo, V. D. (2004). Superoxide is a mediator of an altruistic aging program in Saccharomyces cerevisiae. Journal of Cell Biology, 166. 1055–1067.
Fabrizio, P., Gattazzo, C., Battistella, L., Wei, M., Cheng, C., McGrew, K., Longo, V.D. (2005). Sir2 blocks extreme life-span extension. Cell, 123. 655–667.
Fabrizio, P., Longo, V.D. (2007). The chronological life span of Saccharomyces cerevisiae.Methods in Molecular Biology, 371. 89–95.
Fabrizio, P., Hoon, S., Shamalnasab, M., Galbani, A., Wei, M., Giaever, G., Nislow, C., Longo, V. D. (2010). Genome-wide screen in Saccharomyces cerevisiae identifies vacuolar protein sorting, autophagy, biosynthetic, and tRNA methylation genes involved in life span regulation. PLoS Genetics, 6. e1001024.
Goffeau, A., Aert, R., Agostini-Carbone, M.L. et al. (1997) The yeast genome Directory. Nature 387, 5.
Goffeau, A. (2000). Four years of post-genomic life with 6,000 yeast genes. FEBS Letters, 480. 37–41
Grant, C. M., Lindsay, P. C., Jung, H. R., Ian, W. D. (1996). Yeast glutathione reductase is required for protection against oxidative stress and is a target gene for yAP 1 transcriptional regulation. Molecular Microbiology, 21. 171-179.
Greig, D., Leu, J. Y. (2009). Natural history of budding yeast. Current Biology, 19. R886–R890.
Guha, P., Dey, A., Dhyani, M. V., Sen, R., Chatterjee, M., Chattopadhyay, S., Bandyopadhyay, S. K. (2010). Calpain and caspase orchestrated death signal to accomplish apoptosis induced by resveratrol and its novel analog hydroxstilbene-1 in cancer cells. Journal of Pharmacology and Experimental Therapeutics, 334. 381–394.
Guo, Z. H., Adomas, A. B., Jackson, E. D., Qin, H. & Townsend, J. P. (2011). SIR2 and other genes are abundantly expressed in long-lived natural segregants for replicative aging of the budding yeast Saccharomyces cerevisiae. Fems Yeast Research, 11, 345–355.
Ha, C. W., Huh, W. K. (2011). The implication of Sir2 in replicative aging and senescence in Saccharomyces cerevisiae. Aging, 3. 319‒324.
Hanson, P. K. (2018). Saccharomyces cerevisiae: A Unicellular Model Genetic Organism of Enduring Importance. Current Protocols Essential Laboratory Techniques, 16. 1.
Harley, C. B., Futcher, A. B., Greider, C. W. (1990). Telomeres shorten during ageing of human fibroblasts. Nature, 345. 458–460.
Harrison, D. E., Strong, R., Sharp, Z. D., Nelson, J. F., Astle, C. M., Flurkey, K., Nadon, N. L., Wilkinson, J. E., Frenkel, K., Carter, C. S. (2009). Rapamycin fed late in life extends lifespan in genetically heterogeneous mice. Nature, 460. 392–395.
Hu, A., Huang, J. J., Zhang, J. F., Dai, W. J., Li, R. L., Lu, Z. Y., Duan, J. L., Chen, X. P., Fan, J. P., Xu, W.

137
H., Zheng, H. L. (2017). Curcumin induces G2/M cell cycle arrest and apoptosis of head and neck squamous cell carcinoma in vitro and in vivo through ATM/Chk2/p53-dependent pathway. Oncotarget, 8. 50747–50760.
http://www.yeastgenome.org/ http://genomics.senescence.info/genes/human.html https://genomics.senescence.info/genes/search.php?organ
ism=Saccharomyces+cerevisiae&show=5 Jaiswal, A. S., Marlow, B. P., Gupta, N., Narayan S.
(2002). Beta Catenin-mediated transactivation and cell—cell adhesion pathways are important in curcumin (diferuylmethane)- induced growth arrest and apoptosis in colon cancer cells. Oncogene, 21. 8414–8427.
Kaeberlein, T. L., Smith, E. D., Tsuchiya, M., Welton, K. L., Thomas, J. H., Fields, S., Kennedy, B. K., Kaeberlein, M. (2006). Lifespan extension in Caenorhabditis elegans by complete removal of food. Aging Cell, 5. 487–494.
Kaeberlein, M. (2010). Lessons on longevity from budding yeast. Nature, 464. 513–519.
Karathia, H., Vilaprinyo, E., Sorribas, A., and Alves, R. (2011) Saccharomyces cerevisiae as a model organism: A comparative study, PLoS One 6, 1–10.
Kimura, M., Stone, R. C., Hunt, S. C., Skurnick, J., Lu, X., Cao, X., Aviv, A. (2010). Measurement of telomere length by the Southern blot analysis of terminal restriction fragment lengths. Nature Protocols, 5. 1596–1607.
Krzepiłko, A. (2009). Assessment of aging in Saccharomyces cerevisiae yeast mutants using microscopy techniques. Polish Journal of Environmental Studies 18, 399–404.
Kwolek-Mirek, M. and Zadrag-Tecza, R. (2014) Comparison of methods used for assessing the viability and vitality of yeast cells. FEMS Yeast Research, 14. 1068–1079.
Lee, G. D., Wilson, M. A., Zhu, M., Wolkow, C. A., de Cabo, R., Ingram, D. K., Zou, S. (2006). Dietary deprivation extends lifespan in Caenorhabditis elegans. Aging Cell, 5. 515–524.
Lee, S.H., Min, K.J. (2019). Drosophila melanogaster as a model system in the study of pharmacological interventions in aging. Translational Medicine of Aging 3. 98–103.
Lee, S. S., Avalos Vizcarra, I., Huberts D. H. E. W., Lee L. P., Heinemann, M. (2012). Whole lifespan microscopic observation of budding yeast aging through a microfluidic dissection platform, Proceedings of the National Academy of Sciences, 109. 4916–4920.
Lin, Y., Sun, Y., Weng, Y., Matsuura, A., Xiang, L. (2016). Parishin from Gastropodia elata extends the lifespan of yeast via regulation of sir2/uth1/TOR signaling pathway. Oxidative Medicine and Cellular Longevity, 2016. 4074690‒4074690.
Longo, V. D., Gralla, E. B., Valentine, J. S. (1996). Superoxide dismutase activity is essential for stationary phase survival in Saccharomyces cerevisiae. Mitochondrial production of toxic oxygen species in vivo. Journal of Cell Biology, 271. 12275–12280.
Longo, V. D. (1997). The Pro-senescence Role of Ras2 in the Chronological Life Span of Yeast. Los Angeles, U.S.A: University of California Los Angeles (pp. 112–153).
Longo, V. D., Shadel, G. S., Kaeberlein, M., Kennedy, B. (2012). Replicative and chronological aging in Saccharomyces cerevisiae. Cell metabolism, 16(1). 18–31.
Lutchman, V., Dakik, P., McAuley, M., Cortes, B,, Ferraye, G,, Gontmacher, L,, Graziano, D,, Moukhariq, F.Z.,, Simard, É, ,Titorenko, V.I..(2016). Six plant extracts delay yeast chronological aging through different signaling pathways. Oncotarget. 7. 50845–63.
Madeo, F., Fröhlich, E., Ligr, M., Grey, M., Sigrist, S. J., Wolf, D. H., Fröhlich, K. U. (1999). Oxygen stress: a regulator of apoptosis in yeast. Journal of Cell Biology, 145. 757–67
Madia, F., Gattazzo, C., Fabrizio, P., Longo, V. D. (2007). A simple model system for age-dependent DNA damage and cancer. Mechanisms of Ageing and Development,128. 45–49.
Mack, H.I.D., Heimbucher, T., Murphy, C.T. (2018). The nematode Caenorhabditis elegans as a model for aging research. Drug Discovery Today: Disease Models, 27, 3–13.
Martin-Ruiz, C. M., Baird, D., Roger, L. Boukamp, P., Krunic, D., Cawthon, R., Dokter, M. M., van der Harst, P., Bekaert, S., de Meyer, T., Roos, G., Svenson, U., Codd, V., Samani, N. J., McGlynn, L., Shiels, P. G., Pooley, K. A., Dunning, A. M., Cooper, R., Wong, A., Kingston, A., von Zglinicki. T. (2015). Reproducibility of telomere length assessment: an international collaborative study. International Journal of Epidemiology, 44(5). 1673–1683.
Metodiewa, D., Jaiswalm, A. K., Cenas, N., Dickancaité, E., Segura-Aguilar, J. (1996). Quercetin may act as a cytotoxic prooxidant after its metabolic activation to semiquinone and quinoidal product. Free Radical Biology and Medicine, 26. 107–116.
Minear S., O’Donnell A.F., Ballew A., Giaever G., Nislow C., Stearns T., Cyert M.S. (2011). Curcumin inhibits growth of Saccharomyces cerevisiae through iron chelation. Eukaryot Cell 10:1574–1581
Minois, N., Frajnt, M., Wilson, C., Vaupel, J. W. (2005). Advances in measuring lifespan in the yeast Saccharomyces cerevisiae. Proceedings of the National Academy of Sciences, 102. 402–406.
Molon, M., Szajwaj, M., Tchorzewski, M., Skoczowski, A., Niewiadomska, E., Zadrag-Tecza, R. (2016). The rate of metabolism as a factor determining longevity of the Saccharomyces cerevisiae yeast. Age, 38. 11.
Molon, M., Panek, A., Molestak, E., Skoneczny, M., Tchorzewski, M., Wnuk, M. (2018). Daughters of the budding yeast from old mothers have shorter replicative lifespans but not total lifespans. Are DNA damage and rDNA instability the factors that determine longevity? Cell Cycle,17. 1173–1187.
Mortimer, R.K., Johnston, J.R. (1959). Life span of individual yeast cells. Nature, 183. 1751‒1752
Murakami, C. J., Wall, V., Basisty, N., Kaeberlein, M. (2011). Composition and acidification of the culture

138
medium influences chronological aging similarly in vineyard and laboratory yeast. PLoS ONE, 6. e24530.
Ortega, R., Garcia, N. (2009). The flavonoid quercetin induces changes in mitochondrial permeability by inhibiting adenine nucleotide translocase. Journal of Bioenergetics and Biomembranes, 41. 41‒7.
Pan, Y., Schroeder, E. A., Ocampo, A., Barrientos, A., Shadel, G. S. (2011). Regulation of yeast chronological life span by TORC1 via adaptive mitochondrial ROS signaling. Cell Metabolism, 13. 668–678.
Papadopoli, D, Boulay K, Kazak L, Pollak M, Mallette F, Topisirovic I, Hulea L., (2019) mTOR as a central regulator of lifespan and aging. F1000Research. 8:998.
Raymond, C. K., Howald-Stevenson, I., Vater, C. A., Stevens, T. H. (1992). Morphological classification of the yeast vacuolar protein sorting mutants: evidence for a prevacuolar compartment in class E vps mutants, Molecular Biology of the Cell,3. 1389–1402.
Re, R., Pellegrini, N., Proteggente, A., Pannala, A., Yang, M. (1999). Antioxidant activity applying an improved ABTS radical cation decolorization assay. Free Radical Biology and Medicine, 26. 1231‒1237.
Rothman, J. H., Howald, I., Stevens, T. H. (1989). Characterization of genes required for protein sorting and vacuolar function in the yeast Saccharomyces cerevisiae. The EMBO Journal, 8. 2057–2065.
Sarima, R. I. A., Meryandini, A. (2019). Modulation of Aging in Yeast Saccharomyces cerevisiae by Roselle Petal Extract (Hibiscus sabdariffaL.). American Journal of Biochemistry and Biotechnology, 15. 23‒32.
Sherman, F. (1998). An introduction to the genetics and molecular biology of the yeast Saccharomyces cerevisiae.
Shirazi, A., Ehsan, M., Ghazale, G. , Mehran, M., Mahmoud, G. (2013). Evaluation of radio-protective effect of melatonin on whole body irradiation induced liver tissue damage. Cell Journal, 14. 292‒297.
Stępień, K., Wojdyła, D., Nowak, K., Mołoń, M. (2020). Impact of curcumin on replicative and chronological aging in the Saccharomyces cerevisiae yeast. Biogerontology, 21(1). 109–123.
Stirpe, M., Palermo, V., Bianchi, M. M. (2017). Annurca apple (M. pumila Miller cv Annurca) extracts act against stress and ageing in S. cerevisiae yeast cells. BMC Complementary and Alternative Medicine, 17. 200.
Sudiyani, Y., Prastya, M.E., Maryana, R., Triwahyuni E. and Muryanto (2021). The Budding yeast Saccharomyces cerevisiae as a valuable model organism for investigating anti-aging compounds. IntechOpen, DOI: 10.5772/intechopen.96662.
Sun, K., Xiang, L., Ishihara, S., Matsuura, A., Sakagami, Y., Qi, J. (2012). Anti-aging effects of hesperidin on Saccharomyces cerevisiae via inhibition of reactive oxygen species and UTH1 gene expression. Bioscience, Biotechnology, and Biochemistry, 76(4). 640–645.
Sunthonkun, P., Palajai, R., Somboon, P. (2019). Life-span extension by pigmented rice bran in the model yeast Saccharomyces cerevisiae. Scientific Reports, 9. 18061.
Vanhooren, V., Libert, C., (2013). The mouse as a model organism in aging research: usefulness, pitfalls and possibilities. Ageing Research Reviews, 12, 8–21.
Wang, H., Joseph, J. A. (1999). Quantifying cellular oxidative stress by dichlorofluorescein assay using microplate reader. Free Radical Biology and Medicine, 27(5–6). 612–616.
Wei, M., Fabrizio, P., Hu, J., Ge, H., Cheng, C., Li, L., Longo, V. D. (2008). Life span extension by calorie restriction depends on Rim15 and transcription factors downstream of Ras/PKA, Tor and Sch9. PLoS Genetics, 4. e13.
Wei, M., Fabrizio, P., Madia, F., Hu, J., Ge, H., Li, L. M., Longo, V. D. (2009). Tor1/Sch9-regulated carbon source substitution is as effective as calorie restriction in life span extension. PLoS Genetics, 5. e1000467.
Weisman, L. S. (2003). Yeast vacuole inheritance and dynamics, Annual Review of Genetics, 37. 435–460.
Werner-Washburne, M., Braun, E. L., Crawford, M. E., Peck, V. M. (1996). Stationary phase in Saccharomyces cerevisiae. Molecular Microbiology, 19. 1159– 1166.
Xiang, L., Sun, K., Lu, J., Weng, Y., Taoka, A. (2011). Anti-aging effects of phloridzin, an apple polyphenol, on yeast via SOD and SIR2 genes. Bioscience, Biotechnology, and Biochemistry, 75. 854-858.
Zadrag-Tecza, R., Bartosz ,G., Bilinski, T. (2008). Is the yeast a relevant model for aging of multicellular organisms? An insight from the total lifespan of Saccharomyces cerevisiae. Current Aging Science, 1(3). 159–165.
Zadrag-Tecza, R., Kwolek-Mirek, M., Alabrudzińska, M., Skoneczna, A. (2018). Cell size influences the reproductive potential and total lifespan of the Saccharomyces cerevisiae yeast as revealed by the analysis of polyploid strains. Oxidative Medicine and Cellular Longevity, 17.
Zimmermann, A., Hofer, S., Pendl, T., Kainz, K., Madeo, F., Carmona-Gutierrez, D. (2018). Yeast as a tool to identify anti-aging compounds. FEMS Yeast Research, 18(6).
Zubko, E.I., Shackleton, J.L., Zubko, M.K. (2016). ATLAS: An advanced PCR-method for routine visualization of telomere length in Saccharomyces cerevisiae. International Journal of Biological Macromolecules 93. 1285–1294.

139
THE BIOLOGICAL ACTIVITY IN VIVO AND IN VITRO OF CENTAUREA CYANUS, LACTARIUS PIPERATUS AND RIBES RUBRUM
Cristina Monica DABULICI1, Emanuel VAMANU1, Nand Rai SACHCHIDA2
1University of Agronomic Sciences and Veterinary Medicine of Bucharest, 59 Mărăști Blvd, District 1, Bucharest, Romania
2Centre of Biotechnology, University of Allahabad, Prayagraj, 211002, India
Corresponding author email: [email protected] Abstract Plants are a valuable source of secondary metabolites, which due to their biological activity, are widely used in various industries, such as cosmetology, pharmaceutical, and food. For this purpose, the plants from the flora of Romania are collected. We can say that both in vivo and in vitro plant culture remains a world ar research topic. The research aims to discover biological activity, discuss the scientifically proven benefits of plants, understand the challenges of in vivo and in vitro research, and evaluate new mechanisms of biological activity of Centaurea cyanus, Lactarius metabolites, and Ribes rubrum extract, discuss the scientifically proven benefits of plants, understand the challenges of in vivo and in vitro research, and evaluate new mechanisms of biological activity. More reports have been written in vitro activity of the C. cyanus lyophilized extract obtained from the flower leaves, demonstrated anti-hemolytic activity. Different species of the genus Lactarius present various biochemicals, which can be useful together with the morphological characteristics, and they can facilitate the taxonomic correlation of the Lactarius species. R. Nigrum leaves have shown the best effect in wound healing. Key words: biological activity, in vitro, in vivo, plant extracts. INTRODUCTION Throughout history, herbs have proven to be good medicine in treating various wounds, so detailed clinical studies have begun to be performed on their benefits, leading to the discovery that they have a multitude of effects, such as recovery tissue, hydration, uniformity, cell renewal, etc. (Das et al., 2017). Numerous studies have been made in recent years related to traditional medicine and its chemical composition and its effect on human health. Among the medicinal plants used in folk medicine to treat lesions are the species Ribes. These are easy to notice, being green shrubs throughout the year with variously colored fruits, either black or red, with a good taste. They were found in temperate climates, especially the northern parts of the world (Heywood et al., 2007). These species are not only used for medical purposes but also in various preparations, such as cake, ice cream, jam, but also in alcoholic and fermented beverages (Weigend, 2007).
Known as cornflower, Centaurea cynanus’s extract was used in various treatments such as gastric, ocular, nerve, dermatological diseases, stimulant, tonic, and diuretic (Pieroni et al., 2004; Redžić, 2007; Al-Snafi, 2015). The blue coloration of the petals contains protocyanin, and results from a complexion of the quinoidal base of anthocyanidin and the metal ions. The extracts of the Centaurea cyanus present in vitro functional properties: anti-inflammatory, antioxidant and antibacterial, as well as cytotoxic effect and gastroprotective activity. The research objectives are: discussing the scientifically proven benefits, discovering the biological activities, and in vitro and in vivo research of the three plants: Centaurea cyanus, Ribes rubrum and Lactarius piperatus. MATERIALS AND METHODS The materials used are represented by scientific publications from around the world. The research aims to discover biological activity, discuss the scientifically proven benefits of plants, understand the challenges of
Scientific Bulletin. Series F. Biotechnologies, Vol. XXV, No. 1, 2021ISSN 2285-1364, CD-ROM ISSN 2285-5521, ISSN Online 2285-1372, ISSN-L 2285-1364

140
in vivo and in vitro research, and evaluate new mechanisms of biological activity of Centaurea cyanus, Lactarius metabolites, and Ribes rubrum extract, discuss the scientifically proven benefits of plants, understand the challenges of in vivo and in vitro research, and evaluate new mechanisms of biological activity. RESULTS AND DISCUSSIONS IN VIVO AND IN VITRO BIOLOGICAL ACTIVITY Centaurea cyanus - Cornflower Escher et al. (2018) have studied the anti-hemolytic activity of the lyophilized extract of Centaurea cyanus following the procedures made by Antonini and Brunori (1971). The study object was the evaluation of the chemical composition and the functional properties in vivo and the increase of the extraction situations of the aqueous extract obtained from the flower petals of Centaurea cyanus flowers are being used as aqueous extras in the traditional medicine. In the specialty literature, no study has been found regarding the statistical optimization of phytochemical extraction conditions in this plant, being necessary to investigate the influence of time and temperature on phytochemical extraction and its properties in vitro. Anti-hemolytic activity in vitro The anti-hemolytic activity of lyophilized C. cyanus extract was made according to the procedures described by Antonini and Brunori (1971), and the study used a blood sample. The in vitro activity of the C. cyanus extract demonstrated a dose-dependent effect, a protective effect against hemolysis with increasing concentration and a beneficial interaction with the erythrocytes. The erythrocytes are susceptible to oxidative damage due to the formation of the cell membrane by polyunsaturated fatty acids; the presence of oxygen and iron in hemoglobin can ensure hemolysis (Çimen, 2008). Hemolysis consists of releasing hemoglobin into the plasma, which can induce cell apoptosis and the interruption of oxygen consumption, leading to body damage (Tracz et al., 2007).
Many studies have demonstrated that the erythrocytespresent benefits. For example, Singh and Rajini (2008) have observed that the potato peel extract protects the human erythrocytes against in vitro oxidative damage induced by the iron sulfate and ascorbic acid. Bioactive compounds present in plant extracts protect the erythrocyte membrane against damage caused by reactive oxygen species (Singh and Rajini, 2008). Belwal et al. (2017) observed that the Berberis asiatica leaf extract presented anti-hemolytic activity and protective activity against erythrocyte damage. This activity was related to the mixture of compounds, which acts synergistically. Cell viability Escher et al. (2018) determined the in vitro cell viability of Centaurea cyanus aqueous extract by evaluating the cytotoxic effect in the HepG-2, Caco-2 and A549 cell lines. The extract exhibited significant values for all cell lines (IC50 and GI50> 9 00 μg/ mL) resulting in antiproliferative action and low cytotoxicity. According to Radan et al. (2017), a high concentration (2000 μg/ ml) of aqueous Centaurea ragusina L. extract decreased cell viability by 15% compared to untreated cells, corroborating the low cytotoxicity in different Centaurea species. In another study, the extract from whole fruit samples of Centaurea bruguierana did not show cytotoxicity in Caco-2 cells (IC50> 1000 μg/ml) (Ostad et al., 2016). Lactarius piperatus Biological activities of Lactarius metabolites Lactarius species include various species, from which a multitude of compounds are isolated with defined functions that present biological activities that are not dependent on the evolutionary process. The biological properties of the Lactarius species compounds are unknown because they have not been studied at a high level. Anke et al. (1991) discovered the antifungal, phytotoxic and toxic effect on some cells activities of twenty unsaturated dialdehydes from organisms vegetal and fungous, velleral, isovelleral and isoisovelleral, the shyntetic derivatives of the isovelleral compound, are the most important activity. Isovelleral is considered the most active biologically isolated

141
secondary metabolite of the Lactarius species. It had low results in the range of 0.5-5 µg/ml for Gram-positive and Gram-negative and in the range of 0,1-5 µg/ml for certain species of fungi (Vidari et al., 1995). After the research Vidari et al. (1995) noticed the change of structure of a natural sesquiterpene aldehyde, found in the Lactarius species' composition led to antimicrobial and cytotoxic effects. Also, he observed the reduction of mutagenicity, but the introduction of a hydroxyl group in the aldehyde structure is having an inverse impact on the antimicrobial activity. The results of antimicrobial and mutagenic activity were not simultaneous. Therefore they can be separated by a chemical derivatization process. By reducing one or more aldehyde groups of dialdehydes, the compounds of the Lactarius species presented a drastic decrease in the antibacterial and antifungal activities (Vidari et al., 1995). It was also observed that the following compounds: deterol against Acinetobacter calcoaceticus, lactoviolin against tubercle bacilli (Vidari et al., 1995) chrysoreic and rubrocinctal A against Bacillus subtilis and Staphylococcus aureus, phenol against Candida albicans had moderate antimicrobial activity. From this study, phenol was presented as a strong contact allergen. An in vitro antimicrobial activity against Staphylococcus aureus, Bacillus subtilis, and other bacteria and fungi (Vidari et al., 1995) was observed at the compound associated with the flavonoid A, which has a particular activity. A variety of isolated compounds from the Lactarius species, besides the presence of various biological activities, present a resistance in the penetration of meat and fungi’s latex, as they are suspected in gastrointestinal disorders. The compounds derived from the Lactarius species have different tastes, ranging from hot to unpleasant. Responsible for the hot taste and the biological activities of several terpenoids is the unsaturated dialdehyde, being generally found for many biologically active sesquiterpene isolated from Lactarius species (Gamier et al., 1990). A variety of successful methods have been presented to show a quantitative relationship between the structure of unsaturated
dialdehydes and their activity, such as velleral, isivelleral and isoisovelleral. The PLS (Partial least squares) technique showed a good correlations between the chemical and molecular properties of unsaturated dialdehydes and the mutagenic activity in the Ames Salmonella test, membrane toxicity measured as induction of ATP secretion in ELD cells, effect on cell membrane permeability in human neuroblastoma SH-SY5Y cells and inhibitory effect on D1 dopamine receptors (Vidari et al., 1995). It was verified that the most fundamental structural descriptors were the dipol moment, LUMO-HOMO energy difference, lipophilicity, atomic charges of unsaturated dialdehyde funtionality and geometric properties, an example being the distance and dihedral angle between dialdehyde groups. The appearance of metabolites in Lactarius species and their biological significance Recently, studies have been performed on metabolites isolated from Lactarius species, although they are present in many species of this type. For different Lactarius species, only certain compounds were present, these being related to other types, while some are specific to certain species. Similar isolation techniques have been used, but some metabolites are irregularly present in the same species. The swedish authors did not identify Izovelleral, instead, it was found in Lactarius torminosus by american authors. It was stated that the isovelleral and velleral were isolated from the Lactarius piperatus and Lactarius rufur. The subsequent analysisshown that these fungi do not even produce traces of these sesquiterpenes. Neither the isolation of velleraoctone and pyrovellerolactone from L. vellereus nor blenin A from Lactarius torminosus couldn`t be repeated in further investigations. Irregularities occur due to the existence of particular subspecies and their development in various habitats, which makes it easy to confuse the Lactarius species (Vidari et al., 1995). After several analyses, it was observed that any damage to this fungi species' bodies leads to the significant and rapid change of the content into secondary metabolites. It can be easily perceived as having a change of taste or color.

142
Ribes rubrum - Red currant In vivo and in vitro results of the Ribes species The Ribes species are found in temperate climates, and they are green shrubs during the year, with black or red fruits. Over time, the herbs have proven to treat various injuries, leading to numerous clinical studies based on their benefits. These species are also used in various preparations and beverages (Das et al., 2017). Following several researches, Gulsen et al. (2019) discovered the importance of Ribes leaves, having anti-inflammatory effects studied by in vivo and in vitro methods (Tabart et al., 2012), antimicrobial (Paunović et al., 2017), but also high phenol content (Tian et al., 2017), anthocyanins and flavonoids (Paunović et al., 2017). Very good results on Ribes species included tests of antimicrobial activity on microorganisms that cause infections (Bowler et al., 2001). Gulsen et al. (2019) studied Ribes species following the HPLC method. Using this method, they found that Ribes nigrum has a high phenolic concentration and higher concentrations of gallic acid and quercetin. Ribes rubrum has the highest concentration of chlorogenic acid. In several in vitro and in vivo studies, a variety of researchers have demonstrated the benefits of collagenic acid in treating various wounds and injuries (Almeida et al., 2012; Süntar et al., 2012; Chen et al, 2013), and in some in vitro tests have found that some phenols inhibit the action of enzymes that are closely related to the healing process of affected lesions (Higa et al., 2010). Several scientific papers have been presented on phytochemical studies on Ribes species, including the rehydrated phenolic content of Ribes nigrum leaves. Gulsen et al. (2019) using the Ultra-Performance Liquid Chromatography (UPLC) method, determined the collage content. The most significant amount of collagenic acid was detected in R. uva-crispa (23.41 ± 0.45 µg/mg). Significant dominant concentrations of flavonol glycosides, especially quercetin, have been found in Ribes nigrum leaves (Cyboran et al., 2014; Paunović et al., 2017). Petunidine was detected as a
major leaf anthocyanidin (1181 ± 115 µg/g) (Tabart et al., 2011). Following research on the species Ribes, Gulsen et al. (2019) demonstrated that Ribes nigrum had the most significant effect of inducing collagen accumulation and reepithelialization, which suggested a possible migration and proliferation of epithelial cells. In this study, he compared the Triticum vulgare extract from FITO Krem® with the Ribes species extract, and the obtained results showed different degrees of healing of the parameters in favor of Ribes nigrum extract, obtaining more significant value, but on the other hand, analyzing the values partial reepithelialization T. vulgare had better results. These differences between the two extracts may be due to the various active ingredients found in them. R. nigrum leaf extracts have shown the best effect in wound healing. CONCLUSIONS The response surface methodology was adequate for modeling the extraction of phytochemical compounds and obtaining the in vitro bioactive characteristics for cornflower petal extract. It has been observed that in species of the genus Lactarius, there are various bioactive compounds, such as: - these depending on the species and are stored as esters of fatty acids in fungi; - the biological activities of the compounds could be different; - the nature of the fatty acids esterified are different. The types and quantities of secondary metabolites formed in the fruiting bodies depending on the conversion of the original fatty acid ester (s). All these characteristics can be useful together with the morphological characteristics, and they can facilitate the valorization of the Lactarius species. Extracts from R. nigrum leaves have shown the best effect in wound healing. Wound healing activity can be attributed to phenolic compounds especially. However, it is still necessary to disclose the active substances by conducting a detailed isolation study guided by biological activity.

143
REFERENCES Almeida, J.S., Benvegnu, D.M., Boufleur, N.,
Reckziegel, P., Barcelos, R.C.S., Coradini, K., De Carvalho, L.M., Burger, M.E., Beck, R.C.R. (2012). Hydrogels containing rutin intended for cutaneous administration: efficacy in wound healing in rats. Drug Dev. Ind. Pharm. 38(7), 792–799.
Al-Snafi, A.E. (2015). The pharmacological importance of Centaurea cyanus-A review. Int. J. of Pharm. Rev. Res. 5, 379‒38.
Anke H., and Sterner O. (1991). Planta Medica, SI, 344. Antonini, E., Brunori, M. (1971). Hemoglobin and
myoglobin in their reactions with ligands, North-Holland, Amsterdam, Frontiers of biology no. 21, 35‒148.
Belwal, T., Bhatt, I.D., Rawal, R.S., Pande, V. (2017). Microwave-assisted extraction (MAE) conditions using polynomial design for improving antioxidant phytochemicals in Berberis asiatica Roxb. ex DC. leaves. Ind. Crop. Prod. 95,393‒403.
Bowler, P.G., Duerden, B.I., Armstrong, D.G. (2001). Wound microbiology and associated approaches to wound management. Clin. Microbiol. Rev. 14(2), 244–269.
Chen, W.-C., Liou, S.-S., Tzeng, T.-F., Lee, S.-L., Liu, I.-M. (2013). Effect of topical application of chlorogenic acid on excision wound healing in rats. Planta Med. 79, 616–621.
Çimen, M.Y.B. (2008). Free radical metabolism in human erythrocytes. Clin.Chim. Acta 390, 1‒11.
Cyboran, S., Bonarska-Kujawa, D., Pruchnik, H., Zyłka, R., Oszmianski, J., Kleszczynska, H. (2014). Phenolic content and biological activity of extracts of blackcurrant fruit and leaves. Food Res. Int. 65, 47–58.
Das, U., Behera, S.S., Pramanik, K. (2017). Ethno-herbal-medico in wound repair: an incisive review. Phytother Res. 31, 579–590.
Escher G.B., Santos J.S., Rosso N.D., Marques M.B., Azevedo L., Carmo M.A.V., Daguer H., Molognoni L., Prado-Silva L., Anderson S. Sant’Ana, Silva M.C., Granato D. (2018). Chemical study, antioxidant, anti-hypertensive, and cytotoxic/cytoprotective activities of Centaurea cyanus L. petals aqueous extract, Food and Chemical Toxicology.
Gamier, J., Mahuteau J., and Plat M. (1990). Plant. Med. Phytother., 24, 87.
Gulsen K., Suntar I., Ceribaşı A.O., Koroğlu A. (2019). Activity evaluation on Ribes species, traditionally used to speed up healing of wounds: With special focus on Ribes nigrum. Journal of Ethnopharmacology 237(2019), 141–148.
Heywood, V.H., Brummitt, R.K., Culham, A., Seberg, O. (2007). Flowering Plant Families of the World. Firefly Books Press, Ontario, Canada.
Higa, A.C., Ming, H.T., Ding, Y.T., Tawata, S. (2010). Isolation and identification of antioxidant and hyaluronidase inhibitory compounds from Ficus microcarpa L. fil. bark. J. Enzyme Inhib. Med. Chem. 25 (3), 406–413.
Ostad, S.N., Rajabi, A., Khademi, R., Farjadmand, F., Eftekhari, M., Hadjiakhoondi, A., Khanavi, M., (2016). Cytotoxic Potential of Centaurea bruguierana ssp. belangerana: The MTT Assay. Acta Med. Iran. 54, 583‒589.
Paunović, S.M., Mašković, P., Nikolić, M., Miletić, R. (2017). Bioactive compounds and antimicrobial activity of black currant (Ribes nigrum L.) berries and leaves extract obtained by different soil management system. Sci. Hortic. 222 (1), 69–75.
Pieroni, A., Quave, C.L., Villanelli, M.L., Mangino, P., Sabbatini, G., Santini, L., Boccetti, T., Profili, M., Ciccioli, T., Rampa, L.G., Antonini, G, Girolamini, C., Cecchi, M., Tomasi, M. (2004). Ethnopharmacognostic survey on the natural ingredients used in folk cosmetics, cosmeceuticals and remedies for healing skin diseases in the inland Marches, Central-Eastern Italy. J. Ethnopharmacol. 91, 331‒344.
Radan, M., Carev, I., Tešević, V., Politeo, O., Čikeš Čulić, V., (2017). Qualitative HPLC‐DAD‐ESI‐TOF‐MS analysis, cytotoxic and apoptotic effects of Croatian endemic Centaurea ragusina L. aqueous extracts. Chem. Biodivers. 14, e1700099.
Redžić, S.S. (2007). The ecological aspect of ethnobotany and ethnopharmacology of population in Bosnia and Herzegovina. Collegium Antropol 31, 869-890.
Singh, N., Rajini, P.S. (2008). Antioxidant-mediated protective effect of potato peel extract in erythrocytes against oxidative damage. Chem. Biol. Interact. 173, 97‒104.
Süntar, I., Acikara, O.B., Citoglu, G.S., Keles, H., Ergene, B., Akkol, E.K. (2012). In vivo and in vitro evaluation of the therapeutic potential of some Turkish Scorzonera species as wound healing agent. Curr. Pharmaceut. Des. 18 (10), 1421–143.
Tabart, J., Franck, T., Kevers, C., Pincemail, J., Serteyn, D., Defraigne, J.-O., Dommes, J. (2012). Antioxidant and anti-inflammatory activities of Ribes nigrum extracts. Food Chem. 131, 1116–1122.
Tabart, J., Kevers, C., Evers, D., Dommes, J. (2011). Ascorbic acid, phenolic acid, flavonoid and carotenoid profiles of selected extracts from Ribes nigrum. J. Agric. Food Chem. 59(9), 4763–4770.
Tian, Y., Liimatainen, J., Alanne, A.-L., Lindstedt, A., Liu, P., Sinkkonen, J., Kallio, H., Yang, B. (2017). Phenolic compounds extracted by acidic aqueous ethanol from berries and leaves of different berry plants. Food Chem. 220, 266–281.
Tracz, M. J., Alam, J., Nath, K. A. (2007). Physiology and pathophysiology of heme: implications for kidney disease. J. Am. Soc. Nephrol. 18, 414‒420.
Vidari G. and Vita-Finzi P., Sesquiterpenes and Other Secondary Metabolites of Genus Lactarius (Basidiomycetes): Chemistry and Biological Activity. Studies in Natural Products Chemistry, Vol 17© 1995 Elsevier Science B.V. All rights reserved.
Weigend, M. (2007). Grossulariaceae. In: Kubitzki, K. (Ed.), The Families and Genera of Vascular Plants. Flowering Plants, Eudicots, vol. 9 Springer-Verlag, Berlin.

144

145
ENVIRONMENTALBIOTECHNOLOGY

146

147
Scientific Bulletin. Series F. Biotechnologies, Vol. XXV, No. 1, 2021ISSN 2285-1364, CD-ROM ISSN 2285-5521, ISSN Online 2285-1372, ISSN-L 2285-1364
USE OF POLYMERS IN THE DEVELOPMENT OF EDIBLE PACKAGING
MATERIALS FOR FOOD SUPPLEMENTS
Roxana GHEORGHIŢĂ, Sonia AMARIEI, Gheorghe GUTT
“Ştefan cel Mare” University of Suceava, 13 University Street, Suceava, Romania
Corresponding author email: [email protected] Abstract Environmental pollution due to packaging waste requires solutions. Food supplements packaging is usually disposable and is obtained from materials difficult to sort and recycle. For this purpose, new materials were developed; entirely obtained from biopolymers, that can be used as packaging material for food supplements that require solubilisation before consumption. Thus, were developed eight films, with different compositions of agar, sodium alginate, and glycerol. The films were tested in order to evaluate physical and optical properties (thickness, retraction ratio, colour, transmittance or opacity), mechanical (tensile strength, elasticity), but also for the evaluation of humidity or rehydration capacity. The sample obtained from higher amounts of alginate and glycerol showed the best results and was completely solubilized in a very short time, in water, at a temperature of 35°C. For the safety of use and consumption, the films were microbiologically tested. No bacteria, yeasts or moulds developed on the culture media. All substances used are accepted in quantum statis doses. According to the results obtained, biopolymers have properties that can be successfully exploited in order to obtain zero-waste, eco-friendly, biodegradable and compostable packaging. Key words: hydrocolloids, environment, food, material. INTRODUCTION The problems caused by the SARS-CoV-2 pandemic around the world have led scientists to turn their attention, research and resources to finding solutions in order to stop the Coronavirus effects. Thus, they focused on avoiding hunger and restarting the food industry, currently avoiding the problems caused by pollution. This issue needs to be rethought, given that many problems have been out of control including pollution due to the food industry which has long-term negative effects on the environment and public health. In May 2020, the European Commission launched From Farm to Fork strategy to create a fair, healthy and environmentally friendly food system (*). The European Green Deal has outlined the principles by which Europe wants to become the first climate-neutral continent by 2050 (**). The benefits of this program favor the inclusion, the improvement of the health and quality of life of consumers, as well as the protection of the environment, especially due to the fact that EU is the largest importer and explorer of agri-food products in the world. The main objectives are to reduce the
ecological and climate footprint and to strengthen the resilience of the food system. The current challenge is to develop sustainable food. But the manufacture, processing, packaging, transport, storage and marketing of food contribute significantly to air, soil, and water pollution, generating greenhouse gas emissions, with a massive contribution to the decline of biodiversity (Qasim et al., 2020; Shen et al., 2020). Food packaging plays a key role in the sustainability of food systems (Licciardello, 2017; Pauer et al., 2019). At this time, it is desired to reduce the use of hazardous chemicals, both as part of the food product and its packaging (Diggle & Walker, 2020). The aim of EU is to review legislation on food contact materials and support the development of innovative and sustainable packaging developed from environmentally friendly, reusable or recyclable materials, while helping to reduce food waste (Adam et al., 2020). Biodegradable, fully edible materials obtained from biopolymers are a successful alternative to conventional materials (Haider et al., 2019). Based on renewable resources, these materials have found applicability in various industries,
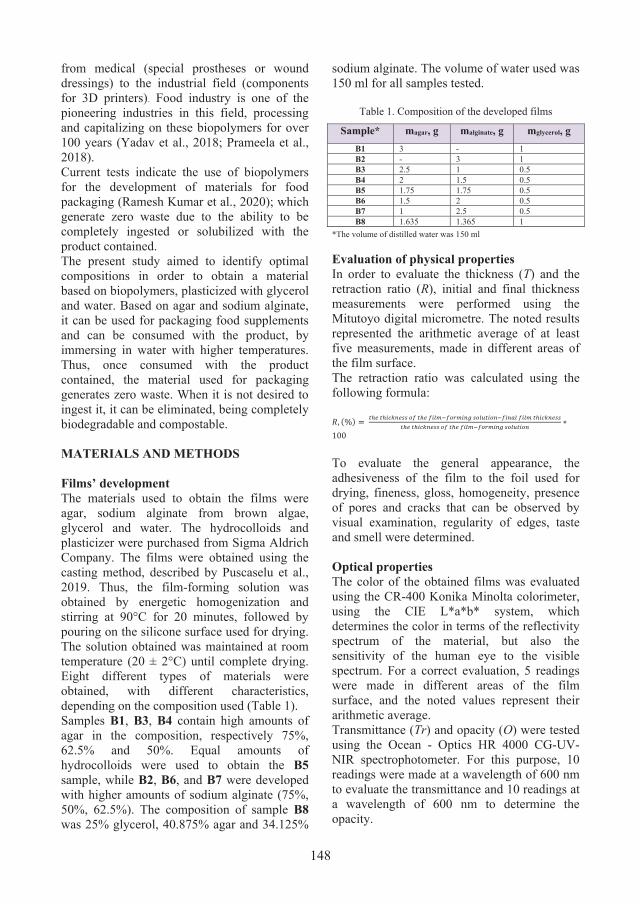
148
from medical (special prostheses or wound dressings) to the industrial field (components for 3D printers). Food industry is one of the pioneering industries in this field, processing and capitalizing on these biopolymers for over 100 years (Yadav et al., 2018; Prameela et al., 2018). Current tests indicate the use of biopolymers for the development of materials for food packaging (Ramesh Kumar et al., 2020); which generate zero waste due to the ability to be completely ingested or solubilized with the product contained. The present study aimed to identify optimal compositions in order to obtain a material based on biopolymers, plasticized with glycerol and water. Based on agar and sodium alginate, it can be used for packaging food supplements and can be consumed with the product, by immersing in water with higher temperatures. Thus, once consumed with the product contained, the material used for packaging generates zero waste. When it is not desired to ingest it, it can be eliminated, being completely biodegradable and compostable. MATERIALS AND METHODS
Films’ development The materials used to obtain the films were agar, sodium alginate from brown algae, glycerol and water. The hydrocolloids and plasticizer were purchased from Sigma Aldrich Company. The films were obtained using the casting method, described by Puscaselu et al., 2019. Thus, the film-forming solution was obtained by energetic homogenization and stirring at 90°C for 20 minutes, followed by pouring on the silicone surface used for drying. The solution obtained was maintained at room temperature (20 ± 2°C) until complete drying. Eight different types of materials were obtained, with different characteristics, depending on the composition used (Table 1). Samples B1, B3, B4 contain high amounts of agar in the composition, respectively 75%, 62.5% and 50%. Equal amounts of hydrocolloids were used to obtain the B5 sample, while B2, B6, and B7 were developed with higher amounts of sodium alginate (75%, 50%, 62.5%). The composition of sample B8 was 25% glycerol, 40.875% agar and 34.125%
sodium alginate. The volume of water used was 150 ml for all samples tested.
Table 1. Composition of the developed films
Sample* magar, g malginate, g mglycerol, g B1 3 - 1 B2 - 3 1 B3 2.5 1 0.5 B4 2 1.5 0.5 B5 1.75 1.75 0.5 B6 1.5 2 0.5 B7 1 2.5 0.5 B8 1.635 1.365 1
*The volume of distilled water was 150 ml Evaluation of physical properties In order to evaluate the thickness (T) and the retraction ratio (R), initial and final thickness measurements were performed using the Mitutoyo digital micrometre. The noted results represented the arithmetic average of at least five measurements, made in different areas of the film surface. The retraction ratio was calculated using the following formula: �, (%) = ��� ��������� �� ��� ������������ �������������� ���� ���������
��� ��������� �� ��� ������������ �������� ∗100 To evaluate the general appearance, the adhesiveness of the film to the foil used for drying, fineness, gloss, homogeneity, presence of pores and cracks that can be observed by visual examination, regularity of edges, taste and smell were determined. Optical properties The color of the obtained films was evaluated using the CR-400 Konika Minolta colorimeter, using the CIE L*a*b* system, which determines the color in terms of the reflectivity spectrum of the material, but also the sensitivity of the human eye to the visible spectrum. For a correct evaluation, 5 readings were made in different areas of the film surface, and the noted values represent their arithmetic average. Transmittance (Tr) and opacity (O) were tested using the Ocean - Optics HR 4000 CG-UV-NIR spectrophotometer. For this purpose, 10 readings were made at a wavelength of 600 nm to evaluate the transmittance and 10 readings at a wavelength of 600 nm to determine the opacity.

149
The opacity was calculated according to the formula:
� (%) = ���������� ���� ���������, (��) ∗ 100
Mechanical properties Tensile strength (TS) and elongation (E) were tested using the Texture Analyzer ESM 301, Mark-10. The test specimens were prepared according to STAS ASTM D882 (Standard Test Method for Tensile Properties of Thin Plastic Sheeting) (***), with 100 mm x 30 mm size. The test was performed at room temperature of 23.5°C.
�� (���) = ��
� (%) = ��� ∗ 100
Where: TS - tensile strength (MPa); F - maximum force applied (N); A- area (m2); E - elongation (%); Δl - elongation (mm); l - initial length (mm). Determination of solubility characteristics The determination of the moisture content of the new materials was performed according to the standardized method STAS 90-88. The solubility of the films is an indicator of their water resistance; the samples (3 x 3 cm) initially weighed were immersed in a container with 50 ml of distilled water (room temperature) where they were kept for 8 hours. Then, the samples were kept at 110°C for 24 hours and then reweighed. The result was obtained by using the following formula:
�� (%) = �0 ��1�0 ∗ 100
Where: W0 - initial mass of the sample (g); W1 - the mass of the reweighted sample (g). To evaluate the humidity, the film samples (3 x 3 cm) were weighed, kept for 24 hours at 110°C and reweighed; the results were obtained by using the following formula:
�� (%) = �0 ��1�0 ∗ 100
Where: W0 - sample weight before drying (g); W1 - sample weight after drying (g).
The water activity index (aw) provides information on the stability of products when it is influenced by their water content. The growth of microorganisms in the food can be inhibited by reducing the water content (dehydration) or by binding it to the food. In general, microorganisms are considered to reduce or even stop their activity at aw index values below 0.7. The water activity index (aw) was determined with AquaLab equipment. The tests were carried out at a temperature of 24.4 ± 0.9°C. The final value represents the average of five readings in different areas of the film surface. The microstructure of the films was evaluated with the MarSurf CWM 100 microscope, owned by the Mahr Gruppe. With the Mountains Lab Premium 8.1 software, it was possible to evaluate the appearance of the samples, their homogeneity, the degree of solubilization of the constituent compounds, and the presence of pores or fissures. Microbiological evaluation Because the material obtained aims to be consumed with the product contained and is intended for all categories of consumers, the safety of ingestion is essential. Thus, for the determination of microbiological properties of the material, the films were tested in order to establish the presence of coliforms, enterobacteria, Staphylococcus aureus, Escherichia coli, as well as for yeasts and molds. For this purpose, Compact Dry plates with specific culture media (Nissui Pharma) were used. To perform the determinations, 1 g of film was homogenized with 9 ml of microbiologically inert solution (here physiological serum). From the solution thus obtained, 1 ml was poured onto the plate with culture medium. The plates were maintained at 37 degrees for 72 hours for yeasts and molds, and 36 hours for the other microorganisms tested. RESULTS AND DISCUSSIONS
Although the films showed medium to high adhesion, all samples were easily removed from the silicone support used for drying process. Samples B1 (75% agar/25% glycerol), B5 (43.75% agar/43.75% alginate/12.5%

150
glycerol), B6 (37.5% agar/50% alginate/12.5% glycerol), B7 (25% agar/62.5% alginate/12.5% glycerol), B8 (40.875% agar/34.125% alginate/25% glycerol) had glossy surface on the inside, the area in direct contact with the silicone support and slight roughness on the outside, in contact with the air. The surfaces of samples B2 (75% alginate/25% glycerol) and B3 (62.5% agar/25% alginate/12.5% glycerol) were glossy on both sides, unlike sample B4 (50% agar/37.5% alginate/12.5 % glycerol), with a strong tendency to flake (Figure 3). Sample B1 showed tendency to retract and break, it was brittle, difficult to handle, with low transparency and dark color. In order to be manipulated, it requires a higher amount of plasticizer or combination with other biopolymers. B2 and B3 showed homogeneous structures, were transparent, odorless, allowed multiple bending, with medium and low solubility, respectively, in the oral cavity. The high content of agar in the composition of samples B1, B3, B4 and B5 led to harder films, with low solubility and even very low in the oral cavity, and unpleasant sensation. This type of material, in this form, cannot be used for packaging food or supplements and be consumed with them, due to the fact that it can negatively influence their sensory characteristics. The presence of pores was evident in the case of films B5, B6, B7, and B8. Uneven distribution of the composition and, implicitly, non-uniformities of the structure, can be observed in films B6 and B8. According to Figures 1 and 2, samples B1, B4 and B5 have values of thickness over 70 μm and, implicitly, low values of the retraction ratio (less than 2%), unlike samples B2, B6, B7 and B8, where the higher amount of sodium alginate led to the development of thinner films, lower than 56 μm, and higher retraction ratio values (27.65- 55.9%).
Figure 1. The thickness of tested samples, in μm
Figure 2. The retraction ratio of tested samples, %
Different results can be observed for B3 sample, where, although the amount of agar is relatively high (62.5% of the content of substances used), the thickness is low (45.8 μm), and the retraction ratio has a value of about 40%. According to the images generated after observation with MarSurf CWM 100 microscope (Figure 3), samples B2 and B3 presented the most homogeneous structures. The results confirm the ability of sodium alginate to create clear, transparent, and pleasant to touch films. Also, the high alginate content increases the solubility of the films. The data obtained is also reinforced by the results shown in Table 1.
75,456,4
45,874,875
55,233,6
52,2
0 20 40 60 80
1
THE THICKNESS OF TESTED SAMPLES
B8 B7 B6 B5 B4 B3 B2 B1

151
B
1 B
2 B
3
B4
B5
B6
B7
B8
Figu
re 3
. Mic
rosc
ope
imag
es o
f tes
ted
film
s

152
Thus, B2 sample could not be evaluated for water solubility, as it was completely solubilized in water. Sample B3, which also contains agar in the composition, maintained its integrity and did not absorb a large amount of water. It was easy to handle and did not present any difficulties in the next steps. However, for use as a package for powdered food supplements, which require solubilization before consumption, film B2 seems to be the ideal option. According to microbiological determinations, none of the microorganisms developed on culture media. This can be related to the low values of the water activity index, aw below 0.45, as can be seen in Table 2. The low values of the water activity index prevent the development and proliferation of microorganisms, as they will not find suitable environments for growth and multiplication. The results indicate the safety of consumption of these packages.
Table 2. Evaluation of water solubility and moisture content
WS (%) MC (%) aw
B1 42.75 ± 0.014 18.865 ± 0.003 0.447 ± 0.004
B2 complete solubilization 16.329 ± 0.002 0.437 ± 0.003
B3 33.57 ± 0.027 11.03 ± 0.023 0.441 ± 0.002
B4 34.963 ± 0.002 10.626 ±0.003 0.435 ± 0.004
B5 42.64 ± 0.03 9.615 ± 0.003 0.43 ± 0.001
B6 42.04 ± 0.038 14.117 ± 0.037 0.408 ± 0.013
B7 29.703 ± 0.002 14.332 ± 0.014 0.435 ± 0.003
B8 42.996 ± 0.406 14.505 ± 0.03 0.435 ± 0.007
The optical and mechanical properties are presented in Table 3 and Table 4. The transmittance (Tr) and lightness (L*) values increased with the increase in the amount of sodium alginate and glycerol, as well as the decrease in agar mass. Thus, the highest values of transmittance (81.10%) and lightness (92.03) were observed in sample B2, with 75% alginate and 25% glycerol. Samples with higher agar content in the composition showed low values of these parameters (B1 and B4). According to the results obtained, sample B2 qualifies for use as packaging material for powdered food supplements. It was completely solubilized in water at temperatures of 20 ± 2°C.
Table 3. The optical properties of the developed films Tr
(%) O
(%) Color
L* a* b* B1 6.63 ±
0.003 18.33 ± 0.982
87.44 ± 0.003
-4.59 ± 0.06
16.79 ± 0.001
B2 81.1 ± 0.026
1.49 ± 0.06
92.03 ± 0.06
-5.62 ± 0.74
12.74 ± 0.15
B3 67.17 ± 0.004
2.67 ± 0.003
90.87 ± 0.093
-5.40 ± 0.002
13.87 ± 0.054
B4 5.39 ± 0.003
12.22 ± 0.021
90.34 ± 0.001
-4.96 ± 0.036
16.09 ± 0.045
B5 19.34 ± 0.015
9.82 ± 0.015
91.11 ± 0.415
-5.30 ± 0.091
14.51 ± 0.15
B6 27.23 ± 0.003
10.28 ± 0.003
91.21 ± 0.042
-5.47 ± 0.013
14.08 ± 0.044
B7 63.79 ± 0.017
5.45 ± 0.001
91.61 ± 0.089
-5.63 ± 0.002
13.42 ± 0.97
B8 15.55 ± 0.003
15.56 ± 0.037
91.3 ± 0.056
-5.37 ± 0.69
13.91 ± 0.002
According to the obtained results, sample B2 can be use as packaging for powdered food supplements (Figure 4). The high value of transmittance (81.10%) and low opacity (1.49%) indicate the need for packaging with an outer packaging. In this sense, paper bags or cardboard boxes can be used, thus avoiding environmental pollution and encouraging the use of recyclable materials.
Figure 4. Food supplements packed in B2 foil
B3, with the best characteristics of solubility and humidity, has very good values of transmittance (67.17%), opacity (2.67%) and lightness (90.87). Thus, the film can be used for packaging products with high humidity. The average value of transmittance makes the transfer of light radiation to be a conditioned one, fact that prevents lipid oxidation and has a positive effect for maintaining and even increasing the sensory properties and, implicitly, the shelf life for this type of product. The values of the parameters a* and b* in the CIE L*a*b* system are closely related to the lightness value. These are lower in the case of samples with a medium and even high content of sodium alginate in the composition and

153
higher in the case of those with a high mass of agar. The test of mechanical properties (Table 4) indicated the highest values of tensile strength for sample B3 (2.78 MPa) and elongation for sample B6 (65.60%).
Table 4. Results of the mechanical properties TS
(MPa) E
(%) B1 * * B2 0.61 ± 0.003 17.80 ± 0.013 B3 2.78 ± 0.001 34.40 ± 0.002 B4 0.11 ± 0.092 10.60 ± 0.367 B5 0.70 ± 0.002 12.20 ± 0.3 B6 1.04 ± 0.065 65.60 ± 0.037 B7 1.62 ± 0.002 39.00 ± 0.38 B8 0.84 ± 0.15 43.20 ± 0.04
*impossible to test, the specimen could not be dimensioned according to the standards used. High values of elongation can be observed in the case of samples B6 (65.60%) and B8 (43.20%), with higher amounts of sodium alginate and glycerol in the composition. The composition of the B2 sample - only sodium alginate and glycerol - facilitated the decrease in tensile strength, the value obtained after testing being 0.61 MPa. Due to the shape, sample B1 could not be tested for mechanical evaluation, because it was impossible to perform the test. CONCLUSIONS
The purpose of these determinations was to develop, characterize and test a new material that can be used for packaging of low moisture content products, such as food supplements. The initiative is very useful, if we take into account the fact that the supplement industry is of great interest to the manufacturing compa-nies. As proof are the figures regarding food supplements notifications; for example, IBA Romania (National Research and Development Institute for Food Bio resources Bucharest, Romania) notified over 920 food supplements in 2020 and over 1500 in 2019 (****). The packaging used mainly for the delivery and sale of these products sold in small portions is usually multilayer, difficult to sort and recycle, highly pollutant to the environment. Taking into account the global and European programs that aim to identify alternative solutions, the newly developed and tested material is of great interest.
According to the results obtained, the sample B7, obtained from 62.5% agar, 25% sodium alginate and 12.5% glycerol presented the best results of physical and optical properties, but also high tensile strength and above average elongation. The sample without the addition of agar in the composition (B1) present the best solubility, but was impossible to be tested in order to establish the mechanical characteristics. According to the microbiological results, all the materials obtained are safe for consumption. The films are free of the tested microorganisms, respectively coliform bacteria, S. aureus, E. coli, enterobacteria or yeasts and molds. Future tests involve the use of films for the packaging of supplements, in order to establish the shelf life and possible changes that occur due to handling, transport, storage and marketing. To improve the sensory and nutritional characteristics and increase their shelf life, various natural substances can be added to the film-forming solution, such as fruit and vegetable powders, essential oils, dyes or flavorings. ACKNOWLEDGEMENTS This work was supported by a grant of the Romanian Ministry of Education and Research, CNCS-UEFISCDI, project number PN-III-P1-1.1-PD-2019-0793, within PNCDI III. REFERENCES Adam, I., Walker, T. R., Bezerra, J. C., & Clayton, A.
(2020). Policies to reduce single-use plastic marine pollution in West Africa. Marine Policy, 116.
Diggle, A., & Walker, T. R. (2020). Implementation of harmonized Extended Producer Responsibility strategies to incentivize recovery of single-use plastic packaging waste in Canada. Waste Management, 110, 20–23.
Haider, T. P., Völker, C., Kramm, J., Landfester, K., & Wurm, F. R. (2019). Plastics of the Future? The Impact of Biodegradable Polymers on the Environment and on Society. Angewandte Chemie International Edition, 58(1), 50–62.
Licciardello, F. (2017). Packaging, blessing in disguise. Review on its diverse contribution to food sustainability. Trends in Food Science and Technology. 65, 32‒39.
Pauer, E., Wohner, B., Heinrich, V., & Tacker, M. (2019). Assessing the Environmental Sustainability of Food Packaging: An Extended Life Cycle

154
Assessment including Packaging-Related Food Losses and Waste and Circularity Assessment. Sustainability, 11(3), 925.
Prameela, K., Murali Mohan, C., & Ramakrishna, C. (2018). Biopolymers for Food Design: Consumer-Friendly Natural Ingredients. Biopolymers for Food Design. Handbook of Food Bioengineering, Academic Press, Elsevier Inc.
Puscaselu, R., Gutt, G., & Amariei, S. (2019). Rethinking the Future of Food Packaging: Biobased Edible Films for Powdered Food and Drinks. Molecules, 24(17), 3136.
Qasim, U., Osman, A. I., Al-Muhtaseb, A. H., Farrell, C., Al-Abri, M., Ali, M., Vo, D. V. N., Jamil, F., & Rooney, D. W. (2020). Renewable cellulosic nanocomposites for food packaging to avoid fossil fuel plastic pollution: a review. Environmental Chemistry Letters, 19, 613‒641.
Ramesh Kumar, S., Shaiju, P., O’Connor, K. E., & P, R. B. (2020). Bio-based and biodegradable polymers - State-of-the-art, challenges and emerging trends. Current Opinion in Green and Sustainable Chemistry, 21, 75‒81.
Shen, M., Song, B., Zeng, G., Zhang, Y., Huang, W., Wen, X., & Tang, W. (2020). Are biodegradable plastics a promising solution to solve the global plastic pollution? Environmental Pollution, 263, 114469.
Yadav, A., Mangaraj, S., Singh, R., Das, S. K., Kumar, N., & Arora, S. (2018). Biopolymers as packaging material in food and allied industry. International Journal of Chemical Studies, 6(2), 2411‒2418.
*https://eur-lex.europa.eu/resource.html?uri=cellar:ea0f9f73-9ab2-11ea-9d2d-01aa75ed71a1.0001.02/DOC_1&format (accessed on February, 21).
**https://ec.europa.eu/info/strategy/priorities-2019-2024/european-green-deal_ro (accessed on February, 21).
***https://petro-pack.com/wp-content/uploads/ASTM-D882_2010_513100089384.pdf (accessed on February, 21).
****https://bioresurse.ro/blogs/notificari-suplimente-alimentare/produse-notificate (accessed on February, 21).

155
SOME BIOTECHNOLOGICAL APPLICATIONS OF CYANOBACTERIA AND GREEN MICROALGAE
Ana Valentina ARDELEAN1, 2, Ioan ARDELEAN1, Loredana Mirela SFÎRLOAGĂ3,
Călina Petruța CORNEA2
1Department of Microbiology, Institute of Biology, Romanian Academy, 296 Splaiul Independentei, Bucharest, 060031, P.O. Box 56-53, Romania
2Faculty of Biotechnology, University of Agronomic Sciences and Veterinary Medicine of Bucharest, 59 Mărăsti Blvd., District 1, Bucharest, Romania
3Research and Development Station for Plant Growing on Sand Dăbuleni, 217 Petre Banița Street, 207220, Dolj County, Romania
Corresponding author email: [email protected]
Abstract In this paper we summarize some of the the biotechnological applications of oxygenic photosynthetic microorganisms (OPhM) , cyanobacteria and green microalgae, with special emphasis on the followings topics: i) epuration of domestic waste waters with simultaneous new biomass synthesis as source for dedicated chemicals (proteins, lipids, pigments, antioxidants etc.,); ii) gamma irradiation at non growth inhibitory doses in order to increase lipid content of the cells; iii) the synthesis of metal nanoparticles by these photosynthetic microorganisms,; iv) the use of living photosynthetic biomass as biocrusts to increase the chemical parameters of soil and physiological characteristics of plants; v) the study their bioelectrochemical properties for biotechnological applications such as the conversion of solar energy in electric energy. These topics are directly related to the experimental activities of the authors and cover partially the huge potential of these microorganisms. Key words: cyanobacteria, microalgae, non-lethal gamma irradiation, domestic waste waters, biomass, biocrusts, nanoparticles, biofuel cells. 1. EPURATION OF DOMESTIC WASTE WATERS, INCLUDING AQUACULTURE WASTE WATERS, WITH SIMULTANEOUS NEW BIOMASS SYNTHESIS The use of oxygenic photosynthetic microorganisms (OPhM) in wastewater treatment plants started almost 70 years ago with the pioneering work of Oswald and his colleagues (Ludwig et al., 1951; Oswald, 2003) and is still an on growing activity; (Pacheco et al., 2020; Solovchenko et al., 2020; Katam & Bhattacharyya, 2020). Although initially the goal of wastewater treatment was to protect downstream users from health risks, nowadays wastewater is perceived as a valuable resource of energy, fertilizers, other products, and clean water (for more details see Kehrein et al., 2020). As reviewed by Wollmann et al., (2019), there are several big companies active in this field.
Oswald Green Technologies has used a symbiotic bacterial algal consortium, known as Advanced Integrated Wastewater Pond System (AIWPSR), to take up both organic and inorganic pollutants (i.e., nutrients) from different types of wastewaters. The US company AlgaeSystems has developed a low-cost offshore floating bioreactor able to treat 50,000 gal day−1 of raw municipal wastewater with removal efficiencies of 75% (total N), 93% (total P), and 93% (BOD) whereas other approaches such as those of HydroMentia, OneWater, and Gross-Wen Technologies exploited microalgal biofilms, immobilized microalgae, or microalgae-bacteria co-cultures (Wollmann et al., 2019). Mambo et al. (2014) reported processes which relies on the combined activity of methane fermentation and photosynthetic oxygenation by algae coupled with biological oxidation in the high-rate ponds to remediate domestic waste waters. In agreement with the authors,
Scientific Bulletin. Series F. Biotechnologies, Vol. XXV, No. 1, 2021ISSN 2285-1364, CD-ROM ISSN 2285-5521, ISSN Online 2285-1372, ISSN-L 2285-1364

156
the main advantages of their systems are: i) the sludge accumulation is extremely slow, so no sludge management is required; ii) carbon (C) is transformed through two important mecha-nisms: methane formation and C-biological assimilation by microalgae processes which provide the basis for primary, secondary, and tertiary treatment; iii) the molecular oxygen produced during oxygenic photosynthesis within the pond is 10-100 times more efficient in the oxygenation capacity as compared with mechanical aerators, which are also very expensive. Furthermore, the described system has been in continuous operation since 1996 and receives 75 m3/d of raw sewage, being also an operational, passive, sequential, sewage treatment facility that functions virtually in perpetuity and without any need for fecal sludge handling (Mambo et al., 2014). In the last five years there is a huge increase in research concerning the use of photosynthetic microorganisms for aquaculture wastewater (AQWW) treatment. This type of wastewater have high nutrient content (i.e., N and P compounds, dissolved organic C) and are considered an appropriate culture media for the growth of different microorganisms including microalgae and cyanobacteria (Ansari et al., 2019). This biomass is rich in proteins, lipids, carbohydrates, and other valuable products, which can subsequently be used to produce high quality aquaculture feed or biofuel (Ansari et al., 2017; Liu et al., 2018). By the utilization of this integrated process, it is not only possible to close the loop in the aquaculture industry, but also to make economical, sustainable and feasible aquaculture (Kehrein et al., 2020). Kuo et al. (2016) used aquaculture wastewater supplemented with additional nutrients-including CO2 form the boiler flue- to cultivate Chlorella sp., whereas Wuang et al. (2016) showed the ability of S. platensis to remove NH4 and NO3 from fish farming wastewater, the obtained biomass being applicable as agricultural fertilizer. Guldhe et al. (2017) working on C. sorokiniana and Ansari et al. (2017) on S. obliquus, C. sorokiniana and A. falcatus showed that N, P and COD removal from AQWW reached values between 70-80% with simultaneous biomass synthesis (150 mg/L/day of biomass rich in lipids, carbohydrates and proteins).
In a large scale experiments (4,500 L), Nogueira et al. (2018) used the cyanobacterium S. platensis for the treatment of fish farming effluents from O. niloticus production, demonstrating that after 9 days of growth, S. platensis was capable of reducing the nitrite (NO2), NO3 and PO4 levels by 100, 98.7, and 94.8%, respectively. At laboratory level, Ardelean et al. (2019) used a selected consortium of OPhM, consisting of both cyanobacteria and microalgae, grown on artificial wastewater and obtained after 7 days of cultivation 0.562 g L-1 dry biomass, with a content of 58.25 mg lipids, 301.25 mg proteins and 2 mg carotenes g-1 dry weight (Ardelean et al., 2019). When it comes to water purification, after 5 days of cultivation the BOD decreased from 130 mg O2 to zero, whereas total N and inorganic P decreased by 7% and 33%, respectively (Ardelean et al., unpublished but reported results). In the next figure there are presented the functions of OPhM in waste water purification (Figure 1).
Figure 1. Schematic picture concerning the function of
OphM in the consumption/use of organic substances (via heterotrophic or mixotrophic metabolism) as well as inorganic pollutants (N, P, K) from waste waters, and carbon dioxide from atmosphere for synthesis of new
cells. This functioning results in simultaneous epuration of waste water and the generation of new biomass (the contribution of associated microbiota is not presented)
Apart of different types of bioreactors used, reviewed by Gao et al., 2016, there are several outdoor structures of interest in waste water epurations. Algal Turf Scrubbers (ATSs have been successfully used to treat multiple types of pollution, including agriculture runoff, excess nutrient accumulation in lakes, and manure effluents (Siville and Boeing, 2020).

157
The concept of algal turf scrubbers (ATSs) were rst introduced simultaneously by Adey (1982) as well as Sladeckova et al. (1983) (cited by Siville and Boeing, 2020). Sladeckova et al. (1983) were studying the role of periphyton in waterworks pre-treatment for nutrient removal whereas Adey and Steneck (1985) descovered that the primary productivity on coral reefs was 5-10 times higher than that of most terrestrial forests. Their explanation of the increased productivity values was based on the filamentous turf algae growing on the surfaces of the reef and on the oscillating water motion caused by winds (Adey and Steneck, 1985). Modern ATS provide a sloped surface for water to ow across, which promotes growth of benthic, lamentous macroalgae, periphytic microalgae, and bacteria, having the specificity of easy physical harvest, thus reduces the overall cost involved in biomass production. Siville and Boeing, 2020 published a study on an optimized harvest rates that can aid in increasing biomass production in management practices. Their hypothesized that selecting an optimized rate of harvest at anoptimum temperature would have positive efects on management goals, namely in nutrient reduction and algal biomass production. They concluded that ATS can play an important role in the remediation of high nitrate waste waters and in the production of commercially viable algal biomass. Harvest rates between 7 and 14 days were able to optimize ATS and maximize biomass production, nutrient absorption wbeing not impacted by harvest rate. Microbial mats, either naturally occuring or artificially constructed, had been also used for different type of bioremediation, including for aquaculture wastewater treatment (Bender et al., 2004; Coban et al., 2018). Microbial mats are stratified microbial communities, composed of a complex of bacteria and dominated by photoautotrophic cyanobacteria, which can transform nitrogenous wastes into cellular protein and rapidly metabolize other fish wastes. Recent reviews on the subject of this paper are available (Wollmann et al., 2019; Dourou et al., 2020; Msanne et al., 2020; Pacheco et al., 2020; Solovchenko et al., 2020). The newly synthesised biomass can be further used as feed in multitrophic systems or for
conversion to methane (Angelidaki et al., 2009; Olsson et al., 2018) or other valuable compounds, could be an efficient and cheap solution for the treatment of AQWW, with a realistic chance of an economic viability in real conditions (Angelidaki et al., 2009; Olsson et al., 2018). 2. GAMMA IRRADIATION AT NON GROWTH INHIBITORY DOSES IN ORDER TO INCREASE LIPID CONTENT OF THE CELLS In recent years, there has been an increasing interest in using relatively low doses of gamma radiation to stimulate biological processes in microalgae (Rivasseau et al., 2010; Tale et al., 2017; Ermavitalini et al., 2017a and b; Moisescu et al., 2019; Almarashi et al., 2020) as well as in other types of microorganisms (Ardelean et al., 2020a and b, and references herein). Tale et al. (2017) used gamma irradiation as a stressor to induce lipid hyper-accumulation (up to 40% of biomass) in two strains of Chlorella sorokiniana (i.e. C. sorokiniana KMN2 and C. sorokiniana KMN3) whereas Jeong et al. (2017) have shown that chronic LDR-type irradiation leads to increased cell densities, specific growth rates, and biomass of the four species. Ermavitalini et al. (2017a), showed that Botryococcus sp. irradiated at low doses (2, 4, 6, 8 and 10 Gy), the highest biomass (0.833 g) and lipid content (41% total biomass) were found in the 10 Gy irradiated microalgae. Later, Ermavitalini et al. (2017b) analysed the fatty acid profile of Botryococcus sp. control cells and found only 6 types of fatty acids while in 10Gy irradiated microalgae cells found 12 types of fatty acids, with an increased proportion of long chain fatty acids and a low proportion of short chain fatty acids. Moisescu et al. (2019) demonstrated that the generation time of Chlorella sorokiniana UTEX 2130 decreases to 56% at 10 Gy, 60% at 50 Gy, and 77% at 100 Gy irradiation and the relative lipid content increases by 20% and 50% after 10Gy and 100Gy irradiation, respectively. Apart from gamma irradiation there are other stressor effective in enhancing lipid synthesis in microalgae such as nitrogen starvation, phosphate limitation, magnesium

158
supplementation, carbon source, iron content in the culture medium, high salinity, high light intensities, low oxygen pressure, and dehydration recent review Abo-State et al. (2019), phytohormones (Guldhe et al., 2019), a pre-treatment of inoculum with low doses of cold atmospheric-pressure plasma (Almarashi et al., 2020) and exogenous additions of reactive oxygen species Sivaramakrishnan & Incharoensakdi (2017). Almarashi et al. (2020) in a very interesting paper showed that the biodiesel recovery from the green microalga C. vulgaris can be enhanced through a pre-treatment of inoculum with low doses of cold atmospheric-pressure plasma (CAPP). A treatment of 30s resulted in the highest biomass productivity of 0.193 g L−1
d−1. Moreover, short exposure times (30 and 60 s) significantly increased the lipid content by 7.5% and 6.9%, respectively, over the control. Because 30 s pre-treatment enhanced both growth and lipid content, the volumetric lipid productivity (i.e., 40.7 mg L−1 d−1) increased by 16.6% and 17.6% over the control and 60 s, respectively. Furthermore, the maximum volumetric fatty acid methyl esters (FAMEs) production (i.e., 998.1 mg L−1) was recorded in the culture inoculated with 60 s exposed cells, which was 43.5% and 15.7% higher than that of the control and 30 s, respectively. Furthermore, Sivaramakrishnan & Incharoensakdi (2017) showed that a UV pre-treatment followed by the application of H2O2 can increase the total lipid production in Scenedesmus sp. They reported that at 2 mM H2O2, the mutant had an increase in the lipid content of 55 to 60% of dry cell weight compared to the wild type grown under the same conditions. Importantly, these results also suggest that oxidative stress mediates lipid accumulation. 3. THE USE OF LIVING PHOTOSYNTHETIC BIOMASS AS BIOCRUSTS TO INCREASE THE CHEMICAL PARAMETERS OF SOIL AND PHYSIOLOGICAL CHARACTERISTICS OF PLANTS Many studies have shown the possibility of photosynthetic microorganisms, including eukaryotic microalgae, anoxygenic phototrophs and cyanobacteria, to stimulate soil fertility and
increase crop yields (Li et al., 2017) forming so-called biological soil crusts or biocrusts (Weber et al., 2016). Biostimulators are materials other than fertilizers, which, when applied in small amounts, promote the growth and quality of food crops/vegetables/fruits, stimulate the absorption of mineral nutrients and extend the tolerance of plants to abiotic stress. Moreover, they do not generate chemical residues and fully respect human health and the environment, which then makes them a sustainable alternative to synthetic plant protection products (Du Jardin, 2015). They can increase seed germination, improve plant growth, crop yield, flower set and fruit production, as well as shelf life after harvest (Calvo et al., 2014). Microalgae and cyanobacteria, such as phototrophs, can not only help replace chemical fertilizers with benefits for plant growth and crop yield, but can also contribute to CO2 sequestration, as they add organic matter to the soil, thus improving soil structure (Maqubela et al., 2009). In addition, microalgal biomass is a rich source of metabolites in agriculture (Nirmal et al., 2018), it also produces extracellular polymeric substances (EPS). Freshwater microalgae, e.g. Chlorella vulgaris, have been shown to provide large amounts of macro- and micronutrients, carbohydrates and proteins (Elarroussia et al., 2016), as well as growth-promoting factors (e.g. cytokines (Stirk et al., 2002; Ördög et al., 2004). In soil biocrust, cyanobacteria are found in close association with other organisms, such as bacteria, algae, lichens, and moss. As part of these communities, cyanobacteria play a key role in soil properties and functions. Filamentous cyanobacteria bind soil aggregates and create a stable surface layer that facilitates colonization by other organisms that form biocrusts such as lichens and mosses (Deng et al., 2020). Cyanobacteria fix CO2 (Miralles et al., 2018) and some species are able to fix N2, increasing the content of organic nitrogen and soil nutrients (Mager & Thomas, 2011). It also releases a wide range of substances into the soil, such as growth-promoting regulators, vitamins, amino acids, polypeptides, proteins and sugars that contribute to soil fertility and

159
act as biocontrolling agents against plant pathogens, fungi and micro-algae (Singh et al., 2016). Cyanobacteria have received special attention as bioinoculants for the ecological restoration of degraded lands (Rossi et al., 2017). Inoculation of the soil with cyanobacteria has been shown to lead to soil improvements in desertified natural soils (Park et al., 2017). Exopolysaccharides (EPS) are among the most important compounds synthesized by cyanobacteria that play a vital role in soil functions. The more soluble or poorly bound EPS fractions in the soil are considered to be an important source of energy for heterotrophic activity, while several condensed or closely related EPS fractions of soil are mainly involved in soil particle consolidation, contributing to soil stability (Chen et al., 2014; Chamizo et al., 2019).
4. SYNTHESIS OF METAL NANOPARTICLES BY OXYGENIC PHOTOSYNTHETIC MICROORGANISMS Nanoparticles are materials with different shapes (spherical, triangular, rods etc) and dimensions between 1 nm and 100 nm. A recent major review on NP synthesis by oxygenic photosynthetic (micro) organisms (cyanobacteria, green algae, brown or red algae) clearly illustrates the state of the art in this field (Chaudhary et al., 2020). The study of the synthesis of MNPs mediated by living matter is a relatively new scientific topic, focused on the use of bacteria, cyanobacteria and actinomycetes, fungi, lichens, algae and plants extracts in this process (Rai & Duran, 2011). Very interesting, these syntheses usually occur under normal conditions of temperature and pressure, with no toxic chemicals involved in the process, thus the protocol is friendly to the environment. The first experiments on MNPs synthesis by cyanobacteria were done on Plectonema boryanum (Lengke et al., 2006) the reported results showing two important things about cyanobacterium Plectonema boryanum UTEX 485: i) interaction of cyanobacteria with the chemical environment is an important factor controlling the morphology of Au particles and ii) the reduction of Au(111) is actually two-
step, involving an intermediate Au(I)-S phase, with the sulphur being of organic origin (Lengke et al., 2006). Another important group in this field demonstrated that three filamentous cyanobacteria strains Anabaena, Calothrix and Leptolyngbya have the capability to reduce Au, Ag, Pd and Pt ions to elemental metal organized as nanoparticles (Brayner et al., 2007). Very important, the authors put forward the hypothesis that nitrogenase is involved in nanoparticle production (Brayner et al., 2007). Focsan and co-workers (2011) aimed to elucidate the interplay between biomineralization and metabolic activities in the case of the cyanobacterium Synechocystis sp. PCC 6803 exposed to gold ions. The authors demonstrated the ability of the cyanobacteria to reduce gold ions, the yield of GNPs synthesis being strongly dependent on the intensity of aerobic respiration and oxygenic photosynthesis. This is the first paper on cyanobacteria where surface-enhanced Raman scattering, SERS, uses biogenic MNP as reporter structures to analysis their own cellular localization, and where the evolution of respiratory oxygen consumption and photosynthetic oxygen production are quantified during (gold) nanoparticle synthesis, thus arguing the involvement of these catabolic and anabolic processes in MNP synthesis by cyanobacteria, under physiological conditions. The ability of Anabaena flos-aquae to form (Dahoumane et al., 2012) represent further steps in elucidating this process in different strains, showing that before the addition of gold causes the inhibition of photosynthesis as measured by monitoring chlorophyll a fluorescence in vivo. Based on their original results, the authors (Dahoumane et al., 2012), in connection with other papers, conclude that the Au(III) species are first in contact with exopolissacharides network, where the reduction take place. MNPs have great potential for applications in different domains such as the electronic, chemical, mechanical and life sciences industries. For example in biology and medicine the main applications are with respect to: fluorescent biological labels; drug and gene delivery; biodetection of pathogens, detection of proteins, probing of DNA structure, tissue

160
engineering, tumor destruction via heating (hyperthermia), separation and purification of biological molecules and cells (Li et al., 2011) whereas in environmental protection MNPs with improved catalytic activity have become important for in situ destroying of organic pollutants (Hennebel et al., 2009). 5. BIOELECTROCHEMICAL PROPERTIES OF OPhM FOR BIOTECHNOLOGICAL APPLICATIONS Historically, the first studies on bioelectrochemical properties of OPhM were done on biofuel cells (BFC). In the next figure (Figure 2), there is figurated the general structure of a BFC with, the anode compartment containing the OPhM which donate electrons to the anode either via an added electron carrier (hydrophylic artificial redox mediators (HARM) or lipophilic artificial redox mediators (LARM) either without the use of any added redox carrier (directly). The cathode chamber contains an electron acceptor (e.g. molecular oxygen which is reduced to water or ferrycianide which is reduced to ferrocyanide) which is reduced with electrons coming via the external circuit from the anode- the electroneutrality is maintained by protons passing through the semipermeable membrane from anode to cathode chamber (Bennetto, 1990; Greenman et al., 2019).
Figure 2. Schematic diagram of the structure of a dual
chamber biofuel cell with photosynthetic oxygenic microorganisms (see the text for more explanation). A -
the electrode (anode) in the anode chamber C - the electrode (cathode) in the cathode chamber. The protons pass through a semipermeable membrane from the anode
compartment to the cathode compartment
There are plenty of reports concerning the use of OphM as biocatalyst in the anodic compartment to donate electrons to the anode, electron which come mainly from photosynthetic electron transport or from respiratory electron transport. Usually there are used added redox mediators but there are reports on direct electron transfer from cells to the anode (Apollon et al., 2021; Elshobary et al., 2021). In cyanobacteria the situation is as follows. Hydrophilic artificial redox mediators/ carriers (HARM) can take electrons exclusively from cell membrane surface, being not able to penetrate hydrophobic membranes (in the absence of pores). In cyanobacteria, at the cell membrane occurs respiratory electron transport from which HARM can take electrons. However, due to the occurrence of common electron carriers functioning both in PhET and in RET and prokaryotic structure of cyanobacteria at the cell membrane can arrive also electrons originated in the PhET (Bennetto, 1990; Pisciotta et al., 2011). Lipophilic artificial redox mediators (LARM) being able to penetrate hydrophobic membranes can take electrons from inside the cell, mainly from thylakoids where both PhET and RET occurs as well as from the cytoplasm (where intermediary metabolic reaction occurs) and from cell membrane (Bennetto, 1990; Gadhamshetty et al., 2013; Greenman et al., 2019). In microalgae the situation is as follows RET and PET occurs separately inside the eukaryotic cell, mithocondria and chloroplasts, respectively thus HARM cannot take electrons from these sites, whereas (LARM) cand take electrons from these processes as well as from intermediary metabolism occurring in the cytoplasm. It should be remembered that in both prokaryotes and eukaryotes these mediators may influence intracellular processes, dramatically shortening the lifetime of cell metabolism. This inhibitory effect drastically limited practical application for the conversion of solar energy to electricity (the initial goal of these studies) as well as other applications. The biotechnological potential of BFC concerns the conversion of solar energy into electricity, the development of biosensors

161
mainly for inhibitors of photosynthetic electron transport (as is the case with some herbicides) and, more recently, for waste water epuration. This rather new direction concerns the utilisation of OPhM together with non-photosynthetic microorganisms. Luo et al. (2020) have published a series of papers based on an integrated photo-bioelectrochemical system (IPB) that successfully combines a BFC and an algal bioreactor for bioremediation of wastewater. They reported associations of ammonia oxidizing bacterium (AOB), Nitrosomonas europaea and a nitrite oxidizing bacterium (NOB), Nitrobacter winogradski with and green alga C. vulgaris. This study, apart of developing the use of OPhM in IBS for wastewater treatment, is the first study to specifically test the effects of adding nitrifying bacteria (AOB/NOB) in the C. vulgaris culture, and their functions even under variable ammonium (NH4) loading (Luo et al., 2020). CONCLUSIONS The conclusion of Grewe and Pulz (2012) that cyanobacterial (and algal) biotechnology must be considered to be still in its infancy is valid even today (Mutanda et al., 2020) an opinion we agree with. Since 2012 much work has been done and many excellent reviews have been published from which only few are summarized in the followings. Ruiz et al. (2016) conducted a market analysis taking into account the following biomass value pyramid (biofuels, chemicals, food, feed, specialties in food, cosmetics). Basically, their projections show a current cost per unit of dry biomass of 3.4 Euro/kg for microalgae, arguing that production of high-value products from microalgae could be profitable nowadays and commodities will become profitable within 10 years (Ruiz et al., 2016). However, the high costs associated with microalga bioprocessing for biofuel production are major constraints for the success of the algal biotechnology industry (Ruiz et al., 2016), Mutanda et al. (2020) explores the current status of the biorefinery approach, including genetic manipulation of microalgae for enhancement of product yield, focusing with lucidity on pros and cons (Mutanda et al., 2020). Urtubia et al (2016) stress on the fact that biotechnological
application of cyanobacteria and microalgae will significantly benefit through increasing collection of genomes sequenced, together with the identification and characterization of new molecular elements within the cell (e.g., promoters, codon usage, terminators, plasmids, selection markers, and reporter genes, clearly arguing the importance of genetic modifications for biotechnologies. In agreement with Khan et al (2018), besides the potential of microalgae for a plethora of products and services there are still constraints which must be overcome to upgrade the technology from pilot-phase to industrial level, the most important being the growth rate and product synthesis, as well as dewatering of algae culture for biomass production, (more details Khan et al., 2018). Sharma and Sharma (2017) clearly stress on the fact that the need of water for microalgae cultivation is a major constraint for the development of biotechnologies at large level and in their review indicate some biotechnological companies and their already commercialized products (Sharma and Sharma 2017). AKNOWLEDGEMENTS The work was done within Project RO1567-IBB05/2020 and PN-III-P1-1.2PCCDI2017-0323 Project “Utilization of Gamma irradiation in biotechnological processes with applications in bioeconomy” (BIO-GAMMA). REFERENCES Abo-State, M.A.M., Sanaa, M.M.S., & Ali H.E.A.
(2019). Effect of nutrients and gamma radiation on growth and lipid accumulation of Chlorella vulgaris for biodiesel production. Journal of Radiation Research and Applied Sciences. Taylor & Francis Press. New York. 12(1), 332‒342.
Adey, W.H., Steneck, R.S. (1985). Highly productive Eastern Caribbean reefs: synergistic effects of biological, chemical, physical, and geological factors. NOAA’s Undersea Res. Program, Symp. Ser. Undersea Res., 163–187.
Almarashi, J.Q.M., El-Zohary, S.E., Ellabban, A.M., & Abomohra, A.E.-F. (2020). Enhancement of lipid production and energy recovery from the green microalga Chlorella vulgaris by inoculum pretreatment with low-dose cold atmospheric pressure plasma (CAPP). Energy Conversion and Management. Elsevier. Paris. 204. https://doi.org/10.1016/j.enconman.2019.112314.

162
Angelidaki, I., Alves, M., Bolzonella, D., Borzacconi, L., Campos, J.L., Guwy, A.J., Kalyuzhnyi, S., Jenicek, P., & van Lier, J.B. (2009). Defining the biomethane potential (BMP) of solid organic wastes and energy crops: A proposed protocol for batch assays. Water Sci. Technol., 59, 927–34.
Ansari, F.A., Gupta, S.K. & Bux, F. (2019). Microalgae: A Biorefinary approach to the treatment of aquaculture wastewater. In Application of Microalgae in Wastewater Treatment. Springer International Publishing, 69–83.
Ansari, F.A., Singh, P., Guldhe, A., & Bux, F. (2017). Microalgal cultivation using aquaculture wastewater: Integrated biomass generation and nutrient remediation. Algal Res., 21, 169–77.
Apollon, W., Luna-Maldonado, A.I., Kamaraj, S.-K., Vidales-Contreras, J.A., Rodríguez-Fuentes, H., Gómez-Leyva, J.F., & Aranda-Ruíz, J. (2021). Progress and recent trends in photosynthetic assisted microbial fuel cells: A review. Biomass and Bioenergy, 148, 106028.
Ardelean, A.-V., Moisescu, C., & Ardelean, I. (2020a). The interaction between microalgae and gamma irradiation at low, non- growth inhibitory doses. Oltenia. Studii si comunicari. Stiintele Naturii, 36(2), 146‒152.
Ardelean, A.V., Moisescu, C., & Ardelean, I.I. (2019). The potential of photosynthetic biomass resulted from synthetic wastewater treatment as renewable source of valuable compounds. Current Trends in Natural Sciences, 8(15), 42–47.
Ardelean, I., Teodosiu, G., Ştefănescu, M., Moisescu, C., Ardelean, A.V., Constantin, M., & Cîrstea, D.M. (2020b). The stimulating effects of non-lethal γradiation doses on prokaryotes. Romanian Biotechnological Letters, 25(6), 2027‒2032.
Bender, J., & Phillips, P. (2004) Microbial mats for multiple applications in aquaculture and bioremediation. Bioresour Technol, 94, 229–238.
Bennetto, H.P. (1990). Electricity generation by microorganisms. Biotechnol Educ., 1, 163‒168.
Brayner, R., Barberousse, H., Hernadi, M., Djedjat, C., Yepremian, C., Coradin, T., Livage, J., Fievet, F. & Coute, A. (2007). Cyanobacteria as Bioreactors for the synthesis of Au, Ag, Pd, and Pt nanoparticles via an enzyme-mediated route. J Nanosci Nanotechno 7, 2696‒2708.
Calvo, P., Nelson, L., & Kloepper, J.W. (2014). Agricultural uses of plant biostimulants. Plant Soil 383, 3–41.
Chamizo, S., Adessi, A., Mugnai, G., Simiani, A. & De Philippis, R. (2019). Soil type and cyanobacteria species influence the macromolecular and chemical characteristics of the polysaccharidic matrix in induced biocrusts. Microb. Ecol.78, 482–493. doi: 10.1007/s00248-018-1305-y.
Chaudhary, R., Nawaz, K., Khan, A.K.., Hano, C., Abbasi, B.H., & Anjum, S. (2020). An overview of the algae-mediated biosynthesis of nanoparticles and their biomedical applications. Biomolecules 10(11), 1498. https:// doi.org /10.3390/biom10111498
Chen, L., Rossi, F., Deng, S., Liu, Y., Wang, G., Adessi, A. & De Philippis, R. (2014). Macromolecular and
chemical features of the excreted extracellular polysaccharides in induced biological soil crusts of different ages. Soil Biol. Biochem. 78, 1–9. doi: 10.1016/j.soilbio.2014.07.004.
Coban, O., Williams, M.K. & Bebout, B.M. (2018). Mechanisms of nitrogen attenuation from seawater by two microbial mats. Water Res. 147, 373–81.
Dahoumane, S.A., Djediat, C., Yepremian, C., Coute, A., Fievet, F., Coradin, T. & Brayner, R. (2012). Species selection for the design of gold nanobioreactor by photosynthetic organisms. J Nanopart Res 14, 883.
Deng, S., Zhang, D., Wang, G., Zhou, X., Ye, C., Fu, T., & Chen L. (2020). Biological soil crust succession in deserts through a 59-year-long case study in China: how induced biological soil crust strategy accelerates desertification reversal from decades to years. Soil Biol. Biochem. 141, 107665. doi: 10.1016/j.soilbio.2019.107665.
Dourou, M., Dritsas, P., Baeshen, M.N. & Elazzazy, A. (2020). High-added value products from microalgae and prospects of aquaculture wastewaters as microalgae growth media. FEMS Microbiol. Lett. 367(12).
Du Jardin, P. (2015). Plant biostimulants: Definition, concept, main categories and regulation. Sci. Hortic. (Amsterdam) 196, 3–14.
Elarroussia, H., Elmernissia, N., Benhimaa, R., Isam, M.E.K., Najib, B., Abedelaziz, S., & Imane, W. (2016). Microalgae polysaccharides a promising plant growth biostimulant. J Algal Biomass Utln 7:55–63.
Elshobary, M.E., Hossain, M.Z., Junhua, Y., Guoyan, Z., & Xianghui, Q. (2021). Recent insights into microalgae-assisted microbial fuel cells for generating sustainable bioelectricity. International Journal of Hydrogen Energy 46(4), 3135‒3159.
Ermavitalini, D., Ikapuspita, S., Prasetyo, E.N., Nurlita, A., & Saputro, T.B. (2017a). Effect of gamma 60co irradiation on the lipid contentand fatty acid composition of Nannochloropsis sp. microalgae. AIP Conference Proceedings. American Institute of Physics Publisher. New York. 1854(1), 020009-1–020009-8.
Ermavitalini, D., Yuliansari, N., Prasetyo, E.N., & Saputro, T.B. (2017b). Effect of Gamma 60Co Irradiation on the growth, lipid content and fatty acid composition of Botryococcus sp. microalgae. Biosaintifika: Journal of Biology & Biology Education. Royal Society of Biology Publisher. London. 9(1), 58‒65.
Focsan, M., Ardelean, I.I., Craciun, C. & Astilean, S. (2011). Interplay between gold nanoparticle biosynthesis and metabolic activity of cyanobacterium Synechocystis sp. PCC 6803. Nanotechnology 22(48), 1‒8.
Gadhamshetty, V., Belanger, D., Gardiner, C.J., Cummings, A., & Hynes, A. (2013). Evaluation of Laminaria-based microbial fuel cells (LbMs) for electricity production. Bioresource Technology 127, 378‒385.
Gao, F., Li, C., Yang, Z.H., Zeng, G.-M., Feng, L.-J., Liu, J.-Z., Liu, M., & Cai, H.-W. (2016). Continuous microalgae cultivation in aquaculture wastewater by

163
a membrane photobioreactor for biomass production and nutrients removal. Ecol. Eng. 92, 55–61.
Greenman, J., Gajda, I., & Ieropoulos, I. (2019). Microbial fuel cells (MFC) and microalgae; Photo microbial fuel cell (PMFC) as complete recycling machines. Sustainable Energy and Fuels 3(10), 2546‒2560. https://doi.org/10.1039/c9se00354a.
Grewe C.B., & Pulz, O. (2012). The Biotechnology of Cyanobacteria. Ecology of Cyanobacteria II: Their Diversity in Space and Tim, in B.A. Whitton (ed.), 707‒739.
Guldhe, A., Ansari, F.A., Singh, P., & Bux. F. (2017). Heterotrophic cultivation of microalgae using aquaculture wastewater: A biorefinery concept for biomass production and nutrient remediation. Ecol. Eng. 99, 47–53.
Guldhe, A., Renukan, N., Singh, P., & Bux. F. (2019). Effect of phytohormones from different classes on gene expression of Chlorella sorokiniana under nitrogen limitation for enhanced biomass and lipid production. Algal Research. Elsevier. Paris. 40, 101‒118.
Hennebel, T., Gusseme, B.D., Boon, N. & Verstraete, W. (2009). Biogenic metals in advanced water treatment. Trends. Biotechnol. 27, 90–98.
Jeong, D.H., Jeong, M.H., Jeong, S.K., Yang, K.M., & Jo, W.S. (2017). Effect of continuous exposure to low-doserate gamma irradiation on cell growth and lipid accumulation of marine microalgae. Aquaculture International. Springer. Berlin. 25, 589‒601.
Katam, K., & Bhattacharyya, D. (2020). Effect of solids retention time on the performance of alga-activated sludge association in municipal wastewater treatment and biofuel production. J. Appl. Phycol. 32, 1803–12.
Kehrein, P., Van Loosdrecht, M., Osseweijer, P., Garfi, M., Dewulf, J., & Posada, J. (2020). A critical review of resource recovery from municipal wastewater treatment plants-market supply potentials, technologies and bottlenecks. Environ. Sci. Water Res. Technol. 6, 877–910.
Khan, M.I., Shin, J.H., & Kim, J.D. (2018). The promising future of microalgae: current status, challenges, and optimization of a sustainable and renewable industry for biofuels, feed, and other products. Microb Cell Fact 17:36.
Kuo, C.M., Jian, J.F., Lin, T.H. et al. (2016). Simultaneous microalgal biomass production and CO2 fixation by cultivating Chlorella sp. GD with aquaculture wastewater and boiler flue gas. Bioresour. Technol. 221, 241–50.
Lengke, M.F., Fleet, M.E. & Southam, G. (2006a). Morphology of gold nanoparticles synthesized by filamentous cyanobacteria from gold(I)-thiosulfateandgold(III)-chloride complexes. Langmuir 22, 2780‒2787.
Li, R., Tao, R., Ling, N., & Chu, G. (2017). Chemical, organic and bio-fertilizer management practices effect on soil physicochemical property andantagonistic bacteria abundance of a cotton field: implications for soil biological quality. Soil Tillage Res 167:30–38.
Liu, Y., Lv, J., Feng, J. et al. (2018). Treatment of real aquaculture wastewater from a fishery utilizing phytoremediation with microalgae. J. Chem. Technol. Biotechnol. 94, 900–10.
Ludwig, H.F., Oswald, W.J., Gotaas, H.B. et al. (1951). Algae symbiosis in oxidation ponds: I. Growth characteristics of “Euglena Gracilis” cultured in sewage. Sewage Ind. Waste. 23, 1337–55.
Luo, S., Waller, L., Badgley, B., Hea, Z., & Young, E.B. (2020). Effects of bacterial inoculation and nitrogen loading on bacterial-algal consortium composition and functions in an integrated photobioelectrochemical system. Sci. of the Total Environ. 716, 137135.
Mager, D.M., & Thomas, A.D. (2011). Extracellular polysaccharides from cyanobacterial soil crusts: a review of their role in dryland soil processes. J. Arid Environ. 75, 91–97. doi: 10.1016/j.jaridenv.2010.10.001.
Mambo, P.M., Westensee, D.K., Zuma, B.M. et al. (2014). The Belmont Valley integrated algae pond system in retrospect. Water SA, 40, 385–93.
Maqubela, M. P., Mnkeni, P. N. S., Issa, O. M., Pardo, M. T., & D’Acqui, L. P. (2009). Nostoc cyanobacterial inoculation in South African agricultural soils enhances soil structure, fertility, and maize growth. Plant Soil 315, 79–92. doi: 10.1007/s11104-008-9734-x.
Miralles, I., Ladrón de Guevara, M., Chamizo, S., Rodríguez-Caballero, E., Ortega, R., van Wesemael, B., & Canton Y. (2018). Soil CO2 exchange controlled by the interaction of biocrust successional stage and environmental variables in two semiarid ecosystems. Soil Biol. Biochem. 124, 11–23. doi: 10.1016/j.soilbio.2018. 05.020.
Moisescu, C., Ardelean, A.V., Negut, D., & Ardelean, I.I. (2019). Effect of acute gamma irradiation on generation time, lipid, chlorophyll a and carotenes, in Chlorella sorokiniana UTEX 2130 and Synechocystis PCC 6803. Scientific Bulletin. Series F. Biotechnologies. Faculty of Biotechnology from Bucharest. 23, 122‒127.
Msanne, J., Polle, J., & Starkenburg, S. (2020). An assessment of heterotrophy and mixotrophy in Scenedesmus and its utilization in wastewater treatment. Algal Res. 48, 101911.
Mutanda, T., Naidoo, D., Bwapwa, J.K., & Anandraj, A. (2020). Biotechnological Applications of Microalgal Oleaginous Compounds: Current Trends on Microalgal Bioprocessing of Products. Front. Energy Res. 8:598803. doi: 10.3389/fenrg.2020.598803.
Nirmal, R., Abhishek, G., Radha, P., Poonam, S., & Faizal, B. (2018). Microalgae as multi-functional options in modern agriculture: current trends, prospects and challenges. Biotechnol Adv 36: 1255–1273.
Nogueira, S.M.S., Junior, J.S., Maia, H.D. et al. (2018). Use of Spirulina platensis in treatment of fish farming wastewater. Rev. Cienc. Agron. 49, 599–606.
Olsson, J., Forkman, T., Gentili, F.G. et al. (2018). Anaerobic co-digestion of sludge and microalgae grown in municipal wastewater - A feasibility study. Water Sci. Technol. 77, 682–94.
164
Ördög, V., Stirk, W.A., Van, S.J, Novák, O., & Strand, M. (2004). Endogenous cytokinins in three genera of microalgae from Chlorophyta. J Phycol 40: 88–95.
Oswald, W.J. (2003). My sixty years in applied algology. J. Appl. Phycol. 15, 99–106.
Pacheco, D., Rocha, A.C., Pereira, L. et al. (2020). Microalgae water bioremediation: Trends and hot topics. Appl. Sci. 10, 1886
Park, C.H., Li, X.R., Jia, R.L., & Hur, J.S. (2017). Combined application of cyanobacteria with soil fixing chemicals for rapid induction of biological soil crust formation. Arid Land Res.Manag. 31, 81–93. doi: 10.1080/15324982.2016. 1198842.
Pisciotta, J.M., Zou, Y.J., & Baskakov, I.V. (2011). Role of the photosynthetic electron transfer chain in electrogenic activity of cyanobacteria. Applied Microbiology and Biotechnology 91(2), 377‒385.
Rai, M., & Duran, N. (eds.) (2011). Metal Nanoparticles in Microbiology, 1st edn, Springer, New York, 37‒74.
Rivasseau, C., Farhi, E., Gromova, M., Jacques, J., & Bligny, R. (2010). Resistance to irradiation of micro-algae growing in the storage pools of a nuclear reactor investigated by NMR and neutron spectroscopies. Spectroscopy. University of Arizona Press. 24(3-4), 381‒385.
Rossi, F., Li, H., Liu, Y. & De Philippis, R. (2017). Cyanobacterial inoculation (cyanobacterisation): perspectives for the development of a standardized multifunctional technology for soil fertilization and desertification reversal. Earth-Sci Rev. 171, 28–43. doi: 10.1016/j.earscirev.2017.05.006.
Ruiz, J., Olivieri, G., de Vree, J., Bosma, R., Willems, P., Reith, J.H., Eppink, M.H.M., Kleinegris, D.M.M., Wijffels, R.H., & Barbosab, M.J. (2016). Towards industrial products from microalgae. Energy Environ. Sci., 9, 3036.
Sharma, N., & Sharma, P. (2017). Industrial and Biotechnological Applications of Algae: A Review. Journal of Advances in Plant Biology, 1(1), 01-25.
Singh, J. S., Kumar, A., Rai, A. N., & Singh, D. P. (2016). Cyanobacteria: a precious bio-resource in
agriculture, ecosystem, and environmental sustainability. Front. Microbiol 7:529. doi: 10.3389/fmicb.2016. 00529.
Sivaramakrishnan, R., & Incharoensakdi, A. (2017). Enhancement of lipid production in Scenedesmus sp. by UV mutagenesis and hydrogen peroxide treatment. Bioresource Technology. Elsevier. Paris. 235, 366‒370.
Siville, B., & Boeing, W.J. (2020). Optimization of algal turf scrubber (ATS) technology through targeted harvest rate. Bioresour. Technol. Reports. 9, 100360.
Solovchenko, A., Lukyanov, A., Gokare Aswathanarayana, R. et al. (2020). Recent developments in microalgal conversion of organic-enriched waste streams. Curr. Opin. Green Sustain. Chem. In press:DOI: 10.1016/j.cogsc.2020.03.006.
Stirk, W.A, Ördög, V, Staden, J.V., & Jäger, K. (2002). Cytokinin-and auxinlike activity in Cyanophyta and microalgae. J Appl Phycol 14: 215–221.
Tale, P.M., Singh, R., Kapadnis, P.B., & Ghosh, B.S. (2017). Effect of gamma irradiation on lipid accumulation and expression of regulatory genes involved in lipid biosynthesis in Chlorella sp. Journal of applied phycology. Springer. Berlin. 30(1), 277‒286.
Urtubia, H.O., Betanzo, L.B., & Vásquez, M. (2016). Microalgae and Cyanobacteria as Green Molecular Factories: Tools and Perspectives. Algae - Organisms for Imminent Biotechnology http://dx.doi.org/10.5772/100261.
Weber, B., Büdel, B., & Belnap, J. (eds). (2016). Biological Soil Crusts: An Organizing Principle in Drylands, Vol. 226. Berlin: Springer.
Wollmann, F., Dietze, S., Ackermann, J.U. et al. (2019). Microalgae wastewater treatment: Biological and technological approaches. Eng. Life Sci. 19, 860–71.
Wuang, S.C., Khin, M.C., Chua, P.Q.D et al. (2016). Use of Spirulina biomass produced from treatment of aquaculture wastewater as agricultural fertilizers. Algal Res. 15, 59.

165
MISCELLANEOUS

166
167
Scientific Bulletin. Series F. Biotechnologies, Vol. XXV, No. 1, 2021ISSN 2285-1364, CD-ROM ISSN 2285-5521, ISSN Online 2285-1372, ISSN-L 2285-1364
ANTHOCYANINS IN PURPLE MAIZE
Andrei Constantin Ioan ARLET1,2, Aglaia POPA (BURLACU)2, Alexandru GROSU2, Florentina ISRAEL-ROMING2
1Ministry of National Education, 28-30 Gen. Berthelot Street, Bucharest, Romania
2University of Agronomic Sciences and Veterinary Medicine of Bucharest, 59 Mărăşti Blvd, District 1, Bucharest, Romania
Corresponding author email: [email protected]
Abstract Natural dyes potential increases continuously as the production of synthetic dyes requires strong acidic and alkaline obtaining conditions. Natural dyes are less toxic, easily available and biodegradable and have a low negative impact on the environment. The main dyes extracted from purple maize are anthocyanins, but in some cultivars were also found low concentration of carotenoids. The extraction of natural dyes can be performed either through traditional methods (aqueous, acid, alkaline, solvent, Soxhlet), either through modern methods (enzymatic, microbial, microwave or ultrasound assisted, supercritical fluids). This paper is also focused on comparing the most used methods for identification and quantification of anthocyanins in purple maize, methods that can be spectrophotometric or chromatographic. The multiple benefits of anthocyanins (antioxidant, anticarcinogenic, anti-inflammatory, antimicrobial, neuroprotective etc.) support their use in various applications such as: food, textile, pharmaceutic, medical etc. Key words: anthocyanins, chromatography, dyes, maize, spectrophotometry. INTRODUCTION Since ancient times, people have used dyes from various natural sources such as plants, shells, insects or others. But since the synthetization of dyes in laboratories at mid-18th century, these natural dyes were replaced by synthetic ones, as the latter produced stronger colours, were more resistant to washing and were able to imprint the colour much faster. However, due to the carcinogenic action of synthetic dyes, trends are directed more to the use of natural dyes. Natural dyes have become lately more appealing for various biotechnological applications due to their numerous benefits. In this sense, they have a low negative impact on the environment, are less toxic, easily available and they do not determine allergic reactions such as synthetic dyes. Furthermore, natural dyes can have various beneficial properties such as: antibacterial, antifungal, antioxidant and others. These colorants may be obtained from various sources: minerals, plants, animals or even microorganisms. Mineral dyes are obtained through purification of natural compounds such as iron buff, chrome
yellow, Prussian blue or manganese brown (Mansour, 2018). Plants are often used for extraction of natural dyes such as carotenoids, flavonoids, anthraquinones, indigoids etc. Various parts of the plants are abundant in dyes such as: seeds, stem, bark, root, fruits or even flowers (Irimescu et al., 2019). Moreover, some plants can contain more than one type of dye. The animal sources of dyes are generally represented by insects such as Dactylopius coccus (cochineal dye), lac insects (lac dye), Murex snail (Tyrian purple dye), octopus/cuttlefish (Sepia brown dye), shellfish (purple dye) etc. (Wood, 1986; Wisniak, 2004). Microbial dyes can be extracted using microorganisms belonging to the families of: Bacillus, Micrococcus, Monascus, Rhodotorula, Sarcina, Achromobacter or Phaffia (Heer & Sharma, 2017). The main dyes produced by microorganisms are generally carotenoids. There are many criteria used for classification of dyes: the colour they impart, chemical structure or even their methods of application. Based upon the colour, natural dyes can be: yellow, orange, red, blue, green or even black and brown. However, the main classification of

168
natural dyes is based upon the chemical structure: anthraquinones, carotenoids, flavonoids, indigoids or dihydropyrans. MAIZE PIGMENTS Purple maize/corn (Zea mays L.), a plant with the deepest shade of purple is a widely used cultivar in low valleys from South America or China. Nowadays, the cultivation of this maize variety is extended to other regions throughout the world. The natural dyes content of purple maize is mainly based on anthocyanins, although some cultivars had also low contents of carotenoids. Anthocyanins are the main flavonoid dyes found in plants. They are a class of water-soluble compounds with phenolic structures that imprint various colours to fruits and vegetables: orange, red, blue and purple. Anthocyanins are mainly found in the skin, but can also be detected in the flesh of some fruits such as strawberries or cherries (Martín et al., 2017). Regarding the chemical structure of anthocyanins, they are glycosylated polymethoxy or polyhydroxy derivatives of 2-phenylbenzopyrilium, with two benzyl rings (noted with A and B) as seen in Figure 1.
Figure 1. Chemical structure of anthocyanins-3-O-
glucoside (Martín et al., 2017) Usually, anthocyanins contain one glucoside unit, but they can also have more units attached at different positions (Martín et al., 2017). Also, the colour imprinted and its intensity is correlated with the number of methoxyl (red)
and hydroxyl (blue) groups (Martín et al., 2017). The main anthocyanins glycosides are delphinidin, peonidin, pelargonidin, cyanidin, malvidin and petunidin (Mansour, 2018). The anthocyanins from purple maize are represented by: pelargonidin-3-glucoside cyanidin-3-glucoside, peonidin-3-glucoside and their malonated counterparts (Yang et al., 2009). The anthocyanins content in purple maize is usually around 16.4 mg/g fresh matter (Lao & Giusti, 2016), higher than other plants known for their anthocyanins content such as blueberry, red and black currants, cherries, pomegranate, cabbage, grape, eggplant, fig, or chokeberry (Georgieva, 2020; Coarfă and Popa, 2019; Hoxha and Kongoli, 2019; Albu et al., 2019; Raducu et al., 2019). The low cost of cultivating purple maize and the high content of anthocyanins make purple maize an important material for extracting natural dyes (Lao & Giusti, 2016), that could be used in many applications due to their potential health benefits. EXTRACTION OF NATURAL PIGMENTS FROM MAIZE The high interest for natural dyes extraction is due to their many benefits such as: cheap substrates, wide range of shades of the extract obtained, the extract contains besides the dyes also colour fixating compounds and not the least the health benefits they provide (Kasiri & Safapour, 2015). Since one of the disadvantages of natural dyes is their low to moderate content in plant sources, an important step in their valorization is the extraction method used. Therefore, the method chosen for the extraction of natural dyes should be centred on the plant matrix and dye characteristics (Mansour, 2018). The extraction methods can be traditional (conventional) or modern ones, according to Figure 2.

169
Figure 2. Classification of extraction methods Aqueous extraction is considered to be the first extraction method used since ancient times. The first step in this method is the disintegration of the material, in this case maize kernels, into smaller particles or even powder. The next step is to soak the material with water for a prolonged time in order to affect the cell membrane. Later, the mixture is boiled, centrifuged and filtered, a process that usually is repeated for a better extraction yield. The advantages of using this extraction method are considered to be: low cost, simplicity and the fact that the solution obtained is compatible with many applications that usually require aqueous media. However, the disadvantages are considered too important to ignore such as: high requirements of water, long extraction time or high temperature necessary. Moreover, the extraction yield is low due to the extraction of only water-soluble components of dyes. Acid or alkaline extraction leads to higher yield than aqueous extraction. Acid extraction is mainly used for flavone type dyes, while alkaline extraction is best suited for the rest of phenolic type dyes. A major disadvantage of this chemical extraction is that due to harsh process conditions, some dyes components are destroyed, according to their sensibility to pH. Also, due to the fact that most natural dyes are mainly a mixture of different compounds with different chemical structures, by modifying the pH, only a few of those compounds can be extracted.
Generally, the anthocyanins obtained through an acid extraction protocol are not used in food applications, due to their high toxicity as suggested by Lao & Giusti (2018). Solvent extraction seems to be one of the best traditional extraction methods. The solvents used are either organic ones (methanol, ethanol, acetone, chloroform) either a mixture between them, or a mixture of them with water. The best combination is considered to be an alcohol-water media, that can achieve the extraction of both water-insoluble and water-soluble components of dyes (Mansour, 2018). An improved solvent extraction is the one that uses an aqueous solvent with acid/alkali. This method has the advantage of an easier purification procedure performed by solvent distillation. The disadvantages of this process consist in the fact that the dye obtained is not ready to use and the toxicity of the solvents and their impact on the environment (Mansour, 2018). A research study found that through statistical optimization the best extraction of anthocyanins from purple maize is obtained with 95% ethanol acidified with HCl 1.5N at a solid-liquid ratio of 1:25, at 70°C for cca 70 min (Yang et al., 2009). Soxhlet or reflux extraction is considered to be an easy method to perform, doesn’t require filtering after the extraction and has also the benefit of retrieving the solvents used. However, this process is time consuming,
EXTRACTION METHOD
- AQUEOUS
- ACID OR ALKALI
- SOLVENT
- SOXHLET OR REFLUX
- ENZYMATIC
- FERMENTATION
- ULTRASONIC ASSISTED
- MICROWAVE ASSISTED
- SUPER CRITICAL FLUID
CONVENTIONAL MODERN

170
requires high volumes of solvents, has a negative impact on the environment and can also thermodegrade sensitive dyes. The Soxhlet extraction of anthocyanins from purple maize is a technique used industrially due to low cost of the extraction unit. However, the many disadvantages it presents as described before may be a reason to select a modern method to extract anthocyanins (Viganó and Martinez, 2015). Another downside of using this method is that there is a higher risk for degradation of labile compounds (Cristianini and Guillén Sánchez, 2020). Enzymatic extraction implies the use of enzymes to degrade other plant components that can interfere with dye extraction, such as starch, cellulose, xylan or pectin. By using commercial enzymes like amylase, cellulase, xylanase or pectinase to breakdown several binding components, the material left can be subjected to dye extraction in milder conditions (Mansour, 2018; Fernandez-Aulis et al., 2019). This method is mainly promoted for plant materials such as roots or bark. A research study (Fernandez-Aulis et al., 2019) concluded that even though the anthocyanins yields weren’t the highest obtained, the enzymatic extraction with xylanase, cellulase and β-glucanase resulted in higher content of cyanidin-3-(6''malonyl) glucoside. Extraction through fermentation is a process that uses enzymes, produced by microorganisms present in natural environment, usually close to the material subjected to extraction. The fermentation conditions are selected based upon the microbial strain used, conditions that benefit both the growth of the microorganism and the extraction of natural dyes. The method is similar to aqueous extraction, but without high temperature requirements (usually the fermentation is conducted at 30°C ± 2). Some disadvantages of this method include: long periods of extraction, unpleasant smell of the used biomass or the requirements of performing the extraction must be conducted immediately after harvesting (Mansour, 2018). Additionally, another major disadvantage is the fact that by using microorganisms, the dyes obtained can be considered unsafe for some applications when the microorganisms are not labelled as GRAS (Generally Recognized as Safe).
Ultrasonic assisted extraction is similar to the microwave assisted extraction. The efficiency of this method is increased by the action of ultrasounds, that in return help reduce the necessary quantity of solvents or lower the extraction periods. Also, this method can be performed in milder conditions such as lower temperature (Mansour, 2018), which can improve the extraction of dyes components that are sensitive to high temperature. In conclusion, this method is considered to be a “green process” (Mansour, 2018) due to its many benefits: quick, efficient and cheap in regards to energy consumption (Kasiri & Safapour, 2015; Oancea et al., 2021). A study that compared several extraction methods of anthocyanins from purple maize (Fernandez-Aulis et al., 2019), concluded that the most efficient protocol was the one that was performed with 20 min 100 W ultrasound, preceded by an acidifed (lactic acid) aqueous ethanol (80%) treatment. Microwave assisted extraction is considered to be a process with high extraction yields of natural dyes, due to the efficiency provided by the action of microwaves, that are able to heat faster the material subjected to extraction in comparison with other classic methods. Therefore, there is a lower extraction period and a lower energy consumption. Also, this method doesn’t negatively impact the environment. Some studies also found that this process led to higher extraction yields than other methods such as ultrasound assisted or reflux (Dabiri et al., 2005). What was similar to the ultrasonic assisted extraction, was that this method also requires low volumes of solvents and has lower extractions periods. Another benefit of using this extraction process is that by irradiation, the dyes obtained had a higher adsorption capacity upon acrylic fibers, as discussed in the research led by Sinha et al. (2012). The downside of this method is the high cost of the microwave system required at an industrial level. A study concluded through statistical optimization that the best microwave assisted extraction of anthocyanins from purple maize is achieved with a microwave irradiation of 555W for 19 min, using a solid-liquid ratio of 1: 20 (Yang and Zhai, 2010). In comparison with the conventional solvent extraction, this protocol

171
had a high efficiency and was quick in extracting the major types of anthocyanins. Supercritical fluid extraction is a modern method used for dyes extraction. Due to the specific characteristics of a supercritical fluid, this process creates a better interaction between the solvent and the material subjected to extraction, and also enhances the solubility of numerous components in any solvent. This method is considered to be a better alternative for the conventional solvent extraction, due to its many benefits: low cost of reagents, low toxicity, easily available, and less residues traces (Mansour, 2018). This process is mainly used for biotechnological applications in areas such as pharmaceutic or food. The disadvantages of this method are mainly the high cost of the equipment and low yields of extraction of polar dyes (the supercritical fluid used is CO2, a nonpolar molecule). Nowadays, the most used extraction methods for natural dyes such as anthocyanins are microwave or ultrasound assisted ones, both being considered eco-friendly and very efficient. METHODS OF IDENTIFICATION AND QUANTIFICATION OF MAIZE PIGMENTS Since purple maize is a rich source for natural dyes such as anthocyanins, an accurate identification and quantification is required in order to properly evaluate the actual content of this material. In comparison with quantification methods of anthocyanins in berries, where the results seemed to be consistent with a high correlation (Lao & Giusti, 2016), the methods used for purple maize provide different results even when the materials used are from the same variety or species. The identification and quantification of anthocyanins in purple maize can be performed either spectrophotometrically, either chromate-graphically. An easy and quick spectrophotometric method is considered to be the analysis of the total anthocyanins, where the purple maize powder is immersed in an acidic alcoholic solution (usually 95% ethanol acidified with HCl 1.5N or formic acid), the quantification being
evaluated without further purification. After the extraction at 4°C overnight, the mixture was filtered and analysed at an UV-Visible spectro-photometer at 535 nm. The results were calculated based on the average extinction coefficient for anthocyanins found in cranberries (Lao & Giusti, 2016; Yang et al., 2009). Another spectrophotometric method is the pH differential one used often for the quantify-cation of dark coloured maize pigments. This method requires an additional step before quantification which is usually an acetone extraction. The protocol requires that the purple maize powder is homogenised with 70% acetone acidified with 0.01% HCl 6N. The mixture is filtered, the filtrate is homogenised with chloroform and evaporated in a rotary evaporator. The final extract is added to a an HCl acidified water and subjected to pH differential method. The quantification method is performed by diluting the dye containing extracts with buffer of different pH: 1.0 and 4.5 and analysed with an UV-Visible spectropho-tometer at 700 nm (Lao and Giusti, 2016). The HPLC (High Performance Liquid Chromatography) chromatographic method is the most used for identification and quantification of anthocyanins. With this method, the components of the anthocyanin group are identified in different matrix. Another advantage of this method is that it can provide the most precise content of each anthocyanin detected (Lao & Giusti, 2016). However, this method is more complicated than the spectrophotometric ones, requires chemical standards for each anthocyanin compound and is more time consuming. A simple HPLC method is the one that uses intact anthocyanins, where the extract obtained from purple maize with acetone extraction (as described previously) are passed through a C18 Sep-Pak cartridge that will remove unnecessary components such as, non-phenolic compounds, sugars or acids. After that, the methanol is evaporated, the material is mixed with acidified water and filtered before being analysed through the HPLC-MS system (Lao & Giusti, 2016). Another HPLC method is the one that analysed the anthocyanins by using the extract obtained through acetone extraction and subjecting it to
172
an acid hydrolysis (HCl), at high temperature. The rest of the method was conducted similarly as described previously, mainly purification with a C18 Sep-Pak cartridge and addition of acidified water before analysis (Lao & Giusti, 2016). The main benefit of this method is the obtaining a clearer chromatogram, eliminating the possibility of anthocyanin degradation during hydrolysis. In comparison, the total anthocyanins and HPLC with acid hydrolysis methods provides an inaccurate content of anthocyanins since the first measures all the compounds that imprint a reddish colour and the latter has the risk of pigment degradation during acid hydrolysis. Therefore, the pH differential and the HPLC intact anthocyanins methods seemed to give more accurate results due to the fact that they only measure the monomeric anthocyanins. POTENTIAL APPLICATIONS OF ANTHOCYANINS CORRELATED WITH HEALTH BENEFITS According to several market reports, the annual sales of natural dyes has come closely to 600 million $ (Lao & Giusti, 2016) and the market is still growing. This suggests the evolving uses of natural dyes in various industrial applications, such as: food, textiles, artisanal products, medical, art, leather processing, histology, pharmaceutic and cosmetic (Mansour, 2018). Many natural dyes have certain characteristics that make them suited for industrial applications such as: antimicrobial, antioxidant, anti-inflammatory or even anticancer. Anthocyanins are known for their health benefits, due to their wide range of actions: antibacterial, antifungal, antioxidant, anti-inflammatory, anti-mutagenic, neuroprotective, anti-obesity, anti-allergic, anti-carcinogenic Also, they can: promote eye health, prevent LDL oxidation, support collagen, improve capillary stability, ameliorate hyperglycemia, protect against UV irradiation or even increase intercellular levels of vitamin C (Mansour, 2018; Yang et al., 2009; Martín et al., 2017; Kasiri & Safapour, 2015). When used as textile colorants, anthocyanins can provide a wide range of colours for fabrics such as silk or cotton.
Food industry Due to rigorous legislation and trends in food industry, natural additives are preferable to synthetic ones. Therefore, there’s a growing interest for natural dyes as food additives. Anthocyanins (E163) are mainly used as dyes in food for the colour they imprint: red (acid pH), purple (neutral pH) or blue (alkaline pH). These dyes are used in various food products such as: dairy products, fruit fillings, snack bars, dry-mix beverages or confectionery products (Solymosi et al., 2015). In addition to their colouring action, anthocyanins are also able to stimulate cell defence mechanisms neutralising free radicals, being therefore important for vital processes (He and Giusti, 2010). Another benefit for using anthocyanins in food products is the fact that they can act as markers for food quality, participate in lowering the risk of coronary heart disease, stroke or even cancer and improve the nutritional quality (Lao & Giusti, 2016; Mansour, 2018). Anthocyanins are also used as a marker for wine classification upon their grape variety (Martín et al., 2017). Cosmetic industry Due to its action as a protective agent against UV irradiation (Martín et al., 2017), purple maize anthocyanins can be used in skincare formulations for lotion or creams that are marketed as sun protectants. Some studies revealed that efficacy of anthocyanins regarding its ability of absorption of UV irradiation was about 46% (Rojo et al., 2013). Pharmaceutical or medical applications Due to their wide range of actions mentioned before, anthocyanins are perfect candidates for medication for prevention or treatments for cancer, diabetes mellitus or cardiovascular diseases (Martín et al., 2017). They often are prescribed as dietary supplements or nutraceuticals. Amongst other health benefits are worth mentioning: anti-obesity (suppressed body weight gain, fat tissue gain and other metabolic disorders), visual health (improved visual functions in tension glaucoma, increased ocular blood flows, decreased lens opacity, prevented retinal degeneration), or antimicrobial (Khoo et al., 2017; Tsuda et al., 2003; Shim et al., 2012; Thiraphatthanavong et al., 2014; Paik et al., 2012; Ohguro et al., 2012).

173
Other applications New promising researches studied the use of anthocyanins as sensitizer in dye-sensitized solar cells that simulate photosynthesis in plants, but in low light conditions. Although the efficiency of this type of solar cells was low, the experiments were considered somewhat a success due to the fact that they were easy to obtain and had a low cost (Mansour, 2018), in comparison with classic dye-sensitized solar cells that use ruthenium-based dyes. Another application is centred in the horticulture domain, anthocyanins being used as dyes in a genetic engineering protocol in order to create flowers with new colours such as blue roses (Martín et al., 2017). CONCLUSIONS In comparison with synthetic dyes, natural dyes are less toxic and biodegradable, therefore having a low negative impact on the environment. The main dyes extracted from purple maize are anthocyanins, but in some cultivars were also found low concentration of carotenoids. The main anthocyanins found in purple maize are represented by: pelargonidin-3-glucoside cyanidin-3-glucoside, peonidin-3-glucoside and their malonated counterparts. The extraction of natural dyes can be conducted either through conventional methods, either through modern methods, the most used being microwave or ultrasound assisted ones, both being considered eco-friendly and very efficient. The best methods regarding accuracy for iden-tification and quantification of anthocyanins from purple maize are the pH differential and the HPLC intact anthocyanins methods. The multiple benefits of anthocyanins (antioxi-dant, anti-obesity, anticarcinogenic, anti-inflammatory, antimicrobial, neuroprotective etc.) support their use in various applications such as: food, textile, pharmaceutic, cosmetic or medical. REFERENCES Albu, C. V., Encea, R. Ş., Diguta, C., Matei, F., &
Cornea, C. P. (2019). Laccase: macro and microbial sources, production, purification and biotechnological applications. Scientific Bulletin, Series F. Biotechnologies, 23, 128-136.
Coarfă, E., & Popa, M. E. (2019). Effect of climate conditions on the ripeness quality indicators of some
red grapes from Valea Călugărească vineyard. Scientific Bulletin. Series F. Biotechnologies, 23, 78-86.
Cristianini, M., & Guillén Sánchez, J. S. (2020). Extraction of bioactive compounds from purple corn using emerging technologies: A review. Journal of food science, 85(4), 862-869.
Dabiri, M., Salimi, S., Ghassempour, A., Rassouli, A., & Talebi, M. (2005). Optimization of microwave‐assisted extraction for alizarin and purpurin in Rubiaceae plants and its comparison with conventional extraction methods. Journal of separation science, 28(4), 387-396.
Fernandez-Aulis, F., Hernandez-Vazquez, L., Aguilar-Osorio, G., Arrieta-Baez, D., & Navarro-Ocana, A. (2019). Extraction and identification of anthocyanins in corn cob and corn husk from Cacahuacintle maize. Journal of food science, 84(5), 954-962.
Georgieva, M. (2020), Regenerative capacity of leaves and stem segments of six genotypes of Vaccinium corymbosum L.. Scientific Bulletin. Series F. Biotechnologies, Vol. XXIV, Issue 2, ISSN 2285-1364, 11-16
He, J., & Giusti, M. M. (2010). Anthocyanins: natural colorants with health-promoting properties. Annual review of food science and technology, 1, 163-187.
Heer, K., & Sharma, S. (2017). Microbial pigments as a natural color: a review. Int J Pharm Sci Res, 8(5), 1913-1922.
Hoxha L., Kongoli R. 2019, Application of hurdle technology as a novel approach to new dietary fig-based products development in rural areas of Albania. Scientific Bulletin. Series F. Biotechnologies, Vol. Xxiii, Issn 2285-1364, 102-107.
Irimescu, L. S., Băbeanu, N., & Matei, F. (2019). Mapping geographical distribution of Romanian orchids and their biological active substances. Scientific Bulletin. Series F. Biotechnologies, XXIII, 154-163.
Kasiri, M. B., & Safapour, S. (2015). Exploring and exploiting plants extracts as the natural dyes/antimicrobials in textiles processing.
Khoo, H. E., Azlan, A., Tang, S. T., & Lim, S. M. (2017). Anthocyanidins and anthocyanins: colored pigments as food, pharmaceutical ingredients, and the potential health benefits. Food & nutrition research, 61(1), 1361779.
Lao, F., & Giusti, M. M. (2016). Quantification of purple corn (Zea mays L.) anthocyanins using spectrophotometric and HPLC approaches: method comparison and correlation. Food analytical methods, 9(5), 1367-1380.
Lao, F., & Giusti, M. M. (2018). Extraction of purple corn (Zea mays L.) cob pigments and phenolic compounds using food-friendly solvents. Journal of Cereal Science, 80, 87-93.
Mansour, R. (2018). Natural dyes and pigments: Extraction and applications. Handbook of renewable materials for coloration and finishing, 75-102.
Martín, J., Navas, M. J., Jiménez-Moreno, A. M., & Asuero, A. G. (2017). Anthocyanin pigments: Importance, sample preparation and extraction. Phenolic compounds - Natural sources, importance and applications. InTech, 117-152.
174
Oancea, S., Perju, M., Coman, D., & Olosutean, H. (2021). Optimization of conventional and ultrasound-assisted extraction of Paeonia officinalis anthocyanins, as natural alternative for a green technology of cotton dyeing. Romanian Biotechnological Letters, 26(2), 2527-2534.
Ohguro, H., Ohguro, I., Katai, M., & Tanaka, S. (2012). Two-year randomized, placebo-controlled study of black currant anthocyanins on visual field in glaucoma. Ophthalmologica, 228(1), 26-35.
Paik, S. S., Jeong, E., Jung, S. W., Ha, T. J., Kang, S., Sim, S., ... & Kim, I. B. (2012). Anthocyanins from the seed coat of black soybean reduce retinal degeneration induced by N-methyl-N-nitrosourea. Experimental eye research, 97(1), 55-62.
Raducu, C., Mireșan, V., Balta, I., Aurelia, C., Maris, S., & Longodor, A. L. (2019). characterization of merlot dry red wine composition according to the year of production. Scientific Bulletin. Series F. Biotechnologies, Vol. XXIII, 2019 ISSN 2285-1364, CD-ROM ISSN 2285-5521, ISSN Online 2285-1372, ISSN-L 2285-1364.
Rojo, L. E., Roopchand, D. E., Graf, B., Cheng, D. M., Ribnicky, D., Fridlender, B., & Raskin, I. (2013). 11 Role of Anthocyanins in Skin Aging and UV-Induced Skin Damage. Anthocyanins in health and disease, 309.
Shim, S. H., Kim, J. M., Choi, C. Y., Kim, C. Y., & Park, K. H. (2012). Ginkgo biloba extract and bilberry anthocyanins improve visual function in patients with normal tension glaucoma. Journal of medicinal food, 15(9), 818-823.
Sinha, K., Saha, P. D., & Datta, S. (2012). Extraction of natural dye from petals of Flame of forest (Butea monosperma) flower: process optimization using
response surface methodology (RSM). Dyes and Pigments, 94(2), 212-216.
Solymosi, K., Latruffe, N., Morant-Manceau, A., & Schoefs, B. (2015). Food colour additives of natural origin. In Colour additives for foods and beverages (pp. 3-34). Woodhead Publishing.
Thiraphatthanavong, P., Wattanathorn, J., Muchimapura, S., Thukham-Mee, W., Wannanon, P., Tong-Un, T., ... & Lertrat, K. (2014). Preventive effect of Zea mays L .(purple waxy corn) on experimental diabetic cataract. BioMed Research International, 2014.
Tsuda, T., Horio, F., Uchida, K., Aoki, H., & Osawa, T. (2003). Dietary cyanidin 3-O-β-D-glucoside-rich purple corn color prevents obesity and ameliorates hyperglycemia in mice. The Journal of nutrition, 133(7), 2125-2130.
Viganó, J., & Martinez, J. (2015). Trends for the application of passion fruit industrial by-products: a review on the chemical composition and extraction techniques of phytochemicals. Food and public health.
Wisniak, J. (2004). Dyes from antiquity to synthesis. Indian Journal of History of Science, 39(1), 75-100.
Wood, C. G. (1986). Natural Dyes. ChemMatters, 4. Yang, Z., & Zhai, W. (2010). Optimization of
microwave-assisted extraction of anthocyanins from purple corn (Zea mays L.) cob and identification with HPLC–MS. Innovative food science & emerging technologies, 11(3), 470-476.
Yang, Z., Chen, Z., Yuan, S., Zhai, W., Piao, X., & Piao, X. (2009). Extraction and identification of anthocyanin from purple corn (Zea mays L.). International journal of food science & technology, 44(12), 2485-2492.

175
COMPARATIVE STUDY OF LIGHT MICROSCOPY IMAGES OF POLLEN FROM 3 ONAGRACEAE SPECIES
Monica ENACHE, Silvana Mihaela DĂNĂILĂ-GUIDEA, Marius HANGAN
University of Agronomic Sciences and Veterinary Medicine of Bucharest, 59 Mărăşti Blvd,
District 1, Bucharest, Romania
Corresponding author email: [email protected] Abstract Due to their morphological characteristics such as: tetramerous, actinomorphic or zygomorphic flowers that are arranged in racemes, spikes, or panicles, simple, opposite or alternate leaves, lanceolate in shape, a capsule or, rarely, a berry fruit, very small seeds that have in some genera, tufts of hairs, the Onagraceae species are considered easy to recognize in the field. Some of the species found in Romania are well known melliferous plants, popular ornamental plants, ruderal plants or plants that have been used in traditional medicine. Different genera have pollen grains that have different morphological characteristics such as the shape, size, the apertures and the surface patterns, but in many genera they are held together by viscin threads that make the pollen sticky. Although modern techniques of pollen analysis include electron microscopy, most pollen studies also use conventional light microscopy. In the present study, images of hydrated pollen from Fuchsia magellanica 'Alice Hoffman', Oenothera biennis (common evening-primrose) and Epilobium parviflorum (small-flowered willowherb) were provided by light microscopy and were compared to the descriptions found in the literature. Key words: Epilobium parviflorum; Fuchsia magellanica; light microscope; microphotographs; Oenothera biennis; pollen morphology. INTRODUCTION In Romania, the Onagraceae (Oenotheraceae) family - known also as the evening-primrose family, includes 27 spontaneous and cultivated species, that belong to 6 genera: Chamerion (Chamaenerion), Circaea, Epilobium, Fuchsia, Ludwigia and Oenothera (Ciocârlan, 2009). Fuchsia is a very popular ornamental, perennial, container plant, grown mostly outdoors during summer for its dozens of multi-colored pendulous flowers with teardrop shape that bloom from spring until fall, usually if sheltered from intense sun and heat. A ruderal biennial plant that is found growing in sunny places in the sandy soils of the river meadow is Oenothera. Oenothera biennis (Onagra biennis) (common evening-primrose) has large yellow flowers that open fast every evening and is sometimes cultivated in gardens or parks for its horticultural value. The mature seeds contain gamma-linolenic acid that has medicinal uses. Oenothera is melliferous,
attracting pollinators such as moths, butterflies, and specialized bees. Some Epilobium and Chamaenerion species are also melliferous: Epilobium parviflorum and Chamaenerion angustifolium (Epilobium angustifolium), are herbaceous, perennial plants, found all over the country. Due to their use in traditional medicine, the aerial parts of some Epilobium species have been used as herbal tea. The morphology of the Onagraceae pollen grains was investigated in numerous studies, for example Brown (1966) (also see Perveen & Qaiser, 2013 for literature citations). Moreover, pollen development was described for selected Onagraceae species (Takahashi & Skvarla, 1990; Rowley & Skvarla, 2006; Rowley & Skvarla, 2007). The study of pollen uses the light microscopy for counting and identifying pollen grains of a particular sample and scanning electron microscopy for morphological comparisons and taxonomy (Jones & Bryant, 2007).
Scientific Bulletin. Series F. Biotechnologies, Vol. XXV, No. 1, 2021ISSN 2285-1364, CD-ROM ISSN 2285-5521, ISSN Online 2285-1372, ISSN-L 2285-1364

176
In the present study, light microscopy images were used for three species, each from a differ-rent Onagraceae genera (Fuchsia, Oenothera and Epilobium) to analyse the hydrated pollen grain and to compare the results to the descriptions found in the literature (Brown, 1966; Halbritter, 2016; Auer, 2020; Halbritter & Auer, 2020; Stebler, 2021b, c, d). MATERIALS AND METHODS Pollen of Epilobium parviflorum was analysed from dry plant material (Epilobii herba) obtained commercially, while pollen of Oenothera biennis and Fuchsia magellanica 'Alice Hoffman' was analysed from fresh plants cultivated in Bucharest (Figures 1-3). The microscopic analysis was carried out in the Laboratory of Biology, Faculty of Biotechnologies of the University of Agronomic Sciences and Veterinary Medicine of Bucharest using wet mounts (sometimes toluidine blue (TB) was added for better contrast) and a Micros Austria optical microscope with ocular micrometer (calibration ratio was 1 µm for objective 100× and 2.5 µm for objective 40×). Microscopic images were photographed with a Sony Cyber-shot digital camera (Carl Zeiss Vario-Tessar 5× zoom lens). The classification of pollen according to size is from Stebler (2021a).
Figure 1. Epilobii herba used in the present study
Figure 2. Fuchsia magellanica 'Alice Hoffman'
used in the present study
Figure 3. Oenothera biennis used in the present study

177
RESULTS AND DISCUSSIONS Epilobium parviflorum pollen showed large, 3-zonoporate, oblate pollen grains with protruding apertures, psilate surface and viscin threads (Figures 4-5). The pollen of Fuchsia magellanica 'Alice Hoffman' showed large, 3-zonoporate pollen grains with slightly protruding apertures,
scabrate surface and viscin threads (Figures 6-8). Oenothera biennis pollen images show large, 3-zonoporate, oblate pollen grains with distinctly protruding apertures, scabrate exine, a wrinkled surface of the polar area in grains that are not fully hydrated and viscin threads (Figures 9-13).
Figure 4. Epilobium parviflorum pollen grain with circular outline in polar view (TB)
Figure 5. Epilobium parviflorum pollen grain in slightly oblique polar view, viscin thread visible (TB)
(a) (b)
Figure 6. Fuchsia magellanica 'Alice Hoffman' pollen grain in slightly oblique equatorial view, (a) upper focus, (b) optical section (TB)

178
Figure 7. Pollen grain of Fuchsia magellanica 'Alice Hoffman' - exine surface
Figure 8. Pollen grain of Fuchsia magellanica 'Alice Hoffman' - viscin threads are visible
Figure 9. Oenothera biennis pollen grain with triangular outline and protruding apertures at each corner in polar view
(TB)

179
Figure 10. Oenothera biennis pollen grain - protruding aperture ~45 m deep and 67 m wide; exine ~ 3 m thick (TB)
(a) (b)
Figure 11. Oenothera biennis pollen grains in polar view – (a) optical section, (b) upper focus, distinct areas at the junctions with the protruding apertures are visible (TB)
Figure 12. Pollen grain of Oenothera biennis - exine surface

180
Figure 13. Oenothera biennis pollen grain showing a wrinkled surface of the polar area (TB)
CONCLUSIONS The three Onagraceae species that were analysed in the present study belong to three different genera and they have a few different characteristics, such as the outline in polar view and the distinct apertural protrusions, that allow them to be distinguished in light microscopy images. The data is similar to that found in the literature, however, Epilobium parviflorum is shed in tetrade, but here, when dry herbal tea was used as plant material, it was seen as single grain. REFERENCES Auer, W. (2020). Oenothera biennis. In: PalDat - A
palynological database. Retrieved Feb. 22, 2021, from www.paldat.org/pub/Oenothera_biennis/304239.
Brown, C. A. (1967). Pollen Morphology of the Onagraceae. Review of Palaeobotany and Palynology, 3, 163-180.
Ciocârlan, V. (2009). Flora ilustrată a României. Bucharest, RO: Ceres Publishing House.
Halbritter, H. & Auer, W. (2020). Epilobium parviflorum. In: PalDat - A palynological database. Retrieved Feb. 22, 2021, from https://www.paldat.org/pub/Epilobium_parviflorum/304243.
Halbritter, H. (2016). Fuchsia magellanica. In: PalDat - A palynological database. Retrieved Feb. 22, 2021, from
https://www.paldat.org/pub/Fuchsia_magellanica/302630.
Jones, G. D. & Bryant; V. M., Jr. (2007). A comparison of pollen counts: Light versus scanning electron microscopy. Grana 46 (1), 20-33.
Perveen, A. & Qaiser, M. (2013). Pollen flora of Pakistan – LXXI. Onagraceae. Pakistan Journal of Botany, 45(1): 241-245.
Rowley, J. R., & Skvarla, J. J. (2006). Pollen development in Epilobium (Onagraceae): Late microspore stages (a review). Review of Palaeobotany and Palynology, 140, 91–112.
Rowley, J. R., & Skvarla, J. J. (2007). Pollen development in Epilobium (Onagraceae): From microspore mitosis to formation of the intine. Grana, 46, 130-139.
Stebler, Th. (2021a). "Kategorien", Pollen-Wiki. Retrieved Feb. 21, 2021, from https://pollen.tstebler.ch/MediaWiki/index.php?title=Kategorien
Stebler, Th. (2021b). Epilobium parviflorum, Pollen-Wiki. Retrieved Feb. 22, 2021, from https://pollen.tstebler.ch/MediaWiki/index.php?title=Epilobium_parviflorum.
Stebler, Th. (2021c). Fuchsia magellanica, Pollen-Wiki. Retrieved Feb. 22, 2021, from https://pollen.tstebler.ch/MediaWiki/index.php?title=Fuchsia_magellanica.
Stebler, Th. (2021d). Oenothera biennis, Pollen-Wiki. Retrieved Feb. 22, 2021, from https://pollen.tstebler.ch/MediaWiki/index.php?title=Oenothera_biennis.
Takahashi, M. & Skvarla, J. J. (1990). Pollen development in Oenothera biennis (Onagraceae). American Journal of Botany, 77(9): 1142-1148.
SCIENTIFIC BULLETINSERIES F. BIOTECHNOLOGIES
Volume XXV, No. 1
University of Agronomic Sciencesand Veterinary Medicine of Bucharest
Faculty of Biotechnology
BucharesT2021
SCIE
NT
IFIC
BU
LLET
IN. S
ERIE
S F.
BIO
TEC
HN
OLO
GIE
S. V
olu
me
XX
V, N
o. 1
, 202
1
ISSN 2285 – 1364ISSN-L 2285 – 1364