Embed Size (px)
Citation preview
Serum Amyloid A: Expression Throughout HumanOvarian Folliculogenesis and Levels in Follicular Fluidof Women Undergoing Controlled OvarianStimulation
Simcha Urieli-Shoval, Zvesdana Finci-Yeheskel, Ido Eldar, Reinhold P. Linke,Mark Levin, Diana Prus,* and Ronit Haimov-Kochman*
Hematology Unit (S.U.-S., Z.F.-Y., M.L.), Departments of Pathology (D.P.), Obstetrics and Gynecology(I.E., R.H.-K.), Hadassah-Hebrew University Medical Center, Mt Scopus, Jerusalem 91240, Israel; andReference Center of Amyloid Diseases (R.P.L.), amYmed, Martinsried, Germany
Background: Serum amyloid A (SAA) is an acute phase protein expressed primarily in the liver inresponse to various injuries and inflammatory stimuli and is recognized as a modulator of inflam-mation. Ovarian reproductive functions including folliculogenesis and ovulation use inflammatoryprocesses; thus, studying SAA in this context is of interest.
Objectives: We investigated the expression and localization of SAA in ovarian developing folliclesand its levels in follicular fluids.
Methods and Participants: Nonradioactive in situ hybridization and immunohistochemical stainingwere applied on ovarian paraffin tissue sections. ELISA and RT-PCR were applied on follicularaspirates and blood samples from women undergoing controlled ovarian stimulation for in vitrofertilization.
Results: Expression of SAA mRNA and protein was found in follicular cells at all stages of folliculardevelopment, from primordial and primary follicles through antral follicles and corpora lutea.Expression was observed in granulosa, theca and luteal cells, and oocytes. Expression of SAA wasalso found in granulosa cells recovered from follicular aspirates. The SAA protein was detected infollicular fluids. Its levels were somewhat lower than in peripheral blood with strong correlationbetween the two compartments and with significant correlation with patient’s body mass index.High follicular fluid SAA levels were associated with reduced pregnancy rate.
Conclusions: SAA is locally produced in ovarian developing follicles and is a constituent of follicularfluids, suggesting its role within the follicular environment. Elevated follicular SAA levels areassociated with decreased pregnancy rate and may signify lower reproductive performance.
Serum amyloid A (SAA) is an acute phase protein whoselevel in the blood is elevated 1000-fold in response to
various inflammatory stimuli, including tissue injury, in-fection, and neoplasia (1). The liver is the major site of SAAproduction; however, extrahepatic expression was de-scribed in the epithelium of normal tissues (2), in adiposetissues (3), in diseased tissues such as atherosclerotic le-sions (4), and in various carcinomas including ovarian
carcinoma (5, 6). The role of SAA in health and diseases isnot well understood. In addition to its pathogenic role asthe precursor protein in AA-type amyloidosis and a role incholesterol metabolism and transport, being a high-den-sity lipoprotein–associated apolipoprotein, SAA is viewedas a modulator of inflammatory processes (1). Its activitiesrelated to inflammation include inducing adhesion, mi-gration, and tissue infiltration of leukocytes (7); enhanc-
ISSN Print 0021-972X ISSN Online 1945-7197Printed in U.S.A.Copyright © 2013 by The Endocrine SocietyReceived March 28, 2012. Accepted August 27, 2013.
* D.P. and R.H.-K. contributed equally to the study.Abbreviations: BMI, body mass index; CT, threshold cycle; IVF, in vitro fertilization; SAA,serum amyloid A.
O R I G I N A L A R T I C L E
E n d o c r i n e R e s e a r c h
doi: 10.1210/jc.2012-1801 J Clin Endocrinol Metab jcem.endojournals.org 1
J Clin Endocrin Metab. First published ahead of print September 12, 2013 as doi:10.1210/jc.2012-1801
Copyright (C) 2013 by The Endocrine Society
ing production and activity of matrix-degrading enzymesmetalloproteinases (8), and plasminogen activators (9);stimulating production of inflammatory cytokines:TNF-�, IL-I�, IL-8, IL-6 (10, 11); and stimulating angio-genesis, activation of inflammation-associated nuclearfactor �B and MAPK signaling pathways (12).
Ovarian reproductive functions, folliculogenesis, ovu-lation, and corpus luteum formation are viewed as inflam-matory processes (13). Folliculogenesis is the developmentof ovarian follicles from the primordial stage through aseries of morphologically defined stages: primary, second-ary, and antral follicles, culminating in preovulatory fol-licle and formation of corpus luteum and corpus albicans.Follicular development involves cell recruitment and pro-liferation, angiogenesis, tissue remodeling, and steroidproduction, regulated by pituitary-derived gonadotropinsand by locally produced growth factors and cytokines(14). Many of the regulatory proteins have been detectedin follicular fluids surrounding developing oocytes and arethought to play a role in determining oocyte quality andsubsequent fertilization and embryo development (15).Growth factors and cytokines found in follicular fluids ofwomen undergoing in vitro fertilization (IVF) were sug-gested as biomarkers predicting IVF outcome (16, 17).
In view of the function of SAA as a modulator of in-flammation, we sought to study its possible involvement infemale reproduction. As a first step, we investigated the
local expression of SAA in human ovarian folliclesthroughout folliculogenesis and its levels in follicular flu-ids of women undergoing controlled ovarian stimulation.
Materials and Methods
Ovarian tissues, follicular fluids, and bloodsamples
Conventional serial sections of paraffin-embedded archivalnormal ovarian tissues from 12 women (age 26–52 years), op-erated for various diagnoses (uterus myomatosus, n � 8; pro-phylactic oophorectomy, n � 2; ovarian benign tumors, n � 2)between 1993 and 2003, were obtained from the Department ofPathology. Follicular aspirates were collected from 123 healthynormally cycling women (age 19–45 years) who underwent eggretrieval for IVF at the institutional IVF Unit, between 2008 and2010. Patient and cycle characteristics are detailed in Table 1.Controlled ovarian stimulation and collection of follicular aspi-rates were performed as described (18, 19). Blood samples weredrawn from 25 IVF patients at the time of follicular aspiration,and plasma was frozen until assayed. Informed consents wereobtained for the use of follicular aspirate and blood samples.Studies were approved by the Human Subjects Research Com-mittee of the Hadassah-Hebrew University Medical Center.
Isolation of granulosa cellsGranulosa cells were isolated from follicular aspirates as de-
scribed (18, 19). Briefly, after oocyte retrieval, follicular aspi-rates of each patient were pooled (aspirates with blood contam-
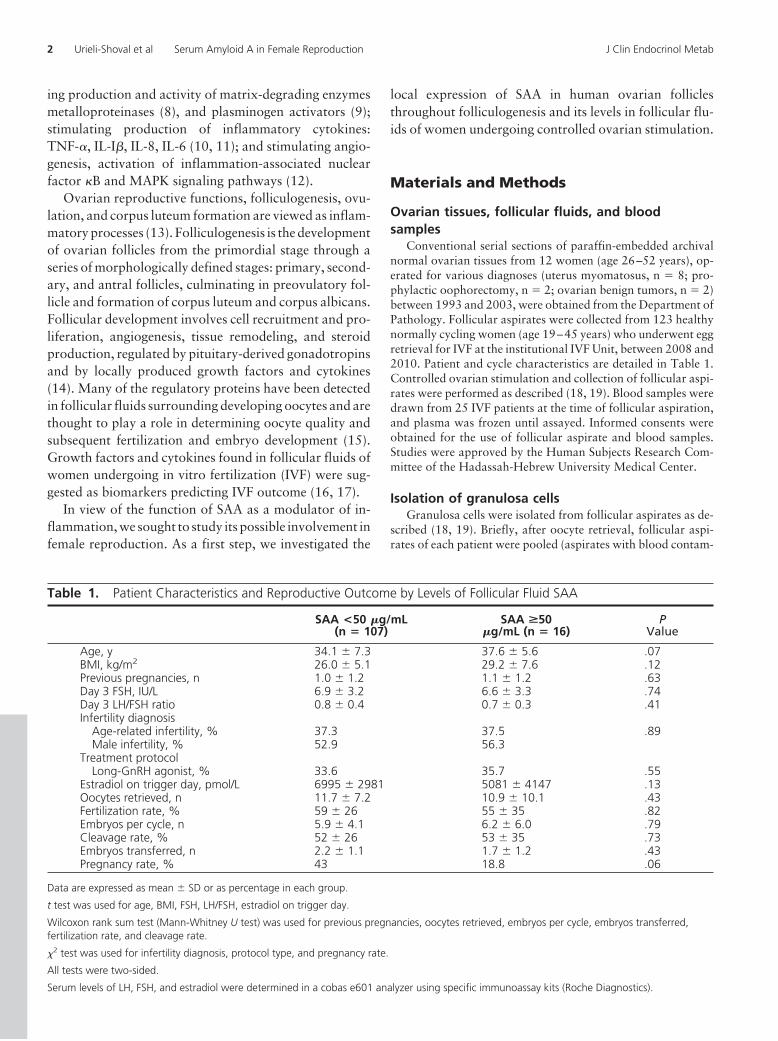
Table 1. Patient Characteristics and Reproductive Outcome by Levels of Follicular Fluid SAA
SAA <50 �g/mL(n � 107)
SAA >50�g/mL (n � 16)
PValue
Age, y 34.1 � 7.3 37.6 � 5.6 .07BMI, kg/m2 26.0 � 5.1 29.2 � 7.6 .12Previous pregnancies, n 1.0 � 1.2 1.1 � 1.2 .63Day 3 FSH, IU/L 6.9 � 3.2 6.6 � 3.3 .74Day 3 LH/FSH ratio 0.8 � 0.4 0.7 � 0.3 .41Infertility diagnosis
Age-related infertility, % 37.3 37.5 .89Male infertility, % 52.9 56.3
Treatment protocolLong-GnRH agonist, % 33.6 35.7 .55
Estradiol on trigger day, pmol/L 6995 � 2981 5081 � 4147 .13Oocytes retrieved, n 11.7 � 7.2 10.9 � 10.1 .43Fertilization rate, % 59 � 26 55 � 35 .82Embryos per cycle, n 5.9 � 4.1 6.2 � 6.0 .79Cleavage rate, % 52 � 26 53 � 35 .73Embryos transferred, n 2.2 � 1.1 1.7 � 1.2 .43Pregnancy rate, % 43 18.8 .06
Data are expressed as mean � SD or as percentage in each group.
t test was used for age, BMI, FSH, LH/FSH, estradiol on trigger day.
Wilcoxon rank sum test (Mann-Whitney U test) was used for previous pregnancies, oocytes retrieved, embryos per cycle, embryos transferred,fertilization rate, and cleavage rate.
�2 test was used for infertility diagnosis, protocol type, and pregnancy rate.
All tests were two-sided.
Serum levels of LH, FSH, and estradiol were determined in a cobas e601 analyzer using specific immunoassay kits (Roche Diagnostics).
2 Urieli-Shoval et al Serum Amyloid A in Female Reproduction J Clin Endocrinol Metab
ination were excluded) and centrifuged. The resultingsupernatant was frozen in aliquots until assayed. The cell pelletwas resuspended in PBS, and suspension was layered onto Ficoll-Paque Plus (GE Healthcare Bio-Sciences) and centrifuged at 500gfor 30 minutes. Granulosa cells were recovered from the inter-face, washed with PBS, and kept frozen until analyzed.
In situ hybridizationNonradioactive in situ hybridization for SAA mRNA expres-
sion was performed as described (5, 6). Briefly, SAA probe wasprepared from pGEM transcription vector that contained a110-bp sequence of mouse SAA1 cDNA (p125). This nucleotidesequence is 81% homologous with human SAA1 and SAA2 and71% homologous with human SAA4 and therefore should hy-bridize with SAA1 and SAA2 but may not hybridize efficientlywith SAA4 (4). The p125 was linearized with HindIII (antisense)or EcoRI (sense) and incubated in a transcription reaction con-taining digoxigenin-labeled UTP (Boehringer-Mannheim). Anonlabeled antisense probe was also generated using UTP in-stead of digoxigenin-labeled UTP. The antisense probe and thecontrol probes (the sense probe and the antisense probe mixedwith a 20-fold excess of nonlabeled antisense probe) were ap-plied on parallel tissue sections and in situ hybridization wasperformed. Hybridization with the control probes resulted insubstantially diminished signal.
ImmunohistochemistryImmunohistochemistry for SAA protein expression was per-
formed using the Histostain-Plus SP kit (Zymed LaboratoriesInc) as described (5, 6). Briefly, two anti-SAA monoclonal anti-bodies were used: clone mcl (DAKO Corporation) and clonemc29 (amYmed). The antibody mc1 detects SAA1 and SAA2;mc29 detects SAA1, SAA2, and SAA4. The antibodies’ specific-ity was described (20, 21). Antibodies were diluted 1:20 (mc1)and 1:600 (mc29) in 0.1M Tris-HCl pH 7.6 and incubated 2hours at room temperature. The two antibodies yielded similarstaining pattern. For negative control, primary antibodies werereplaced by normal mouse isotype–matched immunoglobulin G(IgG2a, �; DAKO Corp), resulting in substantially diminishedsignal.
Quantification of the SAA proteinSAA concentrations in follicular fluids and in blood-plasma
samples were determined using SAA-specific ELISA (BioSourceInternational Inc). This ELISA detects SAA1 and SAA2. Isolatedgranulosa cells were subjected to protein extraction using RIPAlysis buffer containing protease and phosphatase inhibitors (UP-STATE). Total protein of granulosa cell extracts was determinedusing a modified Lowry protein assay (Sigma Aldrich), and SAAconcentrations in these extracts were determined by the sameELISA.
RT-PCRRNA was extracted from isolated granulosa cells using Tri
Reagent (Sigma), and cDNA was amplified using primers specificfor the human SAA genes: SAA1, SAA2, SAA4, and the control�-actin, as described (5, 6). Relative levels of SAA expressionwere measured by TaqMan real-time PCR. Commercially avail-able primers (Applied Biosystems Life Technologies) were asfollows: SAA1/2 (no. Hs 00761940_s1, because of the high ho-mology between SAA1 and SAA2, primers were designed to de-
tect both genes), SAA4 (no. Hs01050250_m1), and internal con-trol h-GUSB (glucuronidase �, no. Hs00939627_m1).Amplification was performed on 7900HT Real-Time PCR Sys-tem (Applied Biosystems). Threshold cycle (CT) values were nor-malized to h-GUSB (�Ct), and relative gene expression was cal-culated by the comparative CT method (2���C
T method) (22).
Statistical analysisComparison of patient and IVF parameters by levels of SAA
was performed using Student’s t test, Wilcoxon rank sum test,and �2 test, as appropriate (Table 1). Correlations between con-centrations of SAA in follicular fluids and those in blood andgranulosa cells were calculated by linear regression analysis.One-way ANOVA was performed to find overall mean differ-ences between three body mass index (BMI) levels and post-hocmultiple comparisons using Tukey’s method (Figure 3D). Anal-ysis was conducted using SAS software version 9.1 (SAS InstituteInc). All tests were two-sided, and P values �.05 were consideredsignificant. Statistical analysis was not applied on the in situhybridization, immunohistochemistry, and RT-PCR results, asthey were mostly descriptive not quantitative.
Results
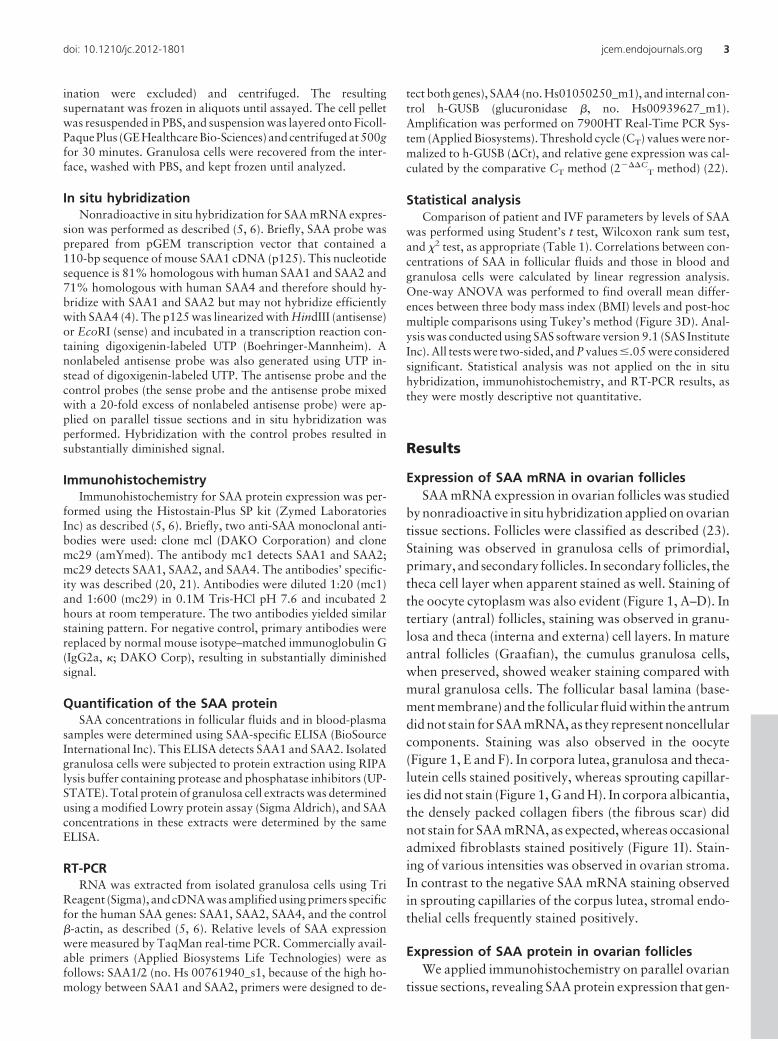
Expression of SAA mRNA in ovarian folliclesSAA mRNA expression in ovarian follicles was studied
by nonradioactive in situ hybridization applied on ovariantissue sections. Follicles were classified as described (23).Staining was observed in granulosa cells of primordial,primary, and secondary follicles. In secondary follicles, thetheca cell layer when apparent stained as well. Staining ofthe oocyte cytoplasm was also evident (Figure 1, A–D). Intertiary (antral) follicles, staining was observed in granu-losa and theca (interna and externa) cell layers. In matureantral follicles (Graafian), the cumulus granulosa cells,when preserved, showed weaker staining compared withmural granulosa cells. The follicular basal lamina (base-ment membrane) and the follicular fluid within the antrumdid not stain for SAA mRNA, as they represent noncellularcomponents. Staining was also observed in the oocyte(Figure 1, E and F). In corpora lutea, granulosa and theca-lutein cells stained positively, whereas sprouting capillar-ies did not stain (Figure 1, G and H). In corpora albicantia,the densely packed collagen fibers (the fibrous scar) didnot stain for SAA mRNA, as expected, whereas occasionaladmixed fibroblasts stained positively (Figure 1I). Stain-ing of various intensities was observed in ovarian stroma.In contrast to the negative SAA mRNA staining observedin sprouting capillaries of the corpus lutea, stromal endo-thelial cells frequently stained positively.
Expression of SAA protein in ovarian folliclesWe applied immunohistochemistry on parallel ovarian
tissue sections, revealing SAA protein expression that gen-
doi: 10.1210/jc.2012-1801 jcem.endojournals.org 3
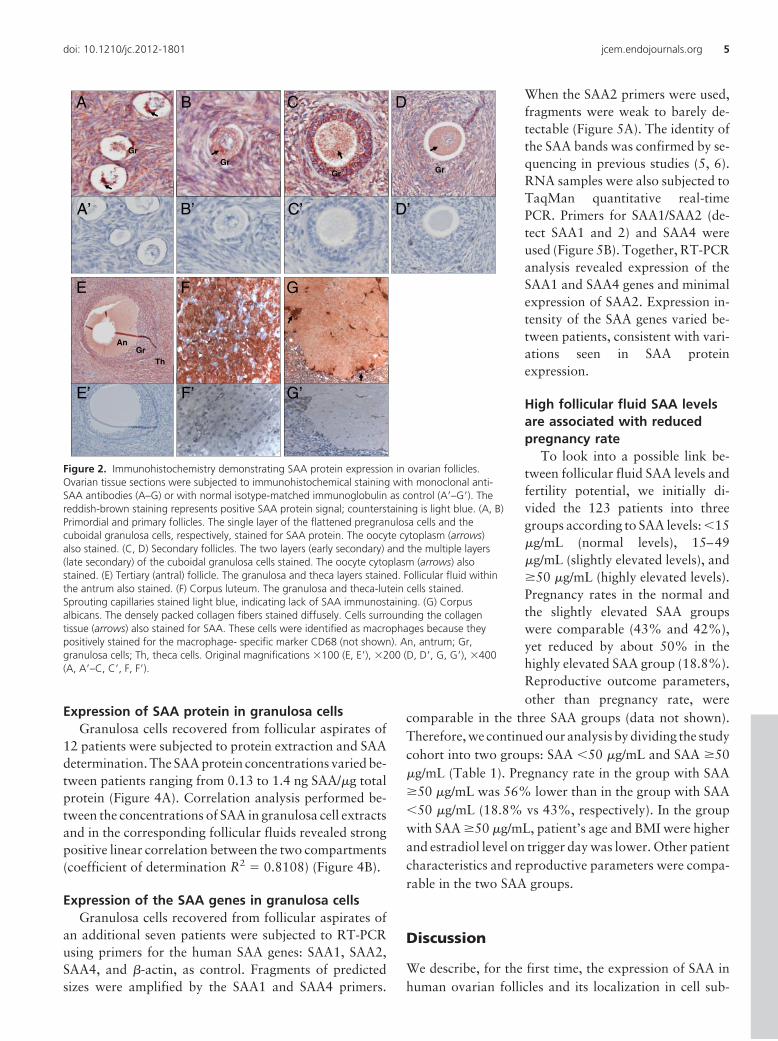
erally colocalized with SAA mRNA expression. In primor-dial and primary follicles, the single layer of the flattenedpregranulosa cells and the cuboidal granulosa cells, re-spectively, stained positively for SAA. Staining was alsoevident in the oocyte cytoplasm (Figure 2, A and B). Insecondary follicles, the multiple layers of granulosa cells,the theca cell layers when apparent, and the oocyte cyto-plasm, stained positively (Figure 2, C and D). In tertiary(antral) follicles, SAA immunoreactivity was observed ingranulosa and theca cell layers as well as in follicular fluidswithin antral cavities (Figure 2E). In corpora lutea, SAAwas immuno-detected in granulosa and theca-lutein cells,whereas sprouting capillaries did not stain (Figure 2F). Incorpora albicantia, the densely packed collagen fibersstained less intensively and diffusely (Figure 2G). Stainingof various intensities was observed in ovarian stromathroughout the ovary.
Levels of SAA protein infollicular fluids of IVF patients
We next examined follicular flu-ids of IVF patients (n � 123) by SAA-specific ELISA. SAA was detected inall follicular fluids studied. Its con-centrations varied among patients,ranging between 1 and 102 �g/mLfollicular fluid. Of the 123 patients,66 patients (53%) had high SAAconcentrations (�15 �g/mL),namely higher than SAA concentra-tion in the blood of healthy individ-uals. Of these 66 patients, 50 pa-tients had slightly elevated SAA(range 15–49 �g/mL, mean 26.1 �1.3 �g/mL) and 16 patients hadhighly elevated SAA (range 50–102�g/mL, mean 66.6 � 4.0 �g/mL).
The following analyses were per-formed on follicular fluids chosen atrandom from the 123-patient group.
SAA concentrations in follicularfluids vs matched bloodsamples
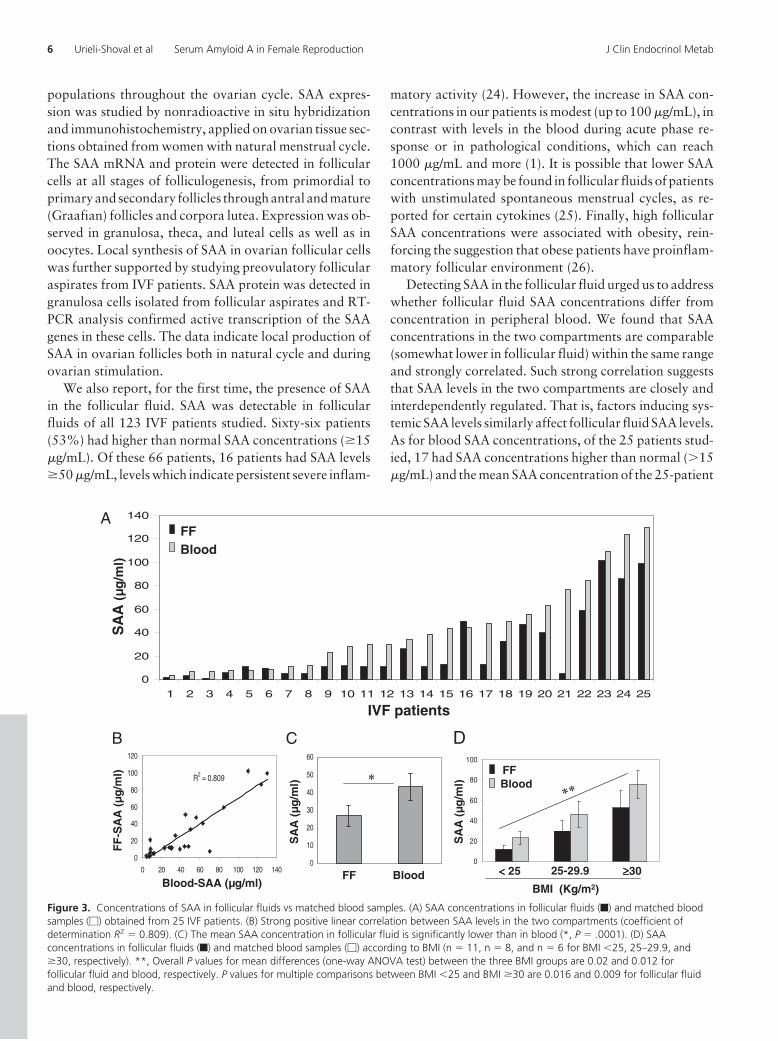
Levels of SAA in follicular fluidsof 25 patients were compared to lev-els in their peripheral blood (col-lected at the time of follicular aspi-ration). SAA levels in bothcompartments varied between pa-tients, ranging between 1 and 102�g/mL for follicular fluid and 4 and130 �g/mL for blood (Figure 3A).Strong positive linear correlation
(coefficient of determination R2 � 0.809) was found be-tween SAA levels in the two compartments (Figure 3B).The mean SAA concentration in follicular fluids was sig-nificantly lower than in blood, 27.4 � 6 �g/mL and 43 �
7.4 �g/mL, respectively (P � .0001) (Figure 3C). We di-vided the 25 patients into three groups according to BMI:�25 (normal weight), 25–29.9 (overweight), and �30(obese) (Figure 3D). Overall P values for mean differencesof SAA concentrations between the three BMI groups were0.02 and 0.012 for follicular fluid and blood, respectively.P values for multiple comparisons between BMI �25 andBMI �30 were 0.016 and 0.009 for follicular fluid andblood, respectively. Significant association between BMIand SAA concentrations was also obtained when similarlyanalyzing follicular fluids of the entire 123 patients (datanot shown).
D
H
A
EB
F IC
Gr
Gr
Th
Th
An
ThGr
Gr
Gr
Gr
Gr
Cu
G
GrL
ThL
FC
Figure 1. In situ hybridization demonstrating SAA mRNA expression in ovarian follicles. Ovariantissue sections were subjected to nonradioactive in situ hybridization. The blue cytoplasmicstaining represents positive SAA mRNA signal, counterstaining is pink-red. (A, B) Primordialfollicles. The single layer of the flattened pregranulosa cells stained for SAA mRNA. Oocytecytoplasm also stained (arrows). (C) Early secondary follicle. The two layers of the cuboidalgranulosa cells stained with light staining of the oocyte cytoplasm. (D) Late secondary follicle. Themultiple layers of granulosa cells stained. The theca cell layers also stained. (E, F) Antral (Graafian)follicles. The granulosa and theca layers stained. Cumulus granulosa stained weakly. Staining isalso evident at the periphery of the oocyte (black arrow). The follicular basal lamina (whitearrows) and the follicular fluid within the antrum did not stain. (G, H) Corpus luteum. Thegranulosa- and theca-lutein cells stained for SAA mRNA while the sprouting capillaries (arrows)did not stain. (I) Corpus albicans. The densely packed collagen fibers did not stain, whileoccasional admixed fibroblasts stained positively. Endothelial cells lining blood vessel (arrow)stained. An, antrum; Cu, cumulus garnulosa; FC, follicular cavity; Gr, granulosa cells; GrL,granulosa lutein cells; Th, theca cells; ThL, theca lutein cells. Original magnifications �100 (D–F),�200 (G, I), �400 (A–C, H).
4 Urieli-Shoval et al Serum Amyloid A in Female Reproduction J Clin Endocrinol Metab
Expression of SAA protein in granulosa cellsGranulosa cells recovered from follicular aspirates of
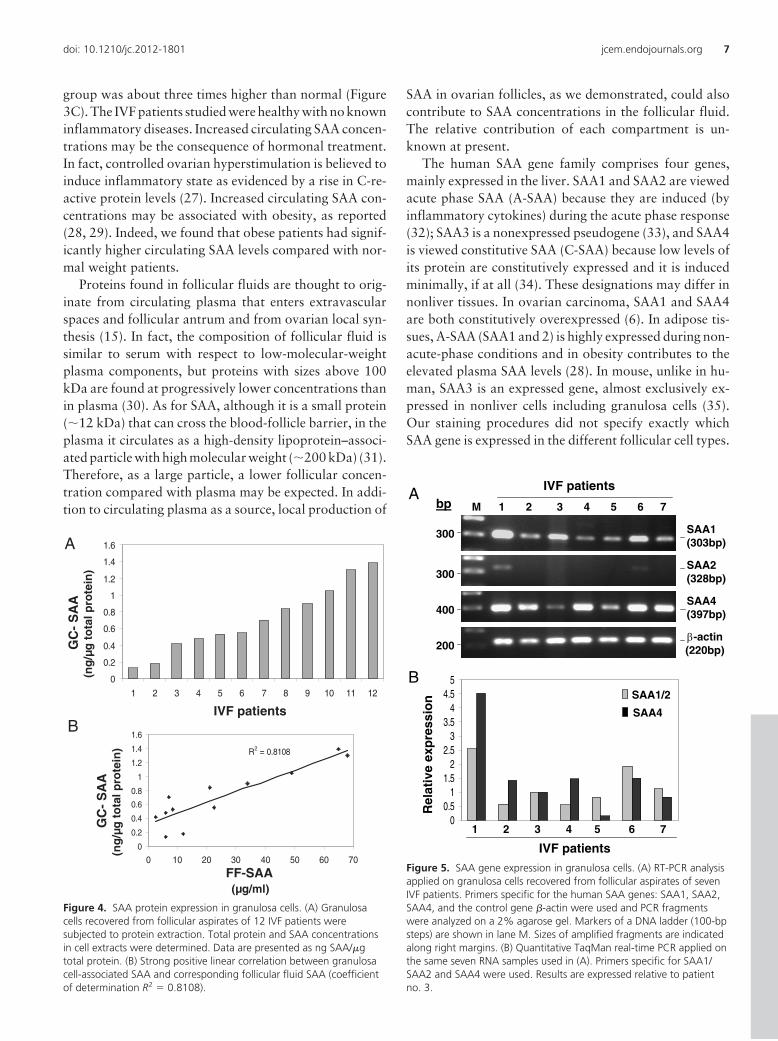
12 patients were subjected to protein extraction and SAAdetermination. The SAA protein concentrations varied be-tween patients ranging from 0.13 to 1.4 ng SAA/�g totalprotein (Figure 4A). Correlation analysis performed be-tween the concentrations of SAA in granulosa cell extractsand in the corresponding follicular fluids revealed strongpositive linear correlation between the two compartments(coefficient of determination R2 � 0.8108) (Figure 4B).
Expression of the SAA genes in granulosa cellsGranulosa cells recovered from follicular aspirates of
an additional seven patients were subjected to RT-PCRusing primers for the human SAA genes: SAA1, SAA2,SAA4, and �-actin, as control. Fragments of predictedsizes were amplified by the SAA1 and SAA4 primers.
When the SAA2 primers were used,fragments were weak to barely de-tectable (Figure 5A). The identity ofthe SAA bands was confirmed by se-quencing in previous studies (5, 6).RNA samples were also subjected toTaqMan quantitative real-timePCR. Primers for SAA1/SAA2 (de-tect SAA1 and 2) and SAA4 wereused (Figure 5B). Together, RT-PCRanalysis revealed expression of theSAA1 and SAA4 genes and minimalexpression of SAA2. Expression in-tensity of the SAA genes varied be-tween patients, consistent with vari-ations seen in SAA proteinexpression.
High follicular fluid SAA levelsare associated with reducedpregnancy rate
To look into a possible link be-tween follicular fluid SAA levels andfertility potential, we initially di-vided the 123 patients into threegroups according to SAA levels: �15�g/mL (normal levels), 15–49�g/mL (slightly elevated levels), and�50 �g/mL (highly elevated levels).Pregnancy rates in the normal andthe slightly elevated SAA groupswere comparable (43% and 42%),yet reduced by about 50% in thehighly elevated SAA group (18.8%).Reproductive outcome parameters,other than pregnancy rate, were
comparable in the three SAA groups (data not shown).Therefore, we continued our analysis by dividing the studycohort into two groups: SAA �50 �g/mL and SAA �50�g/mL (Table 1). Pregnancy rate in the group with SAA�50 �g/mL was 56% lower than in the group with SAA�50 �g/mL (18.8% vs 43%, respectively). In the groupwith SAA �50 �g/mL, patient’s age and BMI were higherand estradiol level on trigger day was lower. Other patientcharacteristics and reproductive parameters were compa-rable in the two SAA groups.
Discussion
We describe, for the first time, the expression of SAA inhuman ovarian follicles and its localization in cell sub-
A
A’
C
C’
D
D’
Gr
Gr Gr
AnGr
Th
B’
B
Gr
E GF
E’ G’F’
Figure 2. Immunohistochemistry demonstrating SAA protein expression in ovarian follicles.Ovarian tissue sections were subjected to immunohistochemical staining with monoclonal anti-SAA antibodies (A–G) or with normal isotype-matched immunoglobulin as control (A=–G=). Thereddish-brown staining represents positive SAA protein signal; counterstaining is light blue. (A, B)Primordial and primary follicles. The single layer of the flattened pregranulosa cells and thecuboidal granulosa cells, respectively, stained for SAA protein. The oocyte cytoplasm (arrows)also stained. (C, D) Secondary follicles. The two layers (early secondary) and the multiple layers(late secondary) of the cuboidal granulosa cells stained. The oocyte cytoplasm (arrows) alsostained. (E) Tertiary (antral) follicle. The granulosa and theca layers stained. Follicular fluid withinthe antrum also stained. (F) Corpus luteum. The granulosa and theca-lutein cells stained.Sprouting capillaries stained light blue, indicating lack of SAA immunostaining. (G) Corpusalbicans. The densely packed collagen fibers stained diffusely. Cells surrounding the collagentissue (arrows) also stained for SAA. These cells were identified as macrophages because theypositively stained for the macrophage- specific marker CD68 (not shown). An, antrum; Gr,granulosa cells; Th, theca cells. Original magnifications �100 (E, E=), �200 (D, D=, G, G=), �400(A, A=–C, C=, F, F=).
doi: 10.1210/jc.2012-1801 jcem.endojournals.org 5
populations throughout the ovarian cycle. SAA expres-sion was studied by nonradioactive in situ hybridizationand immunohistochemistry, applied on ovarian tissue sec-tions obtained from women with natural menstrual cycle.The SAA mRNA and protein were detected in follicularcells at all stages of folliculogenesis, from primordial toprimaryandsecondary follicles throughantral andmature(Graafian) follicles and corpora lutea. Expression was ob-served in granulosa, theca, and luteal cells as well as inoocytes. Local synthesis of SAA in ovarian follicular cellswas further supported by studying preovulatory follicularaspirates from IVF patients. SAA protein was detected ingranulosa cells isolated from follicular aspirates and RT-PCR analysis confirmed active transcription of the SAAgenes in these cells. The data indicate local production ofSAA in ovarian follicles both in natural cycle and duringovarian stimulation.
We also report, for the first time, the presence of SAAin the follicular fluid. SAA was detectable in follicularfluids of all 123 IVF patients studied. Sixty-six patients(53%) had higher than normal SAA concentrations (�15�g/mL). Of these 66 patients, 16 patients had SAA levels�50 �g/mL, levels which indicate persistent severe inflam-
matory activity (24). However, the increase in SAA con-centrations in our patients is modest (up to 100 �g/mL), incontrast with levels in the blood during acute phase re-sponse or in pathological conditions, which can reach1000 �g/mL and more (1). It is possible that lower SAAconcentrations may be found in follicular fluids of patientswith unstimulated spontaneous menstrual cycles, as re-ported for certain cytokines (25). Finally, high follicularSAA concentrations were associated with obesity, rein-forcing the suggestion that obese patients have proinflam-matory follicular environment (26).
Detecting SAA in the follicular fluid urged us to addresswhether follicular fluid SAA concentrations differ fromconcentration in peripheral blood. We found that SAAconcentrations in the two compartments are comparable(somewhat lower in follicular fluid) within the same rangeand strongly correlated. Such strong correlation suggeststhat SAA levels in the two compartments are closely andinterdependently regulated. That is, factors inducing sys-temic SAA levels similarly affect follicular fluid SAA levels.As for blood SAA concentrations, of the 25 patients stud-ied, 17 had SAA concentrations higher than normal (�15�g/mL) and the mean SAA concentration of the 25-patient
0
10
20
30
40
50
60
0
20
40
60
80
IVF patients
FF
-SA
A (
µg/m
l)
SA
A (
µg/m
l)
FF Blood
A
SA
A (
µg/m
l)
B C D
0
20
40
60
80
100
120
140
1 2 3 4 5 6 7 8 9 10 11 12 13 14 15 16 17 18 19 20 21 22 23 24 25
Blood FF
SA
A (µ
g/m
l)
BMI (Kg/m2)Blood-SAA (µg/ml)
0
20
40
60
80
100
Blood FF
25 25-29.9 30
R2 = 0.809
0
20
40
60
80
100
120
0 20 40 60 80 100 120 140
Figure 3. Concentrations of SAA in follicular fluids vs matched blood samples. (A) SAA concentrations in follicular fluids (f) and matched bloodsamples (�) obtained from 25 IVF patients. (B) Strong positive linear correlation between SAA levels in the two compartments (coefficient ofdetermination R2 � 0.809). (C) The mean SAA concentration in follicular fluid is significantly lower than in blood (*, P � .0001). (D) SAAconcentrations in follicular fluids (f) and matched blood samples (�) according to BMI (n � 11, n � 8, and n � 6 for BMI �25, 25–29.9, and�30, respectively). **, Overall P values for mean differences (one-way ANOVA test) between the three BMI groups are 0.02 and 0.012 forfollicular fluid and blood, respectively. P values for multiple comparisons between BMI �25 and BMI �30 are 0.016 and 0.009 for follicular fluidand blood, respectively.
6 Urieli-Shoval et al Serum Amyloid A in Female Reproduction J Clin Endocrinol Metab
group was about three times higher than normal (Figure3C). The IVF patients studied were healthy with no knowninflammatory diseases. Increased circulating SAA concen-trations may be the consequence of hormonal treatment.In fact, controlled ovarian hyperstimulation is believed toinduce inflammatory state as evidenced by a rise in C-re-active protein levels (27). Increased circulating SAA con-centrations may be associated with obesity, as reported(28, 29). Indeed, we found that obese patients had signif-icantly higher circulating SAA levels compared with nor-mal weight patients.
Proteins found in follicular fluids are thought to orig-inate from circulating plasma that enters extravascularspaces and follicular antrum and from ovarian local syn-thesis (15). In fact, the composition of follicular fluid issimilar to serum with respect to low-molecular-weightplasma components, but proteins with sizes above 100kDa are found at progressively lower concentrations thanin plasma (30). As for SAA, although it is a small protein(�12 kDa) that can cross the blood-follicle barrier, in theplasma it circulates as a high-density lipoprotein–associ-ated particle with high molecular weight (�200 kDa) (31).Therefore, as a large particle, a lower follicular concen-tration compared with plasma may be expected. In addi-tion to circulating plasma as a source, local production of
SAA in ovarian follicles, as we demonstrated, could alsocontribute to SAA concentrations in the follicular fluid.The relative contribution of each compartment is un-known at present.
The human SAA gene family comprises four genes,mainly expressed in the liver. SAA1 and SAA2 are viewedacute phase SAA (A-SAA) because they are induced (byinflammatory cytokines) during the acute phase response(32); SAA3 is a nonexpressed pseudogene (33), and SAA4is viewed constitutive SAA (C-SAA) because low levels ofits protein are constitutively expressed and it is inducedminimally, if at all (34). These designations may differ innonliver tissues. In ovarian carcinoma, SAA1 and SAA4are both constitutively overexpressed (6). In adipose tis-sues, A-SAA (SAA1 and 2) is highly expressed during non-acute-phase conditions and in obesity contributes to theelevated plasma SAA levels (28). In mouse, unlike in hu-man, SAA3 is an expressed gene, almost exclusively ex-pressed in nonliver cells including granulosa cells (35).Our staining procedures did not specify exactly whichSAA gene is expressed in the different follicular cell types.
0
0.2
0.4
0.6
0.8
1
1.2
1.4
1.6
1 2 3 4 5 6 7 8 9 10 11 12
R2 = 0.8108
0
0.2
0.4
0.6
0.8
1
1.2
1.4
1.6
0 10 20 30 40 50 60 70
GC
-S
AA
(n
g/µ
gto
tal p
rote
in)
IVF patients
FF-SAA(µg/ml)
GC
-S
AA
(n
g/µ
gto
tal p
rote
in)
A
B
Figure 4. SAA protein expression in granulosa cells. (A) Granulosacells recovered from follicular aspirates of 12 IVF patients weresubjected to protein extraction. Total protein and SAA concentrationsin cell extracts were determined. Data are presented as ng SAA/�gtotal protein. (B) Strong positive linear correlation between granulosacell-associated SAA and corresponding follicular fluid SAA (coefficientof determination R2 � 0.8108).
A
B
Rel
ativ
e ex
pre
ssio
n
IVF patients
bp M
SAA4(397bp)
SAA1(303bp)
1 2 3
IVF patients
300
300
400
SAA2(328bp)
00.5
11.5
22.5
33.5
44.5
5
β-actin(220bp) 200
4 5 6 7
SAA4
SAA1/2
7654321
Figure 5. SAA gene expression in granulosa cells. (A) RT-PCR analysisapplied on granulosa cells recovered from follicular aspirates of sevenIVF patients. Primers specific for the human SAA genes: SAA1, SAA2,SAA4, and the control gene �-actin were used and PCR fragmentswere analyzed on a 2% agarose gel. Markers of a DNA ladder (100-bpsteps) are shown in lane M. Sizes of amplified fragments are indicatedalong right margins. (B) Quantitative TaqMan real-time PCR applied onthe same seven RNA samples used in (A). Primers specific for SAA1/SAA2 and SAA4 were used. Results are expressed relative to patientno. 3.
doi: 10.1210/jc.2012-1801 jcem.endojournals.org 7
However, expression of SAA1, SAA4, and low expressionof SAA2 in granulosa cells (Figure 5) and in other nonlivercells, aortic smooth muscle cells (4), monocyte/macro-phage cells (36), and ovarian cancer cells (6) suggest thisexpression pattern in all follicular cells. The ELISA weused detected the A-SAA proteins (SAA1 and SAA2).SAA1 is the predominant A-SAA in plasma. Because pro-teins in follicular fluid originate from plasma and fromgranulosa cells (15) and granulosa cells had minimal ex-pression of SAA2, SAA1 is likely the predominant A-SAAalso in follicular fluid. The levels of SAA4 protein have notbeen determined.
The role of SAA expressed in ovarian follicles is un-known at present. Considering the functions ascribed toSAA (mostly to SAA1) in other systems, it may affect in anautocrine and/or paracrine manner different aspects offollicular development. For example, SAA may enhanceleukocyte recruitment, cytokine production, cell prolifer-ation, and angiogenesis (7, 10–12), processes taking placeduring follicular growth and corpus luteum formation. Itmay enhance activity of matrix-degrading enzymes (8, 9),thereby enhancing the degradation and remodeling of fol-licular basal lamina and the extracellular matrix sur-rounding the follicle during follicular growth and rupture.It may have an effect on cell apoptosis (37), thus affectingfollicular atresia and postovulatory regression. It maymodulate cholesterol metabolism and transport (1),thereby influencing ovarian steroidogenesis and luteiniza-tion. Last, SAA expressed in oocytes may act as a paracrinefactor regulating the development of surrounding somaticcells, as suggested for other oocyte-derived factors (38).
Is there a link between follicular fluid SAA concentra-tion and fertility potential? We found that IVF patientswith high SAA levels (�50 �g/mL) have 56% reduction inpregnancy rate compared with patients with normal orslightly elevated SAA levels (�50 �g/mL). This differencewas nearly significant (P � .06 two-sided �2 test; one-sidedP � .03), probably due to the limited number of samples.SAA has been suggested as an inflammatory adipokinelinking between increased adipose tissue mass, low-gradeinflammation, and obesity-related metabolic complica-tions (28). Hence, SAA may take part in the known asso-ciation between obesity and infertility (39). However,obesity is not the only factor negatively affecting preg-nancy rate in patients with high SAA as only 6 of the 16patients (37.5%) were obese. Thus, SAA as an inflamma-tory mediator may decrease fertility potential independentof body weight. Older age may also contribute to lowerpregnancy rate, yet in patients with high SAA only 6 of the16 patients (37.5%) were over 40 years old, and the age byitself could not account for the reduced pregnancy rate.Because high follicular SAA levels correlated with high
blood SAA levels (Figure 3B), others factors such as de-fective endometrial receptivity may contribute to lowerpregnancy rate. Our findings that in patients with highSAA pregnancy rate was impaired but other reproductiveparameters were not affected (Table 1) point to a possiblealteration in the uterine environment in this cohort. Takentogether, it is conceivable that patients with high SAAlevels are exposed to inflammatory conditions that impedetheir pregnancy outcome. Concurring with this sugges-tion, another inflammatory indicator, C-reactive protein,was found at higher levels in IVF patients who failed toconceive (40).
In conclusion, our data indicate that SAA is locally pro-duced in ovarian follicles and is a component of follicularfluids. Elevated follicular SAA levels were associated withobesity and reduced pregnancy rate. Although our dataneed further validation in future studies, they support thehypothesis that SAA plays a role within the follicular en-vironment and may serve as a marker whose elevated lev-els signify poorer reproductive potential.
Acknowledgments
We thank Mrs Eliana Ein-Mor for her assistance with the sta-tistical analysis and Dr Iris Eisenberg for her assistance withreal-time PCR. We also thank Dr Rick.L Meek (the Heart Insti-tute of Spokane) for the p125 probe.
Address all correspondence and requests for reprints to: Sim-cha Urieli-Shoval, Hematology Unit, Hadassah-Hebrew Univer-sity Medical Center, Mount Scopus, Jerusalem 91240, Israel.E-mail: [email protected].
This work was supported by the Israel Science Foundation(no. 686/00–1) and the Israel Cancer Association.
Disclosure Summary: The authors have nothing to disclose.
References
1. Urieli-Shoval S, Linke RP, Matzner Y. Expression and function ofserum amyloid A, a major acute phase protein, in normal and diseasestates. Curr Opin Hematol. 2000;7:64–69.
2. Urieli-Shoval S, Cohen P, Eisenberg S, Matzner Y. Widespread ex-pression of serum amyoid A in histologically normal human tissues.Predominant localization to the epithelium. J Histochem Cytochem.1998;46:1377–1384.
3. Sjöholm K, Palming J, Olofsson LE, et al. A microarray search forgenes predominantly expressed in human omental adipocytes: adi-pose tissue as a major production site of serum amyloid A. J ClinEndocrinol Metab. 2005;90:2233–2239.
4. Meek RL, Urieli-Shoval S, Benditt EP. Expression of apolipoproteinserum amyloid A mRNA in human atherosclerotic lesions and cul-tured vascular cells: Implications for serum amyloid A function. ProcNatl Acad Sci USA. 1994;91:3186–3190.
5. Gutfeld O, Prus D, Ackerman Z, et al. Expression of serum amyloidA, in normal, dysplastic, and neoplastic human colonic mucosa:
8 Urieli-Shoval et al Serum Amyloid A in Female Reproduction J Clin Endocrinol Metab
implication for a role in colonic tumorigenesis. J Histochem Cy-tochem. 2006;54:63–73.
6. Urieli-Shoval S, Finci-Yeheskel Z, Dishon S, et al. Expression ofserum amyloid A in human ovarian epithelial tumors: implicationfor a role in ovarian tumorigenesis. J Histochem Cytochem. 2010;58:1015–1023.
7. Badolato R, Wang JM, Murphy WJ, et al. Serum amyloid A is achemoattractant: induction of migration, adhesion, and tissue infil-tration of monocytes and polymorphonuclear leukocytes. J ExpMed. 1994;180:203–209.
8. Migita K, Kawabe Y, Tominaga M, Origuchi T, Aoyagi T, EguchiK. Serum amyloid A protein induces production of matrix metallo-proteinases by human synovial fibroblasts. Lab Invest. 1998;78:535–539.
9. Michaeli A, Finci Yeheskel D, Dishon S, Linke RP, Levin M, Urieli-Shoval S. Serum amyloid A enhances plasminogen activation: im-plication for a role in colon cancer. Biochem Biophys Res Commun.2008;368:368–373.
10. Furlaneto CJ, Campa A. A novel function of serum amyloid A: apotent stimulus for the release of tumor necrosis factor-�, interleu-kin-1�, and interleukin-8 by human blood neutrophil. Biochem Bio-phys Res Commun. 2000;268:405–408.
11. Koga T, Torigoshi T, Motokawa S, et al. Serum amyloid A-inducedIL-6 production by rheumatoid synoviocytes. FEBS Lett. 2008;582:579–585.
12. Mullan RH, Bresnihan B, Golden-Mason L, et al. Acute-phase se-rum amyloid A stimulation of angiogenesis, leukocyte recruitmentand matrix degradation in rheumatoid arthritis through an NF-�B-dependent signal transduction pathway. Arthritis Rheum. 2006;54:105–114.
13. Espey LL. Current status of the hypothesis that mammalian ovula-tion is comparable to an inflammatory reaction. Biol Reprod. 1994;50:233–238.
14. Sirotkin AV. Cytokines: signalling molecules controlling ovarianfunctions. Int J Biochem Cell Biol. 2011;43:857–861.
15. Revelli A, Delle Piane L, Casano S, Molinari E, Massobrio M,Rinaudo P. Follicular fluid content and oocyte quality: from singlebiochemical markers to metabolomics. Reprod Biol Endocrinol.2009;7:40.
16. Bedaiwy M, Shahin AY, AbulHassan AM, et al. Differential expres-sion of follicular fluid cytokines: relationship to subsequent preg-nancy in IVF cycles. Reprod Biomed Online. 2007;15:321–325.
17. Sarapik A, Velthut A, Haller-Kikkatalo K, et al. Follicular proin-flammatory cytokines and chemokines as markers of IVF success.Clin Dev Immunol. 2012;2012:606459.
18. Hurwitz A, Lavy Y, Finci-Yeheskel Z, et al. Interleukin-1-mediatedstimulation of prostaglandin E production is without effect on plas-minogen activator activity in human granulosa lutein cell cultures.J Clin Endocrinol Metab. 1995;80:3018–3024.
19. Haimov-Kochman R, Ravhon A, Prus D, et al. Expression and reg-ulation of Sprouty-2 in the granulosa-lutein cells of the corpus lu-teum. Mol Hum Reprod. 2005;11:537–542.
20. Linke RP. Monoclonal antibodies against amyloid fibril protein AA.Production, specificity, and use for immunohistochemical localiza-tion and classification of AA-type amyloidosis. J Histochem Cy-tochem. 1984;32:322–328.
21. Urieli-Shoval S, Shubinsky G, Linke RP, Fridkin M, Tabi I, Matzner
Y. Adhesion of human platelets to serum amyloid A. Blood. 2002;99:1224–1229.
22. Livak KJ, Schmittgen TD. Analysis of relative gene expression datausing real-time quantitative PCR and the 2(-Delta Delta C(T))method. Methods. 2001;25:402–408.
23. Gougeon A. The early stages of follicular growth. In: Trounson AO,Gosden RG, eds. Biology and Pathology of the Oocyte. CambridgeUniversity Press; 2003;29–43.
24. Gillmore JD, Lovat LB, Persey MR, Pepys MB, Hawkins PN. Am-yloid load and clinical outcome in AA amyloidosis in relation tocirculating concentration of serum amyloid A protein. Lancet. 2001;358:24–29.
25. Vujisic S, Lepej SZ, Emedi I, Bauman R, Remenar A, Tiljak MK.Ovarian follicular concentration of IL-12, IL-15, IL-18 and p40subunit of IL-12 and IL-23. Hum Reprod. 2006;21:2650–2655.
26. Robker RL, Akison LK, Bennett BD, et al. Obese women exhibitdifferences in ovarian metabolites, hormones, and gene expressioncompared with moderate-weight women. J Clin Endocrinol Metab.2009;94:1533–1540.
27. Orvieto R. Controlled ovarian hyperstimulation—an inflammatorystate. J Soc Gynecol Investig. 2004;11:424–426.
28. Yang RZ, Lee MJ, Hu H, et al. Acute-phase serum amyloid A: aninflammatory adipokine and potential link between obesity and itsmetabolic complications. Plos Med. 2006;3:884–892.
29. Zhao Y, He X, Shi X, et al. Association between serum amyloid Aand obesity: a meta-analysis and systematic review. Inflamm Res.2010;59:323–334.
30. Rodgers RJ, Irving-Rodgers HF. Formation of the ovarian follicularantrum and follicular fluid. Biol Reprod. 2010;82:1021–1029.
31. Benditt EP, Eriksen N. Amyloid protein SAA is associated with highdensity lipoprotein from human serum. Proc Natl Acad Sci U S A.1977;74:4025–4028.
32. Uhlar CM, Burgess CJ, Sharp PM, Whitehead AS. Evolution of theserum amyloid A (SAA) protein superfamily. Genomics. 1994;19:228–235.
33. Kluve-Beckerman B, Drumm ML, Benson MD. Nonexpression ofthe human serum amyloid A three (SAA3) gene. DNA Cell Biol.1991;10:651–661.
34. Whitehead AS, de Beer MC, Steel DM, et al. Identification of novelmembers of the serum amyloid A protein superfamily as constitutiveapolipoproteins of high density lipoprotein. J Biol Chem. 1992;267:3862–3867.
35. Son DS, Roby KF, Terranova PF. Tumor necrosis factor-� inducesserum amyloid A3 in mouse granulosa Cells. Endocrinology. 2004;145:2245–2252.
36. Urieli-Shoval S, Meek RL, Hanson RH, Eriksen N, Benditt EP. Hu-man serum amyloid A genes are expressed in monocyte/macrophagecell lines. Am J Pathol. 1994;145:650–660.
37. Jo SH, Yun J, Kim JM, Lee C, Baek SH, Bae YS. Serum amyloid Ainduces WISH cell apoptosis. Acta Pharmacol Sin. 2007;28:73–80.
38. Eppig JJ. Oocyte control of ovarian follicular development and func-tion in mammals. Reproduction. 2001;122:829–838.
39. Brewer CJ, Balen AH. The adverse effects of obesity on conceptionand implantation. Reproduction. 2010;140:347–364.
40. Levin I, Gamzu R, Mashiach R, Lessing JB, Amit A, Almog B.Higher C-reactive protein levels during IVF stimulation are associ-ated with ART failure. J Reprod Immunol. 2007;75:141–144.
doi: 10.1210/jc.2012-1801 jcem.endojournals.org 9


![The regulation of ovarian follicular growth by anti ...fa.jmor.jp/pdf/35/1/035010013.pdf · ovarian syndrome (PCOS) patients and in the diagnosis of ovarian failure [23–25]. As](https://img.pdfslide.net/doc/110x75/5e6803a2bdc24c51c937f140/the-regulation-of-ovarian-follicular-growth-by-anti-fajmorjppdf351-ovarian.jpg)


![Role of herbals in the management of polycystic ovarian ...PCOS by acting directly on ovarian androgen secretion andabnormal follicular development [5] and the use of insulin-sensitizing](https://img.pdfslide.net/doc/110x75/5ed75feda5b1445fe467ce70/role-of-herbals-in-the-management-of-polycystic-ovarian-pcos-by-acting-directly.jpg)