Embed Size (px)
Citation preview
475
Veterinarni Medicina, 61, 2016 (9): 475–496 Review Article
doi: 10.17221/19/2016-VETMED
Serum proteins and their diagnostic utility in veterinary medicine: a review
C. Tothova, O. Nagy, G. Kovac
University of Veterinary Medicine and Pharmacy, Kosice, Slovak Republic
ABSTRACT: The evaluation of serum proteins and their electrophoretic pattern is a well-established laboratory method in the diagnosis of many diseases in humans, which has replaced the biochemical determination of the concentrations of albumin and the ratio of albumin to globulins. The measurement of serum proteins may be an important diagnostic tool for the detection, diagnosis, and monitoring of various diseases and pathological processes. The results of serum protein electrophoresis can be one of the most useful diagnostic aids in a wide spectrum of diseases, including infectious and inflammatory diseases, renal or gastrointestinal disorders, immunodeficiency states, as well as paraproteinaemias caused by lymphoid or plasma cell neoplasia. Although many studies have been carried out to determine the usefulness of the determination of serum proteins and their electrophoretic pattern in various disease conditions and disorders also in animals, serum protein evaluation is still a relatively little-used diagnostic tool in veterinary medicine. In this article, methods of serum protein determination, their diagnostic utility in animal care practice and their different patterns in dysproteinaemias and paraproteinaemias are reviewed.
Keywords: animals; serum proteins; electrophoresis; diagnosis; dysproteinaemia; paraproteinaemia
Contents
1. Serum proteins – introduction2. Analysis of serum proteins
2.1. Total protein2.2. Protein fractionation
2.2.1. Albumin and globulins2.2.2. The globulin fractions
2.3. Analysis of specific serum proteins3. Normal serum protein pattern
3.1. Prealbumin (transthyretin)3.2. Albumin3.3. Globulins
3.3.1. The α-globulins3.3.2. The β-globulins3.3.3. The γ-globulins
4. Serum protein pattern variations related to non-pathological conditions
5. Pathological serum protein patterns5.1. Albumin5.2. Globulins
6. The usefulness of serum protein electrophoresis in clinical practice
7. Conclusions8. References
Supported by the Scientific Grant Agency of the Ministry of Education of the SR (Grants No. 1/0447/14 and 1/0154/15).
1. Serum proteins – introduction
Proteins, macromolecules built from one or more unbranched chains of amino acids linked by peptide bonds, are the major components of the blood se-rum or plasma and have many different functions. Most serum proteins are biochemically not pure,
since they are combined with other substances, for example, they can be conjugated to carbohydrate and be present in the circulation as glycoproteins (Stockham and Scott 2002). The chemical proper-ties of the amino acids determine the biological activity of the protein (Tymchak 2010). Proteins are involved in almost all of the reactions occur-

476
Review Article Veterinarni Medicina, 61, 2016 (9): 475–496
doi: 10.17221/19/2016-VETMED
ring in the organism, including the maintenance of colloid osmotic structure, catalysis of biochemical reactions and buffering acid-base balance. Some of them act as carriers of lipids, hormones, vita-mins and minerals in the circulatory system, and are involved in the regulation of cellular activity and the immune system (Anderson and Anderson 2002). Other blood proteins play important roles as enzymes, complement components or protease inhibitors. Certain blood proteins are essential for haemostasis and have important functions in plate-let adhesion and aggregation, as well as coagulation (Meyer and Harvey 2004).
Almost all serum proteins are produced and se-creted by hepatocytes. The major exceptions are the immunoglobulins that are produced by the immune system consisting of the reticuloendothelial tissues, lymphoid and plasma cells (Eckersall 2008). Further studies have shown that non-hepatic tissues, includ-ing the intestine, lung, adipose tissue and mammary gland, also have the capability of synthesising some serum proteins for specific functions (Friedrichs et al. 1995; Vreugdenhil et al. 1999).
Wrotnowski (1998) estimated that up to 10 000 pro-teins may commonly be found in blood serum. The more heavily represented serum proteins include albumin, immunoglobulins, haptoglobin, transfer-rin and lipoproteins, and they are found in con-centrations that can be measured in g/ml (Burtis and Ashwood 2001). In addition to these major constituents, blood serum also contains many other proteins that are secreted by cells and tissues at very low concentrations (measured in ng/ml or pg/ml) and in veterinary clinical biochemistry are rela-tively understudied (Kennedy 2001; Schrader and Schulz-Knappe 2001). Protein concentrations in serum are tightly controlled to balance their physi-ological functions in areas of immunity, coagula-tion, small molecule transport and inflammation. Any dysfunction or loss of balance in the concen-trations of serum proteins can cause or result from disease processes (Pieper et al. 2003).
2. Analysis of serum proteins
2.1. Total protein
The determination of the concentrations of serum proteins and the evaluation of their changes during the disease process is fundamental for their use as
valid biomarkers (Okutucu et al. 2007). The quan-tification of the total serum protein concentration represents a basic step in general biochemistry and routine clinical laboratory practice. Several meth-ods have been developed for the determination of total protein in serum or plasma, which are based on different analytical methods (Zaia et al. 1998). Chemical, as well as physical methods are avail-able to measure total protein in biological fluids. In clinical biochemistry, chemical methodologies are more frequently used because of the possibility to adapt these techniques to automated analysers (Eckersall 2008).
The biuret assay is one of the oldest and most widely used assays for the determination of total protein concentrations. It is based on a colorimetric (spectrophotometric) technique, in which protein forms a violet-coloured polypeptide chelated with cupric ion, in strong alkaline solution (Gornall et al. 1949; Boyer 2000). However, this method is not sensitive enough to measure lower protein con-centrations found, for example, in cerebrospinal fluid (Switzer and Garrity 1999). Despite this dis-advantage, the biuret assay is still frequently used because of its simple analytical procedure and the easy preparation of reagents. Further, compared with other copper-based assays this method is less susceptible to chemical interference (Gupta and Stockham 2014). Moreover, many of the assay kits developed for automated use in wet biochemical analysers, as well as dry chemistry analysers, are based on this principle. The technique is very cheap and this has also contributed to its broad applica-tion in veterinary medicine.
The biuret method was modified by using the folin-phenol reagent (Folin-Ciocalteau), which is more sensitive and thus more appropriate to meas-ure low concentrations of proteins (Lowry et al. 1951). In this method, the phenolic groups of ty-rosine and tryptophan in proteins react with the Folin-Ciocalteau reagent producing a blue-purple coloured complex (Wilson and Walker 2000). The disadvantages of the Lowry method are the sensi-tivity to the amino acid composition of the protein and interference by a range of substances, includ-ing buffers, drugs, and nucleic acids (Sapan et al. 1999). Another method for the determination of protein concentrations is the Bradford assay, which is based on the binding of the Coomassie brilliant blue dye to the proteins in an acidic solution to form a complex with increased molar absorbance

477
Veterinarni Medicina, 61, 2016 (9): 475–496 Review Article
doi: 10.17221/19/2016-VETMED
(Bradford 1976). This assay is rapid, practical and suitable for simple quantification of proteins in cell lysates, cellular fractions, and recombinant protein samples (Ernst and Zor 2010). It may be performed also in microtitre plates using micro volumes, but its application area is mainly restricted to research laboratories (Da Silva and Zezzi Arruda 2006). Unfortunately, the Bradford assay is only linear over a short range (to 2000 µg/ml) and shows a curva-ture over this range of protein concentration, which necessitates the dilution of samples before further analysis (Zor and Selinger 1996; Zaia et al. 2005).
Physical methods are also available to measure the protein concentration in serum or plasma. Many veterinary practicers use refractometry for rapid determination of protein concentrations in plasma or other biological fluids. In general, the refractometer measures the degree to which light bends as it passes through the interface between two substances of different densities (George and O’Neill 2001). The angle of refraction changes proportionally to the concentration of solute in solution. Protein is the most important solute dis-solved in serum; thus, the refractive index reflects the concentration of proteins in the sample (George 2001). Results obtained from human serum samples showed a good correlation between refractometry and the biuret method (Lien and Wang 1995), but the results for veterinary samples are less consist-ent. Indeed, whereas some authors have reported a good correlation of results for domestic mam-mals (biuret methods vs refractometry), others showed either higher or lower values for refrac-tometry compared to the biuret method (Green et al. 1982; Thomas and Brown 1992). The differences between the methods were of magnitudes of 6 g/l and 2 g/l in dogs and cats, respectively (George and O’Neill 2001). However, the most marked differ-ences between the biuret and refractometric meth-ods were observed in avian samples (George 2001). These variations may be caused by differences in the design of various refractometers assigned by the manufacturers, variation in the biuret reagent mixture, as well as assay conditions (Doumas et al. 1981).
2.2. Protein fractionation
For identification and quantification of individual serum proteins or groups of proteins, the proteins in
the serum or plasma must either be separated or the individual proteins must be measured independent-ly. Fractionation technologies are among the most important steps in protein analysis, as well as in the discovery of new biomarkers in veterinary medicine. The currently available separation technologies do not allow the analysis of whole protein complexes in a simple step because of the large number of proteins present in serum (Ahmed 2009).
2.2.1. Albumin and globulins
The primary separation of the serum proteins divides complex mixtures into albumin and globu-lins. Several fractionation techniques have been developed to separate and consequently quantify the proteins in serum (Issaq et al. 2002). Most of them depend on the initial determination of total serum proteins, and then the concentrations of the main fractions are calculated according to the used method. For example, when either the albumin or globulins are determined, the other can be calcu-lated by the subtraction from the total protein con-centration (Eckersall 2008). A number of methods have been developed to measure the concentration of globulins. One of these techniques is based on the precipitation of globulins using solutions of metal salts, e.g. sodium sulphite or zinc sulphate (McEwan et al. 1970; Pfeiffer and McGuire 1977). The addition of salts causes turbidity, which may be visually evaluated or measured using a spectro-photometer as units of turbidity. This method may be used as a field test for the evaluation of suck-ling efficiency or failure of passive transfer of ma-ternal immunity via colostrum in calves and foals (Sedlinska et al. 2005; Hogan et al. 2015). Currently, the bromcresol green (BCG) and bromcresol pur-ple methods are the basis for the determination of serum albumin (Watanabe et al. 2004). Bromcresol green binds quantitatively with albumin forming an intense blue-green complex, and the intensity of the colour produced is directly proportional to the albumin concentration in the sample (Kessler et al. 1997). This method is easy to perform, rapid, and cheap, but less sensitive and selective compared to immunoassays (Doumas and Peters 1997). The reaction between serum and BCG is not specific for albumin; therefore, the BCG method often overestimates the concentrations of serum albu-min. However, its specificity can be improved by

478
Review Article Veterinarni Medicina, 61, 2016 (9): 475–496
doi: 10.17221/19/2016-VETMED
minimising the contact time with the serum sample (Brackeen et al. 1989).
2.2.2. The globulin fractions
The globulins can be subdivided into fractions (α-, β-, and γ-globulins) by electrophoresis, which also allows the quantitative estimation of each frac-tion from the total protein concentration by pro-portion. Electrophoresis is the current standard and most widely used fractionation technique for serum proteins in clinical biochemistry and mo-lecular biology (O’Connell et al. 2005). It is based on the movement of charged particles through a support medium soaked in a solution when subject-ed to an electrical field (Azim et al. 2004). Serum proteins have a negative charge, so in the electro-phoretic chamber they migrate toward the positive pole in an electrical field and are separated from each other into different bands according to their sizes (Esmaeilnejad et al. 2014). After separation, the protein fractions are fixed in an acid solution to denature the proteins and immobilise them on the support medium (Tymchak 2010). The proteins are then stained and their quality/quantity is measured by the electrophoretic system which also provides their graphical distribution (Vavricka et al. 2009).
The separation of proteins in an electric field was in-troduced by Tiselius in the 1930s (Tiselius 1937). The application of serum protein electrophoresis in clini-cal biochemistry laboratories started in 1950s using paper strips (Turba and Enenkel 1950), which were replaced a few years later by microporous acetate membranes (Kohn 1957). In the 1970s, agarose gel as a support medium was introduced for the electropho-retic separation of proteins (Lehmann et al. 1997), and became the most commonly used supporting sub-stance in veterinary medicine. A major difference be-tween the aforementioned electrophoretic methods is the material of support used for the protein fractiona-tion. According to Luraschi et al. (2003), the protein patterns and the numbers of peaks are dependent on the material used for support, i.e. cellulose acetate vs agarose gel electrophoresis. Standard agarose gel elec-trophoresis is a labour-intensive method. However, the introduction of pre-packaged gels and the devel-opment of new equipment has allowed the automa-tization of this procedure (Karcher and Nuttall 2001; Ceron et al. 2010). Moreover, it has several advantages compared to cellulose acetate. Indeed, agarose gel as
a support medium provides better resolution, higher reproducibility of results and greater clarity of the electrophoretic bands (Riond et al. 2009).
In past few years, capillary zone electrophoresis (CZE) is being used also in veterinary laboratories (Crivellente et al. 2008). In CZE, separation of protein fractions occurs in a free liquid medium created by the low viscosity buffer, in which the high voltage applied generates an electro-osmotic flow that forc-es the proteins to rapidly move toward the cathode (Giordano and Paltrinieri 2010). This allows better separation of proteins with similar physicochemical characteristics, thus generating multiple sub-peaks or narrower peaks (Petersen et al. 2003). The higher resolution of CZE can often result in abnormal elec-trophoretic profiles caused by the aforementioned multiple sub-peaks of unknown significance, which is the disadvantage of this method.
Electrophoresis is normally used for serum sam-ples, but plasma or other body fluids (urine, cerebro-spinal fluid) may also be processed. Serum is the best material for protein electrophoresis, as it does not contain fibrinogen. Fibrinogen migrates between the β and γ regions on the electrophoretogram, and can influence the correct separation and identification of these fractions (Rossi et al. 2008). Thus, electro-phoretic analysis of plasma may provide inaccurate results unless plasma is defibrinated (Errico et al. 2012). On the other hand, in routine practice plasma is often the only sample available, especially in birds and reptiles, in which only small blood specimens can be collected from sick animals (Briscoe et al. 2010). According to Errico et al. (2012), electropho-retic analysis of native plasma provides the same diagnostic information as analysis of serum, except for possible overestimation of the β-globulin frac-tion. Electrophoretic techniques may also be used for the analysis of urinary proteins, which is a fun-damental step in the early diagnosis and subsequent monitoring of renal diseases (Giori et al. 2011). It was found that polyacrylamide gel electrophoresis may localise the origin of urinary proteins based on their molecular weight, providing a diagnostic sensitivity comparable to results obtained by kidney biopsy (Brown et al. 2010). It is considered a very sensitive method to discriminate between glomeru-lar, tubular, or mixed proteinuria (Zini et al. 2004). Agarose gel electrophoresis may be applicable also to separate the main protein fractions in cerebro-spinal fluid (CSF) samples. Evaluation of proteins in CSF may provide important information about the

479
Veterinarni Medicina, 61, 2016 (9): 475–496 Review Article
doi: 10.17221/19/2016-VETMED
production of immunoglobulins within the central nervous system, as well as possible disturbances in the blood-brain barrier (Chrisman 1992). However, because of the small amount of proteins in CSF com-pared with serum, prior concentration of the proteins is necessary to increase the sensitivity of CSF protein detection by electrophoresis (Gama et al. 2007).
2.3. Analysis of specific serum proteins
Recently, high resolution electrophoresis, two-dimensional electrophoresis and proteomic tech-niques were developed for the separation of proteins. These techniques may be used to simultaneously identify hundreds of proteins and localise specific proteins within several subfractions, whereas aga-rose gel electrophoresis can separate serum proteins only into five or six fractions (Eckersall 2008). Many specific serum proteins can also be measured by immunoassays, which require a specific antibody against the analysed serum protein. Enzyme immu-noassay and enzyme-linked immunosorbent assay (ELISA) are the most common analytical tools in biomedical research for the detection and quanti-fication of specific proteins, antigens or antibodies (Gan and Patel 2013). ELISA is based on the concept of an antigen/protein binding to its specific antibody, which allows detection of very low concentrations of antigen/protein (Mariani et al. 1998). Various types of ELISAs have been developed, all based on the basic principle of the direct or indirect detection of antigen by adhering or immobilising the antigen or antigen-specific capture antibody onto the well surface (Dobrovolskaia et al. 2006). Direct ELISA is the simplest format that uses an antibody directly conjugated to an enzyme to detect plate-immo-bilised antigen (Lin 2015). The indirect detection method uses a secondary antibody to amplify the signal of the primary antibody bound to the anti-gen. On the other hand, some serum proteins can be measured on the basis of their biological activi-ties. For example, the concentrations of haptoglobin can be rapidly measured using its high affinity for haemoglobin and subsequent preservation of its per-oxidase activity at a low pH (Eckersall et al. 1999). The intensity of the peroxidase activity in the bound haemoglobin is directly proportional to the amount of haptoglobin present in the sample. This colori-metric assay is designed to detect haptoglobin in a range of animal species. The concentrations of
ceruloplasmin, another serum protein, can be ana-lysed by measuring its endogenous oxidase activity (Ceron and Martinez-Subiela 2004). However, for the quantitative determination of most serum pro-teins in animals, species-specific assays still need to be developed.
3. Normal serum protein pattern
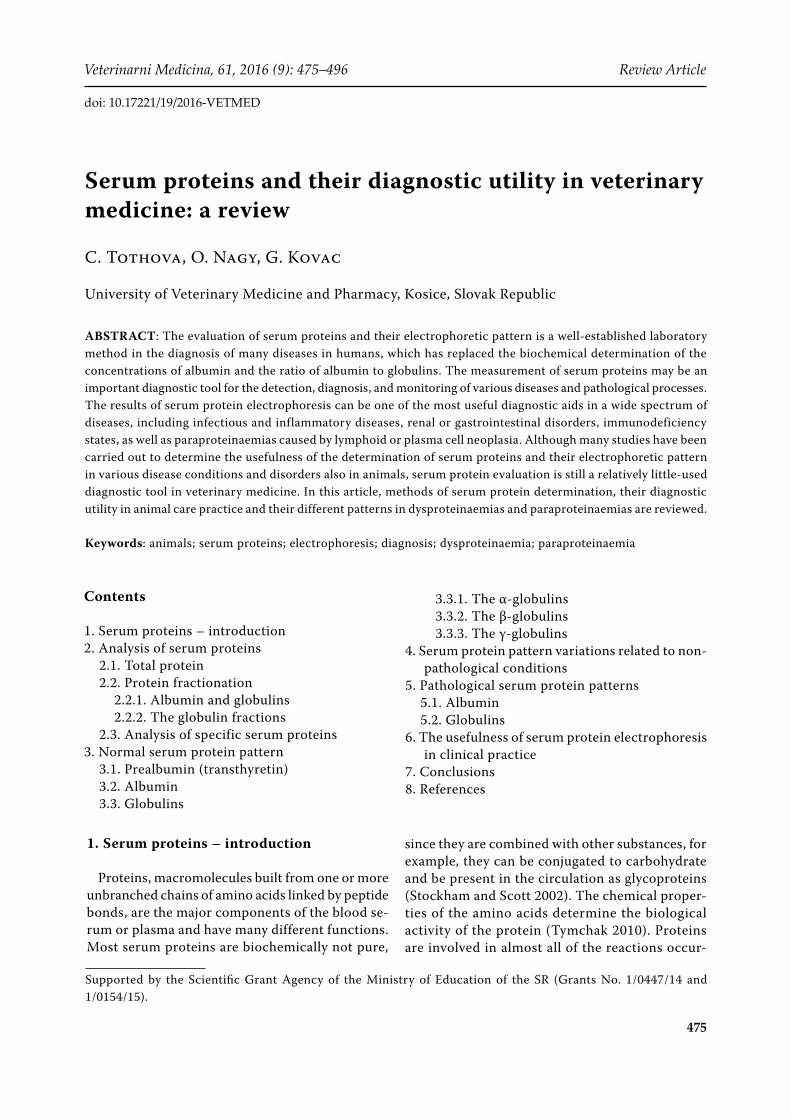
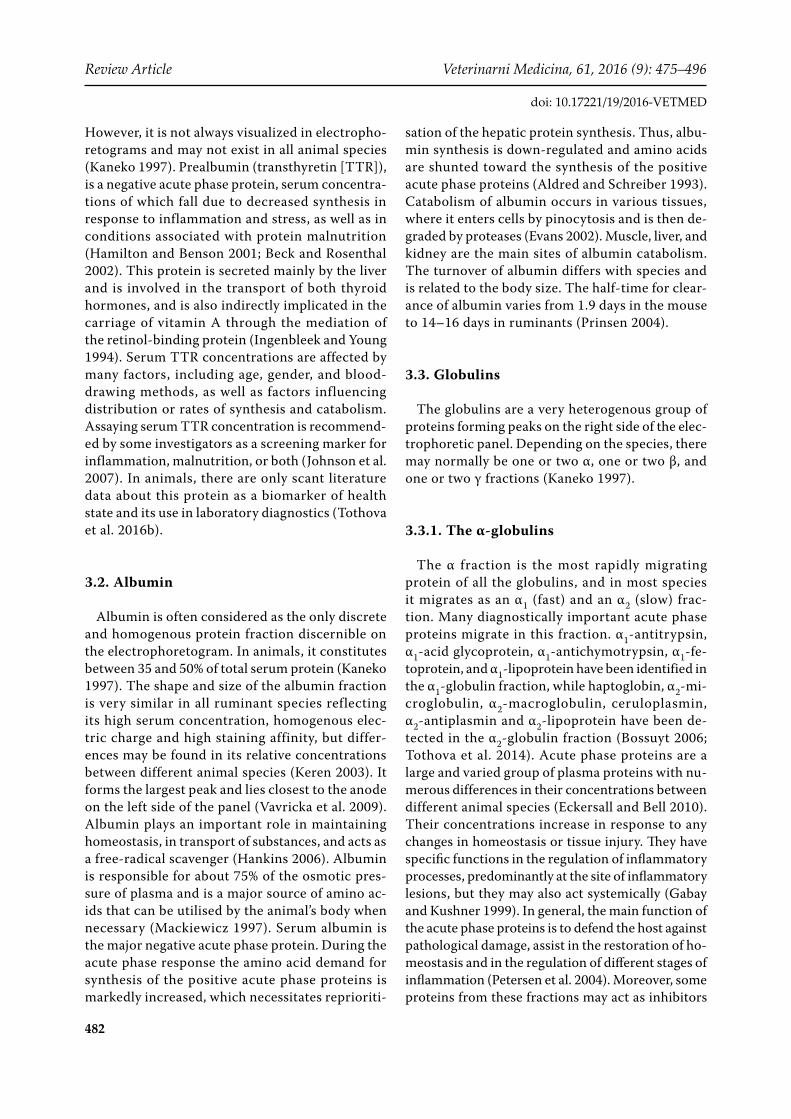
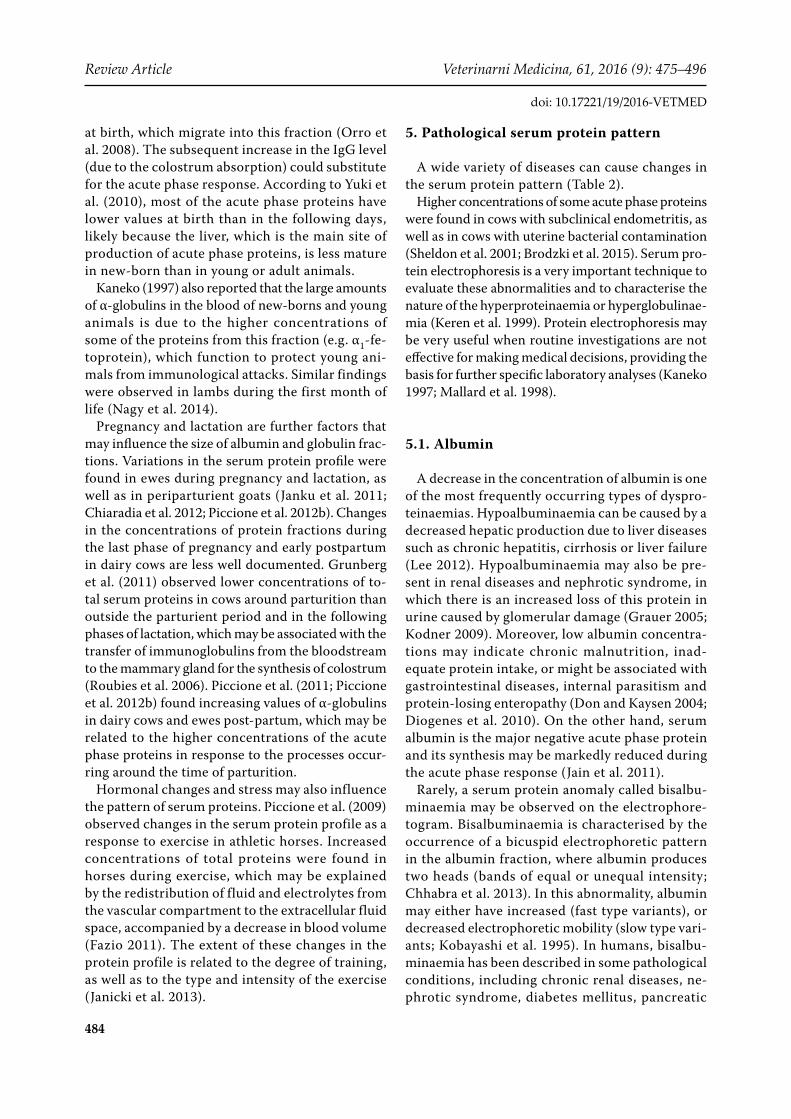
Following electrophoresis, serum proteins can be separated into four basic fractions including albu-min, α-, β- and γ-globulins (Bossuyt 2006; Figure 1). Each band is made up of a group of individual pro-teins, each of which is characterised by independent metabolic properties (Table 1). The interpretation of serum protein electrophoretic patterns depends on the variations among different species of ani-mals, as well as among different groups of animals (Figure 2). Indeed, many researchers have noted that serum protein fractions display important differences among all domestic animals (Keay and Doxey 1981; Alberghina et al. 2010). The number, shape, and size of fractions and subfractions vary greatly with the animal species and breed (Fayos et al. 2005): the most important differences are be-tween β-globulins and also γ-globulins.
Protein electrophoresis is also an important laboratory technique for the evaluation of serum protein abnormalities in dogs and cats (McGrotty and Knottenbelt 2002). Using agarose gel electro-phoresis Abate et al. (2000) determined six frac-tions in healthy dogs: albumin, α1-, α2-, β1-, β2-, and γ-globulins. Similar findings were reported by Harrus et al. (1996), Fayos et al. (2005) and Maciel et al. (2012). In contrast, Akdogan Kaymaz et al. (1999) separated the serum proteins only into five
Figure 1. Normal serum protein electrophoretogram
Albumin α1 α2 β γ

480
Review Article Veterinarni Medicina, 61, 2016 (9): 475–496
doi: 10.17221/19/2016-VETMED
fractions, consisting of albumin, α1-, α2-, β-, and γ-globulins. The electrophoretic pattern of serum proteins in cats is poorly characterised. In routine electrophoresis, serum cat proteins are separated into albumin, α1-, α2-, β1-, β2-, and γ-globulin frac-tions (Baker and Valli 1988). However, according to Gerou-Ferriani et al. (2011), the globulin fractions in normal cats may be further divided into α1a-, α1b-, α2a-, α2b-, β1- and β2-subzones.
Table 1. Protein components identified by serum protein electrophoresis (adapted from Tymchak 2010)
Protein fraction Components
Prealbumin prealbumin (transthyretin)Albumin albumin
α 1-gl
obul
ins α1-antitrypsin
α1-fetoproteinα1-acid glycoprotein (orosomucoid)α1-antichymotrypsinα1-lipoprotein
α 2-gl
obul
ins
haptoglobinα2-microglobulin (protein HC)α2-macroglobulinceruloplasminretinol-binding proteinα2-antiplasminα2-lipoproteinGc-globulin (group specific component, vitamin D-binding protein)
β-gl
obul
ins
transferrinferritinβ1-lipoproteinhaemopexinplasminogenangiostatinpregnancy-specific β1-glycoproteinβ2-microglobulinC3 complementC4 complementC-reactive proteinfibrinogen (in plasma protein electro-phoresis)
γ-gl
obul
ins
immunoglobulin Gimmunoglobulin Aimmunoglobulin Mimmunoglobulin Dimmunoglobulin E
In healthy horses, some authors (Kohn 1957; Riond et al. 2009; Gundasheva 2015) clearly sepa-rated on the serum protein electrophoretogram six different bands, including albumin, α1- and α2-glo- bulins, β1- and β2-globulins, and γ-globulins. In contrast, Matthews (1982) found two γ-globulin zones. The pig electrophoretic serum protein pat-tern is not well described. Swindle and Sistino (2015) described five swine protein fractions, com-prising albumin, α1-, α2-, β-, and γ-globulins.
Differences in the electrophoretic mobility of serum proteins have been observed also between ruminant species. Using agarose gel electrophoresis Nagy et al. (2015) described six fractions in bovine serum comprising albumin, α1- and α2-, β1- and β2-, and γ-globulins, whereas, Alberghina et al. (2011) and Piccione et al. (2012a) separated the bovine serum proteins into five fractions, comprising al-bumin, α1-, α2-, β-, and γ-globulins. The number of protein fractions in sheep and goat serum var-ied between various authors. Nagy et al. (2015) and Esmaeilnejad et al. (2014) detected albumin, α1-, α2-, β-, γ1- and γ2-globulins in sheep serum, while the goat serum proteins showed albumin, α1-, α2-, β- and γ-globulin fractions (Perez et al. 2003; Nagy et al. 2015). In contrast, Cyrillo et al. (2006), Fernandez et al. (2006) and Alberghina et al. (2010) determined only one α-globulin and two β-globulin fractions in goat serum.
Serum protein electrophoresis may be a useful diagnostic tool also in avian medicine. It is recom-mended for many avian species as one of the more reliable techniques to determine the albumin and globulin concentrations, since birds with appar-ently normal protein values may show abnormali-ties on the protein electrophoretic pattern (Lumeij et al. 1990). In avian practice, heparinised plasma is the preferred sample for clinical chemistry. Thus, most reports on avian electrophoresis have used plasma instead of serum. There are more variations in protein electrophoretic patterns among avian species than among those of mammals (Werner and Reavill 1999). For example, in avian species β- and γ-globulins migrate in a single fraction with sharp peaks when their concentrations are increased, while in mammals the elevated globulin fractions show broader peaks (Spano et al. 1988). However, many psittacine species have unique protein elec-trophoretic patterns showing a biphed (twin) β-fraction in healthy, as well as diseased individuals (Cray and Tatum 1998). In most avian species, the

481
Veterinarni Medicina, 61, 2016 (9): 475–496 Review Article
doi: 10.17221/19/2016-VETMED
the total in budgerigars (Melopsittacus undulatus, Cray and Tatum 1998).
3.1. Prealbumin (transthyretin)
Prealbumin is the most rapidly migrating protein fraction in serum and is visible as a band anodic to the main albumin fraction (Harris and Kohn 1974).
Figure 2. Representative agar gel electrophoretogram in healthy cow (A), sheep (B), goat (C), dog (D) and horse (E)
α1-globulin fraction is detectable only in some dis-ease conditions, usually in systemic inflammation. Selective increases in the α1-globulins have been observed in psittacine birds with parasitic infec-tion, caused by an increase in α1-antitrypsin (Cray 1997). Wide variations exist also in the prealbumin concentrations, which account for as little as 10% of the total albumin concentration in cockatiels (Nymphicus hollandicus) and as much as 75% of
Albumin α1 α2 β1 β2 γ
Albumin α1 α2 β1 γ1 γ2Albumin α1 α2 β1 β2 γ
Albumin α1 α2 β1 γ Albumin α1 α2 β1 β2 γ
(A)
(C)
(E)
(B)
(D)
482
Review Article Veterinarni Medicina, 61, 2016 (9): 475–496
doi: 10.17221/19/2016-VETMED
However, it is not always visualized in electropho-retograms and may not exist in all animal species (Kaneko 1997). Prealbumin (transthyretin [TTR]), is a negative acute phase protein, serum concentra-tions of which fall due to decreased synthesis in response to inflammation and stress, as well as in conditions associated with protein malnutrition (Hamilton and Benson 2001; Beck and Rosenthal 2002). This protein is secreted mainly by the liver and is involved in the transport of both thyroid hormones, and is also indirectly implicated in the carriage of vitamin A through the mediation of the retinol-binding protein (Ingenbleek and Young 1994). Serum TTR concentrations are affected by many factors, including age, gender, and blood-drawing methods, as well as factors influencing distribution or rates of synthesis and catabolism. Assaying serum TTR concentration is recommend-ed by some investigators as a screening marker for inflammation, malnutrition, or both (Johnson et al. 2007). In animals, there are only scant literature data about this protein as a biomarker of health state and its use in laboratory diagnostics (Tothova et al. 2016b).
3.2. Albumin
Albumin is often considered as the only discrete and homogenous protein fraction discernible on the electrophoretogram. In animals, it constitutes between 35 and 50% of total serum protein (Kaneko 1997). The shape and size of the albumin fraction is very similar in all ruminant species reflecting its high serum concentration, homogenous elec-tric charge and high staining affinity, but differ-ences may be found in its relative concentrations between different animal species (Keren 2003). It forms the largest peak and lies closest to the anode on the left side of the panel (Vavricka et al. 2009). Albumin plays an important role in maintaining homeostasis, in transport of substances, and acts as a free-radical scavenger (Hankins 2006). Albumin is responsible for about 75% of the osmotic pres-sure of plasma and is a major source of amino ac-ids that can be utilised by the animal’s body when necessary (Mackiewicz 1997). Serum albumin is the major negative acute phase protein. During the acute phase response the amino acid demand for synthesis of the positive acute phase proteins is markedly increased, which necessitates reprioriti-
sation of the hepatic protein synthesis. Thus, albu-min synthesis is down-regulated and amino acids are shunted toward the synthesis of the positive acute phase proteins (Aldred and Schreiber 1993). Catabolism of albumin occurs in various tissues, where it enters cells by pinocytosis and is then de-graded by proteases (Evans 2002). Muscle, liver, and kidney are the main sites of albumin catabolism. The turnover of albumin differs with species and is related to the body size. The half-time for clear-ance of albumin varies from 1.9 days in the mouse to 14–16 days in ruminants (Prinsen 2004).
3.3. Globulins
The globulins are a very heterogenous group of proteins forming peaks on the right side of the elec-trophoretic panel. Depending on the species, there may normally be one or two α, one or two β, and one or two γ fractions (Kaneko 1997).
3.3.1. The α-globulins
The α fraction is the most rapidly migrating protein of all the globulins, and in most species it migrates as an α1 (fast) and an α2 (slow) frac-tion. Many diagnostically important acute phase proteins migrate in this fraction. α1-antitrypsin, α1-acid glycoprotein, α1-antichymotrypsin, α1-fe- toprotein, and α1-lipoprotein have been identified in the α1-globulin fraction, while haptoglobin, α2-mi- croglobulin, α2-macroglobulin, ceruloplasmin, α2-antiplasmin and α2-lipoprotein have been de-tected in the α2-globulin fraction (Bossuyt 2006; Tothova et al. 2014). Acute phase proteins are a large and varied group of plasma proteins with nu-merous differences in their concentrations between different animal species (Eckersall and Bell 2010). Their concentrations increase in response to any changes in homeostasis or tissue injury. They have specific functions in the regulation of inflammatory processes, predominantly at the site of inflammatory lesions, but they may also act systemically (Gabay and Kushner 1999). In general, the main function of the acute phase proteins is to defend the host against pathological damage, assist in the restoration of ho-meostasis and in the regulation of different stages of inflammation (Petersen et al. 2004). Moreover, some proteins from these fractions may act as inhibitors

483
Veterinarni Medicina, 61, 2016 (9): 475–496 Review Article
doi: 10.17221/19/2016-VETMED
of enzymes, as digest proteins, as compounds of the blood coagulation system or as carriers of copper (O’Connell et al. 2005).
3.3.2. The β-globulins
The β-globulins are a group of globular proteins that are more mobile than γ-globulins in electrically charged solutions, but less mobile than α-globulins. Transferrin and complement are the main proteins in the β-globulin fraction, which may correspond to the two subfractions (β1 and β2) identified in some animal species (Ceron et al. 2010). Other impor-tant proteins in this fraction are β2-microglobulin, C-reactive protein, ferritin, haemopexin, plasmi-nogen, and angiostatin. Moreover, in response to different antigenic stimulations, some IgM immu-noglobulins may migrate in the β region, while the IgA and IgE immunoglobulins can be found in the β-γ interzone, which may also correspond to the β2 subfraction identified in some animal species (Meyer and Harvey 2004).
3.3.3. The γ-globulins
The γ-globulin fraction is predominantly com-posed of immunoglobulins of various classes (IgG, IgA, IgM, IgD and IgE). While in some animal spe-cies (cattle and goats) the γ-globulins migrate as one overall fraction, in sheep they may be separated in two sub-fractions (γ1 and γ2; Nagy et al. 2015). According to Kaneko (1997), immunoglobulins from the γ fraction may migrate rapidly or slowly, giving rise to these two sub-fractions. On the other hand, Vavricka et al. (2009) stated that some immu-noglobulin classes may migrate into the β-γ zone or β-region. Immunoglobulins (or antibodies) func-tion as a part of the body’s immune system which responds to stimulation by molecules recognised by the body as non-self, the so-called antigens. They have the ability to specifically bind to one or a few closely related antigens in order to medi-ate their neutralisation and elimination, which is their primary function in the protection of the host (Schroeder and Cavacini 2010). Immunoglobulins are produced by cells of the adaptive immune sys-tem, activated B cells and plasma cells, in response to the exposure to antigens (Jackson and Elsawa 2015).
4. Serum protein pattern variations related to non-pathological conditions
Many pathological conditions are associated with slight or more marked alterations in serum protein patterns, such as shifts in albumin and globulin concentrations (Keay and Doxey 1982). On the other hand, variations in the serum protein pro-file and concentrations may occur also under some physiological conditions (Weaver et al. 2000; Janku et al. 2011).
Animal age is one of these important factors that may affect the concentrations of the different serum protein fractions or their electrophoretic pattern (Fayos et al. 2005). That has been shown both in feline species and horses (Baker and Valli 1988; Paltrinieri et al. 2008) and in young and adult cattle (Tothova et al. 2013a), where the most im-portant age-related differences were related to the concentrations of α- and γ-globulins. Indeed, in the latter the concentrations of α1-globulins were higher in calves, whereas the γ-globulins were higher in adult animals. It has been observed that these important changes happen in the first month of calf life, in association with changes in nutri-tion and because of adaptation processes during the neonatal period (Tothova et al. 2016a). The concentrations of total proteins and γ-globulins increase rapidly one day after the intake of colos-trum, and then decrease gradually until the end of the 1st month of age. Hammon et al. (2002) also stated that at birth, the concentration of total serum proteins of most offspring is very low due to the minimal quantities of immunoglobulins but, that this increases during the first 24 h of life thanks to the intestinal absorption of proteins (particularly immunoglobulins) from colostrum. On the other hand, albumin, the most prominent protein frac-tion at birth, decreases in relative concentration one day after colostrum intake, with a subsequent gradual increase from Day 2 until the end of the first month of life. At birth, the calf ’s α1-globulins comprise almost 30% of total proteins but their concentrations are decreased approximately by 50% at one day after birth, with a further decrease up to Day 30 of life (Tothova et al. 2016a). In the ab-solute concentrations of α1-globulins, a temporary slight increase after birth has been observed with a subsequent gradual decrease. Delivery is surely a stressful situation for the offspring, and manifests as higher concentrations of acute phase proteins
484
Review Article Veterinarni Medicina, 61, 2016 (9): 475–496
doi: 10.17221/19/2016-VETMED
at birth, which migrate into this fraction (Orro et al. 2008). The subsequent increase in the IgG level (due to the colostrum absorption) could substitute for the acute phase response. According to Yuki et al. (2010), most of the acute phase proteins have lower values at birth than in the following days, likely because the liver, which is the main site of production of acute phase proteins, is less mature in new-born than in young or adult animals.
Kaneko (1997) also reported that the large amounts of α-globulins in the blood of new-borns and young animals is due to the higher concentrations of some of the proteins from this fraction (e.g. α1-fe- toprotein), which function to protect young ani-mals from immunological attacks. Similar findings were observed in lambs during the first month of life (Nagy et al. 2014).
Pregnancy and lactation are further factors that may influence the size of albumin and globulin frac-tions. Variations in the serum protein profile were found in ewes during pregnancy and lactation, as well as in periparturient goats (Janku et al. 2011; Chiaradia et al. 2012; Piccione et al. 2012b). Changes in the concentrations of protein fractions during the last phase of pregnancy and early postpartum in dairy cows are less well documented. Grunberg et al. (2011) observed lower concentrations of to-tal serum proteins in cows around parturition than outside the parturient period and in the following phases of lactation, which may be associated with the transfer of immunoglobulins from the bloodstream to the mammary gland for the synthesis of colostrum (Roubies et al. 2006). Piccione et al. (2011; Piccione et al. 2012b) found increasing values of α-globulins in dairy cows and ewes post-partum, which may be related to the higher concentrations of the acute phase proteins in response to the processes occur-ring around the time of parturition.
Hormonal changes and stress may also influence the pattern of serum proteins. Piccione et al. (2009) observed changes in the serum protein profile as a response to exercise in athletic horses. Increased concentrations of total proteins were found in horses during exercise, which may be explained by the redistribution of fluid and electrolytes from the vascular compartment to the extracellular fluid space, accompanied by a decrease in blood volume (Fazio 2011). The extent of these changes in the protein profile is related to the degree of training, as well as to the type and intensity of the exercise (Janicki et al. 2013).
5. Pathological serum protein pattern
A wide variety of diseases can cause changes in the serum protein pattern (Table 2).
Higher concentrations of some acute phase proteins were found in cows with subclinical endometritis, as well as in cows with uterine bacterial contamination (Sheldon et al. 2001; Brodzki et al. 2015). Serum pro-tein electrophoresis is a very important technique to evaluate these abnormalities and to characterise the nature of the hyperproteinaemia or hyperglobulinae-mia (Keren et al. 1999). Protein electrophoresis may be very useful when routine investigations are not effective for making medical decisions, providing the basis for further specific laboratory analyses (Kaneko 1997; Mallard et al. 1998).
5.1. Albumin
A decrease in the concentration of albumin is one of the most frequently occurring types of dyspro-teinaemias. Hypoalbuminaemia can be caused by a decreased hepatic production due to liver diseases such as chronic hepatitis, cirrhosis or liver failure (Lee 2012). Hypoalbuminaemia may also be pre-sent in renal diseases and nephrotic syndrome, in which there is an increased loss of this protein in urine caused by glomerular damage (Grauer 2005; Kodner 2009). Moreover, low albumin concentra-tions may indicate chronic malnutrition, inad-equate protein intake, or might be associated with gastrointestinal diseases, internal parasitism and protein-losing enteropathy (Don and Kaysen 2004; Diogenes et al. 2010). On the other hand, serum albumin is the major negative acute phase protein and its synthesis may be markedly reduced during the acute phase response (Jain et al. 2011).
Rarely, a serum protein anomaly called bisalbu-minaemia may be observed on the electrophore-togram. Bisalbuminaemia is characterised by the occurrence of a bicuspid electrophoretic pattern in the albumin fraction, where albumin produces two heads (bands of equal or unequal intensity; Chhabra et al. 2013). In this abnormality, albumin may either have increased (fast type variants), or decreased electrophoretic mobility (slow type vari-ants; Kobayashi et al. 1995). In humans, bisalbu-minaemia has been described in some pathological conditions, including chronic renal diseases, ne-phrotic syndrome, diabetes mellitus, pancreatic

485
Veterinarni Medicina, 61, 2016 (9): 475–496 Review Article
doi: 10.17221/19/2016-VETMED
disease or Alzheimer’s disease (Ejaz et al. 2004; Shetty et al. 2007). In animals, bisalbuminaemia was found in female bottlenose dolphin (Turiops truncatus), but it was not associated with disease (Medway 1979). According to Vavricka et al. (2009), the presence of bisalbuminaemia may be caused by increased mobility of albumin due to its binding to bilirubin, non-esterified fatty acids, penicillin or acetylsalicylic acid. The horses may exhibit a minor post-albumin fraction, which frequently increases in animals with hypoalbuminaemia or acute inflam-matory diseases, and it is consistently present in chronic liver diseases (Johns 2015).
An increased concentration of albumin in the serum is called hyperalbuminemia, and may be observed in cases of severe dehydration. However, hyperalbuminemia was recorded also in dogs with hepatocellular carcinoma (Cooper et al. 2009).
5.2. Globulins
Increases in the globulin fractions belong to the common findings on serum protein electrophore-tograms. Since many acute phase proteins migrate in the α region, the concentrations of α1- and α2-globulins may be elevated in acute, as well as chronic inflammatory diseases as a result of the activation of the host inflammatory responses (O’Connell et al. 2005). Increased α-globulins (predominantly α1-globulins) were found in sheep naturally infected with Babesia ovis, as well as in calves affected by res-piratory diseases (Apaydin and Dede 2010; Tothova et al. 2013b). The α2-globulin fraction typically in-creases in patients with nephrotic syndrome as a re-sult of the increased synthesis of α2-macroglobulin that migrates in this fraction. Because of its size, the α2-macroglobulin is unable to pass through glo-
Table 2. Abnormalities in serum protein electrophoretic patterns and associated diseases (adapted from Werner and Reavill 1999)
Protein fraction Alteration Associated disease condition
Albumindecrease
liver disease, chronic hepatitis, cirrhosis, liver failurerenal diseases, nephrotic syndromechronic malnutritiongastrointestinal diseases, protein-losing enteropathy, internal parasitismacute inflammation (acute phase response)
increase dehydration
α1-globulinsdecrease
α1-antitrypsin deficiencymalnutrition, hepatic insufficiency
increase active inflammation
α2-globulinsdecrease haemolytic anaemia
increaseinflammatory diseases, traumanephrotic syndrome
β-globulins
decreasemalnutritionhepatic insufficiency
increase
inflammatory diseases, infectionsactive hepatitis, chronic liver diseases, liver cirrhosisnephrotic syndromehypercholesterolemiairon deficiency anaemia
γ-globulins
decreasefoetal or pre-colostral serarecurrent infections, immune deficiencyhereditary immune deficiency diseases
increase
monoclonal – multiple myeloma, chronic lymphatic leukaemia, lymphosarcoma, plasma cell myeloma, malignant lymphomapolyclonal – reactive inflammatory conditions, chronic inflammatory processes, severe infections, immune-mediated disorders

486
Review Article Veterinarni Medicina, 61, 2016 (9): 475–496
doi: 10.17221/19/2016-VETMED
meruli and therefore it remains in the bloodstream (de Sain-van der Velden et al. 1998). Increases in α2-globulins have been reported in small animals affected by various diseases, including leishma-niasis, ehrlichiosis, babesiosis, feline infectious peritonitis, feline cholangitis, haemoplasmosis, as well as any secondary inflammation, especial-ly if caused by opportunistic bacteria (Camacho et al. 2005; Tappin et al. 2011). Decreases in the α1-globulin fraction may be detected in α1-anti- trypsin deficiency, a rare genetic disorder in hu-mans and even more rare in animals (Slev et al. 2008). Similarly, the α2-globulin zone may typi-cally be decreased in haemolytic anaemia, when haptoglobin from this fraction binds with the free haemoglobin released from the destroyed red blood cells, forming haptoglobin-haemoglobin complexes that are rapidly removed by phagocytes (Vavricka et al. 2009; Gupta et al. 2011). On the other hand, the inflammatory conditions that develop in asso-ciation with haemolytic anaemia lead to increased haptoglobin concentrations that may induce an in-crease in α2-globulins (Tecles et al. 2005).
Inflammatory diseases and infections may be accompanied not only by increased concentra-tions of α-globulins, but also by elevations in the β-fraction as a result of the increased production of some acute phase proteins which migrate into this region. According to Kaneko (1997), increases solely in the β-globulin fraction are not frequent and may be typical for active hepatitis. Chronic persistent liver disease, liver cirrhosis, as well as nephrotic syndrome may cause elevations in the β-region due to the increase of the concentrations of β2-microglobulin in these conditions (Revillard 1980; Joven et al. 1997). Higher concentrations of β1-globulins were found also in horses with lar-val cyathostomiasis (Kent 1987; Mair et al. 1993). High β-globulin concentrations may be associated also with hypercholesterolemia, which is caused by an increased concentration of beta-lipopro-teins in this fraction (Pagana and Pagana 2006). Moreover, increased levels of β-globulins are typi-cal for iron deficiency anaemia associated with higher values of transferrin (Firkin and Rush 1997; Killip et al. 2007). The increase of β-globulins in haemolytic anaemia may depend on the presence of free haemoglobin that typically migrates in this region. On the other hand, malnutrition is often accompanied with decreased concentrations of β-globulins.
In some conditions, the increase in the β2- and γ-globulin fractions may produce a β-γ fusion. This phenomenon is called β-γ bridging and is charac-terised by the lack of a clear demarcation between these two fractions. It is caused by an increase in the concentrations of IgM or IgA, which may migrate in the region between the β and γ zones (Morris and Johnston 2002). According to some authors, the pat-tern of β-γ bridging is pathognomonic for chronic liver diseases or hepatic cirrhosis (Evans and Duncan 2003). However, Camus et al. (2010) claimed that β-γ bridging does not have a strong predictive value for hepatic diseases in dogs, cats, or horses, and may be frequently found in association with infectious diseases, including leishmaniasis or ehrlichiosis (Romdane et al. 1992). Another possible source of the β-γ bridge is the use of plasma instead of serum, where it is caused by the migration of fibrinogen be-tween the β and γ regions (Rossi et al. 2008).
Increases in γ-globulin production are called gammopathies. They are very frequent and may be found in many pathological conditions. There are two different types of gammopathies: monoclo-nal and polyclonal gammopathy. Monoclonal gam-mopathy is characterised by a sharp, homogenous, spike-like peak in the focal region of the γ-globulin zone (Figure 3). This reflects the presence of ex-cessive amounts of one type of immunoglobulin secreted by a single clone of B lymphocytes, or an immunoglobulin fragment referred to as parapro-tein or M protein (Edwards et al. 1993). Multiple myeloma is the most common malignant disorder of plasma cells, in which usually IgA and IgG para-proteins can be found (Weiss et al. 2009). However, it is important to differentiate multiple myeloma from monoclonal gammopathy of undetermined significance, which is a premalignant plasma cell dis-
Figure 3. Electrophoretogram of individual with a mon-oclonal gammopathy. A narrow peak (arrow) is present in the g-region
Albumin α1 α2 β γ

487
Veterinarni Medicina, 61, 2016 (9): 475–496 Review Article
doi: 10.17221/19/2016-VETMED
and Knight 2007). The absence of γ-fraction or very low concentrations of γ-globulins are called agamma-globulinaemia. The condition may be found in people with hereditary immune deficiency diseases, in which the precursor cells that produce gammaglobulins are not sufficiently developed, resulting in low numbers of mature B lymphocytes (B cells; Ochs and Smith 1996). Primary immunodeficiency disorders may be found also in animals, especially in horses (Arabian, Appaloosa) and in some canine breeds, including Basset hounds, Jack Russell terriers, Beagles, German shepherds, Chinese shar-pei, Cardigan Welsh corgi, Doberman pinschers, and Irish setters (Stockham and Scott 2002). Agammaglobulinaemia in adult animals is a rare condition. Primary X-linked agammaglobuli-naemia caused by impaired B cells was described in young male horses, and resulted in low immunoglob-ulin production, marked depletion of the γ-globulin fraction on the electrophoretogram and consequently in clinical manifestation of the disease at the age of 4–5 months (Perryman et al. 1983).
The aforementioned shifts in the concentrations of albumin and globulins lead also to changes in the albumin: globulin ratio (A/G). The normal A/G ra-tio ranges from values lower than 1.0 to values just above 1.0 (e.g. 0.6–1.1 in dogs and cats, 0.6–1.4 in horses, 0.6–0.9 in cows; Krimer 2011), but many dis-ease conditions may alter the relative concentrations of albumin and globulins, changing their proportion (Kaneko 1997). A decreased A/G ratio may be caused by the overproduction of globulins, decreased syn-thesis of albumin, or due to the loss of albumin from the circulation. On the other hand, a higher A/G ra-tio reflects the underproduction of globulins. Thus, the A/G ratio provides very important information about the changes in the electrophoretic pattern, and
Albumin α1 α2 β γ
Figure 4. Electrophoretogram of an individual with a polyclonal gammopathy. A broad-based peak (arrow) is present in the g-region
order present in more than 3% of the general human population at the age of 50 years and older (Kyle et al. 2006). Other causes of monoclonal gammopathy are chronic lymphatic leukaemia, lymphosarcoma, or Waldenstrom’s macroglobulinaemia, where IgM paraproteins can be found (Kyle 1994). Monoclonal gammopathies in farm animals are not frequent. Some cases were recorded in horses, which has been associated with plasma cell myeloma, malignant lymphoma and idiopathic causes (Kent and Roberts 1990; Edwards et al. 1993). Reports on mono- or oligoclonal gammopathy in small animals are more numerous, and were found in cases with eryth-rophagocytic multiple myeloma, Waldenstrom’s macroglobulinaemia, as well as chronic canine ehr-lichiosis with persistently increased antibody titres (Perille and Matus 1991; Webb et al. 2008; Jaillardon and Fournel-Fleury 2011). Biclonal gammopathy has also been described in a cat and in a dog with plas-ma cell neoplasia and light-chain multiple myeloma (Yamada et al. 2007; Facchini et al. 2010).
Polyclonal gammopathy reflects the presence of a diffuse hypergammaglobulinaemia, in which all im-munoglobulin classes may be increased. It is charac-terised by a diffuse, broad increase in the γ-globulin zone on the electrophoretogram (Figure 4). This el-evation of γ-globulins usually indicates a non-malig-nant condition, and is mostly caused by reactive and inflammatory processes (O’Connell et al. 2005). The most common causes of polyclonal gammopathies are chronic inflammatory processes (gastrointestinal, respiratory, endocrine, cardiac), severe infections, as well as immune-mediated or rheumatological dis-orders (Dispenzieri et al. 2001; Crisman et al. 2008; Vavricka et al. 2009). Polyclonal gammopathy may be typically described in animals with leishmaniasis, feline infectious peritonitis, feline leukaemia virus, as well as Ehrlichia canis infection (Tappin et al. 2011; Baba et al. 2012). A decrease in the concentrations of γ-globulins in the serum is called hypogamma-globulinaemia. This pattern is typical for foetal or pre-colostral sera in some animal species. In calves and foals, pre-colostral serum normally contains no or only very small quantities of γ-globulins, but within a few hours after the intake of colostrum, γ-globulins begin to rise in serum and the absorp-tion continues for up to 36 h after birth, after which gut permeability ceases (Weaver et al. 2000; Blum 2006). Hypogammaglobulinaemia may be commonly seen also in patients with recurrent infections or in cases of immune deficiency (Cunningham-Rundles

488
Review Article Veterinarni Medicina, 61, 2016 (9): 475–496
doi: 10.17221/19/2016-VETMED
could help in the classification and identification of dysproteinaemias (Alberghina et al. 2011).
6. The usefulness of serum protein electrophoresis in clinical practice
The analysis of serum proteins and their elec-trophoretic separation has been extensively used in human medicine for many years. In clinical practice, the main area of the application of serum protein electrophoresis is in the identification of patients with multiple myeloma and other disorders of serum proteins (Vavricka et al. 2009). Moreover, the electrophoretic separation of serum proteins is very important in the differentiation of monoclonal gammopathies from polyclonal gammopathies. For gastroenterologists, the method may be of special interest in the diagnosis of chronic liver diseases, hepatic cirrhosis, hepatocellular carcinoma, α1-antitrypsin deficiency, inflammatory bowel dis-ease, or amyloidosis, in which clinical signs and symptoms may be seen in the whole gastrointes-tinal tract (Melmed 2009). In small animals, pro-tein electrophoresis is commonly used to support a clinical diagnosis of diseases characterised by dysproteinaemia (leishmaniasis, ehrlichiosis, feline infectious peritonitis), or to identify the presence of inflammation with increased α-globulins.
Serum protein electrophoresis has been studied intensively also in small animal and equine medi-cine. Fayos et al. (2005) evaluated the electropho-retic pattern of serum proteins in healthy retired racing Greyhounds in comparison to non-Grey-hound dogs of the same age and gender, and they suggested that specific reference intervals should be determined for the parameters related to pro-tein profiles in different breeds of dogs. The serum protein responses, including the concentrations of separated protein fractions were determined in dogs with naturally occurring mild, severe or complicated Babesia canis infection (Lobetti et al. 2000). These authors found lower concentrations of total proteins, albumin and α-globulins in dogs with mild and severe babesiosis, while the dogs with complicated babesiosis showed no typical se-rum protein pattern. Akdogan Kaymaz et al. (1999) evaluated the usefulness of serum protein electro-phoresis in the differentiation of gastrointestinal parasitic infections caused by taeniosis, coccidi-osis, ancylostomosis, trichuriosis and ascarididosis
in dogs. In animals with coccidiosis significantly lower concentrations of α1-globulins were found, while the dogs with ancylostomosis had higher values of α2-globulins. On the other hand, the α2-globulin fraction decreased significantly in the dogs with ascarididosis. Possible alterations in the serum protein electrophoretic profile after the inoculation of live attenuated vaccine against canine distemper virus and canine parvovirus were studied by Maciel et al. (2012) in puppies. At Day 7 post-vaccination, an increase of the concentrations of α1- and α2-glo- bulins was observed. An understanding of the pathophysiological mechanisms initiated by the first two vaccinations is very important, because they can be easy confused with diseases in puppies.
Although serum protein electrophoresis provides useful information on the changes in the concentra-tions of albumin and globulin fractions associated with pathological conditions, in ruminants it is a rarely used diagnostic tool. The usefulness of the electrophoretic separation of serum proteins was studied by Woolf et al. (1973) in bighorn sheep with chronic pneumonia attributed to Mycoplasma. In this study, diseased sheep had significantly lower albumin, and higher α1- and γ-globulin concentra-tions. Recently, Tothova et al. (2013b) evaluated the effect of chronic bronchopneumonia on the se-rum protein pattern in calves. These authors found significantly higher concentrations of α1-, β2- and γ-globulins in the affected animals compared with healthy ones. Yoshida (1991) investigated the di-agnostic significance of protein electrophoresis in cows with traumatic pericarditis. In the affected cows slight hypoproteinaemia, moderate hypoalbu-minemia, and a slight increase in the concentration of the α- and β-globulin fractions was observed. A tendency toward hypergammaglobulinaemia was found in cows with purulent pericarditis, while a large indentation between the β- and γ-fractions was typical for fibrinous or sero-fibrinous peri-carditis. Changes in the serum electrophoretic pattern and immunoglobulin concentrations were examined also in cows with lymphoma (Jacobs et al. 1980). Moderately increased concentrations of α2-globulins were found in these cows, while the β2-globulin fraction was significantly decreased due to the lower concentration of immunoglob-ulins. Alterations of the serum protein electro-phoretic profile were investigated also in sheep naturally infected with Babesia ovis (Apaydin and Dede 2010). The results of this study suggested

489
Veterinarni Medicina, 61, 2016 (9): 475–496 Review Article
doi: 10.17221/19/2016-VETMED
a marked decrease of both total serum proteins and all protein fractions in diseased sheep before treatment compared to healthy animals. The con-centrations of total protein and globulins (except for the α-globulin fraction) increased significantly five days after treatment, but the values were still lower than those measured in healthy sheep. The aforementioned authors stated that babesiosis may induce intense proteolysis of the circulating pro-teins probably due to the altered protein synthesis by the liver, which was improved by the eradication of parasites. Similarly, Diogenes et al. (2010) evalu-ated whether the inflammatory reactions caused by infection with internal parasites like Haemonchus contortus may induce alterations in the serum protein profile in goats. The results of this study showed a severe hypoproteinaemia and hypoalbu-minemia in infected goats, while the concentrations of α- and γ2-globulins were markedly increased.
7. Conclusions
The aforementioned data suggest that serum pro-tein electrophoresis may be a useful diagnostic tool also in veterinary medicine. The electrophoretic technique may provide clinicians with important information to facilitate the differentiation of dys-proteinaemias and paraproteinaemias.
Changes in serum proteins can be indicative of non-specific pathological processes or may represent potential diagnostic markers of some pathological conditions. The determination of the physiological electrophoretic patterns in all animal species could be very useful for clinicians in dif-ferentiating healthy from sick animals, and may provide a basis for further specific laboratory in-vestigations. Therefore, a main challenge in deal-ing with serum protein electrophoresis of domestic animals is gaining a clear picture of the differences in the normal physiological pattern between spe-cies. Only subsequently can an assessment of the diagnostic significance of the changes in protein fractions be made.
8. REfERENCES
Abate O, Zanatta R, Malisano T, Dotta U (2000): Canine serum protein patterns using high-resolution electropho-resis (HRE). The Veterinary Journal 159, 150–154.
Ahmed FE (2009): Sample preparation and fractionation for proteome analysis and cancer biomarker discovery by mass spectrometry. Journal of Separation Science 32, 771–798.
Akdogan Kaymaz A, Bakirel U, Gonul R, Tan H, Vurusaner C (1999): Serum protein electrophoresis in dogs with intestinal parasites. Turkish Journal of Veterinary and Animal Sciences 23, 457–459.
Alberghina D, Casella S, Vazzana I, Ferrantelli V, Giannetto C, Piccione G (2010): Analysis of serum proteins in clin-ically healthy goats (Capra hircus) using agarose gel elec-trophoresis. Veterinary Clinical Pathology 39, 317–321.
Alberghina D, Giannetto C, Vazzana I, Ferrantelli V, Pic-cione G (2011): Reference intervals for total protein con-centration, serum protein fractions, and albumin/globulin ratios in clinically healthy dairy cows. Journal of Veterinary Diagnostic Investigation 23, 111–114.
Aldred AR, Schreiber G (1993): The negative acute phase pro-tein. In: Mackiewicz I, Kushner I, Baumann H (eds): Acute Phase Proteins. Molecular Biology, Biochemistry, and Clin-ical Applications. CRC Press, Boca Raton, Florida. 21–37.
Anderson NL, Anderson NG (2002): The human plasma proteome. Molecular and Cellular Proteomics 1, 845–867.
Apaydin B, Dede S (2010): Electrophoretic profile of serum protein fractions from sheep naturally infected with Babesia ovis. Revue de Medecine Veterinaire 161, 57–60.
Azim W, Azim S, Ahmed K, Shafi H, Rafi T, Luqman M (2004): Diagnostic significance of serum protein electro-phoresis. Biomedica 20, 40–44.
Baba K, Itamoto K, Amimoto A, Kitagawa K, Hiraoka H, Mizuno T, Sato H, Okuda M (2012): Ehrlichia canis infec-tion in two dogs that emigrated from endemic areas. Journal of Veterinary Medical Science 74, 775–778.
Baker RJ, Valli VEO (1988): Electrophoretic and immuno-electrophoretic analysis of feline serum proteins. Cana-dian Journal of Veterinary Research 52, 308–314.
Beck FK, Rosenthal TC (2002): Prealbumin: a marker for nutritional evaluation. American Family Physician 65, 1575–1578.
Blum JW (2006): Nutritional physiology of neonatal calves. Journal of Animal Physiology and Animal Nutrition 90, 1–11.
Bossuyt X (2006): Advances in serum protein electropho-resis. Advances in Clinical Chemistry 42, 43–80.
Boyer RF (ed.) (2000): Modern Experimental Biochemistry. 3rd edn. Addison Wesley Longman Inc., California. 480 pp.
Brackeen GL, Dover JS, Long CL (1989): Serum albumin. Differences in assay specificity. Nutrition in Clinical Prac-tice 4, 203–205.
Bradford MM (1976): A rapid and sensitive method for the quantitation of microgram quantities of protein utilizing

490
Review Article Veterinarni Medicina, 61, 2016 (9): 475–496
doi: 10.17221/19/2016-VETMED
the principle of protein-dye-binding. Analytical Biochem-istry 72, 248–254.
Briscoe JA, Rosenthal KL, Shofer FS (2010): Selected com-plete blood cell count and plasma protein electrophoresis parameters in pet psittacine birds evaluated for illness. Journal of Avian Medicine and Surgery 24, 131–137.
Brodzki P, Kostro K, Krakowski L, Marczuk J (2015): Inflam-matory cytokine and acute phase protein concentrations in the peripheral blood and uterine washings of cows with subclinical endometritis in the late postpartum period. Veterinary Research Communications 39, 143–149.
Brown JS, Nabity MB, Brock R (2010): Comparison of urine sodium dodecyl sulphate polyacrylamide gel electropho-resis (SDS-PAGE) with renal histological findings and clinicopathologic data in dogs with renal diseases. Veteri-nary Clinical Pathology 3, 556.
Burtis CA, Ashwood ER (eds) (2001): Tietz Fundamentals of Clinical Chemistry. 5th edn. WB Saunders Company, Phil-adelphia. 1091 pp.
Camacho AT, Guitian FJ, Pallas E, Gestal JJ, Olmeda S, Goe-thert H, Telford S, Spielman A (2005): Serum protein re-sponse and renal failure in canine Babesia annae infection. Veterinary Research 36, 713–722.
Camus MS, Krimer PM, LeRoy BE, Almy FS (2010): Evaluation of the positive predictive value of serum protein electropho-resis beta-gamma bridging for hepatic disease in three do-mestic animal species. Veterinary Pathology 47, 1064–1070.
Ceron JJ, Martinez-Subiela S (2004): An automated spectro-photometric method for measuring canine ceruloplasmin in serum. Veterinary Research 35, 671–679.
Ceron JJ, Caldin M, Martinez-Subiela S (2010): Electropho-resis and acute phase protein measurement. In: Douglas J, Weiss K, Wardrop J (eds): Schalm’s Veterinary Hematol-ogy. 6th edn. Blackwell Publishing Ltd., Ames. 1157–1161.
Chhabra S, Bansal F, Saikia B, Minz RW (2013): Bisalbumine-mia: A rarely encountered protein anomaly. Journal of Laboratory Physicians 5, 145–146.
Chiaradia E, Avellini L, Tartaglia M, Gaiti A, Just I, Scoppetta F, Czentnar Z, Pich A (2012): Proteomic evaluation of sheep serum proteins. BMC Veterinary Research 8, 66.
Chrisman CL (1992): Cerebrospinal fluid analysis. Veterinary Clinics of North America: Small Animal Practice 22, 781–810.
Cooper ES, Wellman ML, Carsillo ME (2009): Hyperalbu-minemia associated with hepatocellular carcinoma in a dog. Veterinary Clinical Pathology 38, 516–520.
Cray C (1997): Plasma protein electrophoresis: An update. Proceedings of the Annual Conference of the Association of Avian Veterinarians. 209–212.
Cray C, Tatum LM (1998): Applications of protein electro-phoresis in avian diagnostics. Journal of Avian Medicine and Surgery 12, 4–10.
Crisman MV, Scarratt WK, Zimmerman KL (2008): Blood proteins and inflammation in the horse. Veterinary Clinics: Equine Practice 24, 285–297.
Crivellente F, Bonato M, Cristofori P (2008): Analysis of mouse, rat, dog, marmoset, and human serum proteins by capillary electrophoresis: comparison with agarose gel electrophoresis. Veterinary Clinical Pathology 37, 73–78.
Cunningham-Rundles C, Knight AK (2007): Common vari-able immune deficiency: reviews, continued puzzles, and a new registry. Immunology Research 38, 78–86.
Cyrillo FC, Leal ML do R, Benesi FJ, Della Libera AMM de P (2006): Dynamics of serum proteins during the estrous cycle of goats bred in Brazil and naturally infected by caprine arthritis encephalitis virus. Revista Arquivos do Instituto Biologico 73, 41–44.
Da Silva MAO, Zezzi Arruda MA (2006): Mechanization of the Bradford reaction for the spectrophotometric determination of total proteins. Analytical Biochemistry 351, 155–157.
De Sain-van der Velden MGM, Rabelink TJ, Reijngoud DJ, Gadellaa MM, Voorbij HAM, Stellaard F, Kaysen GA (1998): Plasma α2 macroglobulin is increased in nephrotic patients as a result of increased synthesis alone. Kidney International 54, 530–535.
Diogenes PVA, Suassuna ACD, Ahid SMM, Soto-Blanco B (2010): Serum protein electrophoretic profile of goats in-fected with Haemonchus contortus. Journal of Animal and Veterinary Advances 9, 1603–1606.
Dispenzieri A, Gertz MA, Therneau TM, Kyle RA (2001): Retrospective cohort study of 148 patients with polyclonal gammopathy. Mayo Clinic Proceedings 76, 476–487.
Dobrovolskaia E, Gam A, Slater JE (2006): Competition enzyme-linked immunosorbent assay (ELISA) can be a sensitive method for the specific detection of small quan-tities of allergen in a complex mixture. Clinical and Ex-perimental Allergy 36, 525–530.
Don BR, Kaysen G (2004): Serum albumin: relationship to in-flammation and nutrition. Seminars in Dialysis 17, 432–437.
Doumas BT, Peters Jr T (1997): Serum and urine albumin: a progress report on their measurement and clinical sig-nificance. Clinica Chimica Acta 258, 3–20.
Doumas BT, Bayse DD, Carter RJ, Peters Jr T, Schaffer R (1981): A candidate reference method for determination of total protein in serum. I. Development and validation. Clinical Chemistry 27, 1642–1650.
Eckersall PD (2008): Proteins, proteomics, and the dyspro-teinemias. In: Kaneko JJ, Harvey JW, Bruss ML (eds): Clinical Biochemistry of Domestic Animals. 6th edn. El-sevier Academic Press, California. 117–155.
Eckersall PD, Bell R (2010): Acute phase proteins: Biomark-ers of infection and inflammation in veterinary medicine. The Veterinary Journal 185, 23–27.

491
Veterinarni Medicina, 61, 2016 (9): 475–496 Review Article
doi: 10.17221/19/2016-VETMED
Eckersall PD, Duthie S, Safi S, Moffatt D, Horadagoda NU, Doyle S, Parton R, Bennett D, Fitzpatrick JL (1999): An automated biochemical assay for haptoglobin: prevention of interference from albumin. Comparative Haematology International 9, 117–124.
Edwards DF, Parker JW, Wilkinson JE, Helman RG (1993): Plasma cell myeloma in the horse. A case report and lit-erature review. Journal of Veterinary Internal Medicine 7, 169–176.
Ejaz AA, Krishna M, Wasiluk A, Knight JD (2004): Bisalbu-minemia in chronic kidney disease. Clinical and Experi-mental Nephrology 8, 270–273.
Ernst O, Zor T (2010): Linearization of the Bradford protein assay. Journal of Visualized Experiments 38, 1918.
Errico G, Giordano A, Paltrinieri S (2012): Diagnostic ac-curacy of electrophoretic analysis of native or defibri-nated plasma using serum as a reference sample. Veterinary Clinical Pathology 41, 529–540.
Esmaeilnejad B, Tavassoli M, Asri-Rezaei S, Dalir-Naghadeh B, Pourseyed SH (2014): Evaluation of serum total protein concentration and protein fractions in sheep naturally infected with Babesia ovis. Comparative Clinical Pathol-ogy 23, 151–155.
Evans EW, Duncan JR (2003): Proteins, lipids, and carbo-hydrates. In: Latimer KW, Mahaffey EA, Prasse KW (eds): Duncan and Prasse’s Veterinary Laboratory Medicine Clinical Pathology. 4th edn. Blackwell Publishing, Ames. 162–192.
Evans TW (2002): Review article: albumin as a drug: bio-logical effects of albumin unrelated to oncotic pressure. Alimentary Pharmacology and Therapeutics 16, 6–11.
Facchini RV, Bertazzolo W, Zuliani D, Bonfanti U, Caldin M, Avallone G, Roccabianca P (2010): Detection of bi-clonal gammopathy by capillary zone electrophoresis in a cat and a dog with plasma cell neoplasia. Veterinary Clinical Pathology 39, 440–446.
Fayos M, Couto CG, Iaybik MC, Wellman ML (2005): Serum protein electrophoresis in retired racing Greyhounds. Veterinary Clinical Pathology 34, 397–400.
Fazio F, Assenza A, Tosto F, Casella S, Piccione G, Caola G (2011): Training and haematochemical profile in thor-oughbreds and standardbreds, a longitudinal study. Live-stock Science 141, 221–226.
Fernandez SY, Jesus EEV, Paule BJA, Uzeda RS, Almeida MAO, Guimaraes JE (2006): Proteinogram of alpine goat naturally infected by gastrointestinal parasites. Arquivo Brasileiro de Medicina Veterinaria e Zootecnia 58, 279–282.
Firkin R, Rush B (1997): Interpretation of biochemical tests for iron deficiency: diagnostic difficulties related to lim-itations of individual tests. Australian Prescriber 20, 74–76.
Friedrichs WE, Navarijoashbaugh AL, Bowman BH, Yang F (1995): Expression and inflammatory regulation of hap-toglobin gene in adipocytes. Biochemical and Biophysical Research Communications 209, 250–256.
Gabay C, Kushner I (1999): Acute-phase proteins and other systemic responses to inflammation. New England Jour-nal of Medicine 340, 448–454.
Gama FGV, Santana AE, de Campos Filho E, da Silva Nogue-ira CA (2007): Agarose gel electrophoresis of cerebrospi-nal fluid proteins of dogs after sample concentration using a membrane microconcentrator technique. Vet-erinary Clinical Pathology 36, 85–88.
Gan SD, Patel KR (2013): Enzyme immunoassay and en-zyme-linked immunosorbent assay. Journal of Investiga-tive Dermatology 133, e12.
George JW (2001): The usefulness and limitations of hand-held refractometers in veterinary laboratory medicine: An historical and technical review. Veterinary Clinical Pathology 30, 201–210.
George JW, O’Neill SL (2001): Comparison of refractometer and biuret methods for total protein measurement in body cavity fluids. Veterinary Clinical Pathology 30, 16–18.
Gerou-Ferriani M, McBrearty AR, Burchmore RJ, Jayawardena KGI, Eckersall PD, Morris JS (2011): Agarose gel serum pro-tein electrophoresis in cats with and without lymphoma and preliminary results of tandem mass fingerprinting analysis. Veterinary Clinical Pathology 40, 159–173.
Giordano A, Paltrinieri S (2010): Interpretation of capillary zone electrophoresis compared with cellulose acetate and agarose gel electrophoresis: reference intervals and diag-nostic efficiency in dogs and cats. Veterinary Clinical Pathol-ogy 39, 464–473.
Giori L, Tricomi FM, Zatelli A, Roura X, Paltrinieri S (2011): High-resolution gel electrophoresis and sodium dodecyl sulphate-agarose gel electrophoresis on urine samples for qualitative analysis of proteinuria in dogs. Journal of Vet-erinary Diagnostic Investigation 23, 682–690.
Gornall AG, Bardawill CJ, David MN (1949): Determination of serum proteins by means of the Biuret reaction. The Jour-nal of Biological Chemistry 177, 751–766.
Grauer GF (2005): Canine glomerulonephritis: new thoughts on proteinuria and treatment. Journal of Small Animal Prac-tice 46, 469–478.
Green SA, Jenkins SJ, Clark PA (1982): A comparison of chem-ical and electrophoretic methods of serum protein deter-minations in clinically normal domestic animals of various ages. The Cornell Veterinarian 72, 416–426.
Grunberg W, Donkin SS, Constable PD (2011): Periparturient effects of feeding a low dietary cation-anion difference diet on acid-base, calcium, and phosphorus homeostasis and on intravenous glucose tolerance test in high producing dairy cows. Journal of Dairy Science 94, 727–745.

492
Review Article Veterinarni Medicina, 61, 2016 (9): 475–496
doi: 10.17221/19/2016-VETMED
Gundasheva D (2015): Electrophoretic analysis of serum pro-teins in strenuously trained horses revaccinated against equine herpes virus 4/1 and equine influenza virus. Veteri-narija i Zootechnika 69, 18–25.
Gupta A, Stockham SL (2014): Negative interference of icteric serum on a bichromatic biuret total protein assay. Veterinary Clinical Pathology 43, 422–427.
Gupta S, Ahern K, Nakhl F, Forte F (2011): Clinical usefulness of haptoglobin levels to evaluate hemolysis in recently trans-fused patients . Advances in Hematology, DOI: 10.1155/2011/389854.
Hamilton JA, Benson MD (2001): Transthyretin: a review from a structural perspective. Cellular and Molecular Life Sciences 58, 1491–1521.
Hammon HM, Schiessler G, Nussbaum A, Blum JW (2002): Feed intake patterns, growth performance and metabolic and endocrine traits in calves fed unlimited amounts of colostrums and milk by automate strating in the neona-tal period. Journal of Dairy Science 85, 3352–3362.
Hankins J (2006): The role of albumin in fluid and electro-lyte balance. Journal of Infusion Nursing 29, 260–265.
Harris RI, Kohn J (1974): The pre-albumin fraction: A use-ful parameter in the interpretation of routine protein electrophoresis. Journal of Clinical Pathology 27, 986–989.
Harrus S, Waner T, Avidar Y, Bogin E, Peh HC, Bark H (1996): Serum protein alterations in canine ehrlichiosis. Veterinary Parasitology 66, 241–249.
Hogan I, Doherty M, Fagan J, Kennedy E, Conneely M, Brady P, Ryan C, Lorenz I (2015): Comparison of rapid laboratory tests for failure of passive transfer in the bo-vine. Irish Veterinary Journal 68, 18–27.
Ingenbleek Y, Young V (1994): Transthyretin (prealbumin) in health and disease: Nutritional implications. Annual Review of Nutrition 14, 495–533.
Issaq HJ, Conrads TP, Janini GM, Veenstra TD (2002): Methods for fractionation, separation and profiling of proteins and peptides. Electrophoresis 23, 3048–3061.
Jackson DA, Elsawa SF (2015): Factors regulating immuno-globulin production by normal and disease-associated plasma cells. Biomolecules 5, 20–40.
Jacobs RM, Valli VE, Wilkie BN (1980): Serum electropho-resis and immunoglobulin concentrations in cows with lymphoma. American Journal of Veterinary Research 41, 1942–1946.
Jaillardon L, Fournel-Fleury C (2011): Waldenstrom’s mac-roglobulinemia in a dog with a bleeding diathesis. Vet-erinary Clinical Pathology 40, 351–355.
Jain S, Gautam V, Naseem S (2011): Acute phase proteins: As diagnostic tool. Journal of Pharmacy and Bioallied Sciences 3, 118–127.
Janicki B, Kochowicz A, Buzala M, Krumrych W (2013): Variability of selected biochemical parameters in young stallions during the 100-day performance test. Journal of Equine Veterinary Science 33, 1136–1141.
Janku L, Pavlata L, Misurova L, Filipek J, Pechova A, Dvorak R (2011): Levels of protein fractions in blood serum of periparturient goats. Acta Veterinaria Brno 80, 185–190.
Johns JL (2015): Alterations in blood proteins. In: Smith BP (ed.): Large Animal Internal Medicine. 5th edn. Elsevier, St Louis. 386–392.
Johnson AM, Merlini G, Sheldon J, Ichibara K (2007): Clin-ical indications for plasma protein assay: transthyretin (prealbumin) in inflammation and malnutrition. Clinical Chemistry and Laboratory Medicine 45, 419–426.
Joven J, Cliville X, Camps J, Espinel E, Simo J, Vilella E, Oli-ver A (1997): Plasma protein abnormalities in nephritic syndrome: effect on plasma colloid osmotic pressure and viscosity. Clinical Chemistry 43, 1223–1231.
Kaneko JJ (1997): Serum proteins and the dysproteinemias. In: Kaneko JJ (ed.): Clinical Biochemistry of Domestic Animals. 5th edn. Academic Presss, London. 117–138.
Karcher RA, Nuttall KL (2001): Electrophoresis. In: Burtis CA, Ashwood ER (eds): Tietz Fundamentals in Clinical Chemistry. 5th edn. WB Saunders, Philadelphia. 121–132.
Keay G, Doxey DL (1981): Species characteristics of serum proteins demonstrated after agarose gel electrophoresis. Veterinary Research Communications 5, 263–270.
Keay G, Doxey DL (1982): A comparison of the serum protein electrophoretic patterns of young and adult animals. Vet-erinary Research Communications 5, 271–276.
Kennedy S (2001): Proteomic profiling from human samples: the body fluid alternative. Toxicology Letters 120, 379–384.
Kent JE (1987): Specific serum protein changes associated with primary and secondary Strongylus vulgaris infections in pony yearlings. Equine Veterinary Journal 19, 133–137.
Kent JE, Roberts CA (1990): Serum protein changes in four horses with monoclonal gammopathy. Equine Veterinary Journal 22, 373–376.
Keren DF (ed.) (2003): Protein Electrophoresis in Clinical Diagnosis. Edward Arnold Ltd., London. 63–108.
Keren DF, Alexanian R, Goeken JA, Gorevic PD, Kyle RA, Tomar RH (1999): Guidelines for clinical and laboratory evaluation of patients with monoclonal gammopathies. Archives of Pathology and Laboratory Medicine 123, 106–107.
Kessler MA, Meinitzer A, Wolfbeis OS (1997): Albumin blue 580 fluorescence assay for albumin. Analytical Biochem-istry 248, 180–182.
Killip S, Bennett JM, Chambers MD (2007): Iron deficiency anemia. American Family Physician 75, 671–678.
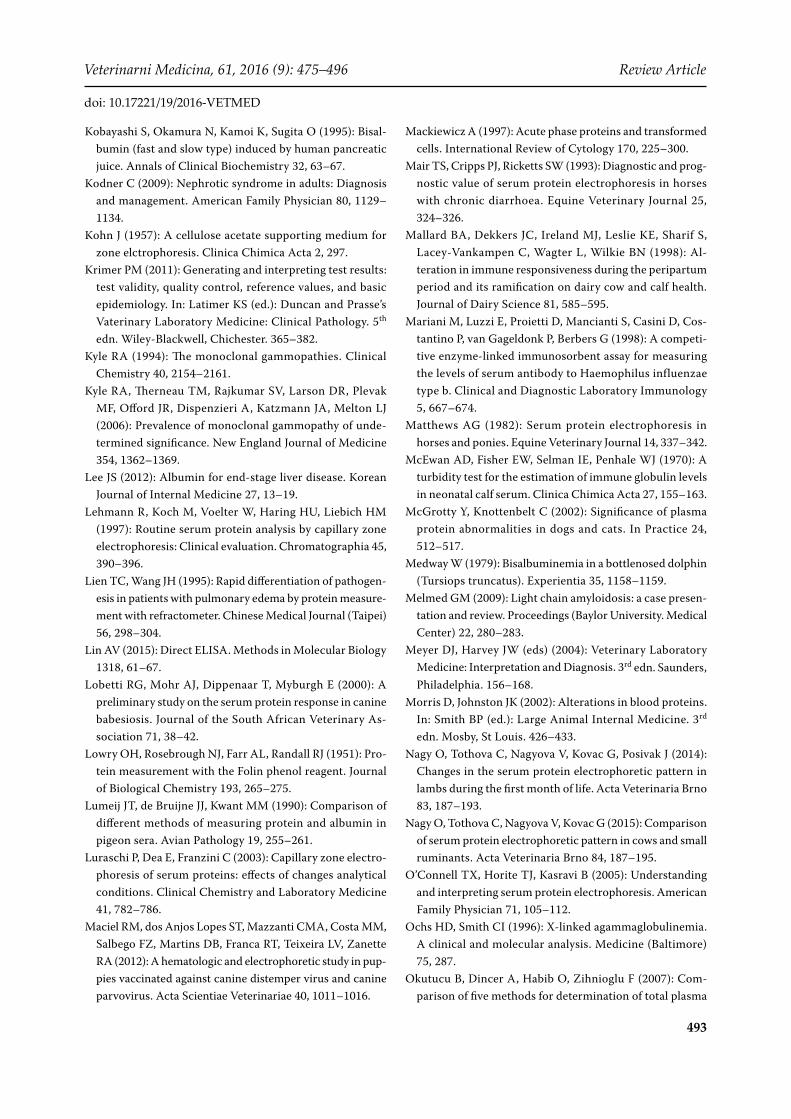
493
Veterinarni Medicina, 61, 2016 (9): 475–496 Review Article
doi: 10.17221/19/2016-VETMED
Kobayashi S, Okamura N, Kamoi K, Sugita O (1995): Bisal-bumin (fast and slow type) induced by human pancreatic juice. Annals of Clinical Biochemistry 32, 63–67.
Kodner C (2009): Nephrotic syndrome in adults: Diagnosis and management. American Family Physician 80, 1129–1134.
Kohn J (1957): A cellulose acetate supporting medium for zone elctrophoresis. Clinica Chimica Acta 2, 297.
Krimer PM (2011): Generating and interpreting test results: test validity, quality control, reference values, and basic epidemiology. In: Latimer KS (ed.): Duncan and Prasse’s Vaterinary Laboratory Medicine: Clinical Pathology. 5th edn. Wiley-Blackwell, Chichester. 365–382.
Kyle RA (1994): The monoclonal gammopathies. Clinical Chemistry 40, 2154–2161.
Kyle RA, Therneau TM, Rajkumar SV, Larson DR, Plevak MF, Offord JR, Dispenzieri A, Katzmann JA, Melton LJ (2006): Prevalence of monoclonal gammopathy of unde-termined significance. New England Journal of Medicine 354, 1362–1369.
Lee JS (2012): Albumin for end-stage liver disease. Korean Journal of Internal Medicine 27, 13–19.
Lehmann R, Koch M, Voelter W, Haring HU, Liebich HM (1997): Routine serum protein analysis by capillary zone electrophoresis: Clinical evaluation. Chromatographia 45, 390–396.
Lien TC, Wang JH (1995): Rapid differentiation of pathogen-esis in patients with pulmonary edema by protein measure-ment with refractometer. Chinese Medical Journal (Taipei) 56, 298–304.
Lin AV (2015): Direct ELISA. Methods in Molecular Biology 1318, 61–67.
Lobetti RG, Mohr AJ, Dippenaar T, Myburgh E (2000): A preliminary study on the serum protein response in canine babesiosis. Journal of the South African Veterinary As-sociation 71, 38–42.
Lowry OH, Rosebrough NJ, Farr AL, Randall RJ (1951): Pro-tein measurement with the Folin phenol reagent. Journal of Biological Chemistry 193, 265–275.
Lumeij JT, de Bruijne JJ, Kwant MM (1990): Comparison of different methods of measuring protein and albumin in pigeon sera. Avian Pathology 19, 255–261.
Luraschi P, Dea E, Franzini C (2003): Capillary zone electro-phoresis of serum proteins: effects of changes analytical conditions. Clinical Chemistry and Laboratory Medicine 41, 782–786.
Maciel RM, dos Anjos Lopes ST, Mazzanti CMA, Costa MM, Salbego FZ, Martins DB, Franca RT, Teixeira LV, Zanette RA (2012): A hematologic and electrophoretic study in pup-pies vaccinated against canine distemper virus and canine parvovirus. Acta Scientiae Veterinariae 40, 1011–1016.
Mackiewicz A (1997): Acute phase proteins and transformed cells. International Review of Cytology 170, 225–300.
Mair TS, Cripps PJ, Ricketts SW (1993): Diagnostic and prog-nostic value of serum protein electrophoresis in horses with chronic diarrhoea. Equine Veterinary Journal 25, 324–326.
Mallard BA, Dekkers JC, Ireland MJ, Leslie KE, Sharif S, Lacey-Vankampen C, Wagter L, Wilkie BN (1998): Al-teration in immune responsiveness during the peripartum period and its ramification on dairy cow and calf health. Journal of Dairy Science 81, 585–595.
Mariani M, Luzzi E, Proietti D, Mancianti S, Casini D, Cos-tantino P, van Gageldonk P, Berbers G (1998): A competi-tive enzyme-linked immunosorbent assay for measuring the levels of serum antibody to Haemophilus influenzae type b. Clinical and Diagnostic Laboratory Immunology 5, 667–674.
Matthews AG (1982): Serum protein electrophoresis in horses and ponies. Equine Veterinary Journal 14, 337–342.
McEwan AD, Fisher EW, Selman IE, Penhale WJ (1970): A turbidity test for the estimation of immune globulin levels in neonatal calf serum. Clinica Chimica Acta 27, 155–163.
McGrotty Y, Knottenbelt C (2002): Significance of plasma protein abnormalities in dogs and cats. In Practice 24, 512–517.
Medway W (1979): Bisalbuminemia in a bottlenosed dolphin (Tursiops truncatus). Experientia 35, 1158–1159.
Melmed GM (2009): Light chain amyloidosis: a case presen-tation and review. Proceedings (Baylor University. Medical Center) 22, 280–283.
Meyer DJ, Harvey JW (eds) (2004): Veterinary Laboratory Medicine: Interpretation and Diagnosis. 3rd edn. Saunders, Philadelphia. 156–168.
Morris D, Johnston JK (2002): Alterations in blood proteins. In: Smith BP (ed.): Large Animal Internal Medicine. 3rd edn. Mosby, St Louis. 426–433.
Nagy O, Tothova C, Nagyova V, Kovac G, Posivak J (2014): Changes in the serum protein electrophoretic pattern in lambs during the first month of life. Acta Veterinaria Brno 83, 187–193.
Nagy O, Tothova C, Nagyova V, Kovac G (2015): Comparison of serum protein electrophoretic pattern in cows and small ruminants. Acta Veterinaria Brno 84, 187–195.
O’Connell TX, Horite TJ, Kasravi B (2005): Understanding and interpreting serum protein electrophoresis. American Family Physician 71, 105–112.
Ochs HD, Smith CI (1996): X-linked agammaglobulinemia. A clinical and molecular analysis. Medicine (Baltimore) 75, 287.
Okutucu B, Dincer A, Habib O, Zihnioglu F (2007): Com-parison of five methods for determination of total plasma

494
Review Article Veterinarni Medicina, 61, 2016 (9): 475–496
doi: 10.17221/19/2016-VETMED
protein concentration. Journal of Biochemical and Bio-physical Methods 70, 709–711.
Orro T, Jacobsen S, LePage JP, Niewold T, Alasuutari S, Sov-eri T (2008): Temporal changes in serum concentrations of acute phase proteins in newborn dairy calves. Veterinary Journal 176, 182–187.
Pagana KD, Pagana TJ (eds) (2006): Mosby’s Manual of Di-agnostic and Laboratory Tests. 4th edn. Mosby Elsevier, St Louis. 1267 pp.
Paltrinieri S, Giordano A, Villani M, Manfrin M, Panzani S, Veronesi MC (2008): Influence of age and foaling on plasma protein electrophoresis and serum amyloid A and their possible role as markers of equine neonatal septicaemia. Veterinary Journal 176, 393–396.
Perille AL, Matus RE (1991): Canine ehrlichiosis in six dogs with persistently increased antibody titers. Journal of Vet-erinary Internal Medicine 5, 195–198.
Perryman LE, McGuire TC, Banks KL (1983): Animal model of human disease. Infantile X-linked agammaglobulinemia. Agammaglobulinemia in horses. American Journal of Pa-thology 111, 125–127.
Petersen HH, Nielsen JP, Heegaard PMH (2004): Application of acute phase protein measurements in veterinary clinical chemistry. Veterinary Research 35, 136–187.
Petersen JR, Okorodudu AO, Mohammad A, Payne DA (2003): Capillary electrophoresis and its application in the clinical laboratory. Clinica Chimica Acta 330, 1–30.
Perez JM, Gonzalez FJ, Granados JE, Perez MC, Fandos P, Soriguer RC, Serrano E (2003): Hematologic and biochem-ical reference intervals for Spanish ibex. Journal of Wildlife Diseases 39, 209–215.
Pfeiffer NE, McGuire TC (1977): A sodium sulfite-precipi-tation test for the assessment of colostral immunoglobulin transfer to calves. Journal of the American Veterinary Medical Association 170, 809–811.
Piccione G, Casella S, Giannetto C, Monteverde V (2009): Exercise-induced modifications on haematochemical and electrophoretic parameters during 1600 and 2000 meters trot races in standardbred horses. Journal of Applied An-imal Research 35, 131–135.
Piccione G, Messina V, Schembari A, Casella S, Giannetto C, Alberghina D (2011): Pattern of serum protein fractions in dairy cows during different stages of gestation and lac-tation. Journal of Dairy Research 78, 421–425.
Piccione G, Messina V, Alberghina D, Giannetto C, Caselle S, Assenza A (2012a): Seasonal variations in serum protein fractions of dairy cows during different physiological phases. Comparative Clinical Pathology 21, 1439–1443.
Piccione G, Alberghina D, Marafioti S, Giannetto C, Casella S, Assanza A, Fazio F (2012b): Electrophoretic serum pro-tein fraction profile during the different physiological
phases in Comisana ewes. Reproduction in Domestic Animals 47, 591–595.
Pieper R, Gatlin CL, Makusky AJ, Russo PS, Schatz CR, Miller SS, Su Q, McGrath AM, Estock MA, Parmar PP, Zhao M, Huang ST, Zhou J, Wang F, Esquer-Blasco R, Anderson NL, Taylor J, Steiner S (2003): The human serum proteome: dis-play of nearly 3700 chromatographically separated protein spots on two-dimensional electrophoresis gels and identi-fication of 325 distinct proteins. Proteomics 3, 1345–1364.
Prinsen BH (2004): Albumin turnover: experimental ap-proach and its application in health and renal diseases. Clinica Chimica Acta 347, 1–14.
Revillard JP (1980): Significance of beta 2-microglobulin in liver diseases. Vox Sanguinis 38, 339–342.
Riond B, Wenger-Riggenbach B, Hofmann-Lehmann R, Lutz H (2009): Serum protein concentrations from clinically healthy horses determined by agarose gel electrophoresis. Veterinary Clinical Pathology 38, 73–77.
Romdane MN, Romdhane SB, Jemli MH, Metoui K (1992): Electrophoretic profiles of serum proteins in dogs leish-maniasis (in French). Revue de Medecine Veterinarie 143, 753–755.
Rossi S, Bertazzolo W, Paltrinieri S, Giordano A (2008): Cellulose acetate electrophoresis of canine plasma after fibrinogen precipitation by ethanol. Veterinary Clinical Pathology 37, 422–428.
Roubies N, Panouis N, Fytianou A, Katsoulos PD, Giadinis H (2006): Effects of age and reproductive stage on certain serum biochemical parameters of Chios sheep under greek rearing conditions. Journal Veterinary Medicine A 53, 277–281.
Sapan CV, Lundblad RL, Price NC (1999): Colorimetric protein assay techniques. Biotechnology and Applied Biochemistry 29, 99–108.
Schrader M, Schulz-Knappe P (2001): Peptidomics tech-nologies for human body fluids. Trends in Biotechnology 19, S55–S60.
Schroeder HW, Cavacini L (2010): Structure and function of immunoglobulins. Journal of Allergy and Clinical Im-munology 125, S41–S52.
Sedlinska M, Krejci J, Vyskocil M (2005): Evaluation of field methods for determining immunoglobulins in sucking foals. Acta Veterinaria Brno 74, 51–58.
Sheldon IM, Noakes DE, Rycroft A, Dobson H (2001): Acute phase protein responses to uterine bacterial contamination in cattle after calving. Veterinary Record 148, 172–175.
Shetty JK, Prakash M, Gopalakarishna K (2007): Bisalbu-minemia in adult male with Alzheimer’s disease. Indian Journal of Medical Sciences 61, 356–357.
Slev PR, Williams BG, Harville TO, Ashwood ER, Bomhorst JA (2008): Efficacy of the detection of the alpha1-antitrypsin

495
Veterinarni Medicina, 61, 2016 (9): 475–496 Review Article
doi: 10.17221/19/2016-VETMED
„Z“ deficiency variant be routine serum protein electropho-resis. American Journal of Clinical Pathology 130, 568–572.
Spano JS, Whitesides JF, Pedersoli WM, Kristal LM (1988): Comparative albumin determinations in ducks, chickens, and turkeys by electrophoretic and dye-binding methods. American Journal of Veterinary Research 49, 325–326.
Stockham SL, Scott MA (2002): Fundamentals of veterinary clinical pathology. Iowa State Press, Ames. 251–276.
Swindle MM, Sistino JJ (2015): Anesthesia, analgesia, and perioperative care. In: Swindle MM, Smith AC (eds): Swine in the Laboratory: Surgery, Anesthesia, Imaging, and Experimental Techniques. 3rd edn. CRC Press, New York. 39–88.
Switzer R, Garrity L (eds) (1999): Experimental biochemistry. 3rd edn. WH Freemand and Company, New York. 451 pp.
Tappin SW, Taylor SS, Tasker S, Dodkin SJ, Papasouliotis K, Murphy KF (2011): Serum protein electrophoresis in 147 dogs. Veterinary Record 168, 456.
Tecles F, Spirane I, Bonfanti U, Ceron JJ, Paltrinieri S (2005): Preliminary studies of serum acute-phase protein concen-trations in hematologic and neoplastic diseases of the dog. Journal of Veterinary Internal Medicine 19, 865–870.
Thomas LA, Brown SA (1992): Relationship between colloid osmotic pressure and plasma protein concentration in cat-tle, horses, dogs, and cats. American Journal of Veterinary Research 53, 2241–2244.
Tiselius A (1937): Electrophoresis of serum globulin II. Elec-trophoretic analysis of normal and immune sera. Biochem-ical Journal 31, 1464–1477.
Tothova C, Nagy O, Seidel H, Kovac G (2013a): Serum pro-tein electrophoretic pattern in clinically healthy calves and cows determined by agarose gel electrophoresis. Com-parative Clinical Pathology 22, 15–20.
Tothova C, Nagy O, Kovac G (2013b): The serum protein electrophoretic pattern and acute phase protein concentra-tions in calves with chronic respiratory diseases. Acta Veterinaria Beograd 63, 473–486.
Tothova C, Nagy O, Kovac G (2014): Acute phase proteins and their use in the diagnosis of diseases in ruminants: a review. Veterinarni Medicina 59, 163–180.
Tothova C, Nagy O, Kovac G, Nagyova V (2016a): Changes in the concentrations of serum proteins in calves during the first month of life. Journal of Applied Animal Research 44, 338–346.
Tothova C, Nagy O, Nagyova V, Kovac G (2016b): The concen-trations of selected blood serum proteins in calves during the first three months of life. Acta Veterinaria Brno 85, 33–40.
Turba F, Enekel HJ (1950): Elektrophorese von Proteinen in Filterpapier. Naturwissenschaften 37, 93.
Tymchak LL (2010): Amino acids and proteins. In: Bishop ML, Fody EP, Schoeff LE (eds): Clinical Chemistry: Tech-
niques, Principles, Correlations. 6th edn. Lippincott Wil-liams and Wilkins, Philadelphia. 223–265.
Vavricka SR, Burri E, Beglinger C, Degen L, Manz M (2009): Serum protein electrophoresis: An underused but very useful test. Digestion 79, 203–210.
Vreugdenhil ACE, Dentener MA, Snoek AMP, Greve JWM, Buurman WA (1999): Lipopolysaccharide binding protein and serum amyloid A secretion by human intestinal epi-thelial cells during the acute phase response. Journal of Immunology 163, 2792–2798.
Watanabe A, Matsuzaki S, Moriwaki H, Suzuki K, Nishi-guchi S (2004): Problems in serum albumin measurement and clinical significance of albumin microheterogeneity in cirrhotics. Nutrition 20, 351–357.
Weaver DM, Tyler JW, VanMetre DC, Hostetler DE, Bar-rington GM (2000): Passive transfer of colostral immuno-globulins in calves. Journal of Veterinary Internal Medicine 14, 569–577.
Webb J, Chary P, Northtrup N, Almy F (2008): Erythrophago-cytic multiple myeloma in a cat. Veterinary Clinical Pathol-ogy 37, 302–307.
Weiss BM, Abadie J, Verma P, Howard RS, Kuehl WM (2009): A monoclonal gammopathy precedes multiple myeloma in most patients. Blood 113, 5418–5422.
Werner LL, Reavill DR (1999): The diagnostic utility of se-rum protein electrophoresis. Veterinary Clinics of North America: Exotic Animal Practice 2, 651–662.
Wilson K, Walker J (eds) (2000): Practical Biochemistry: Principles and Techniques. 5th edn. Cambridge University Press, Cambridge. 784 pp.
Woolf A, Nadler CF, Kradel DC (1973): Serum protein elec-trophoresis in bighorn sheep with chronic pneumonia. Journal of Wildlife Diseases 9, 7–11.
Wrotnowski C (1998): The future of plasma proteins. Ge-netic Engineering News 18, 14.
Yamada O, Tamura K, Yagihara H, Isotani M, Azakami M, Sawada S, Ono K, Washizu T, Bonkobara M (2007): Light-chain multiple myeloma in a cat. Journal of Veterinary Diagnostic Investigation 19, 443–447.
Yoshida Y (1991): Electrophoretic studies on serum proteins in cows with traumatic pericarditis. Journal of Veterinary Medical Science 53, 5–11.
Yuki M, Itoh H, Takase K (2010): Serum α-1-acid glycopro-tein concentration in clinically healthy puppies and adult dogs and in dogs with various diseases. Veterinary Clin-ical Pathology 39, 65–71.
Zaia DAM, Zaia CTBV, Lichtig J (1998): Determination of total protein by spectrophotometry: advantages and disad-vantages of proposed methods. Quimica Nova 21, 787–793.
Zaia DAM, Marques FR, Zaia CTB (2005): Spectrophoto-metric determination of total proteins in blood plasma:
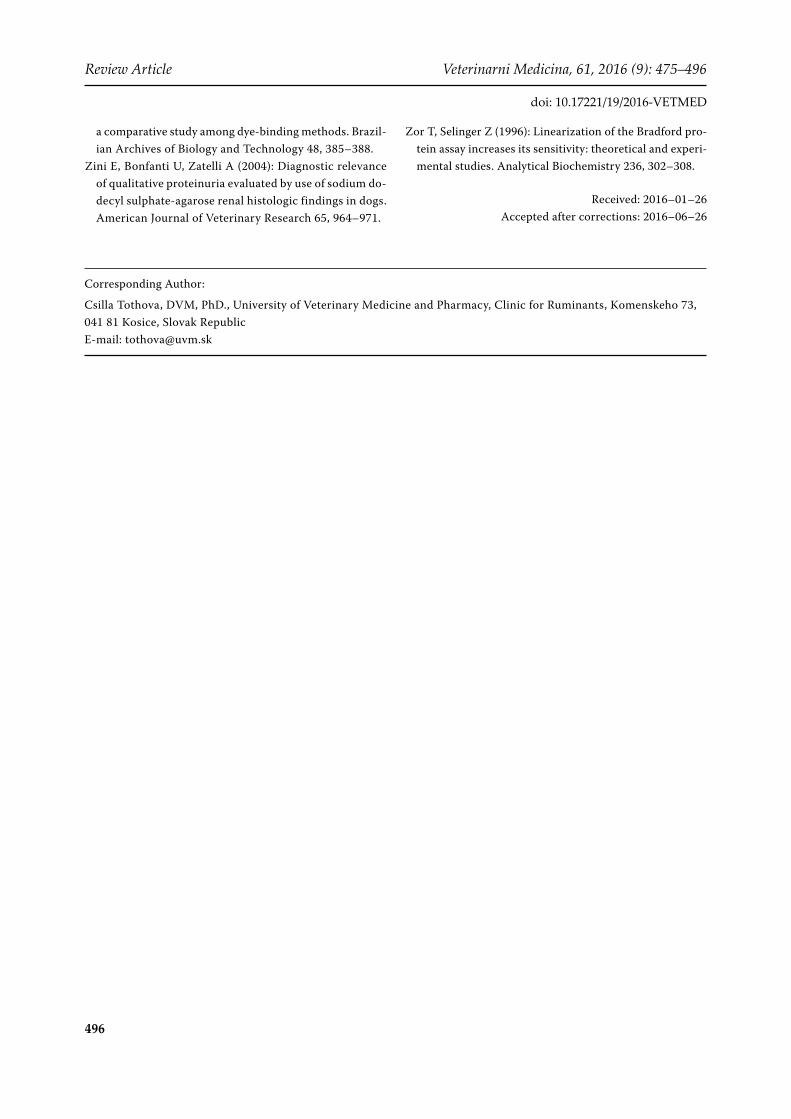
496
Review Article Veterinarni Medicina, 61, 2016 (9): 475–496
doi: 10.17221/19/2016-VETMED
a comparative study among dye-binding methods. Brazil-ian Archives of Biology and Technology 48, 385–388.
Zini E, Bonfanti U, Zatelli A (2004): Diagnostic relevance of qualitative proteinuria evaluated by use of sodium do-decyl sulphate-agarose renal histologic findings in dogs. American Journal of Veterinary Research 65, 964–971.
Zor T, Selinger Z (1996): Linearization of the Bradford pro-tein assay increases its sensitivity: theoretical and experi-mental studies. Analytical Biochemistry 236, 302–308.
Received: 2016–01–26Accepted after corrections: 2016–06–26
Corresponding Author:
Csilla Tothova, DVM, PhD., University of Veterinary Medicine and Pharmacy, Clinic for Ruminants, Komenskeho 73, 041 81 Kosice, Slovak RepublicE-mail: [email protected]