Embed Size (px)
Citation preview
Economic Research Service
Economic Information BulletinNumber 220
December 2020
America’s DiverseFamily Farms2020 Edition
Images used in this publication are a derivative of images from Getty Images.
Use of commercial and trade names does not imply approval or constitute endorsement by USDA.
To ensure the quality of its research reports and satisfy governmentwide standards, ERS requires that all research reports with substantively new material be reviewed by qualified technical research peers. This technical peer review process, coordinated by ERS’ Peer Review Coordinating Council, allows experts who possess the tech-nical background, perspective, and expertise to provide an objective and meaningful assessment of the output’s substantive content and clarity of communication during the publication’s review.
In accordance with Federal civil rights law and U.S. Department of Agriculture (USDA) civil rights regulations and policies, the USDA, its Agencies, offices, and employees, and institutions participating in or administering USDA programs are prohibited from discriminating based on race, color, national origin, religion, sex, gender identity (including gender expression), sexual orientation, disability, age, marital status, family/parental status, income de-rived from a public assistance program, political beliefs, or reprisal or retaliation for prior civil rights activity, in any program or activity conducted or funded by USDA (not all bases apply to all programs). Remedies and complaint filing deadlines vary by program or incident.
Persons with disabilities who require alternative means of communication for program information (e.g., Braille, large print, audiotape, American Sign Language, etc.) should contact the responsible Agency or USDA’s TARGET Center at (202) 720-2600 (voice and TTY) or contact USDA through the Federal Relay Service at (800) 877-8339. Additionally, program information may be made available in languages other than English.
To file a program discrimination complaint, complete the USDA Program Discrimination Complaint Form, AD-3027, found online at How to File a Program Discrimination Complaint and at any USDA office or write a letter addressed to USDA and provide in the letter all of the information requested in the form. To request a copy of the complaint form, call (866) 632-9992. Submit your completed form or letter to USDA by: (1) mail: U.S. Department of Agriculture, Office of the Assistant Secretary for Civil Rights, 1400 Independence Avenue, SW, Washington, D.C. 20250-9410; (2) fax: (202) 690-7442; or (3) email: [email protected].
USDA is an equal opportunity provider, employer, and lender.
For further information, contact
Christine E. Whitt (202) 694-5288 [email protected]
Jessica E. Todd (202) 694-5363 [email protected]
James M. MacDonald (202) 694-5610 [email protected]
Broad descriptions of farms based on U.S.
averages can mask variations among farm
sizes and types. For example, in 2019,
the average value of production on the 2
million U.S. farms amounted to $168,218.
Few farms, however, are near the average:
Almost half of the farms had production
valued at $6,000 or less, while more than
60 percent of all production occurred on
farms with at least $1 million of agricultural
output.
This report uses a farm classification, or
typology, developed by USDA’s Econom-
ic Research Service (ERS) to categorize
farms into more homogeneous groupings
to better understand conditions across the
Nation’s diverse farm sector. The clas-
sification is based largely on the annual
revenue of the farm, the main occupation
of the farm’s principal producer, and family
or non-family ownership of the farm. In
this report, there are many sections that
appear every year. The data and statistics
for these sections are generally similar
across the years. The operating profit
margin section has varied the most over
the years because of the variability in the
farm economy.
America’s Diverse Family Farms: 2020 Edition2
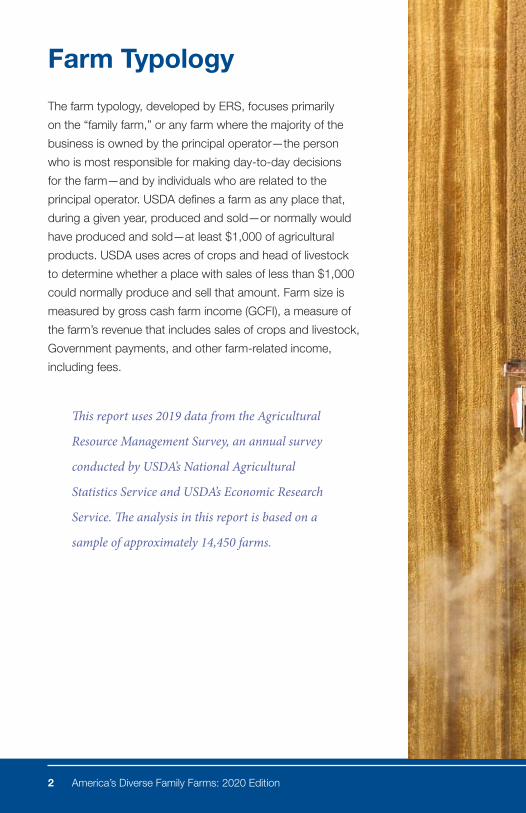
Farm Typology
The farm typology, developed by ERS, focuses primarily
on the “family farm,” or any farm where the majority of the
business is owned by the principal operator—the person
who is most responsible for making day-to-day decisions
for the farm—and by individuals who are related to the
principal operator. USDA defines a farm as any place that,
during a given year, produced and sold—or normally would
have produced and sold—at least $1,000 of agricultural
products. USDA uses acres of crops and head of livestock
to determine whether a place with sales of less than $1,000
could normally produce and sell that amount. Farm size is
measured by gross cash farm income (GCFI), a measure of
the farm’s revenue that includes sales of crops and livestock,
Government payments, and other farm-related income,
including fees.
This report uses 2019 data from the Agricultural
Resource Management Survey, an annual survey
conducted by USDA’s National Agricultural
Statistics Service and USDA’s Economic Research
Service. The analysis in this report is based on a
sample of approximately 14,450 farms.
America’s Diverse Family Farms: 2020 Edition 3
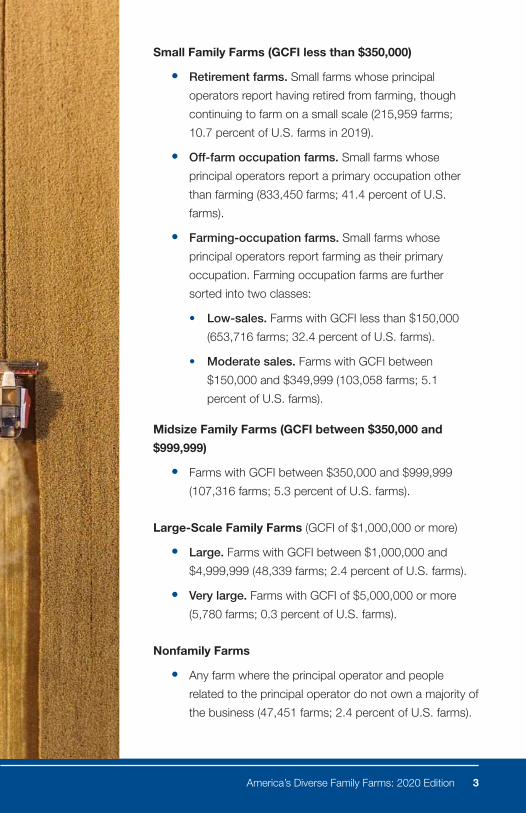
Small Family Farms (GCFI less than $350,000)
• Retirement farms. Small farms whose principal
operators report having retired from farming, though
continuing to farm on a small scale (215,959 farms;
10.7 percent of U.S. farms in 2019).
• Off-farm occupation farms. Small farms whose
principal operators report a primary occupation other
than farming (833,450 farms; 41.4 percent of U.S.
farms).
• Farming-occupation farms. Small farms whose
principal operators report farming as their primary
occupation. Farming occupation farms are further
sorted into two classes:
• Low-sales. Farms with GCFI less than $150,000
(653,716 farms; 32.4 percent of U.S. farms).
• Moderate sales. Farms with GCFI between
$150,000 and $349,999 (103,058 farms; 5.1
percent of U.S. farms).
Midsize Family Farms (GCFI between $350,000 and
$999,999)
• Farms with GCFI between $350,000 and $999,999
(107,316 farms; 5.3 percent of U.S. farms).
Large-Scale Family Farms (GCFI of $1,000,000 or more)
• Large. Farms with GCFI between $1,000,000 and
$4,999,999 (48,339 farms; 2.4 percent of U.S. farms).
• Very large. Farms with GCFI of $5,000,000 or more
(5,780 farms; 0.3 percent of U.S. farms).
Nonfamily Farms
• Any farm where the principal operator and people
related to the principal operator do not own a majority of
the business (47,451 farms; 2.4 percent of U.S. farms).
America’s Diverse Family Farms: 2020 Edition4
Farms, Production, and Farmland
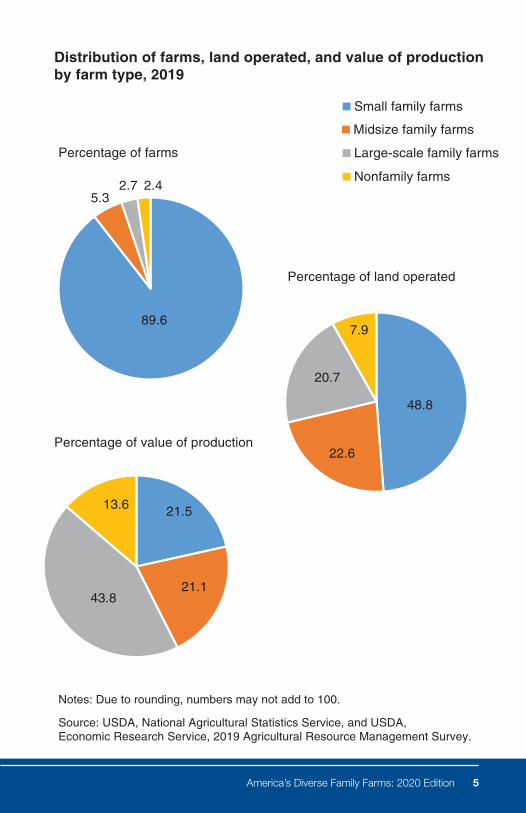
Most U.S. farms are small; small farms operate almost half of U.S.
farmland and account for 22 percent of production.
• Approximately 90 percent of the farms are small. In 2019, small
farms accounted for 49 percent of the land operated by farms.
• Large-scale family farms accounted for the largest share of
production, at 44 percent.
• Family farms as a group, across type, accounted for 98 percent
of farms and 86 percent of production in 2019.
• Nonfamily farms accounted for the remaining farms (2 percent)
and production (14 percent). Fifteen percent of nonfamily farms
had GCFI of $1 million or more. Such farms accounted for 87
percent of nonfamily farms’ production. Examples of nonfamily
farms include partnerships of unrelated partners, closely held
nonfamily corporations, farms with a hired producer unrelated to
the owners, and publicly held corporations.
America’s Diverse Family Farms: 2020 Edition 5
89.6
5.32.7 2.4
Percentage of farms
Small family farms
Large-scale family farms
Midsize family farms
Nonfamily farms
Distribution of farms, land operated, and value of production by farm type, 2019
48.8
22.6
20.7
7.9
Percentage of land operated
21.5
21.143.8
13.6
Percentage of value of production
Notes: Due to rounding, numbers may not add to 100.
Source: USDA, National Agricultural Statistics Service, and USDA, Economic Research Service, 2019 Agricultural Resource Management Survey.
America’s Diverse Family Farms: 2020 Edition6
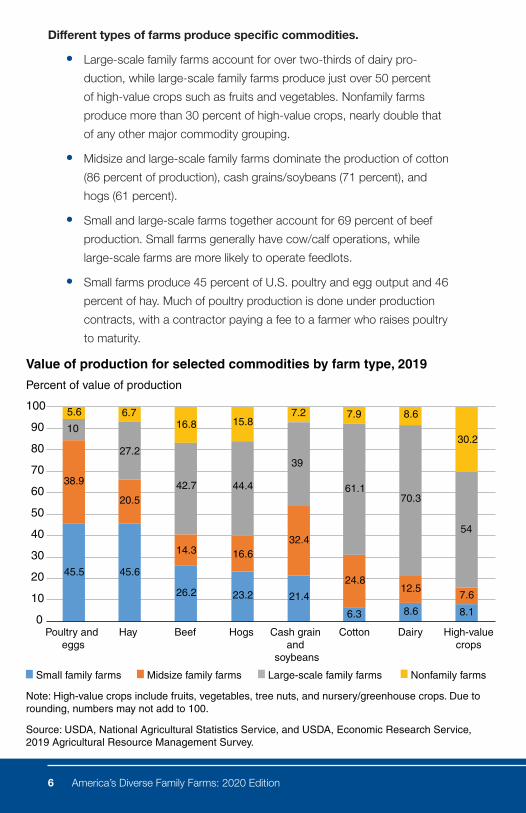
Different types of farms produce specific commodities.
• Large-scale family farms account for over two-thirds of dairy pro-
duction, while large-scale family farms produce just over 50 percent
of high-value crops such as fruits and vegetables. Nonfamily farms
produce more than 30 percent of high-value crops, nearly double that
of any other major commodity grouping.
• Midsize and large-scale family farms dominate the production of cotton
(86 percent of production), cash grains/soybeans (71 percent), and
hogs (61 percent).
• Small and large-scale farms together account for 69 percent of beef
production. Small farms generally have cow/calf operations, while
large-scale farms are more likely to operate feedlots.
• Small farms produce 45 percent of U.S. poultry and egg output and 46
percent of hay. Much of poultry production is done under production
contracts, with a contractor paying a fee to a farmer who raises poultry
to maturity.
Value of production for selected commodities by farm type, 2019
Percent of value of production
5.6100
90
80
70
60
50
40
30
20
10
0Poultry and
eggsHay Beef Hogs Cotton Dairy High-value
cropsCash grain
and soybeans
10
38.9
20.5
27.2
6.7
8.6 8.1
7.6
54
30.2
6.3
24.8
61.1
7.2 7.9 8.6
70.3
12.5
39
16.8
42.7
14.3
26.2 23.2
16.632.4
21.4
44.4
15.8
45.5 45.6
Small family farms
Note: High-value crops include fruits, vegetables, tree nuts, and nursery/greenhouse crops. Due to rounding, numbers may not add to 100.
Source: USDA, National Agricultural Statistics Service, and USDA, Economic Research Service, 2019 Agricultural Resource Management Survey.
Large-scale family farmsMidsize family farms Nonfamily farms
America’s Diverse Family Farms: 2020 Edition 7
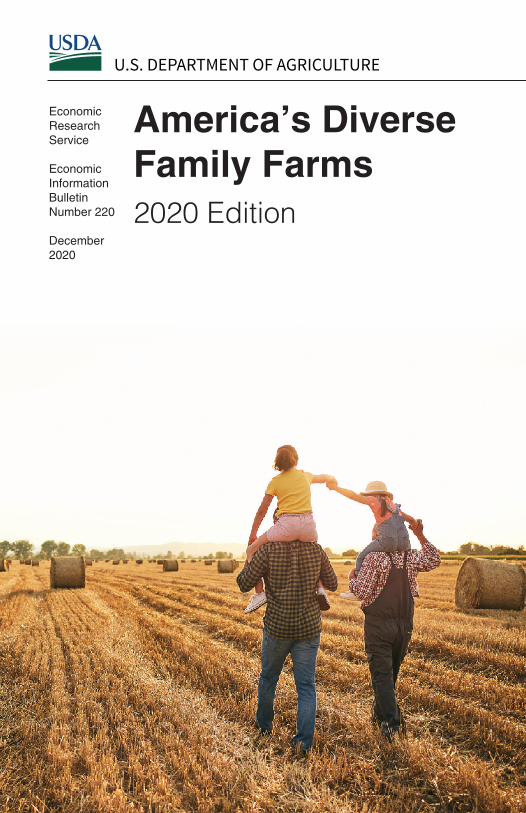
Farm Financial Performance
Financial performance varies across farm size. Most small farms have
an operating profit margin (OPM) in the red zone—indicating a higher
risk of financial problems—while most midsize, large, and very large
farms operate in a lower financial risk zone. (See figure figure below for
the definition of OPM.)
• Between 62 and 81 percent of small family farms—depending on
the farm type—had an OPM in the high-risk red zone. Many small
farms, however, have operators who do not consider farming to be
their primary occupation and who receive little or no cash income from
farming. Instead, these small farms receive substantial income from off-
farm sources. Income from off-farm sources are not reflected in OPM.
• Between 9 and 23 percent of small farms operate in the low-risk green
zone, while a larger share, between 28 and 39 percent of midsize, large,
and very large farms operate in the low-risk green zone.

America’s Diverse Family Farms: 2020 Edition8
Farms by operating profit margin and farm type, 2019
Percent of farms in group
100
90
80
70
60
50
40
30
20
10
0
Low risk level (OPM>25%)High risk level (OPM<10%)
Medium risk level (OPM 10% to 25%) Ratio not calculated
6.41.3
5.4 6.3
20.4
31.3
21.9
39.2
28.4 20.7
5
14.2
7.2
73.6
8.3
69.7
35.6
36
23.3
37.5
46.8
16.9
62.5
8.9
3.9
80.9
11.2
5.7
77.8
23.4
6.1
64.1
Retirement Off-farmoccupation
Low sales Moderatesales
Midsizefamiliyfarms
Large Very large
Large-scale family farms Small family farms
Nonfamilyfarms
All farms
Notes: Due to rounding, sums may not add to 100 percent. Operating profit margin (OPM)=100 X (net farm income + interest paid charges for unpaid labor and management)/gross farm income. OPM ratios are not calculated for operations with zero gross farm income.
Source: USDA, National Agricultural Statistics Service, and USDA, Economic Research Service, 2019 Agricultural Resource Management Survey.
America’s Diverse Family Farms: 2020 Edition 9
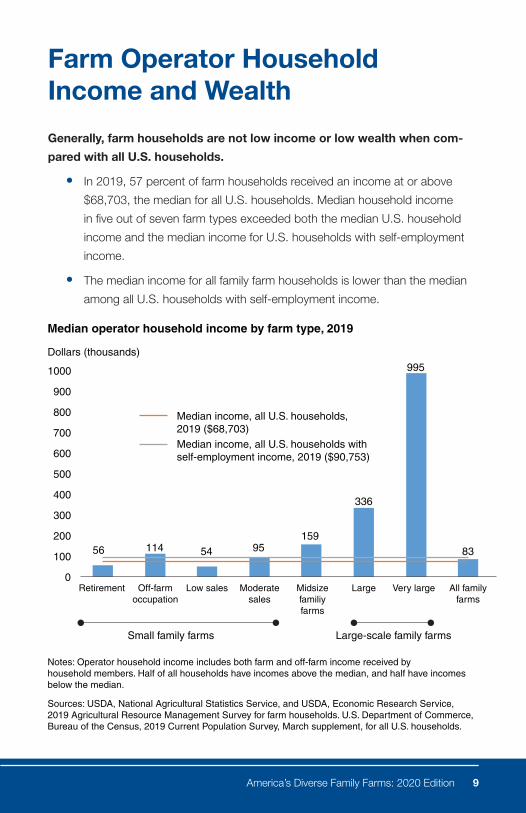
Farm Operator Household Income and Wealth
Generally, farm households are not low income or low wealth when com-
pared with all U.S. households.
• In 2019, 57 percent of farm households received an income at or above
$68,703, the median for all U.S. households. Median household income
in five out of seven farm types exceeded both the median U.S. household
income and the median income for U.S. households with self-employment
income.
• The median income for all family farm households is lower than the median
among all U.S. households with self-employment income.
Median operator household income by farm type, 2019
1000
900
800
700
600
500
400
300
56 114 54 95159
336
995
83200
100
0Retirement Off-farm
occupationLow sales Moderate
salesMidsizefamiliyfarms
Large Very large
Large-scale family farms Small family farms
All familyfarms
Median income, all U.S. households,2019 ($68,703)
Dollars (thousands)
Median income, all U.S. households withself-employment income, 2019 ($90,753)
Notes: Operator household income includes both farm and off-farm income received by household members. Half of all households have incomes above the median, and half have incomes below the median.
Sources: USDA, National Agricultural Statistics Service, and USDA, Economic Research Service, 2019 Agricultural Resource Management Survey for farm households. U.S. Department of Commerce, Bureau of the Census, 2019 Current Population Survey, March supplement, for all U.S. households.
America’s Diverse Family Farms: 2020 Edition10
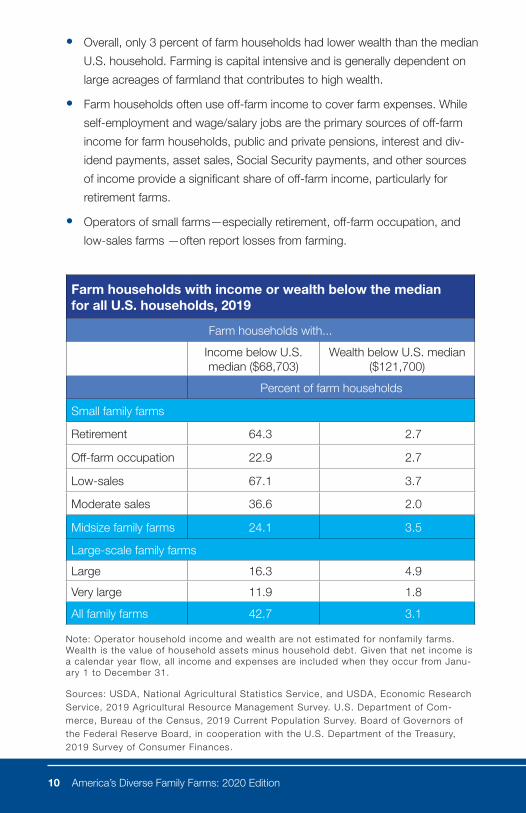
• Overall, only 3 percent of farm households had lower wealth than the median
U.S. household. Farming is capital intensive and is generally dependent on
large acreages of farmland that contributes to high wealth.
• Farm households often use off-farm income to cover farm expenses. While
self-employment and wage/salary jobs are the primary sources of off-farm
income for farm households, public and private pensions, interest and div-
idend payments, asset sales, Social Security payments, and other sources
of income provide a significant share of off-farm income, particularly for
retirement farms.
• Operators of small farms—especially retirement, off-farm occupation, and
low-sales farms —often report losses from farming.
Farm households with income or wealth below the median for all U.S. households, 2019
Farm households with...
Income below U.S. median ($68,703)
Wealth below U.S. median ($121,700)
Percent of farm households
Small family farms
Retirement 64.3 2.7
Off-farm occupation 22.9 2.7
Low-sales 67.1 3.7
Moderate sales 36.6 2.0
Midsize family farms 24.1 3.5
Large-scale family farms
Large 16.3 4.9
Very large 11.9 1.8
All family farms 42.7 3.1 Note: Operator household income and wealth are not estimated for nonfamily farms. Wealth is the value of household assets minus household debt. Given that net income is a calendar year flow, all income and expenses are included when they occur from Janu-ary 1 to December 31.
Sources: USDA, National Agricultural Statistics Service, and USDA, Economic Research Service, 2019 Agricultural Resource Management Survey. U.S. Department of Com-merce, Bureau of the Census, 2019 Current Population Survey. Board of Governors of the Federal Reserve Board, in cooperation with the U.S. Department of the Treasury, 2019 Survey of Consumer Finances.
America’s Diverse Family Farms: 2020 Edition 11
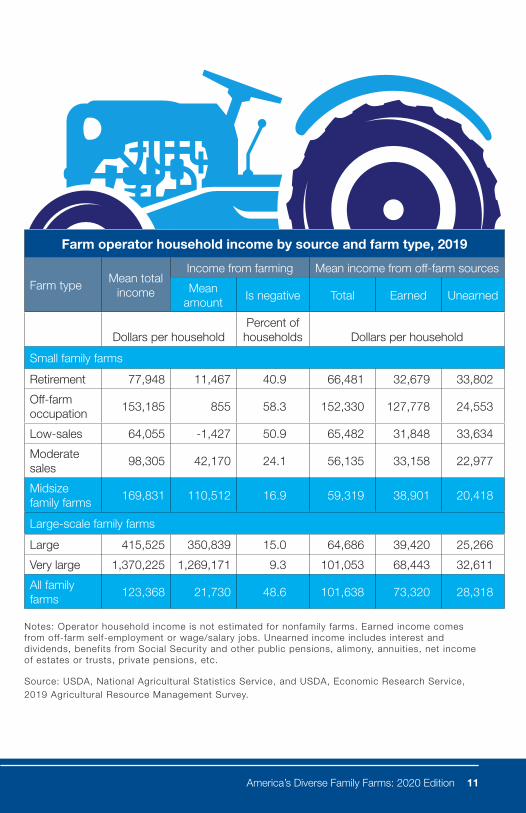
Notes: Operator household income is not estimated for nonfamily farms. Earned income comes from off-farm self-employment or wage/salary jobs. Unearned income includes interest and dividends, benefits from Social Security and other public pensions, alimony, annuities, net income of estates or trusts, private pensions, etc.
Source: USDA, National Agricultural Statistics Service, and USDA, Economic Research Service, 2019 Agricultural Resource Management Survey.
Farm operator household income by source and farm type, 2019
Farm typeMean total
income
Income from farming Mean income from off-farm sources
Mean amount
Is negative Total Earned Unearned
Dollars per householdPercent of households Dollars per household
Small family farms
Retirement 77,948 11,467 40.9 66,481 32,679 33,802
Off-farm occupation
153,185 855 58.3 152,330 127,778 24,553
Low-sales 64,055 -1,427 50.9 65,482 31,848 33,634
Moderate sales
98,305 42,170 24.1 56,135 33,158 22,977
Midsize family farms
169,831 110,512 16.9 59,319 38,901 20,418
Large-scale family farms
Large 415,525 350,839 15.0 64,686 39,420 25,266
Very large 1,370,225 1,269,171 9.3 101,053 68,443 32,611
All family farms
123,368 21,730 48.6 101,638 73,320 28,318
America’s Diverse Family Farms: 2020 Edition12
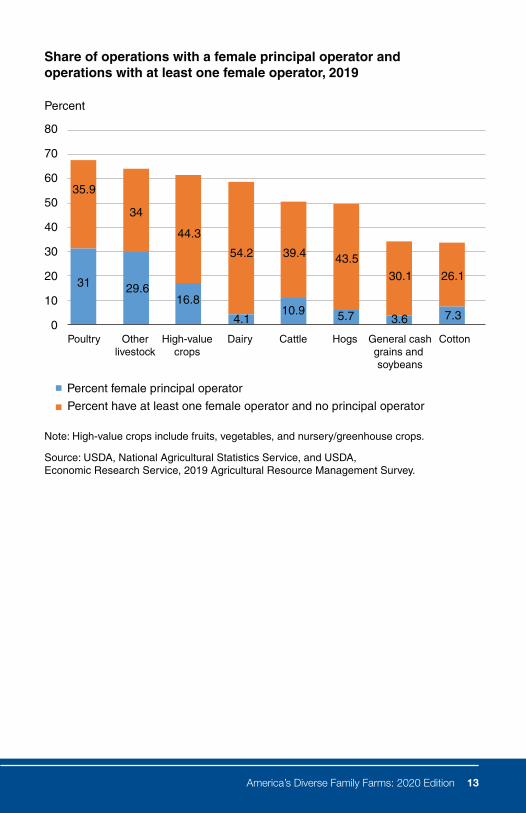
Women in Agriculture
Female principal operators and operations with female operators make up a
significant share of livestock and high-value crop operations.
• Women are operators in more than half (51 percent) of all farming operations.
Women are the principal operators on 14 percent of operations, and another
37 percent of operations have female operators who were not identified by
the respondent as the principal operator.
• Operations with principal female operators contributed just over 4 percent of
the total value of production in 2019. In addition, the highest share of principal
female operators is found among farms specializing in poultry and other
livestock (including horses, bees, sheep, lambs, goats, etc.), at 31 and 30
percent, respectively.
• Women comprise only 4 percent of the principal operators on dairy specializ-
ing operations, but overall, women are principal operators or operators on 58
percent of all farms specializing in dairy.
• Among operations with at least one female operator, 78 percent of those fe-
male operators are the spouse of the principal operator and work on the farm.
America’s Diverse Family Farms: 2020 Edition 13
Share of operations with a female principal operator and operations with at least one female operator, 2019
80
70
60
50
40
30
20
10
0Poultry
Percent female principal operator
Percent have at least one female operator and no principal operator
Otherlivestock
High-valuecrops
Dairy Cattle Hogs General cashgrains and soybeans
Cotton
Percent
Note: High-value crops include fruits, vegetables, and nursery/greenhouse crops.
Source: USDA, National Agricultural Statistics Service, and USDA, Economic Research Service, 2019 Agricultural Resource Management Survey.
35.9
29.6
34
44.3
54.2
4.1
39.4
10.9 5.7
43.5
30.1
3.6
26.1
7.316.8
31
America’s Diverse Family Farms: 2020 Edition14
Definition of Direct Sales
Direct sales are the sales of commodities produced, raised, or
grown on the farm and sold either direct to the consumer or to
intermediary supply chains that sold directly to individuals (such as
retail outlets and regional distributors) or to institutions (such as
schools and hospitals). A supply chain is the sequence of processes
involved in the production and distribution of a commodity. Christ-
mas trees and flowers, nursery products, craft items, and processed
products such as jell ies, sausages, and hams are excluded from the
analysis of direct sales. Also, commodities produced under produc-
tion contracts are excluded from this analysis. Direct sales of l ive-
stock include sell ing a pre-determined size share of l ivestock that is
raised on the farm and processed for the consumer.
Because a small share of operations participate in direct sales and
these operations are quite small, different gross cash farm income
cutoffs are used to group direct sales operations in place of the
GCFI cutoffs used earlier for the overall farm typology.
America’s Diverse Family Farms: 2020 Edition 15
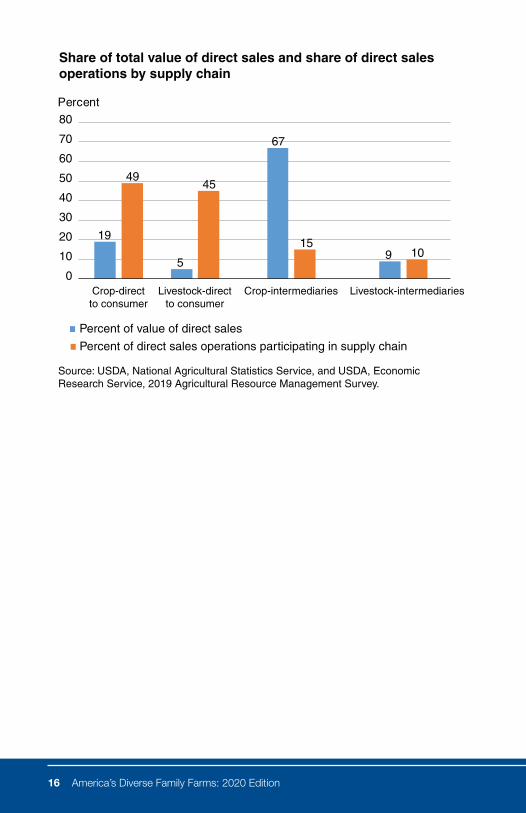
Direct sales
Direct-to-consumer crop sales are the most common form of all direct sales.
• In 2019, 9 percent of operations sold commodities through direct to consum-
er (DTC) or intermediary supply chains and amounted to almost $8 billion in
sales—over 2 percent of the total value of farm production. Of this 9 percent,
49 percent sell crops and 45 percent sell livestock DTC. Only 15 percent sell
crops through an intermediary and 10 percent sell livestock this way. Fifteen
percent of operations sell commodities using both DTC and intermediary
supply chains.
• Although a small share of direct sales operations sells crops through intermedi-
ary supply chains, these operations account for 67 percent of the total value of
direct sales. Direct sales through intermediaries occurred mainly on farms with
greater than $350,000 in GCFI.
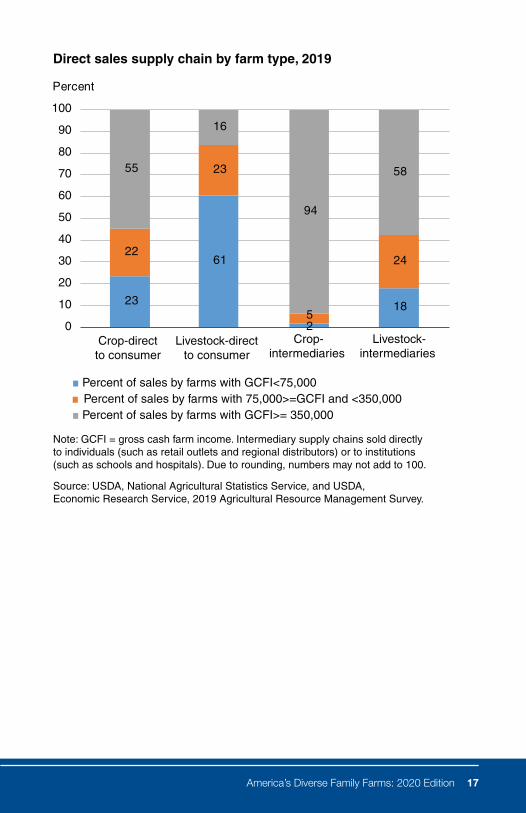
• Farms with low GCFI (less than $75,000) accounted for 61 percent of DTC
livestock sales, which is consistent with the large share of small farms overall
that specialized in livestock, particularly beef production.
• Farms with low GCFI (less than $75,000) accounted for 23 percent of DTC
crop sales. More than half (55 percent) of DTC crop sales are by farms with
GCFI greater than $350,000 (either midsize, large-scale family farms, and
non-family farms), which is consistent with the fact that these larger operations
produced most U.S. crops overall. Of the 55 percent, 69 percent are opera-
tions specialized in high-value crop production. However, small farms are still
disproportionately represented by the number of farms among DTC crop sales.
America’s Diverse Family Farms: 2020 Edition16
Share of total value of direct sales and share of direct sales operations by supply chain
Crop-intermediaries
Percent of direct sales operations participating in supply chain
Livestock-intermediaries Livestock-direct to consumer
Crop-direct to consumer
Percent of value of direct sales
19
5
67
9
4945
1510
0
10
20
30
40
50
60
70
80Percent
Source: USDA, National Agricultural Statistics Service, and USDA, Economic Research Service, 2019 Agricultural Resource Management Survey.
America’s Diverse Family Farms: 2020 Edition 17
Direct sales supply chain by farm type, 2019
Crop-intermediaries
Livestock-intermediaries
Livestock-direct to consumer
Crop-direct to consumer
Percent of sales by farms with GCFI<75,000 Percent of sales by farms with 75,000>=GCFI and <350,000Percent of sales by farms with GCFI>= 350,000
Percent
23
61
2
18
22
23
5
24
55
16
94
58
0
10
20
30
40
50
60
70
80
90
100
Note: GCFI = gross cash farm income. Intermediary supply chains sold directlyto individuals (such as retail outlets and regional distributors) or to institutions (such as schools and hospitals). Due to rounding, numbers may not add to 100.
Source: USDA, National Agricultural Statistics Service, and USDA, Economic Research Service, 2019 Agricultural Resource Management Survey.
America’s Diverse Family Farms: 2020 Edition18
Succession Planning
Note about succession planning Succession planning usually denotes the gradual transfer of own-
ership, control, and participation in the farm business, as opposed
to estate planning triggered by the principal operator’s (or owner’s)
death. It can also be a l imited transfer of ownership such as in-
heritance or a trust. So technically there can be a succession plan
without someone being identif ied as a successor. There also may
be inconsistencies in respondent’s reports of being retired that are
used for classifying the farm into the “retirement” typology group
and in what the principal operator reports about their retirement
plans in the next 5 years.
America’s Diverse Family Farms: 2020 Edition 19
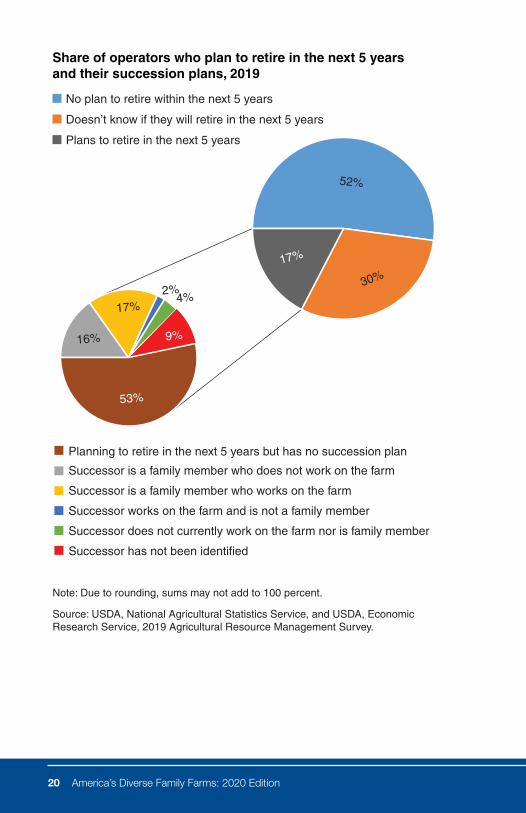
17 percent of principal operators plan to retire in the next 5 years, 52
percent do not, and 30 percent don’t know.
• A succession plan describes how the farm operation will be passed on to
the next generation of farmers or if the farm will be sold, although it does not
necessarily identify an individual successor. Of the 17 percent of farm opera-
tors planning to retire in the next 5 years, more than half have not developed
a succession plan and another 9 percent indicated they had a succession
plan but had not yet identified a successor.
• Thirty-three percent of principal operators who plan to retire in the next 5
years anticipate passing the operation on to someone in the family, with half
of those operations to be passed on to family members who currently work
on the farm and half to family members who do not.
• Principal operators planning to retire in the next 5 years operate 15 percent
of total farmland, a share that is similar to their overall representation in the
number of farm operations. Of that 15 percent of farmland, 48 percent are
on operations with principal operators who already have an identified suc-
cessor. The remainder of the land is part of operations where the principal
operator either has a succession plan that does not include an identified
successor (23 percent) or the principal operator has not yet decided on a
succession plan (29 percent). Based on these findings, within the next 5
years, we estimate 8 percent or less of farmland is likely to become available
for purchase from retiring principal farm operators.
America’s Diverse Family Farms: 2020 Edition20
Share of operators who plan to retire in the next 5 years and their succession plans, 2019
30%
1%
52%
2%
17%
53%
9%16%
4%
17%
No plan to retire within the next 5 years
Doesn’t know if they will retire in the next 5 years
Plans to retire in the next 5 years
Successor is a family member who does not work on the farm
Successor is a family member who works on the farm
Successor works on the farm and is not a family member
Successor does not currently work on the farm nor is family member
Successor has not been identified
Planning to retire in the next 5 years but has no succession plan
Note: Due to rounding, sums may not add to 100 percent.
Source: USDA, National Agricultural Statistics Service, and USDA, Economic Research Service, 2019 Agricultural Resource Management Survey.
America’s Diverse Family Farms: 2020 Edition 21
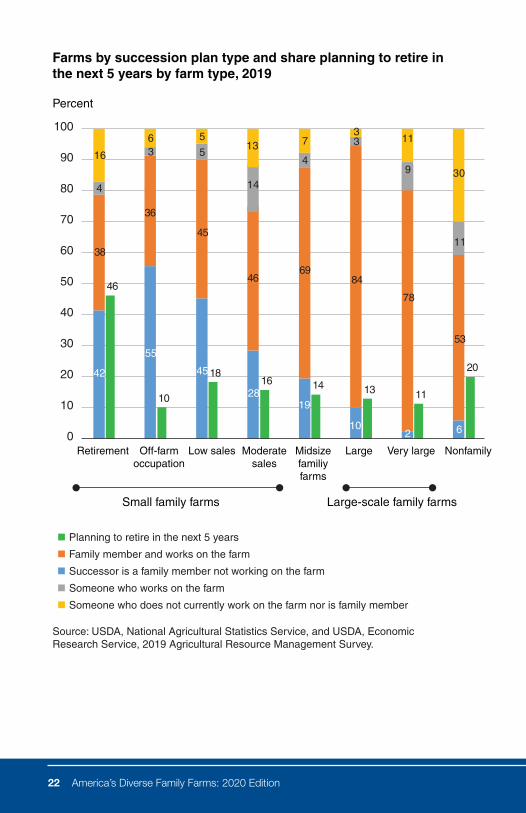
Overall, family members who work on the farm are most likely to be identi-
fied as the successor of the farm operation.
• In 2019, 46 percent of principal operators of retirement farms (i.e., they
consider themselves as retired from farming; 10.7 percent of all farms) are
planning to completely retire in the next 5 years. For these operators, a fami-
ly member who doesn’t work on the farm is most likely to be identified as the
successor of the operation.
• Only a small share—between 10-20 percent of principal operators for all
other operations—plan on retiring in the next 5 years.
• As farm size increases, from small to very-large family farms, a greater share
of principal operators identified that a family member who works on the farm
will succeed them on the operation.
• The principal operators of nonfamily farms are the most likely among farm
types to identify a nonfamily member who does not currently work on the
farm as their successor.
America’s Diverse Family Farms: 2020 Edition22
Farms by succession plan type and share planning to retire in the next 5 years by farm type, 2019
Planning to retire in the next 5 years
Family member and works on the farm
Successor is a family member not working on the farm
Someone who works on the farm
Someone who does not currently work on the farm nor is family member
46
10
1816 14 13 11
2042
55
45
2819
102 6
38
36
45
4669
84
78
53
4
3 5
14
4
3
9
11
16
6 513 7
311
30
0
10
20
30
40
50
60
70
80
90
100
Retirement Off-farmoccupation
Low sales Moderatesales
Midsizefamiliyfarms
Large Very large Nonfamily
Percent
Source: USDA, National Agricultural Statistics Service, and USDA, Economic Research Service, 2019 Agricultural Resource Management Survey.
Large-scale family farms Small family farms
America’s Diverse Family Farms: 2020 Edition 23
Government Payments and Federal Crop Insurance
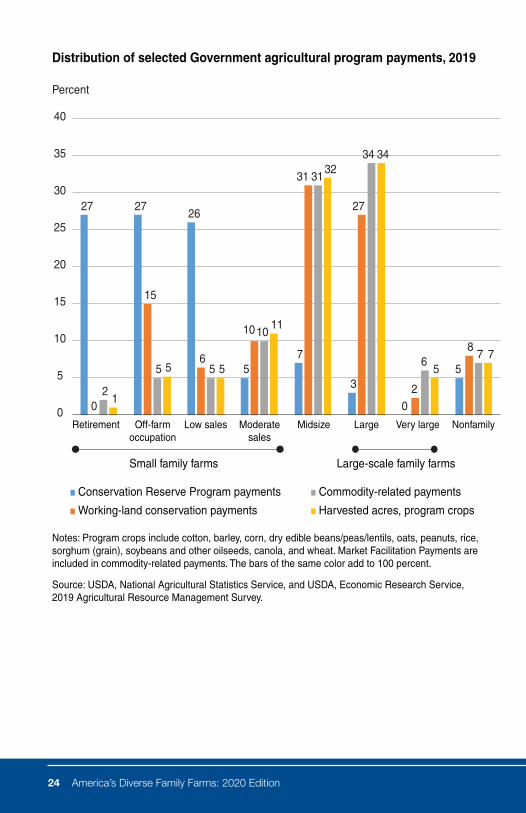
Recipients of Government payments differ by program.
• Commodity-related program payments were received by 20 percent of U.S.
farms, which generally reflects acreage in crops historically eligible for support.
Eighty-one percent of these payments went to moderate-sales, midsize, and
large-scale family farms in 2019, exactly proportional to their 81 percent share
of acres in program crops.
• Twenty-seven percent of working-land conservation payments went to large
family farms, another 31 percent went to midsize family farms, and 31 percent
went to small family farms.
• USDA’s Conservation Reserve Program targets environmentally sensitive crop-
land for removal from production. In 2019, retirement, off-farm occupation, and
low-sales farms received 80 percent of payments under this program.
• Sixty-nine percent of all farms received no farm-related Government payments
in 2019.
America’s Diverse Family Farms: 2020 Edition24
Distribution of selected Government agricultural program payments, 2019
Retirement
Conservation Reserve Program payments
Off-farmoccupation
Low sales Moderatesales
Midsize Large Very large Nonfamily
Percent
27 2726
57
3
0
5
0
15
6
10
31
27
2
8
2
5 5
10
31
34
67
1
5 5
11
3234
57
0
5
10
15
20
25
30
35
40
Working-land conservation payments
Commodity-related payments
Harvested acres, program crops
Notes: Program crops include cotton, barley, corn, dry edible beans/peas/lentils, oats, peanuts, rice, sorghum (grain), soybeans and other oilseeds, canola, and wheat. Market Facilitation Payments are included in commodity-related payments. The bars of the same color add to 100 percent.
Source: USDA, National Agricultural Statistics Service, and USDA, Economic Research Service, 2019 Agricultural Resource Management Survey.
Large-scale family farms Small family farms
America’s Diverse Family Farms: 2020 Edition 25
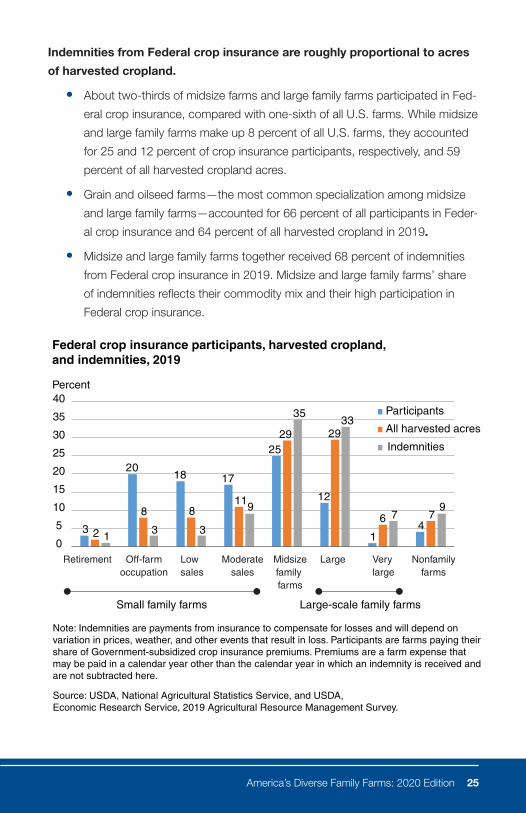
Indemnities from Federal crop insurance are roughly proportional to acres
of harvested cropland.
• About two-thirds of midsize farms and large family farms participated in Fed-
eral crop insurance, compared with one-sixth of all U.S. farms. While midsize
and large family farms make up 8 percent of all U.S. farms, they accounted
for 25 and 12 percent of crop insurance participants, respectively, and 59
percent of all harvested cropland acres.
• Grain and oilseed farms—the most common specialization among midsize
and large family farms—accounted for 66 percent of all participants in Feder-
al crop insurance and 64 percent of all harvested cropland in 2019.
• Midsize and large family farms together received 68 percent of indemnities
from Federal crop insurance in 2019. Midsize and large family farms’ share
of indemnities reflects their commodity mix and their high participation in
Federal crop insurance.
Federal crop insurance participants, harvested cropland, and indemnities, 2019
Retirement
Participants
Off-farmoccupation
Low sales
Moderatesales
Midsizefamily farms
Large Very large
Nonfamilyfarms
Percent
All harvested acres
Indemnities
3
2018 17
25
12
14
2
8 811
29 29
6 7
13 3
9
3533
79
0
5
10
15
20
25
30
35
40
Note: Indemnities are payments from insurance to compensate for losses and will depend on variation in prices, weather, and other events that result in loss. Participants are farms paying their share of Government-subsidized crop insurance premiums. Premiums are a farm expense that may be paid in a calendar year other than the calendar year in which an indemnity is received and are not subtracted here.
Source: USDA, National Agricultural Statistics Service, and USDA, Economic Research Service, 2019 Agricultural Resource Management Survey.
Large-scale family farms Small family farms
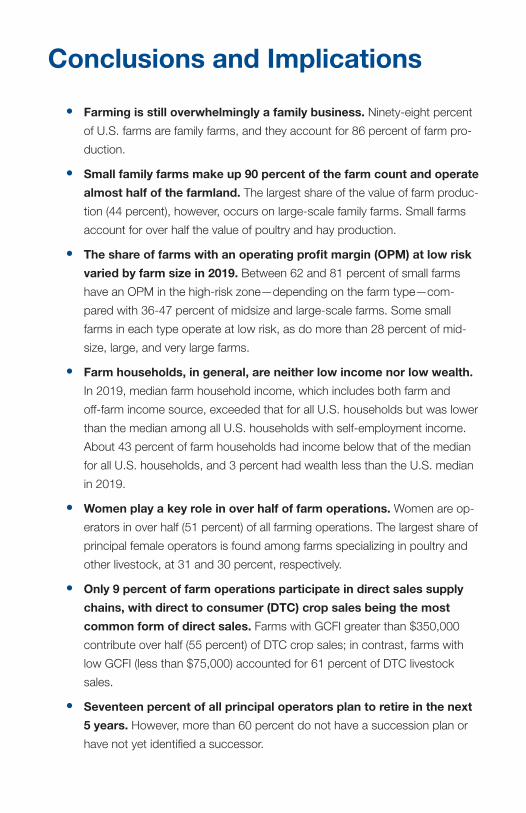
Conclusions and Implications
• Farming is still overwhelmingly a family business. Ninety-eight percent
of U.S. farms are family farms, and they account for 86 percent of farm pro-
duction.
• Small family farms make up 90 percent of the farm count and operate
almost half of the farmland. The largest share of the value of farm produc-
tion (44 percent), however, occurs on large-scale family farms. Small farms
account for over half the value of poultry and hay production.
• The share of farms with an operating profit margin (OPM) at low risk
varied by farm size in 2019. Between 62 and 81 percent of small farms
have an OPM in the high-risk zone—depending on the farm type—com-
pared with 36-47 percent of midsize and large-scale farms. Some small
farms in each type operate at low risk, as do more than 28 percent of mid-
size, large, and very large farms.
• Farm households, in general, are neither low income nor low wealth.
In 2019, median farm household income, which includes both farm and
off-farm income source, exceeded that for all U.S. households but was lower
than the median among all U.S. households with self-employment income.
About 43 percent of farm households had income below that of the median
for all U.S. households, and 3 percent had wealth less than the U.S. median
in 2019.
• Women play a key role in over half of farm operations. Women are op-
erators in over half (51 percent) of all farming operations. The largest share of
principal female operators is found among farms specializing in poultry and
other livestock, at 31 and 30 percent, respectively.
• Only 9 percent of farm operations participate in direct sales supply
chains, with direct to consumer (DTC) crop sales being the most
common form of direct sales. Farms with GCFI greater than $350,000
contribute over half (55 percent) of DTC crop sales; in contrast, farms with
low GCFI (less than $75,000) accounted for 61 percent of DTC livestock
sales.
• Seventeen percent of all principal operators plan to retire in the next
5 years. However, more than 60 percent do not have a succession plan or
have not yet identified a successor.

• Conservation Reserve Program (CRP) payments go to different farms
than other Government payments. CRP payments target environmen-
tally sensitive cropland, with most payments going to retirement, off-farm
occupation, and low-sales farms. In contrast, most commodity-related and
working-land payments go to family farms with GCFI of $350,000 or more.
Most U.S. farms, however, do not receive Government payments and are
not directly affected by them, although they may be affected indirectly by
other market variables, such as land values and rents.
The mission of USDA’s Economic Research Service is to anticipate trends and
emerging issues in agriculture, food, the environment, and rural America and to
conduct high-quality, objective economic research to inform and enhance public
and private decision making. ERS shapes its research program and products to
serve those who routinely make or influence public policy and program decisions.
Follow us on Twitter @USDA_ERS
www.ers.usda.gov