Embed Size (px)
Citation preview

S E RV ICE P ROP E RTIE S TRUS T (Nasdaq: S V C) | Inves t o r P resen ta t i o n Q3 2019
Service Properties Trust
Q3 2019 Investor Presentation

S E RV ICE P ROP E RTIE S TRUS T (Nasdaq: S V C) | Inves t o r P resen ta t i o n Q3 2019
This presentation contains statements that constitute forward-looking statements within the meaning of the Private Securities Litigation Reform Act of
1995 and other securities laws. Also, whenever we use words such as “believe”, “expect”, “anticipate”, “intend”, “plan”, “estimate”, “will”, “may” and
negatives or derivatives of these or similar expressions, we are making forward-looking statements. These forward-looking statements are based upon
our present intent, beliefs or expectations, but forward-looking statements are not guaranteed to occur and may not occur. Forward-looking statements in
this presentation relate to various aspects of our business, including the performance of our operator or tenants and their ability to pay the contractual
amounts of returns or rents due to us, our sales and acquisitions of properties, our ability to compete for acquisitions effectively, our policies and plans
regarding investments, financings and dispositions, our ability to pay distributions to our shareholders and to sustain the amount of such distributions, our
ability to raise debt or equity capital, our ability to appropriately balance our use of debt and equity capital, our intent to make improvements to certain of
our properties and the success of our renovations, our ability to engage and retain qualified managers and tenants for our hotels and net lease properties
on satisfactory terms, the future availability of borrowings under our revolving credit facility, our ability to pay interest on and principal of our debt, our
credit ratings, our expectation that we benefit from our relationships with the RMR Group, Inc., or RMR, our qualification for taxation as a REIT, changes
in federal or state tax laws, and other matters.
Our actual results may differ materially from those contained in or implied by our forward-looking statements as a result of various factors, such as the
impact of conditions in the economy and the capital markets on us and our managers and tenants, competition within the real estate, hotel,
transportation, travel center and other industries in which our tenants operate, particularly in those markets in which our properties are located,
compliance with, and changes to applicable laws, regulations, rules and similar matters, limitations imposed on our business and our ability to satisfy
complex rules in order for us to maintain our qualification for taxation as a REIT for U.S. federal income tax purposes, acts of terrorism, outbreaks of so
called pandemics or other manmade or natural disasters beyond our control and actual and potential conflicts of interest with our related parties. Our
annual report on form 10-K for the year ended December 31, 2018 and our other filings with the Securities and Exchange Commission (SEC) identify
other important factors that could cause differences from our forward-looking statements. Our filings with the SEC are available on the SEC’s website at
www.SEC.gov. You should not place undue reliance upon our forward-looking statements. Except as required by law, we do not intend to update or
change any forward-looking statements as a result of new information, future events or otherwise.
Non-GAAP Financial Measures
This presentation contains Non-GAAP financial measures including, among others, “EBITDA” and “Adjusted EBITDA” in the exhibits section.
Reconciliation for those metrics to the most directly comparable financial measure calculated in accordance with U.S generally accepted accounting
principles (GAAP) are included herein.
Unless otherwise noted, all data presented is as of September 30, 2019.
Warning Concerning Forward -Looking Statements

S E RV ICE P ROP E RTIE S TRUS T (Nasdaq: S V C) | Inves t o r P resen ta t i o n Q3 2019
SVC at a Glance: Port fol io Overview.
3
(1) As of and for the twelve months ended September 30, 2019.
(2) Please see page 23 for definitions of FFO and Normalized FFO available for common shareholders, a description of why SVC believes the presentation of these measures provides useful information to investors regarding its financial condition and
results of operations and a description of how it uses these measures.
Total Properties 1,274
• Hotels 328
• Net Lease Assets 946
Investment Value $12.6bn
Dividend Yield 8.4%
Normalized FFO
Payout Ratio (2) 56.8%
Key Metrics (1) Recent Developments
• Closed on $2.4bn net lease portfolio
acquisition.
• Raised $1.7bn of unsecured senior notes.
• Targeted asset sales of $800mn underway,
with 128 net lease properties sold or under
contract for proceeds of approximately
$500mn.
• Targeting $300mn of hotel sales, SVC is in the
process of selling or rebranding 22 hotels
managed by Wyndham and 30 Marriott hotels.

S E RV ICE P ROP E RTIE S TRUS T (Nasdaq: S V C) | Inves t o r P resen ta t i o n Q3 2019
Reasons to Own Service Propert ies Trust.
✓ CONSISTENT METHOD FOR CREATING VALUE AND STRATEGY FOR ACHIEVING
RESULTS.
✓ $12.6 BILLION INVESTED IN A DIVERSIFIED PORTFOLIO THAT PROVIDES MANY
AVENUES FOR GROWTH.
✓ UNIQUE STRUCTURE OF HOTEL AGREEMENTS PROVIDES STABLE CASH FLOWS
DESIGNED TO WITHSTAND RENOVATION DISRUPTION AND ECONOMIC DOWNTURNS.
✓ NECESSITY-BASED RETAIL ASSETS PROVIDE RELIABLE INCOME WITH LOW CAPEX
REQUIREMENTS UNDER TRIPLE NET LEASE STRUCTURE.
✓ INVESTMENT GRADE BALANCE SHEET.
✓ WELL COVERED DIVIDEND WITH PROVEN TRACK RECORD OF INCREASING RETURNS
TO SHAREHOLDERS.
✓ STRONG MANAGEMENT PLATFORM AND AFFILIATE ADVANTAGES.
4

S E RV ICE P ROP E RTIE S TRUS T (Nasdaq: S V C) | Inves t o r P resen ta t i o n Q3 2019
L a r g e ,
D i v e r s e
Po r t f o l i o
H o t e l m a n a g e m e n t
a g r e e m e n t s w i t h
a l i g n m e n t o f
i n t e r e s t s
T r i p l e n e t l e a s e
s t r u c t u r e p r o v i d e s
s t e a d y i n c o m e
s t re a m
I n v e s t m e n t g r a d e
b a l a n c e s h e e t
B i l l i o n d o l l a r
r e v o l v i n g c r e d i t
f a c i l i t y
S t r o n g a c c e s s t o
c a p i t a l m a r k e t s
ST R O N G
M AN AG EM E N T
PL AT F O R M
AN D AF F I L I AT E
AD V A N T A G ESSEC U R I T Y O F C AS H F L O W
O PPO R T U N I T I E S
F O R
G R O W T H
C AP A C I T Y T O
SU PPO R T
G R O W T H
T h e R M R G r o u p
…
T A
…
So n e s t a
Strategy for Achieving Results.
Ac q u i s i t i o n s
As s e t R e c yc l i n g
R e i n v e s t i n g t h r o u g h
r e n o v a t i o n s & c a p i t a l
i m p r o v e m e n t s
As s e t m a n a g e m e n t t o d r i v e o p e ra t i o n a l
i m p r o v e m e n t
5
D o w n s i d e
C a s h f l o w
Pr o t e c t i o n

S E RV ICE P ROP E RTIE S TRUS T (Nasdaq: S V C) | Inves t o r P resen ta t i o n Q3 20196
Portfol io Highl ights. (1)
($ in millions) Hotels
Net Lease
Assets Total
Properties 328 946 1,274
Keys / Square Feet 51,086 17.6 msf51,086/
17.6msf
States 40 45 48
Investments $6.9bn $5.8bn $12.6bn
Annual Minimum
Return/Rent$602mn $419mn $1,020bn
Annual Minimum
Returns and Rents
Coverage Ratio (3)
0.87x 2.27x 1.44x
Portfolio by Property Type (2)
Tenants by Industry (2)
(1) As of and for the twelve months ended September 30, 2019.
(2) Based on annualized minimum base returns and rents.
(3) See page 23 for our definition of coverage.

S E RV ICE P ROP E RTIE S TRUS T (Nasdaq: S V C) | Inves t o r P resen ta t i o n Q3 2019
S V C ’s a s s e t s a r e l o c a t e d i n 4 8 s t a t e s , Wa s h i n g t o n D C , P u e r t o R i c o ,
a n d C a n a d a .
• SVC has invested $12.6 billion in its national real estate portfolio.
• SVC’s investments are located in various markets near demand generators.
• We believe geographic diversity creates mitigates market risk.
Data as of September 30, 2019.
Portfol io Highl ights: Geographical ly Diverse.
7
Annual Minimum Returns and Rents
Total
Property
Count
Hotel
Count
Net
Lease
Count
Total
($000s) % of Total
Hotel
($000s)
Hotel %
of Total
Net Lease
($000s)
Net Lease
% of Total
1 California 58 36 22 $ 112,984 11.1% $ 89,754 8.8% 23,230$ 2.3%
2 Texas 105 36 69 85,462 8.4% 50,863 5.0% 34,599 3.4%
3 Illinois 87 16 71 65,516 6.4% 34,741 3.4% 30,775 3.0%
4 Georgia 104 23 81 64,554 6.3% 42,352 4.2% 22,202 2.2%
5 Ohio 60 11 49 41,171 4.0% 13,474 1.3% 27,697 2.7%
6 Florida 68 14 54 41,041 4.0% 24,816 2.4% 16,224 1.6%
7 Arizona 44 15 29 37,443 3.7% 19,856 1.9% 17,587 1.7%
8 Massachusetts 15 14 1 33,732 3.3% 28,512 2.8% 5,221 0.5%
9 Pennsylvania 42 10 32 33,239 3.3% 17,799 1.7% 15,441 1.5%
10 New Jersey 20 15 5 32,752 3.2% 26,261 2.6% 6,492 0.6%
Top 10 603 190 413 $ 547,896 53.7% $ 348,428 34.1% 199,468$ 19.5%
Other 671 138 533 $ 472,580 46.3% $ 253,413 24.9% $ 219,167 21.5%
Total 1,274 328 946 1,020,476$ 100.0% 601,841$ 59.0% 418,635$ 41.0%

S E RV ICE P ROP E RTIE S TRUS T (Nasdaq: S V C) | Inves t o r P resen ta t i o n Q3 2019
Hotel Port fol io: Operated under a Diverse Group of Nat ional ly Recognized Brands.
8
• SVC’s 328 hotels are operated under
eight long-term agreements directly
with brand owners.
• 21 different hotel brands,
predominantly upper upscale and
upscale.
• Primarily extended stay and select
service hotels typically in near-urban
locations.
• Diversified hotel portfolio located in
40 states, Washington, D.C., Puerto
Rico and Canada.
• Majority of minimum hotel returns and
rents secured by security deposits or
corporate guarantees.

S E RV ICE P ROP E RTIE S TRUS T (Nasdaq: S V C) | Inves t o r P resen ta t i o n Q3 2019
Airport15% Interstate
1%
Resort4%
Small Metro1%
Suburban68%
Urban11%
Marriott, $1,843
InterContinental, $2,267
Sonesta, $1,763
Wyndham, $399
$299
Hotel Chain Scale
(by # of units) (1)
Luxury3%
Midscale23%
Upper Midscale6%
Upper Upscale
4%
Upscale64%Extended Stay
56%
Full Service15%
Select Service29%
Hotel Service Level
(by # of units) (1)
(1) Data as of September 30, 2019.
(2) Represents historical cost of properties plus capital improvements funded by SVC less impairment writedowns, if any, and excludes capital improvements made from FF&E reserves funded from hotel operations which do not result in
increases in minimum returns or rents.
Hotel Location Segment
(by # of units) (1)
Hotel Managers
(by investment $ in millions) (1),(2)
• SVC’s targets are select service hotels
in near-urban locat ions, as wel l as ful l
service hotels in urban markets to
expand our brand owner relat ionships.
Radisson
Hyatt,
$302
Hotel Port fol io: Our Strategy Provides Flexibi l i ty in Regard to Asset Mix.
9
Chain Scale
Acquisitions
since 2015 % Mix
Luxury 1 2%
Upper Upscale 7 17%
Upscale 32 78%
Upper Midscale 1 2%
Midscale 0 0%
Total 41 100%
Service Level
Acquisitions
since 2015 % Mix
Full Service 15 37%
Extended Stay 26 63%
Select Service 0 0%
Total 41 100%
Location Segment
Acquisitions
since 2015 % Mix
Suburban 27 66%
Urban 12 29%
Airport 1 2%
Resort 1 2%
Interstate 0 0%
Small Metro 0 0%
Total 41 100%
S E RV ICE P ROP E RTIE S TRUS T (Nasdaq: S V C) | Inves t o r P resen ta t i o n Q3 2019
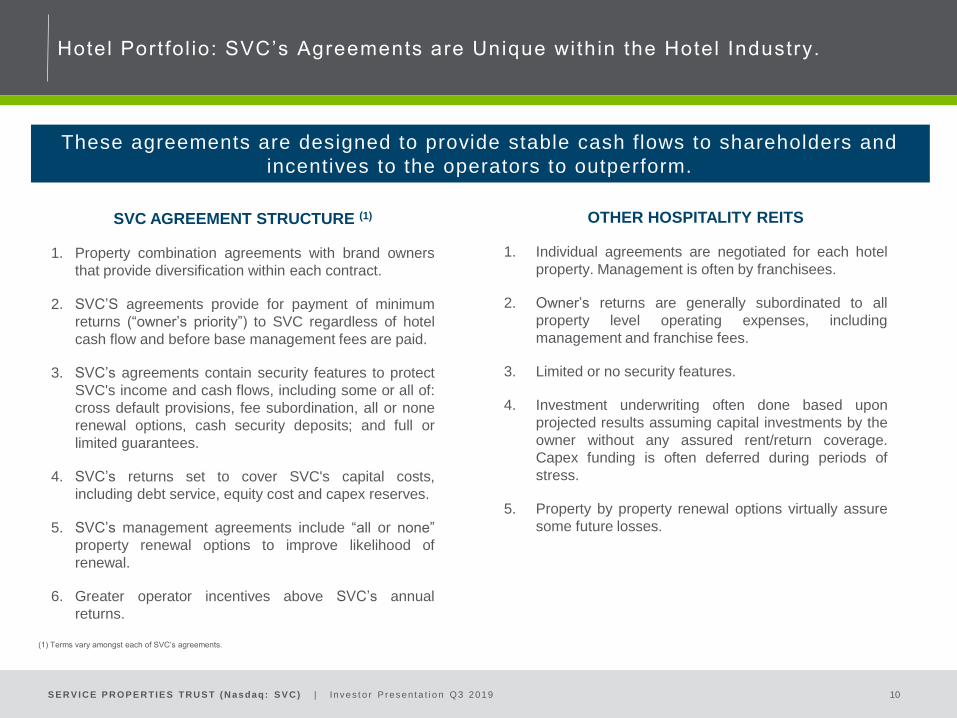
Hotel Port fol io: SVC’s Agreements are Unique within the Hotel Industry.
10
SVC AGREEMENT STRUCTURE (1)
1. Property combination agreements with brand owners
that provide diversification within each contract.
2. SVC’S agreements provide for payment of minimum
returns (“owner’s priority”) to SVC regardless of hotel
cash flow and before base management fees are paid.
3. SVC’s agreements contain security features to protect
SVC's income and cash flows, including some or all of:
cross default provisions, fee subordination, all or none
renewal options, cash security deposits; and full or
limited guarantees.
4. SVC’s returns set to cover SVC's capital costs,
including debt service, equity cost and capex reserves.
5. SVC’s management agreements include “all or none”
property renewal options to improve likelihood of
renewal.
6. Greater operator incentives above SVC’s annual
returns.
OTHER HOSPITALITY REITS
1. Individual agreements are negotiated for each hotel
property. Management is often by franchisees.
2. Owner’s returns are generally subordinated to all
property level operating expenses, including
management and franchise fees.
3. Limited or no security features.
4. Investment underwriting often done based upon
projected results assuming capital investments by the
owner without any assured rent/return coverage.
Capex funding is often deferred during periods of
stress.
5. Property by property renewal options virtually assure
some future losses.
These agreements are designed to provide stable cash flows to shareholders and
incentives to the operators to outperform.
(1) Terms vary amongst each of SVC’s agreements.

S E RV ICE P ROP E RTIE S TRUS T (Nasdaq: S V C) | Inves t o r P resen ta t i o n Q3 2019
Net Lease Port fol io: High -Qual i ty Service & Necessity Based Assets.
11
Net Lease Portfolio Statistics (1)
946 $419mm
Properties Annual Contractual Rent
17.6mm 11.3 Years
Rentable Square Feet Weighted Average Lease Term
98% 2.27x(2)
Occupancy W.A. FCCR
Diverse Geographical Footprint (3)
(1) Data as of and for the twelve months ended September 30, 2019.
(2) See page 23 for our definition of coverage.
(3) By annual minimum rent.
% of Rent (1)<1% 8.5%
6%
9%
5%
7% 5% 7%
<1%
<1%
<1%
<1%
<1%
<1%
<1%
<1%
<1%
<1%
<1%
<1%
<1%
1%
1%
2%
2%
1%
1%1%
1%1%
4%
4%
4%
3%
3%
3%
3%
3%
2%
2%
2%
2%
2%
2%
2%
2%2%
23 Industries | 163 Brands

S E RV ICE P ROP E RTIE S TRUS T (Nasdaq: S V C) | Inves t o r P resen ta t i o n Q3 2019
Net Lease Port fol io: Rel iable Income Stream and Low Capex Requirements.
12
Well-Laddered Lease Expirations (2)
(1) As of September 30, 2019.
(2) By annual minimum rent.
92%of Leases Have
Contractual Increases
or Percentage Rent
Lease Structures (1)
0% 2% 2% 3% 1% 3% 3% 4% 6%
76%
2019 2020 2021 2022 2023 2024 2025 2026 2027 2028+
60%
19%
14%
8%
Percentage Rent
CPI
Fixed/Scheduled
Flat
$419mm

S E RV ICE P ROP E RTIE S TRUS T (Nasdaq: S V C) | Inves t o r P resen ta t i o n Q3 2019
Net Lease Port fol io: Tenants & Industr ies that Benef i t f rom Strong Demand Drivers.
13
(1) By annual minimum rent.
(2) Leases subject to full or partial corporate guarantees.
(3) As of and for the twelve months ended September 30, 2019. See page 23 for our definition of coverage.
Tenants by Brand (1)Tenants by Industry (1)
Brand
% of
Annualized
Cash Rent Coverage (3)
Travel Centers of America (2) 40.1% 1.95x
Petro Stopping Centers (2) 18.7% 1.62x
AMC Theaters (2) 18.7% 1.36x
The Great Escape 2.6% 4.12x
Crème de la Crème (2) 1.7% 1.84x
Goodrich Quality Theaters 1.4% 1.48x
Life Time Fitness (2) 1.3% 3.56x
Casual Male 1.3% 1.24x
Buehler's Fresh Foods 1.2% 2.22x
CarMax 1.2% 2.51x
Other 11.8% 3.15x
100% 2.27x
Travel Centers, 59%
Restaurants - Quick Service, 6%
Movie Theaters, 6%
Restaurants - Casual Dining, 5%
Health & Fitness, 3%
Miscellaneous Retail, 2%
Medical/Other Office, 2%
Auto Parts & Service, 2%
Grocery, 2%
Automotive Dealers, 2% Other, 11%

S E RV ICE P ROP E RTIE S TRUS T (Nasdaq: S V C) | Inves t o r P resen ta t i o n Q3 2019
Balance Sheet Overview as of September 30, 2019.
14
(1) Net debt means total debt less cash and cash equivalents as of the date reported.
(2) See page 23 for the calculation of EBITDA, EBITDAre and Adjusted EBITDAre, and a reconciliation of net income (loss) determined in accordance with GAAP to these amounts.
(3) We completed the SMTA transaction on September 20, 2019. For purpose of calculating coverage ratios for the three months ended September 30, 2019, we included our pro forma estimates of the annualized Adjusted EBITDAre we expect to be
generated from the SMTA portfolio.
Well Laddered Debt Maturities
Book Capitalization
Leverage/Coverage Ratios
Net Debt (1) / Total Gross Assets 51.8%
Net Debt (1) / Gross Book Value of Real Estate Assets 56.0%
Adjusted EBITDAre (2) (3) / Interest Expense 4.0x
Net Debt(1) / Annualized Adjusted EBITDAre (2) (3) 6.6x
Investment Grade Balance Sheet
Unsecured Floating Rate Debt 13%
Unsecured Fixed Rate Debt 58%
Shareholder’s Equity 29%
• No secured debt.
• Unsecured senior notes: $5.4 billion.
• Unsecured term loan: $400 million, July 2023 maturity.
• Revolving credit facility:
• $1 billion ($790 million outstanding).
• July 2022 maturity plus two six-month extensions.
• No derivatives, off-balance sheet liabilities, or material
adverse change clauses or ratings triggers.
$0
$200
$400
$600
$800
$1,000
$1,200
$1,400
2019 2020 2021 2022 2023 2024 2025 2026 2027 2028 2029 2030
13%
58%
29%

S E RV ICE P ROP E RTIE S TRUS T (Nasdaq: S V C) | Inves t o r P resen ta t i o n Q3 2019
(1) 2015 period excludes a $0.20 per share non-cash distribution of The RMR Group, or, RMR common stock to SVC shareholders.
(2) Based on actual 2019 dividend and LTM normalized FFO for the period ended September 30, 2019.
Proven track record of returns to shareholders even during market downturns.
Our Cash Flow Payout Strategy Al lows for a Secure, Wel l -Covered Dividend.
15
$1.80 $1.80 $1.82
$1.89
$1.95
$1.99
$2.03
$2.07
$2.11
$2.15
20%
30%
40%
50%
60%
70%
80%
90%
100%
$1.20
$1.30
$1.40
$1.50
$1.60
$1.70
$1.80
$1.90
$2.00
$2.10
$2.20
2010 2011 2012 2013 2014 2015 2016 2017 2018 2019
Dividends Paid Per Share Normalized FFO Dividend Payout Ratio
(1) (2)
Dividend Paid Per Share and Normalized FFO Dividend Payout Ratio
S E RV ICE P ROP E RTIE S TRUS T (Nasdaq: S V C) | Inves t o r P resen ta t i o n Q3 2019
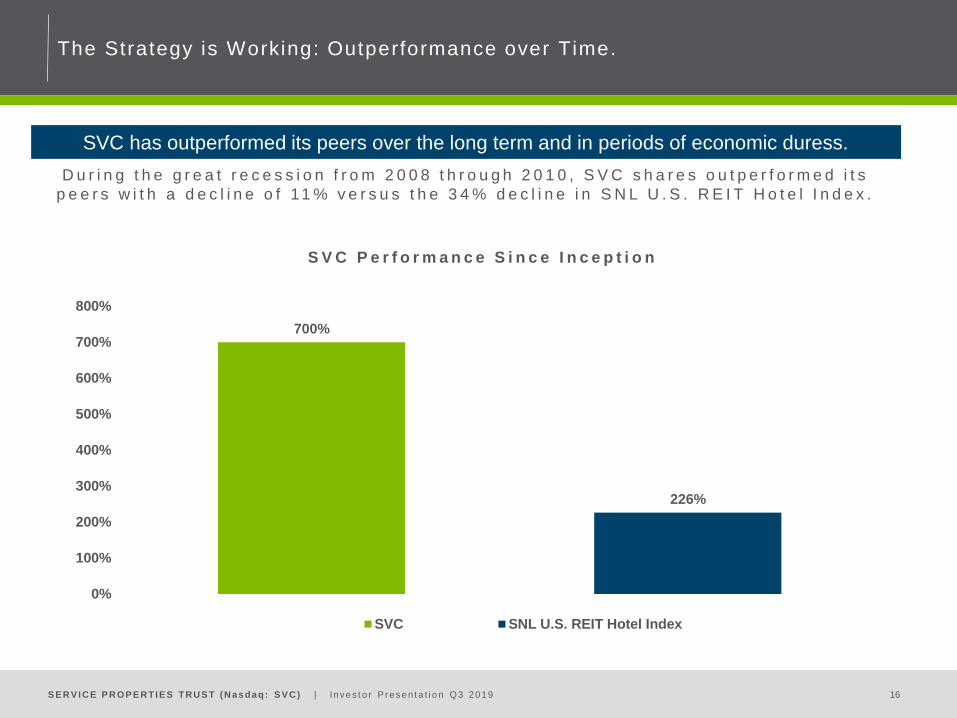
The Strategy is Working: Outperformance over Time.
16
700%
226%
0%
100%
200%
300%
400%
500%
600%
700%
800%
SVC SNL U.S. REIT Hotel Index
D u r i n g t h e g r e a t r e c e s s i o n f r o m 2 0 0 8 t h r o u g h 2 0 1 0 , S V C s h a r e s o u t p e r f o r m e d i t s
p e e r s w i t h a d e c l i n e o f 11 % v e r s u s t h e 3 4 % d e c l i n e i n S N L U . S . R E I T H o t e l I n d e x .
SVC has outperformed its peers over the long term and in periods of economic duress.
S V C P e r f o r m a n c e S i n c e I n c e p t i o n

S E RV ICE P ROP E RTIE S TRUS T (Nasdaq: S V C) | Inves t o r P resen ta t i o n Q3 2019
Financial
Services:
Real Estate
Services:
Business
Services:
AccountingAcquisitions/
DispositionsAdministration
Capital MarketsAsset
ManagementHuman Resources
Compliance/ AuditConstruction/
Development
Information
Technology (IT)
Finance/ Planning Engineering Investor Relations
Treasury Leasing Marketing
TaxProperty
Management
Legal/
Risk Management
RMR’s Operations Include:
$32.8 Billion in AUM
Approximately 600 CRE
Professionals
More than 30 Offices
Throughout the U.S.Over
50,000 Employees
Over 2,200
Properties
$12 Billion in
Annual Revenues
Combined RMR
Managed Companies:
Office Industrial Medical OfficeSenior Living
Hotel /Net Lease
Travel Centers
Senior Living OfficeHotels Securities REIT
CRE Mortgages
T h e R M R G r o u p
E q u i t y R E I T S O p e r a t i n g C o m p a n i e s O t h e r U n i t s
Strong Management Platform and Aff i l iate Advantages.
17

S E RV ICE P ROP E RTIE S TRUS T (Nasdaq: S V C) | Inves t o r P resen ta t i o n Q3 2019
RMR base management fee tied to SVC share
price performance.
• Consists of an annual fee based on generally 50 bps
multiplied by the lower of:
(1) SVC’s historical cost of real estate, or
(2) SVC’s total market capitalization.
• There is no incentive for RMR to complete any
transaction that could reduce share price.
RMR incentive fees contingent on total
shareholder return(1) outperformance.
• Equal to 12% of value generated by SVC in excess of
the benchmark index total returns (SNL US Hotel REIT
Index) per share over a three year period, subject to a
cap (1.5% of equity market cap).
• Absolute dollar outperformance must be positive to
receive an incentive fee: it can’t be negative but better
than the index.
• Shareholders keep 100% of benchmark returns and
88% of returns in excess of the benchmark.
Alignment of Interests
If total market cap exceeds historical cost of real estate,
base fee is paid on assets.
If total market cap is less than historical cost of real
estate, base fee fluctuates with share price.
Incentive fee structure keeps RMR focused on increasing
total shareholder return.
Members of RMR senior management are substantial
holders of SVC stock, some subject to long term lock up
agreements.
SVC shareholders have visibility into publicly traded
RMR.
SVC benefits from RMR’s national footprint and
economies of scale of $32.8 billion platform.
(1) To determine final share price in SVC’s Total Return calculation, the business management agreement requires that the highest ten day share price average within the last 30 trading
days of the measurement period be used. In the past, this and other less significant factors have resulted in differences between SNL’s calculation of SVC’s total return percentage and
the total return percentage computed under the agreement.
The RMR Group LLC and Shareholder Al ignment.
18

S E RV ICE P ROP E RTIE S TRUS T (Nasdaq: S V C) | Inves t o r P resen ta t i o n Q3 2019
Long Island
Newton (Boston)
Los
Angeles
San Diego
Baltimore / Annapolis
Honolulu(2)
Washington D.C.(3)
Albuquerque
Austin(2)
Minneapolis
Chicago(2)
Atlanta(2)
Indianapolis
ColumbiaPhoenix
Denver
Dallas
Kansas
City(2)
PhiladelphiaSacramento
Houston
Richmond(2)
Seattle
San Jose
Ontario,
Canada
Puerto Rico
Norfolk
SVC Benefits from The RMR Group’s Integration and Management Capabilities.
• The RMR Group currently manages over $32.8 billion in assets.
• Operating platform includes 30 offices throughout the U.S. with over 600 commercial real estate professionals.
• Provides national, regional and local market leasing, asset management and property management expertise.
• Net lease portfolio and ongoing management is expected to be easily integrated.
The RMR Group has a Nat ional, Vert ical ly - Integrated Operat ing Platform.
19

S E RV ICE P ROP E RTIE S TRUS T (Nasdaq: S V C) | Inves t o r P resen ta t i o n Q3 2019
Appendix
20

S E RV ICE P ROP E RTIE S TRUS T (Nasdaq: S V C) | Inves t o r P resen ta t i o n Q3 2019
Calculat ion of EBITDA, EBITDAre and Adjusted EBITDAre. (1)
( In thousands )
21
(1)
(2)
(3)
(4)
(5)
We recorded a $159,535 gain on sale of real estate in the three months ended March 31, 2019, in connection with the sales of 20 travel centers.
Amounts represent the equity compensation awarded to our trustees, our officers and certain other employees of RMR LLC.
We recorded a loss of $8,451 on early extinguishment of debt in the three months ended September 30, 2019 related to the termination of a term loan commitment we arranged in connection with the SMTA transaction.
We also recorded a $160 loss on early extinguishment of debt in the three months ended June 30, 2018 in connection with the amendment of our revolving credit facility and term loan.
Unrealized gains and losses on equity securities, net represent the adjustment required to adjust the carrying value of our investments in RMR Inc. and TA common shares to their fair value as of the end of the period.
We sold our shares of RMR Inc. in July 2019.
Please see page 23 for definitions of EBITDA, EBITDAre and Adjusted EBITDAre and a description of why we believe the presentation of these measures provide useful information to investors.
$ 40,074 $ 8,782 $ 225,787 $ (108,860) $ 117,099 $ 274,643 $ 294,594
Interest expense 52,375 49,601 49,766 49,624 49,308 151,742 145,589
Income tax expense (benefit) 467 (260) 1,059 (754) 707 1,266 1,949
Depreciation and amortization 103,160 99,196 99,365 102,769 101,007 301,721 300,308
196,076 157,319 375,977 42,779 268,121 729,372 742,440
Gain on sale of real estate (2) — — (159,535) — — (159,535) —
196,076 157,319 216,442 42,779 268,121 569,837 742,440
General and administrative expense paid in common shares (3) 1,068 865 436 909 1,008 2,369 2,278
Loss on early extinguishment of debt (4) 8,451 — — — — 8,451 160
Unrealized gains and losses on equity securities, net (5) 3,950 60,788 (20,977) 106,085 (43,453) 43,761 (89,348)
$ 209,545 $ 218,972 $ 195,901 $ 149,773 $ 225,676 $ 624,418 $ 655,530
(1)
(2)
(3)
(4)
(5)
We recorded a $159,535 gain on sale of real estate in the three months ended March 31, 2019, in connection with the sales of 20 travel centers.
Amounts represent the equity compensation awarded to our trustees, our officers and certain other employees of RMR LLC.
We recorded a loss of $8,451 on early extinguishment of debt in the three months ended September 30, 2019 related to the termination of a term loan commitment we arranged in connection with the SMTA transaction. We
also recorded a $160 loss on early extinguishment of debt in the three months ended June 30, 2018 in connection with the amendment of our revolving credit facility and term loan.
Unrealized gains and losses on equity securities, net represent the adjustment required to adjust the carrying value of our investments in RMR Inc. and TA common shares to their fair value as of the end of the period. We
sold our shares of RMR Inc. in July 2019.
Please see page 23 for definitions of EBITDA, EBITDAre and Adjusted EBITDAre and a description of why we believe the presentation of these measures provide useful information to investors.
Add (Less):
Adjusted EBITDAre
Net income (loss)
Add (Less):
EBITDA
Less:
EBITDAre
For the Three Months Ended For the Nine Months Ended
9/30/2019 6/30/2019 3/31/2019 12/31/2018 9/30/2018 2019 2018
CALCULATION OF EBITDA, EBITDAre AND ADJUSTED EBITDAre (1)
(in thousands)

S E RV ICE P ROP E RTIE S TRUS T (Nasdaq: S V C) | Inves t o r P resen ta t i o n Q3 2019
Calculat ion of Funds From Operat ions (FFO) and Normal ized FFO. (1)
( In thousands )
22
$ 40,074 $ 8,782 $ 225,787 $ (108,860) $ 117,099 $ 274,643 $ 294,594
Depreciation and amortization 103,160 99,196 99,365 102,769 101,007 301,721 300,308
Gain on sale of real estate (2) — — (159,535) — — (159,535) —
Unrealized gains and losses on equity
securities, net (3) 3,950 60,788 (20,977) 106,085 (43,453) 43,761 (89,348)
147,184 168,766 144,640 99,994 174,653 460,590 505,554
Loss on early extinguishment of debt (4) 8,451 — — — — 8,451 160
$ 155,635 $ 168,766 $ 144,640 $ 99,994 $ 174,653 $ 469,041 $ 505,714
164,321 164,284 164,278 164,278 164,232 164,294 164,212
164,348 164,326 164,322 164,278 164,274 164,332 164,242
$ 0.24 $ 0.05 $ 1.37 $ (0.66) $ 0.71 $ 1.67 $ 1.79
$ 0.90 $ 1.03 $ 0.88 $ 0.61 $ 1.06 $ 2.80 $ 3.08
$ 0.95 $ 1.03 $ 0.88 $ 0.61 $ 1.06 $ 2.85 $ 3.08
(1)
(2)
(3)
(4)
CALCULATION OF FFO AND NORMALIZED FFO (1)
(amounts in thousands, except share data)
For the Three Months Ended For the Nine Months Ended
9/30/2019 6/30/2019 3/31/2019 12/31/2018 9/30/2018 2019 2018
Net income (loss)
Add
FFO
Add:
Normalized FFO
Weighted average shares outstanding (basic)
Weighted average shares outstanding (diluted)
We recorded a loss of $8,451 on early extinguishment of debt in the three months ended September 30, 2019 related to the termination of a term loan commitment we arranged in
connection with the SMTA transaction. We also recorded a $160 loss on early extinguishment of debt in the three months ended June 30, 2018 in connection with the amendment of our
revolving credit facility and term loan.
Net income (loss)
FFO
Normalized FFO
Basic and diluted per share common share
Please see page 23 for definitions of FFO and Normalized FFO, a description of why we believe the presentation of these measures provides useful information to investors regarding
our financial condition and results of operations and a description of how we use these measures.
We recorded a $159,535 gain on sale of real estate in the three months ended March 31, 2019 in connection with the sales of 20 travel centers.
Unrealized gains and losses on equity securities, net represent the adjustment required to adjust the carrying value of our investments in RMR Inc. and TA common shares to their fair
value as of the end of the period. We sold our shares of RMR Inc. in July 2019. (1)
(2)
(3)
(4) We recorded a loss of $8,451 on early extinguishment of debt in the three months ended September 30, 2019 related to the termination of a term loan commitment we arranged in
connection with the SMTA transaction. We also recorded a $160 loss on early extinguishment of debt in the three months ended June 30, 2018 in connection with the amendment of our
revolving credit facility and term loan.
Please see page 23 for definitions of FFO and Normalized FFO, a description of why we believe the presentation of these measures provides useful information to investors regarding
our financial condition and results of operations and a description of how we use these measures.
We recorded a $159,535 gain on sale of real estate in the three months ended March 31, 2019 in connection with the sales of 20 travel centers.
Unrealized gains and losses on equity securities, net represent the adjustment required to adjust the carrying value of our investments in RMR Inc. and TA common shares to their fair
value as of the end of the period. We sold our shares of RMR Inc. in July 2019.
S E RV ICE P ROP E RTIE S TRUS T (Nasdaq: S V C) | Inves t o r P resen ta t i o n Q3 2019
NON-GAAP FINANCIAL MEASURES
We present certain “non-GAAP financial measures” within the meaning of applicable Securities and Exchange Commission, or SEC, rules, including EBITDA, EBITDAre, Adjusted
EBITDAre, FFO and Normalized FFO. These measures do not represent cash generated by operating activities in accordance with GAAP and should not be considered alternatives to net
income (loss) as indicators of our operating performance or as measures of our liquidity. These measures should be considered in conjunction with net income (loss) as presented in our
condensed consolidated statements of income. We consider these non-GAAP measures to be appropriate supplemental measures of operating performance for a REIT, along with net
income (loss). We believe these measures provide useful information to investors because by excluding the effects of certain historical amounts, such as depreciation and amortization
expense, they may facilitate a comparison of our operating performance between periods and with other REITs.
EBITDA, EBITDAre AND ADJUSTED EBITDAre
We calculate earnings before interest, taxes, depreciation and amortization, or EBITDA, EBITDA for real estate, or EBITDAre, and Adjusted EBITDAre as shown on page 21. EBITDAre is
calculated on the basis defined by The National Association of Real Estate Investment Trusts, or Nareit, which is EBITDA, excluding gains and losses on the sale of real estate, loss on
impairment of real estate assets, if any, as well as certain other adjustments currently not applicable to us. In calculating Adjusted EBITDAre, we adjust for the items shown on page 21 and
include business management incentive fees only in the fourth quarter versus the quarter when they are recognized as expense in accordance with GAAP due to their quarterly volatility
not necessarily being indicative of our core operating performance and the uncertainty as to whether any such business management incentive fees will be payable when all contingencies
for determining such fees are known at the end of the calendar year. Other real estate companies and REITs may calculate EBITDA, EBITDAre and Adjusted EBITDAre differently than we
do.
FFO AND NORMALIZED FFO
We calculate funds from operations, or FFO, and Normalized FFO as shown on page 22. FFO is calculated on the basis defined by Nareit, which is net income (loss), calculated in
accordance with GAAP, excluding any gain or loss on sale of properties and loss on impairment of real estate assets, if any, plus real estate depreciation and amortization, less any
unrealized gains and losses on equity securities, as well as certain other adjustments currently not applicable to us. In calculating Normalized FFO, we adjust for the item shown on page
22 and include business management incentive fees, if any, only in the fourth quarter versus the quarter when they are recognized as expense in accordance with GAAP due to their
quarterly volatility not necessarily being indicative of our core operating performance and the uncertainty as to whether any such business management incentive fees will be payable when
all contingencies for determining such fees are known at the end of the calendar year. FFO and Normalized FFO are among the factors considered by our Board of Trustees when
determining the amount of distributions to our shareholders. Other factors include, but are not limited to, requirements to maintain our qualification for taxation as a REIT, limitations in our
credit agreement and public debt covenants, the availability to us of debt and equity capital, our distribution rate as a percentage of the trading price of our common shares, or dividend
yield, and to the dividend yield of other REITs, our expectation of our future capital requirements and operating performance and our expected needs for and availability of cash to pay our
obligations. Other real estate companies and REITs may calculate FFO and Normalized FFO differently than we do.
COVERAGE
We define hotel coverage as total hotel revenues minus all hotel expenses and FF&E reserve escrows which are not subordinated to minimum returns due to SVC divided by the minimum
returns or rents due to SVC.
We define net lease coverage as annual property level adjusted earnings before interest, taxes, depreciation, amortization and rent, or EBITDAR, divided by the annual minimum rent due
to us weighted by the minimum rent of the property to total minimum rents of the net lease portfolio. The annual property level adjusted EBITDAR is determined based on the most recent
operating statements, if any, furnished by the tenant. Operating statements furnished by the tenant often are unaudited and, in certain cases, may not have been prepared in accordance
with GAAP and are not independently verified by us. Properties that do not report operating information are excluded from the coverage calculations.
Non-GAAP Financial Measures Def ini t ions.
23

S E RV ICE P ROP E RTIE S TRUS T (Nasdaq: S V C) | Inves t o r P resen ta t i o n Q3 2019
Service Properties Trust
Q3 2019 Investor Presentation