Embed Size (px)
Citation preview

E
SERVICE QUALITY OF UNIVERLIBRARY: A SURVEY AMONGST ST
AT OSMANGAZI UNIVERSITY AND UNIVERSITY
Yrd.Doç.Dr. Zeynep Filiz *
Bu makale 15.05.2006 tarihinde alınmış hakem kontrolü sonrasında 31.01.2007 tarihuygun bulunmuştur.
Abstract
Keywords:: Library, Satisfaction, Servqual, Service Quality, Perception, Expectation, FRegression Analysis
Student satisfaction is an important measure of service quality in libraries. Students’ pseem to have been largely ignored by library management in developing countries. Tquality provides an important feedback for libraries to assess and improve its servicthis study is to develop a reliable and valid instrument measure student satisfaction Library and Anadolu University Library. A questionnaire to measure the service quawas used and a total of 400 students at two university libraries were interviewed. Factodetermine the factor structure. The instrument of the student satisfaction developeinsights to the researches who study the improvement of student satisfaction with serlibraries and decision markers.
Jel Classification: C420, C490 Özet
Anahtar Kelimeler: Kütüphane, Memnuniyet, Servqual, Servis Kalitesi, Algı, BeklentRegresyon Analizi
Öğrenci memnuniyeti kütüphanelerdeki servis kalitesinin ölçümünde önemlidir. Öğrebeklentileri gelişen ülkelerde kütüphane yönetimi tarafından büyük ölçüde göz ardı edServis kalitesinin değerlendirilmesi kütüphane kullanıcıları için kütüphane sdeğerlendirmek için kütüphanelere önemli bir bilgi sağlar. Bu çalışmanın amacı kütüphanesi ile Anadolu Üniversitesi kütüphanesindeki öğrenci memnuniyetini ölçeölçme aracı geliştirmektir. Üniversite kütüphanelerinin servis kalitesini ölçmek için büniversite kütüphanesinde toplam 400 öğrenci ile görüşülmüştür. Faktör analizi uyggeliştirilen öğrenci memnuniyetini ölçme aracı karar vericilere ve üniversite kütüphageliştirmeye çalışan araştırmacılara ışık tutar.
Jel Sınıflaması: C420, C490 * Adres: Eskişehir Osmangazi University, Science and Art Faculty, Statistics Departm26480 E-Mail: [email protected]
İSTANBUL ÜNİVERSİTESİ İKTİSAT FAKÜLTESİ
KONOMETRİ VE İSTATİSTİK DERGİSİ
Ekonometri ve İstatistik Sayı:5 2007- 06-08SITY UDENTS
ANADOLU
inde düzeltilerek yayını
actor Analysis,
erceptions about libraries he assessment of service
e to its users. The aim of in Osmangazi University lity of university libraries r analysis was utilized to d in this study provides vice quality of university
i, Faktör Analizi,
ncilerin kütüphanelerden ilmiş gibi görünmektedir. ervisini geliştirmek ve Osmangazi Üniversitesi
n geçerli ve güvenilir bir ir anket kullanılmıştır. İki ulanmıştır. Bu çalışmada nelerinin servis kalitesini
ent, Eskişehir, Turkey,

Service Quality of University Library: a Survey amongst Students at Osmangazi University and
Anadolu University
2
Introduction
The concepts of satisfaction and quality are often used together, and sometimes
interchangeably. Few researchers have identified the particular relationship between the two
concepts, however a number of general statements have been made. According to (Oliver,
1981:42) “… satisfaction is the emotional reaction following a disconfirmation experience
which acts on the base attitude level and is consumption-specific”. Perceived quality, on the
other hand, is defined and contrasted to satisfaction by (Parasuraman, Zeithaml and Berry,
1988:16) as “… a global judgment, or attitude, relating to the superiority of the service,
whereas satisfaction is related to a specific transaction”.
Thus, these two concepts are related in that incidents of satisfaction, over time, result
in perceptions of quality (Hebert, 1993:21). This relationship, however, has not been widely
tested empirically. In particular, academics and practitioners alike have exhibited considerable
interest in the issues that surround the measurement of service quality and the
conceptualization of relationship between service quality and consumer satisfaction (Brady,
Cronin and Brand, 2002:17).
Satisfaction in library users has been a concern of researchers and practitioners alike in
the field of library and information sciences (Hiller, 2001:606; Nitecki and Franklin,
1999:485; Allen, Ward, Wary and Lopez, 2003:138; Martensen and Granholdt, 2003:140;
Calvert, 1998:296; Harwood and Bydder, 1998:161; Shi, Holahan, and Jurkat, 2004:122).
Although user satisfaction is not an unfamiliar topic in library science, there are not yet wide
researchers related to library user satisfaction that is a predictor of service quality and
performance measure of library in Turkey.
The primary purpose of this study is to diagnose accurately service shortfalls in the
libraries, through assessing and comparing the perceptions of the library users in Eskişehir.
The model found in regression analysis enhances understanding of the users’ expectations and
it roles in improving service quality in university libraries (Osmangazi University Library and
Anadolu University Library).

Ekonometri ve İstatistik Sayı:5 2007
3
Research Method
Questionnaire Design
A modified version of SERVQUAL was used in this study (Hebert, 1993:144;
Landrum and Prybutok, 2004:631). Surveys have been used as a tool to assess service quality
and users satisfaction. The questionnaire was made up of four consecutive parts. Part 1 was
designed to assess student’s expectations and quality of library environment, quality of library
service, information quality and system quality. Part 2 assessed usefulness. Part 3 collected
students’ observation about the library. Part 1, part 2 and part 3 was used a seven- point Likert
scale with “1” being “strongly disagree” and “7” being “strongly agree”. Part 4 contained a
few more questions concerning student’s use of the library.
A pilot test was conducted to assess the reliability of the attributes and to ensure that
the wording, format, length and sequencing of questions.
The survey was undertaken with the student populations at Osmangazi University
Library and Anadolu University Library. Reliability analysis was also employed to test the
internal consistency of questionnaire. Cronbach’s alpha coefficient was calculated as 0.9463.
Results have revealed significant variation between user concerning library
satisfaction, use and importance.
Results
Characteristics of Sample
The data set used for this study comes from a survey conducted. The study sample was
selected randomly. The students who were discharged from these universities during 1-15
May 2005 were interviewed before they left the library. Students who were not willing to
answer to questionnaire were not interviewed. A total of 450 surveys were ultimately
completed. Additional data collection was not pursued due to time and resource constraints.
Of the total number of completed surveys, 50 were considered problematic due to excessive
missing data, “don’t know” answer and response biases. The data from these surveys were not

Service Quality of University Library: a Survey amongst Students at Osmangazi University and
Anadolu University
4
included in the data set. Thus, a total of 400 usable responses were received. Table 1 presents
the characteristics of sample. About 70% of the respondents were men and 50% of responses
were from Osmangazi University. About 75% of respondents had used the library more than
six times, and 51% of respondents indicated they relied on the library staff frequently when
using the library. Moreover, about 35% of respondents said they intended to use the library in
the future and recommended others to use the library. In addition, every two library meet
students’ information needs.
Table 1
Similarity and Differences amongst Students
One of the benefits of a large respondent pool is the ability to do analysis on
differences within the group. While there may be a set of similar characteristics that define a
group, there may also be significant variation within that group. Academic user communities
are not homogeneous in way they use libraries nor in their needs for library resources and
services. In addition to differences between faculty and students, there may also be significant
differences between those in different academic areas or by gender or some other
demographic component. These have important implications for identifying user needs,
concerns and issues that may be missed in analyzing aggregate results.
This article discusses issues and results associated with Osmangazi University Library
and Anadolu University Library in Eskişehir and will compare similarities and differences in
results.
Firstly, ANOVA with importance as dependent variable and grade as independent
variable were conducted. I found that the effect of grade at the 5% significance level is
significant (F5,394=56,529; p=0,000<0,05). The results of the Tukey post hoc test did show
that master students were found to be significantly more importance than the other grade
students.
Moreover ANOVA with perception as dependent variable and grade as independent
variable were conducted. I found that the effect of grade at the 5% significance level is
significant (F5,394=44,452; p=0,000<0,05). According to Tukey test, master students were

Ekonometri ve İstatistik Sayı:5 2007
5
found to be significantly more perception than the 1 grade students, 2 grade students and 3
grade students.
ANOVA with importance as dependent variable and faculty as independent variable
and ANOVA with perception as dependent variable and faculty as independent variable were
conducted. There is no difference between faculty effects at 5% significance level. The
different faculties do not affect the importance (p=0.700>0.05) and perception.
(p=0,221>0.05). Namely, survey results did not show any statistical differences in responses
by faculty.
Regarding sex differences, significant differences between male and female students
were found in their importance (p=0,000<0.05). Female students (mean=6.3549) were more
importance of library service quality than male students (mean=6.0997). No gender effect was
found in their perceptions (p=0,282).
Regarding university differences, significant differences between Osmangazi and
Anadolu students were found in their perceptions (p=0,002<0.05). Anadolu students
(mean=5,1405) were more satisfied with library service quality than Osmangazi students
(mean=4,8988). No university effect was found in their importance (p=0,110).
Paired t Test
Service quality can be defined as the difference between what student importance of
service and what performance they actually perceive. If importance scores are greater than
perceived performance scores, then perceived quality is less than satisfactory and hence
student dissatisfaction occurs (Kim, 2003:21; Brady, Cronin and Brand, 2002:19). In this
case, paired t test was used.
Paired-t test was employed to test the significant difference between the two means of
importance and performance. Table 2 shows the respective expectation means, importance
means, gap means and t values.
The paired samples t tests between the respective performance means and importance
means of all attributes showed that they were significantly different (p<0.01). The negative
gap means indicated that the perceived university library quality provided by university did
not meet students’ expectations. It should be noted that the importance scores in this study
were greater than the perception scores for every item. The positive gap means indicated an

Service Quality of University Library: a Survey amongst Students at Osmangazi University and
Anadolu University
6
area of strength and a competitive advantage for the service provider. The result also showed
that none of the aspects of service quality had negative gap score. All 29 statements indicated
that the quality of service did not fall sort of the users’ importance; user were generally
satisfied with the service providers.
The smaller the gap, the better the service quality provided, and the greater the student
satisfaction. The largest gap scores were found for 2.2825 (an online catalog that is easy to
use).
Investigating the performance and importance of quality of service (Table 2) users
gave the highest performance score of 5.92 for currency of information received. Meanwhile,
there were the lowest score of 4.13 for online catalog that is easy to use. Compared to
importance of quality of service, the users collectively gave the highest score of 6.65 for
accuracy of information received. The lowest score of 5.54 referred to have the users’ best
interests at heart. Therefore, comparing the results between user’s performance and
importance on service quality had interesting findings, especially the differences among the
gap means.
Table 2
Factor Analysis
The construct validity of the measures was tested using exploratory factor analysis
(principal component analysis and varimax orthogonal rotation method). A factor analysis
performed on the performance scores resulted in identifying five library service quality
dimensions. The factor analysis extracted five factors with eigenvalues greater than one. Only
factors with eigenvalue equal to or greater than 1 were considered significant and chosen for
interpretation (www.ncjrs.org/ondcppubs/treat/concensus/dembo.pdf:12; Akgül and Çevik,
2005:422; Hair, Anderson and Tatham, 1990:247). A varimax factor rotation was performed
on the dimensions to examine the structure (Morrison, 1976:370; Srivastava and Carter,
1983:304; Filiz, 2003:216; Dyrstad, 1998:116; Tatlıdil, 2002:180; Hardle and Simar,
2003:289; Abdul-Wahab, Bakheit and Alawi, 2005:1268; Oman, Vesely, Mcleray, Harris-
Wyatt, Aspy, Rodine and Marshall, 2002:250). After the rotation, one item (visually

Ekonometri ve İstatistik Sayı:5 2007
7
appealing documentation) that failed to exhibit a factor of 0.50 was eliminated (Landrum and
Prybutok, 2004:633). Factor analysis was repeated. Each item loaded with a factor greater
than 0.50 on a single dimension. Table 3 shows a summary of the rotated components with
loadings greater than 0.50. Five factors were extracted that explained 83.56 percent of the
variance in the data (Total variance explained and paired t test of factors are in Appendix C).
These were lapelled: A possible name for first factor was “Quality of library service
provided”, a possible name label for factor 2 was “Quality of information and library
environment”, a possible name for factor 3 was “Reliability”, a possible name label for factor
4 was “Quality of online catalog system” and a possible name for last factor was
“Confidence”.
The process of naming factors has been demonstrated. It is not very scientific and is
based on the subjective opinion of the analyst. Different analyst will no doubt assign different
names to the same results because of the difference in their background and training. For this
reason, the process of labeling factors is subject to considerable criticism. But if a logical
name can be assigned that represents the underlying nature of the factors, it usually facilitates
the presentation and understanding of the factor solution and therefore is a justifiable
procedure (Hair, Anderson and Tatham, 1990:258).
Table 3
Regression Analysis
A regression analysis was performed to check the ability of each type of score to
predict library service quality (Kim, 2003:105; Koerner, 2000:276). A linear regression
analysis was used these five component using library satisfaction as the dependent variable.
The object of this analysis is to quantify the relationship between the dependent variable and
the independent variables (components). The model exhibited an adjusted 2R value of 0.63.
All five variables were significant predictors of library satisfaction, and the t-values indicated
that five component are strong predictors of library satisfaction. The results of this regression
analysis are shown in Table 4. The variables in the model have great impact on student library
satisfaction as indicated by the standardized β values that are useful for comparing the

Service Quality of University Library: a Survey amongst Students at Osmangazi University and
Anadolu University
8
regression coefficients with respect to their impact on dependent variable. The magnitude of
these values shows the order of importance about impact on overall satisfaction.
Table 4
Discussion and Conclusion
The research on measuring service quality has focused primarily on how to meet or
exceed the student’s expectations, and has viewed service quality as a measure of how the
delivered service level matches student’s expectations.
The concept of measuring the difference between importance and perceptions in the
form of the SERVQUAL gap score proved very useful for assessing levels of service quality.
This study applied on adopted SERVQUAL instrument to measure the service of two
university libraries. Gap analysis, factor analysis and regression analysis used to identify
service shortfalls of the libraries. A number of recommendations to address these shortfalls
have been proposed.
In this study gap analysis was employed to test the significant difference between the
two means of performance and importance. The smaller the gap, the better the service quality
provided, and the greater the student satisfaction.
Results of gap analysis indicated that the quality of service did not fall sort of the
user’s expectations; user were generally satisfied with the service providers. Moreover, a
factor analysis performed on the performance scores resulted in identifying five library
service qualities. Five factors were extracted that explained 83.56 percent of the variance in
the data. Then, a linear regression analysis was performed on these five component using
library satisfaction as the dependent variable. All five variable were significant predictors of
library satisfaction, and the t-values indicated that five component are strong predictors of
library satisfaction. It is said that the impacts on students’ overall satisfaction of these factors
are same level because the magnitude of standardized β value are close. These results show
that these factors are important for library systems that improve student satisfaction degree in
library system.
Ekonometri ve İstatistik Sayı:5 2007
9
As a result, it can be said that five library service quality factors using in this study
positively affected students’ overall satisfaction and are crucial to an excellent library system.
Developing instruments were satisfactory but there is a need for continuous evaluation
and verification of other researches because the student satisfaction instrument about user
satisfaction in library varies with respect to time and technology.
There are no major significant differences in the perceptions of library service quality
and in the importance of library service quality between faculties. Moreover, survey results
did not show statistical differences in perceptions of library service quality by gender and
between Osmangazi University and Anadolu University students.
The survival of a library very much depends on the benefits it brings to users. Its
existence will be in question when users begin looking for alternatives to library services. One
way to show value is by providing quality service. It is therefore important for the library to
be aware of changing user expectations, and to continually strive to provide quality service to
its users.
References
1) Abdul-Wahab, S.A., Bakheit, C.S. and Al-Alawi, S.M. (2005), Principal Component and Multiple Regression
Analysis in Modeling of Ground-level Ozone and Factors Affecting its Concentrations, Environmental Modeling
& Software, 20, 1263-1271.
2) Akgül, A. and Çevik, O. (2005), İstatistiksel Analiz Teknikleri, Emek Ofset Ltd. Sti, Ankara
3) Allen, M., Ward S.M., Wary T. and Debus-Lopez K.E. (2003), Patron-focused Services in Three US
Libraries: Collaborative Interlibrary Loan, Collection Development and Acquisitions, Interlending & Document
Supply, 31(2), 138-141.
4) Brady, M.K., Cronin, J.J. and Brand R.R. (2002), Performance-only Measurement of Service Quality: a
Replication and Extension, Journal of Business Research, 55, 17-31.
5) Calvert, P.J. (1998), A Different Time, a Different Country: an Instrument for Measuring Service Quality in
Singapore’s Polytechnic Libraries, The Journal of Academic Librarianship, 24 (4), 296-299.
6) Dyrstad, K. (1998), Selective Improvements in Multiquality Products Assisted by Rotated Principal
Components, Chernometrics and Intelligent Laboratory Systems, 42, 115-124.
7) Filiz, Z. (2003), Güvenilirlik Çözümlemesi, Temel Bileşenler ve Faktör Çözümlemesi, Anadolu University
Journal of Science and Technology, 4(2), 211-222.
8) Hair, J.F., Anderson, R.E. and Tatham R.L. (1990), Multivariate Data Analysis with Readings, Maxwell
MacMillan International Editions, New York.
9) Hardle, W. and Simar, L. (2003), Applied Multivariate Statistical Analysis, Tech. Methot & Data
Technologies.

Service Quality of University Library: a Survey amongst Students at Osmangazi University and
Anadolu University
10
10) Harwood, N. and Bydder J. (1998), Student Expectations of, and Satisfaction with, the University Library,
The Journal of Academic Librarianship, 24(2), 161-171.
11) Hébert, F. (1993), The Quality of Interlibrary Borrowing Services in Large Urban Public Librarries in
Canada, Unpublished Doctoral Dissertation, University of Toronto.
12) Hiller, S. (2001), Assessing User Needs, Satisfaction, and Library Performance at the University of
Washington Libraries, Library Trends, 49(4), 605-625.
13) Kim, Y. (2003), Measuring and Assessing Internet Service Quality at Public Libraries, Unpublished Doctoral
Dissertation, University of Wisconsin-Madison.
14) Koerner, M.M. (2000), The Conceptual Domain of Service Quality for Inpatient Nursing Services, Journal of
Business Research, 48, 267-283.
15) Landrum, H., and Prybutok, V.R. (2004), A Service Quality and Success Model for the Information Service
Industry, European Journal of Operational Research, 156, 628-642.
16) Martensen, A. and Granholdt L. (2003), Improving Library Users’ perceived Quality, Satisfaction and
Loyalty: an Integrated Measurement and Management System, The Journal of Academic Librarianship, 29(3),
140-147.
17) Morrison, D.F. (1976), Multivariate Statistical Methods, Second Edition, Mcgraw-Hill Book Company, New
York.
18) National Criminal Justice Reference Service. www.ncjrs.org/ ondcppubs/treat/consensus/dembo.pdf
19) Nitecki, D. and Franklin B. (1999) New Measures for Research Libraries, Journal of Academic
Librarianship, 25(6), 484-487.
20) Oliver, R.L. (1981), Measurement and Evaluation of Satisfaction Process in Retail Settings, Journal of
Marketing, Fall, 41-50.
21) Oman, R.F., Vesely, S.K., Mcleroy, K.R., Harris-Wyatt, V., Aspy, C.B., Rodine, S.R. and Marshall, L.
(2002), Reliability and Validity of the Youth Asset Survey, Journal of Adolescent Health, 31, 247-255.
22) Parasuraman, A., Zeithaml, V.A., and Berry L.L. (1988), SERVQUAL: A multiple-item scale for measuring
customer perceptions of service quality, Journal of Retailing, 64, 12-40.
23) Shi, X., Holahan, P.J, and Jurkat, P. (2004), Satisfaction Formation Processes in Library Users:
Understanding Multisource Effects, The Journal of Academic Librarianship, 30(2), 122-131.
24) Srivastava, M.S. and Carter E.M. (1983), An Introduction to Applied Multivariate Statistics. North-Holland,
New York,
25) Talıdil, H. (2002), Uygulamalı Çok Değişkenli İstatistiksel Analiz, Ziraat Matbaacılık A.Ş., Ankara
Table 1: Characteristics of the student sample

Ekonometri ve İstatistik Sayı:5 2007
11
Faculty and School Number of
Osmangazi
University
Students
Number of
Anadolu
University
Students
Total
Number of
Students
%
Faculty of Economic and
Administrative Sciences
40 26 66 16.5
Faculty of Education 24 28 52 13
Faculty of Arts and
Sciences
102 68 170 42.5
Faculty of Fine Arts 0 11 11 2.8
Faculty of Engineering and
Architecture
34 20 54 13.5
Faculty of Communication
Sciences
0 22 22 5.5
Faculty of Law 0 11 11 2.8
School of Civil Aviation 0 6 6 1.5
School of Physical
Education and Sport
0 3 3 0.7
Faculty of Pharmacy 0 5 5 1.2
Gender
Male 136 134 270 67.5
Female 64 66 130 32.5
Grade
1 28 34 62 15.5
2 28 28 56 14
3 70 70 140 35
4 36 43 79 19.8
5 0 2 2 0.5
Master 38 23 61 15.2

Service Quality of University Library: a Survey amongst Students at Osmangazi University and
Anadolu University
12
200 200 400
Table 2: Paired samples statistics
Attributes Performance
Means (SD)
Importance
Means (SD)
Gap Means
(importance-
performance)
T value p
1 5,4950(0,8814) 6,0850(0,9722) 0,5900 8,684 0,000
2 5,5100(0,9445) 6,4500(0,6919) 0,9400 19,250 0,000
3 5,1775(1,0458) 5,9650(1,1054) 0,7875 13,213 0,000
4 4,2550(1,5527) 5,7025(1,3242) 1,4475 26,995 0,000
5 5,2725(1,0937) 6,0825(0,9662) 0,8100 10,056 0,000
6 4,6225(1,1037) 6,0300(0,9199) 1,4075 22,869 0,000
7 4,7725(1,1309) 5,6675(0,6426) 0,8950 11,934 0,000
8 5,5375(0,9059) 6,1850(0,7630) 0,6475 15,156 0,000
9 4,9775(0,8596) 5,9450(0,9897) 0,9675 16,812 0,000
10 5,5150(1,4663) 6,2225(0,9166) 0,7075 9,386 0,000
11 4,5525(1,7987) 6,3925(0,7615) 1,8400 19,648 0,000
12 4,4425(1,7462) 6,1775(0,8353) 1,7350 15,869 0,000
13 4,6625(1,8116) 6,1000(0,9630) 1,4375 12,063 0,000
14 4,4900(1,3188) 6,2125(0,6110) 1,7225 25,536 0,000
15 5,0425(2,2120) 6,6125(0,6881) 1,5700 12,857 0,000
16 4,7050(1,1881) 5,9625(0,7633) 1,2575 17,712 0,000
17 4,8400(1,3468) 5,5425(1,2874) 0,7025 9,686 0,000
18 4,6650(1,3992) 6,1825(0,9227) 1,5175 20,531 0,000
19 4,4700(1,4121) 6,2025(0,7402) 1,7325 23,596 0,000
20 5,6175(1,0555) 6,6525(0,6346) 1,0350 16,274 0,000
21 5,3375(1,3521) 6,2500(0,7609) 0,9125 15,806 0,000
22 5,4550(1,1603) 6,1625(1,0142) 0,7075 12,531 0,000

Ekonometri ve İstatistik Sayı:5 2007
13
23 5,7650(0,9629) 6,4425(0,7092) 0,6775 10,540 0,000
24 5,1600(1,1950) 6,1700(1,0602) 1,0100 14,955 0,000
25 5,9200(0,7176) 6,5300(0,5831) 0,6100 13,311 0,000
26 4,1300(1,6123) 6,4125(0,8361) 2,2825 24,121 0,000
27 4,9100(0,8207) 6,4725(0,7620) 1,5625 26,851 0,000
28 4,9275(1,3216) 6,2825(0,7204) 1,3550 16,903 0,000
29 5,3424(1,0835) 6,2025(0,8766) 0,8600 12,767 0,000
Table 3 Rotated component matrix of performance scores
1 2 3 4 5
Providing service as promised ,942
Readiness to respond to users’ requests ,927
Courteous staff ,865
Staff who instill confidence in users ,917
Making users feel secure about transactions ,889
Staff who are knowledgeable about questions ,890
Having the users’ best interests at heart ,618
Dealing with users in a caring fashion ,705
Understanding the needs of users ,920
Precision of information received ,675
An online catalog that is easy to use ,809
Accuracy of informed received ,782
Reliability of information received ,772
Relevance of information received ,753
Currency of information received ,751
Visually appealing facilities ,623
Neat, professionally appearing staff ,514
Dependability in handling users’ problems ,607
Performing service right the first time ,600

Service Quality of University Library: a Survey amongst Students at Osmangazi University and
Anadolu University
14
Providing service at the promised time ,835
Prompt service to users ,617
Willingness to help users ,719
Giving users individual attention ,830
Completeness of information received ,697
An online catalog that is easy to learn ,762
An online catalog that you can interact with in a clear and
understandable way
,615
An online catalog that is easy to become skillful at using ,849
Keeping users informed ,732
Table 4: Regression results of library satisfaction on five components
Unstandardized Coefficients Standardized
Coefficients
B Std. Error Beta
t
Sig.
(Constant)
1. factor
2. factor
3. factor
4. factor
5. factor
5,205
0,257
0,515
0,228
0,299
0,661
0,037
0,037
0,037
0,037
0,037
0,037
0,215
0,429
0,190
0,249
0,551
142,409
7,031
14,066
6,226
8,172
18,051
,000
,000
,000
,000
,000
,000
Adjusted 2R =0.63; F5,394=135,738 p<0.001
Appendix A
How important this How the library

Ekonometri ve İstatistik Sayı:5 2007
15
item is to me performs here
Low High Low High
1.)Visually appealing facilities
2.)Neat, professionally appearing staff
3.)Visually appealing documentation
4.)Providing service as promised
5.)Dependability in handing users’ problems
6.)Performing service right the first time
7.)Providing service at the promised time
8.)Keeping users informed
9.)Prompt service to users
10.)Willingness to help users
11.)Readiness to respond to users’ requests
12.)Courteous staff
13.)Staff who instill confidence in users
14.)Making users feel secure about transactions
15.)Staff who are knowledgeable about questions
16.)Giving users individual attention
17.)Having the users’ best interests at heart
18.)Dealing with users in a caring fashion
19.)Understanding the needs of users
20.)Accuracy of information received
21.) Precision of information received
22.) Reliability of information received
23.) Completeness of information received
24.) Relevance of information received
25.) Currency of information received
26.) An online catalog that is easy to use
27.) An online catalog that is easy to learn
28.) An online catalog that you can interact with in a clear
and understandable way
29.) An online catalog that is easy to become skillful at
using
1 2 3 4 5 6 7 1 2 3 4 5 6 7
1 2 3 4 5 6 7 1 2 3 4 5 6 7
1 2 3 4 5 6 7 1 2 3 4 5 6 7
1 2 3 4 5 6 7 1 2 3 4 5 6 7
1 2 3 4 5 6 7 1 2 3 4 5 6 7
1 2 3 4 5 6 7 1 2 3 4 5 6 7
1 2 3 4 5 6 7 1 2 3 4 5 6 7
1 2 3 4 5 6 7 1 2 3 4 5 6 7
1 2 3 4 5 6 7 1 2 3 4 5 6 7
1 2 3 4 5 6 7 1 2 3 4 5 6 7
1 2 3 4 5 6 7 1 2 3 4 5 6 7
1 2 3 4 5 6 7 1 2 3 4 5 6 7
1 2 3 4 5 6 7 1 2 3 4 5 6 7
1 2 3 4 5 6 7 1 2 3 4 5 6 7
1 2 3 4 5 6 7 1 2 3 4 5 6 7
1 2 3 4 5 6 7 1 2 3 4 5 6 7
1 2 3 4 5 6 7 1 2 3 4 5 6 7
1 2 3 4 5 6 7 1 2 3 4 5 6 7
1 2 3 4 5 6 7 1 2 3 4 5 6 7
1 2 3 4 5 6 7 1 2 3 4 5 6 7
1 2 3 4 5 6 7 1 2 3 4 5 6 7
1 2 3 4 5 6 7 1 2 3 4 5 6 7
1 2 3 4 5 6 7 1 2 3 4 5 6 7
1 2 3 4 5 6 7 1 2 3 4 5 6 7
1 2 3 4 5 6 7 1 2 3 4 5 6 7
1 2 3 4 5 6 7 1 2 3 4 5 6 7
1 2 3 4 5 6 7 1 2 3 4 5 6 7
1 2 3 4 5 6 7 1 2 3 4 5 6 7
1 2 3 4 5 6 7 1 2 3 4 5 6 7
Strongly disagree Strongly agree

Service Quality of University Library: a Survey amongst Students at Osmangazi University and
Anadolu University
16
1) The library enables me to accomplish tasks faster
2) The library improves my ability to do research
3) The library enhances my effectiveness
4) The library enables me to be more productive
5) The library makes it easier to do research
6) Overall I find the library at this organization useful
1) How adequately does the library meet your information
needs?
inadequate 1 2 3 4 5 6 7 adequate
2) How effective is the library?
ineffective 1 2 3 4 5 6 7 effective
3) How efficient is the library?
inefficient 1 2 3 4 5 6 7 efficient
4) Overall are you satisfied with the library?
dissatisfied 1 2 3 4 5 6 7 satisfied
5) How would you rate the quality of service provided by
the library as a whole?
poor 1 2 3 4 5 6 7 excellent
1) How often have you physically visited the library at your
facility in the past year?
none once 2 to 5 times 6 to 10 times 11 or more times
1 2 3 4 5
2) How often have you used the library’s online catalog in
the past year?
none once 2 to 5 times 6 to 10 times 11 or more times
1 2 3 4 5
3) How often have you requested help or service from the
library over the phone or through email in the past year?
none once 2 to 5 times 6 to 10 times 11 or more times
1 2 3 4 5
1 2 3 4 5 6 7
1 2 3 4 5 6 7
1 2 3 4 5 6 7
1 2 3 4 5 6 7
1 2 3 4 5 6 7
1 2 3 4 5 6 7
Ekonometri ve İstatistik Sayı:5 2007
17
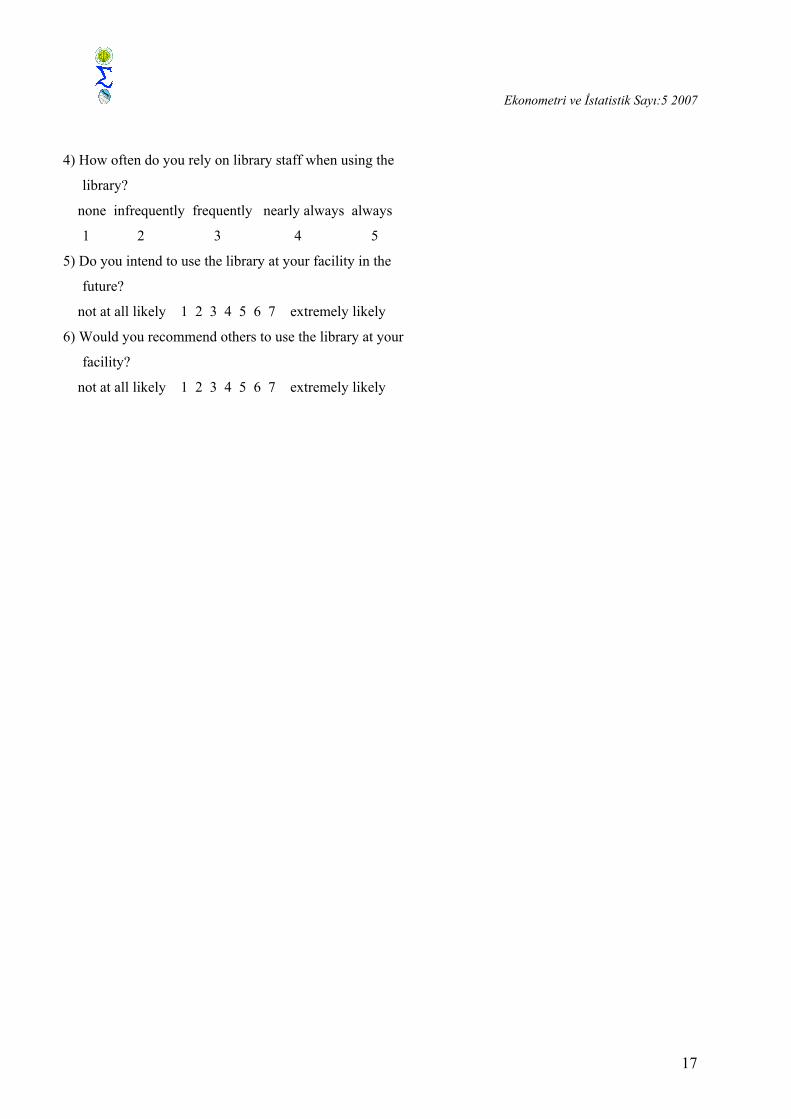
4) How often do you rely on library staff when using the
library?
none infrequently frequently nearly always always
1 2 3 4 5
5) Do you intend to use the library at your facility in the
future?
not at all likely 1 2 3 4 5 6 7 extremely likely
6) Would you recommend others to use the library at your
facility?
not at all likely 1 2 3 4 5 6 7 extremely likely

Service Quality of University Library: a Survey amongst Students at Osmangazi University and
Anadolu University
18
Appendix B
Eskişehir Osmangazi University and Documentation Centre covers an area of 7.200m2
with exhibition halls while Anadolu University Library and Documentation Centre covers an
area of 12.330m2 with exhibition halls. Both libraries serve 700 simultaneous sitting readers.
In Eskişehir Osmangazi University and Documentation Centre, there are overall 80.000
publications, of these 38.250 are books and 32.313 are bound periodicals. Library subscribes
to 240 periodicals and has access to full text e-journals. In Anadolu University Library and
Documentation Centre, there are overall 180.000 publications, of these 178.469 are books and
25.516 are bound periodicals. Library subscribes to 1.227 periodicals and has access to full
text e-journals. There are 30 personnel in both libraries.

Ekonometri ve İstatistik Sayı:5 2007
19
Appendix C
Table: Total variance explained
Total Variance Explained
11,580 41,357 41,357 11,580 41,357 41,357 9,346 33,378 33,35,101 18,218 59,575 5,101 18,218 59,575 4,533 16,190 49,53,753 13,405 72,980 3,753 13,405 72,980 4,255 15,197 64,71,668 5,959 78,939 1,668 5,959 78,939 3,031 10,825 75,51,295 4,624 83,563 1,295 4,624 83,563 2,232 7,973 83,5
,918 3,280 86,843,825 2,945 89,788,634 2,265 92,052,535 1,909 93,962,381 1,361 95,323,248 ,887 96,211,223 ,795 97,006,168 ,599 97,605,144 ,515 98,120,105 ,374 98,494
8,507E-02 ,304 98,7987,597E-02 ,271 99,0695,930E-02 ,212 99,2815,530E-02 ,198 99,4793,563E-02 ,127 99,6062,863E-02 ,102 99,7082,472E-02 8,828E-02 99,7971,626E-02 5,807E-02 99,8551,510E-02 5,393E-02 99,9091,153E-02 4,118E-02 99,9507,029E-03 2,510E-02 99,9754,958E-03 1,771E-02 99,9932,090E-03 7,465E-03 100,000
Component12345678910111213141516171819202122232425262728
Total% of
VarianceCumulative
% Total% of
VarianceCumulative
% Total% of
VarianceCumulativ
%
Initial Eigenvalues Extraction Sums of Squared Loadings Rotation Sums of Squared Loadings
Table: Paired samples statistics for factors Factors Performance
Means (SD)
Importance
Means (SD)
Gap Means
(importance-
performance)
T value p
1 4,6261(1,4040) 6,1625(0,5133) 1,5364 22,860 0,000
2 5,5263(0,7856) 6,3417(0,5243) 0,8154 19,756 0,000
3 5,0900(0,8459) 6,0504(0,4110) 0,9604 19,410 0,000
4 5,0600(0,9130) 6,3192(0,6583) 1,2592 21,002 0,000
5 5,5375(0,9059) 6,1850(0,7630) 0,6475 15,156 0,000