Embed Size (px)
Citation preview
Revised Draft
Service Trade in East Asia
Shujiro Urata, Waseda University and
Kozo Kiyota, Keio University
May 2001
Key Words: Service Trade, Comparative Advantage, and Embodied Services JEL Classification Code: F11, F14 The authors are grateful for useful comments from Ponciano S. Intal, Jr., Richard Snape, Takatoshi Ito, and other participants at the Eleventh Annual East Asian Seminar on Economics titled “Trade in Services,” in Seoul, Korea, June 22-24, 2000
1
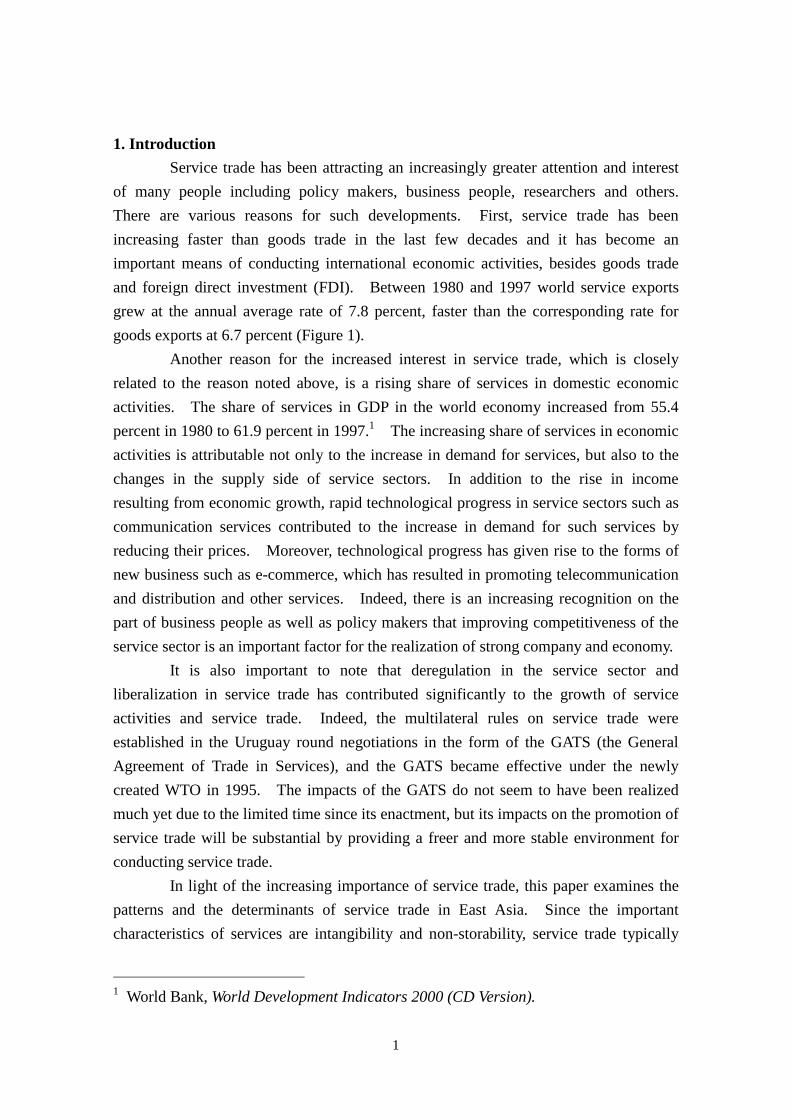
1. Introduction Service trade has been attracting an increasingly greater attention and interest
of many people including policy makers, business people, researchers and others. There are various reasons for such developments. First, service trade has been increasing faster than goods trade in the last few decades and it has become an important means of conducting international economic activities, besides goods trade and foreign direct investment (FDI). Between 1980 and 1997 world service exports grew at the annual average rate of 7.8 percent, faster than the corresponding rate for goods exports at 6.7 percent (Figure 1).
Another reason for the increased interest in service trade, which is closely related to the reason noted above, is a rising share of services in domestic economic activities. The share of services in GDP in the world economy increased from 55.4 percent in 1980 to 61.9 percent in 1997.1 The increasing share of services in economic activities is attributable not only to the increase in demand for services, but also to the changes in the supply side of service sectors. In addition to the rise in income resulting from economic growth, rapid technological progress in service sectors such as communication services contributed to the increase in demand for such services by reducing their prices. Moreover, technological progress has given rise to the forms of new business such as e-commerce, which has resulted in promoting telecommunication and distribution and other services. Indeed, there is an increasing recognition on the part of business people as well as policy makers that improving competitiveness of the service sector is an important factor for the realization of strong company and economy.
It is also important to note that deregulation in the service sector and liberalization in service trade has contributed significantly to the growth of service activities and service trade. Indeed, the multilateral rules on service trade were established in the Uruguay round negotiations in the form of the GATS (the General Agreement of Trade in Services), and the GATS became effective under the newly created WTO in 1995. The impacts of the GATS do not seem to have been realized much yet due to the limited time since its enactment, but its impacts on the promotion of service trade will be substantial by providing a freer and more stable environment for conducting service trade.
In light of the increasing importance of service trade, this paper examines the patterns and the determinants of service trade in East Asia. Since the important characteristics of services are intangibility and non-storability, service trade typically
1 World Bank, World Development Indicators 2000 (CD Version).
2
requires simultaneity in production and consumption, or physical contact. However, mainly because of technical progress in telecommunication services, some types of service trade can be conducted without physical contact.
Service trade takes four different modes, cross-border supply, consumption abroad, commercial presence, and the presence of natural persons. In this paper we examine service trade from two different perspectives. One is to examine service trade that is recorded in the balance of payments statistics. Although the classification of the items recorded in the balance of payments stastistics into the four modes of service trade indicated above is not straightforward, most items can be classified into service trade in the forms of cross-border supply and consumption abroad.2 Service trade in the forms of commercial presence and the presence of natural persons has increased notably in recent years as a result of rapid increase in FDI and movements of professionals, we do not analyze these types of service trade because of a lack of necessary data for the analysis. The other perspective that we adopt is to examine trade in services that are embodied in goods trade. Such analysis may be warranted, because a significant portion of services are non-tradable and thus traded indirectly through goods trade.
The structure of the paper is as follows. Section 2 provides a brief overview of service trade in East Asia, to set the stage for the following analyses. Section 3 examines the determinants of service trade by applying a regression analysis, while section 4 estimates trade in services that are embodied in goods trade by using input-output tables. Finally section 5 presents some concluding comments. 2 Recent Trends of Service Trade in East Asia East Asian economies registered substantial increases in service trade (Figure 1 and Table 1).3 Among them China recorded a particularly high growth of service trade. Between 1985 and 1998 the credit and debit of total services for China increased eight and ten times, respectively. The rates of expansion for other economies were less spectacular, but they were still very high. Some of the economies that exhibited high growth in total service trade include Korea and Thailand, whose credit (debit) in total service trade expanded by 6 (7) and 6 (7) times, respectively, during the 1985-98 period. 2 It should be noted that royalty receipts and payments, which are recorded in the balance of payments statistics, are an exception in that they do not represent cross-border services but they are derived from particular contractual arrangements involving factor services. 3 Due to the lack of appropriate price deflators, service trade in this paper is analyzed in
3
Among the East Asian economies that recorded rapid expansion in service trade Japan is an exception, as its value of total service trade increased much more slowly. This pattern is particularly notable for credit, which increased less than three-fold from 1985 to 1998, while its debit increased slightly more than three-fold. In spite of the relatively lower growth of service trade, the value of service trade for Japan is still significantly greater when compared to other East Asian economies. In 1998 the credit in total service trade for Japan is 2.5 times as large as that of the country with the second largest value, Korea, while the debit for Japan is more than 3 times as large as the economy with the second largest value, China. Rapid growth of service trade by East Asian economies resulted in an increase in their shares in world service trade. Specifically, the share of East Asia in world total service credit increased sharply from 12.2 percent in 1985 to 20.3 percent in 1997 before declining to 15.4 percent in 1998. The corresponding share in world total debit was higher but exhibited a similar pattern for the period under study, as it increased from 15.8 percent in 1985 to 29.5 percent in 1996 before declining to 23.3 percent in 1998. For service credit Japan and the NIEs accounted for the similar shares around 5.5 percent each of the world service credit, while the corresponding share for the ASEAN and China combined was somewhat smaller at 4.4 percent. As to the service debit, Japan had a notably high share of world service debit at 10.8 percent, while the shares for the NIEs and the ASEAN and China combined were similar at 6.4 and 6.1 percent, respectively.4 An examination of the service trade for the East Asian economies at sectoral level reveals a number of interesting developments.5 (Tables 1 and 2) For most economies transportation services account for a substantial part of their service credits. In 1998 more than 20 percent of service credits came from transportation services for Japan, Korea, Singapore, Taiwan, Malaysia, and Thailand.6 The figure is remarkably
terms of nominal prices. 4 For individual service trade categories, the East Asian economies account for very small share in world service trade except for few cases. The categories, where the shares exceed 10 percent of world total, are only found for Japan. Japan's shares of world credit in construction and royalties and license fees in 1998 were 20.8 and 11.5 percent, respectively, while its shares of world debit in construction, computer and information, and royalties and license fees were 22.6, 20.9 and 14.3 percent, respectively. 5 The differences in the availability of data among the East Asian economies make it difficult for us to make accurate comparisons. 6 A somewhat peculiar treatment of transportation services in service trade in the balance of payments statistics should be noted. Use of national carriers by nationals
4
high for Korea at 41.5 percent. Travel is an important source of service credit for many East Asian economies. Travel has a particularly large share for Indonesia, China and Thailand, where the respective shares in total service credits were 95, 52, and 47 percent, reflecting abundance in attractive tourist spots. Another similarity among the East Asian economies regarding sectoral service trade patterns is a high share of other business services such as consulting and accountant services, as for many economies its share exceeded 20 percent. There are other interesting observations to be made. Japan showed relatively high shares of construction and royalties in its total service credit, reflecting competitiveness in construction services and innovative activities. It should also be noted that Japan's large credit in construction services appears to be attributable to its large ODA in infrastructure, which generates exports of construction services from Japan. China recorded a relatively high share for insurance from 1985 to 1995 around 4-10 percent of total, but the share declined sharply to 1.6 percent in 1998. Turning to the debits of service trade by sectors, one also finds a relatively large share of transportation services, since for virtually all economies its share is greater than 20 percent in 1998. Coupled with the observation on sectoral shares in service credit examined earlier, this finding appears to indicate substantial amount of “intra-industry” trade in transportation services.7 The shares of travel in total service debit vary widely among the East Asian economies. Relatively rich economies such as Japan, Singapore, and Taiwan registered high values around 20-30 percent, while lower income economies including Indonesia, Malaysia, the Philippines and Thailand recorded relatively low values around 15 percent. These observations are consistent with our expectation that overseas travel is expensive so that rich economies can afford it but poor countries cannot. Korea and China appear to be exceptions from the groups discussed above. Although Korea is a relatively rich country in East Asia, its share of travel in total service debit is smaller compared with other high-income countries. One important reason is the economic crisis in 1998, which made it difficult for the Koreans to travel abroad. The corresponding share for China in 1998 is quite high at 31.8 percent. This high share may be attributable to the appreciation of Chinese Yuan vis-à-vis other Asian currencies, which promoted overseas travel by the Chinese.
“Other business services” is another service category, for which the shares in
for overseas transport is not recorded as international trade in services, whereas use of foreign carriers is recorded as international trade in services. Such treatment underestimates the magnitude of international trade in transportation services. 7 "Intra-industry" trade in the discussion refers to the cases where both credits and debits are recorded in comparable magnitude for the same service trade category.
5
total service debit are quite high for all the East Asian economies. Similar to the finding on transportation services, significant amount of intra-industry trade appears to be conducted. Royalty payments and insurance recorded debits for many East Asian economies. It is worth noting that significant amount of “intra-industry” trade in royalties is undertaken in Japan, while for Korea and Taiwan royalty payments are significantly greater than royalty receipts. These differences in the patterns of royalty trade between Japan on the one hand and Korea and Taiwan on the other hand appear to be attributable to the differences in their innovative capabilities. So far we have examined service trade for the East Asian economies by looking at credit and debit separately. The balance (credits-debits) of service trade gives us useful information on the competitiveness of the service sector concerned. One may divide the East Asian economies into three groups concerning the patterns of overall service trade balance. One group consisting of Japan, Taiwan, Indonesia, and Malaysia registers a deficit for all the years shown in Table 1. The second group consisting of Singapore, the Philippines, and Thailand exhibits a surplus for all or most years. The last group consisting of Korea and China does not show consistent patterns for the period under study. The balance of service trade at sectoral level reveals wide variations among the East Asian economies with one notable exception of insurance. For insurance all economies recorded an import surplus, reflecting a lack of competitiveness of insurance industry in East Asia vis-à-vis those in the U.S. and U.K. Japan registered deficit in all the categories except construction, and huge deficits were recorded in travel and other business services.8 Although the magnitude is significantly smaller compared to the Japanese case, the Philippines also had deficits in all the categories. For Korea a sizeable surplus was recorded for travel, while notable deficit was shown in royalties and license fees. As noted earlier, the depressed economic situation resulting from the economic crisis contributed significantly to a surplus in the travel account for Korea by reducing the demand for overseas travel. Singapore’s overall surplus mainly comes from a huge surplus in other business services, while Taiwan’s overall deficit is mainly due to the deficits in transportation services and travel. China, Malaysia, and Thailand had a similar pattern in that they recorded quite a big surplus in the travel account, but a huge deficit in transportation services. Similar to the case of Korea, sizeable surpluses in the travel account in 1998 for both Thailand and Malaysia are due to the economic crisis. In addition, for Malaysia a large deficit was recorded for other business services.
8 Unless otherwise noted, the discussions in this section refer to the data for 1998.
6
The information on Indonesia is incomplete but it indicates a large surplus in travel. As was indicated earlier, the information on trade balance may give useful information on the competitiveness of the sectors concerned. However, one should note that service trade, especially debits, for many East Asian economies are likely to be distorted because of restrictions on service trade imposed by these economies. This point may be seen clearly from the restrictiveness of foreign direct investment regime in service sectors for the East Asian economies in Table 3. Among the East Asian economies Thailand, the Philippines, and Korea had particularly restrictive regimes before the crisis, while Japan and Malaysia had relatively open regimes. Without these restrictions, the debits in service trade would have been greater, contributing to the deterioration of the trade balance. One example of government regulations in service trade is the governments’ bias for national carriers in the allocation of landing rights in airports and berthing space in seaports, limiting the imports of transportation services. It should also be noted that bilateral aviation agreements between countries effectively strangle competition on a great number of international routes. 3 The Determinants of Service Trade
The previous section discussed the changing patterns of service trade for East Asian economies. In this section we investigate the determinants of the patterns of trade in services, or the determinants of the patterns of comparative advantage in services. We use the figures on trade balance, which we examined in the previous section, as an indicator of comparative advantage. Those sectors with trade surplus are interpreted to possess a comparative advantage, while those with trade deficit a comparative disadvantage. 3.1 Previous Studies
As for merchandise trade, a number of empirical studies have been conducted to identify the determinants of the patterns of comparative advantage based on the cross-commodity regression framework. Most of these studies confirmed the validity of the Heckscher-Ohlin theorem to explain the patterns of comparative advantage.9 The pioneering work is Baldwin (1971), who conducted the cross-commodity regression analysis to examine the relationship between factor endowment and the pattern of comparative advantage for the United States. Regressing cross-sectoral trade performance on cross-sectoral factor intensity for production, he found that the 9 Deardorff (1984) and Leamer and Levinsohn (1995) perform the detailed survey work of the empirical international trade analyses.
7
U.S. manufacturing sector had a comparative advantage in the production of human capital intensive products. This finding is consistent with the Heckscher-Ohlin theorem, because the U.S. is relatively well endowed with human capital compared to its trading partners. Following Baldwin (1971), Stern and Maskus (1981) and Urata (1983) investigated the determinants of comparative advantage for the United States in 1958-1976 and for Japan in 1967 and 1975, respectively. Stern and Maskus also found that the U.S. had a comparative advantage in human capital intensive products, supporting the validity of the Heckscher-Ohlin Theorem. The findings by Urata were different in that Japan was shown to have a comparative advantage in human capital intensive products in its trade with developing countries while it was shown to have a comparative advantage in capital intensive products in its trade with developed countries. Realizing that Japan was placed somewhere in the middle of developed and developing countries in terms of the level of economic development, he argued that the findings were consistent with the Heckscher-Ohlin theorem. Although these analyses contributed to the empirical investigation of the determinants of foreign trade and comparative advantage, the empirical framework used in these analyses has been subject to criticisms, indicating that the cross-commodity regression analysis is rather weak on theoretical foundation10.
Bowen (1983) proposed an alternative approach – a cross-country regression approach. He collected factor endowment data for 34 countries for five years from 1963 to 1975 and investigated the relationship between factor abundance and comparative advantage. The estimation results revealed the availability of human capital, or skilled labor, as an important determinant of U.S. comparative advantage. His results are consistent with the results from the cross-commodity regression analyses. Leamer (1984) argued that the cross-country regression framework has stronger theoretical foundations than the cross-commodity approach.
Concerning service trade, however, there have been only few attempts to investigate the determinants of comparative advantage. One of the first rigorous attempts to identify the determinants of the pattern of comparative advantage in service trade was conducted by Sapir and Lutz (1981). They applied the cross-country regression analysis to service trade, focusing on freight transportation, other
10 See, for example, Leamer and Bowen (1981) and Bowen et al. (1998). Aw (1983) derived the sufficient condition that the sign of cross-commodity regression coefficients coincide with the theoretical implication. An alternative approach to support the cross-commodity regression is suggested by Petri (1991). He constructed the estimation model by relaxing the assumption of factor price equalization.
8
transportation, and insurance for 1971. Their results showed that the Heckscher-Ohlin theorem could go a long way in explaining trade pattern in services and that economies abundant with physical and human capital had a comparative advantage in services.
Sazanami and Urata (1990), following Sapir and Lutz (1981), performed a detailed analysis of the determinants of service trade. They also applied the cross-country regression framework, expanding the coverage to include travel, intellectual property rights and engineering services, in addition to freight transportation, other transportation, and insurance services, which were examined by Sapir and Luz. Their results indicated that both physical and human capitals were important determinants of service trade.
We extend the earlier studies by expanding the coverage of the service trade and the countries for the analysis. In our analysis eleven service trade categories, transportation, travel, communications, construction, insurance, financial services, computer and information, royalties and license fees, other business services, personal, cultural, and recreational services, and government services. Our country coverage includes 108 countries at maximum. We apply the cross-country regression framework to analyze the determinants of the patterns of comparative advantage in service trade and investigate whether the Heckscher-Ohlin theorem performs well in explaining service trade.. 3.2 The Empirical Framework for the Analysis of the Determinants of Service Trade
This section briefly explains the methodology, or the cross-country regression analysis framework, which is applied in this paper.11
Suppose that there are ),,1( Nn L= countries, ),,1( Ii L= commodities and ),,1( Jj L= factors. Let country n ’s net export (exports minus imports) vector be vector)1( ×InT , its output vector be vector)1( ×InQ and final demand vector be vector)1( ×InC . Assume that country n ’s factor input matrix is
matrix)( IJn ×A , whose element is ija and the number of commodities is equal to or
greater than the number of factors )( JI ≥ . The net export of factor in country n is provided by:
(1) nnnnnnn CAQATAF −≡≡
11 For more details, see Bowen and Sveikauskas (1982) and Bowen et al. (1998).
9
Suppose that each country satisfies traditional Heckscher-Ohlin-Vanek
(hereafter, HOV) assumptions - full employment ( nnn QAE = , where nE is the factor endowment vector )1( ×J in country n ), identical technologies )( nn ∀= AA , identical and homothetic preferences ( Wnn CC µ= , where nµ is country n ’s share of world expenditure and WC is world final demand). Assume that the world final
demand equals to the world output ( )11 W
N
n nN
n nW QQCC === ∑∑ ==. Let world
income be WY , country n ’s income be nY and its balance of trade be nb .12 With these assumptions, equation (1) is rewritten as: (2) WnnnWnnnn EEAQEATF )( λαµ −−=−=≡ ,
where ∑ == N
n nW 1EE is the factor endowment vector )1( ×J in the world, nα is
the ratio of country n ’s income to the world income )/( Wn YY , and nλ is the ratio of trade imbalance to the world income )/( Wn Yb .13 Assume that there are equal number of commodities and factors (this implies that A is square and can be inverted). Then we can rewrite equation (2) as:
(3) ( ) ( )Wnnnt
n EEAT )(1 λα −−= − ,
where superscript t means transpose. Therefore, the trade balance of commodity i in the country n , nit , is:
(4) ( ) ( )Wnnntinit EEA )(1 λα −−= − ,
where ( ) 1−tiA is a )(1 KJ =× vector whose elements 1−
ija are the row elements of the
12 The relationship between nb and nµ is as follows. Suppose that p is the vector of
commodity prices, and use Wnnn CQT µ−= , Wt
nnt
nt CpQpTp µ−= , where superscript t
means transpose, we obtain Wnnn YYb µ−= . 13 W
N
n nN
n nN
n nW EEAQQAAQ ==== ∑∑∑ === 111 and nnn λαµ −= .
10
inverse of the factor requirements matrix corresponding to commodity j . Suppose that trade is balanced )0( =nλ and let p and w be the vector of
world output prices )1( ×I and world factor prices )1( ×J , respectively. The expenditure share of country n,αn and long-run zero profit condition, 1−= Apw tt , implies:
(5) ( ) nt
nt
nt
nWY EwEApQp === −1α .
The last term in equation (5) means national expenditure in terms of factor prices. From equation (5), the following equation can be derived:
(6) ntinit ER=
where tiR is a vector of factor requirement for net exports with elements
( )Wjwiijij Ywyar /1 −= − .14 Equation (6) is the equation for cross-country regression
analysis. From equation (6), we derive the specification of the equation to be estimated
as (7).
(7) niniiniiniiini HLKT εββββ ++++= 3210 , where T is net export, K is physical capital, L is labor, H is human capital and ε is an error term. 3.3 The Hypotheses Following the findings from the earlier studies, and given the information on factor requirements for the provision of services, we constructed the following hypotheses concerning the determinants of the patterns of comparative advantage in service trade.
14 wiy is the world output of commodity i. Derivation of equation (6) is described in Appendix 1.
11
We classify 11 service categories into three categories and establish the hypotheses to be tested by the regression analyses. The first category includes physical capital and human capital intensive services. Communications, insurance, financial, computer and information, royalties and license fees, and government services are classified into this category. The second category is physical capital intensive services. Transportation and construction services are included in this group since these services require large scale of physical capital such as ships and construction machines. Finally, the third category includes travel, other business services, and personal, cultural and recreational services, provision of which require labor and human capital services. Table 2 summarizes the expected signs from the regression analysis, based on the Heckscher-Ohlin theorem. 3.4 The Data
The data for the dependent variables (net export of services) are taken from the IMF (1999). The data for the independent variables (labor, physical and human capital) are taken from the World Bank (1999) for all the countries except for Taiwan, for which Council for Economic Planning and Development, Republic of China (1999) is used. Since most countries do not provide physical capital data, we constructed the proxy for physical capital by using the information on gross domestic fixed investment. Specifically, we accumulated the value of gross fixed investment from 1960 by using the perpetual inventory method with a 10% depreciation rate.15 Labor is defined as the labor force (population aged 15 - 64). As for human capital, we use the tertiary school enrollment ratio as a proxy in the absence of better indicators such as the number of researchers and scientists. 3.5 The Results
We estimated the coefficients for the variables in equation (7) by using OLS and the results are shown in Tables 5-7. Table 5 presents the results of the estimation for equation (7), where the dependent variable is net export. The results indicate that only few estimated coefficients are consistent with our expectation and statistically significant. Specifically, labor (L) is shown to affect negatively to the competitiveness of transportation and insurance services. Physical capital (K) has a positive impact on construction and computer and information services. 15 For some countries, 1960 data is not available. In this case, we regard the first available year as the initial year.
12
Recognizing that service trade tends to be distorted by border measures and regulatory restrictions, we examined the determinants of the patterns of service exports only, and the results are shown in Table 6. As expected, the results turn out to be more favorable. According to our results, physical capital has a significantly positive impact on the exports of transportation, construction, and computer and information services, and human capital (H) has a significantly positive impact on the exports of travel, communications, insurance, financial, computer and information, and other business services. The estimated results on labor show that labor has a statistically significantly positive impact on insurance and finance, which are not consistent with our expectation.
Table 7 reports the results of the estimation, which uses imports as the dependent variable. The results are mixed in the sense that many of the estimated coefficients are either with unexpected signs or with expected signs but not statistically significant. These results are expected as service imports are subject to various restrictions. It is to be noted that the estimated coefficients on per capita GDP (PGDP) are mostly positive and in many cases statistically significant. The introduction of this variable is based on the recognition that demand patterns for services are not identical among countries with different income levels. Indeed, our findings appear to indicate that countries with high-income levels tend to demand greater amount of service imports, reflecting their preference for a variety. This also explains the significant amount of “intra-industry” trade in services.
Our results of the analysis of the determinants of service trade indicate that the Heckscher-Ohlin theorem does explain the patterns of trade of some services but its applicability is shown to be quite limited. These results may be due to the presence of restrictions and other barriers to service trade and also due to product differentiation in services, giving rise to “intra-industry” trade, for which the Heckscher-Ohlin model does not have much validity. To discern the determinants of the patterns of service trade, analyses using more detailed data have to be conducted. 4 Service Trade Embodied in Goods Trade
One of the special characteristics of services in general is that production and consumption takes simultaneously, as discussed in section 1. This characteristic makes it difficult for producers and consumers of services located in different places, let alone different countries, to trade services. Furthermore, various restrictions on service trade limit and distort service trade, as discussed in the previous section. Noting the increasing share of services in production of goods, one realizes that service are “traded” internationally in the form of goods trade. One may describe such trade as
13
trade in embodied services. For example, production of cars requires service inputs such as distribution and communication services, which enable producers to purchase parts and components. If a car is exported, such an export results in export of distribution and communication services indirectly. Based on the recognition of this point, we compute indirect trade of services for a selected number of East Asian economies. 4.1 Previous Studies
Despite the importance of trade in services embodied in goods trade, there have been only few studies that analyzed such type of service trade empirically. Early attempts are Tucker and Sundberg (1988) and Grubel (1988). The study by Tucker and Sundberg investigated the embodied services for Australia and Thailand in 1975 and for Singapore in 1973. Their results indicated that Australia exported approximately a half of its services in the form of embodied services in manufactured goods, while for Thailand the share was somewhat smaller at one-third. The share of embodied service exports in total service exports was found to be significantly smaller for Singapore at 18.5 percent. Grubel (1988) analyzed trade in embodied services for Canada in 1973 and 1983. He found that the value of embodied service exports increased rapidly from 1973 to 1983, to result in the situation in 1983, when the surplus in the balance of embodied service trade was greater than the deficit in the balance of service trade.
Sazanami and Urata (1990) examined the patterns of disembodied and embodied service trade for Japan in 1975 and 1985 and for the U.S. in 1982. They found that embodied service trade was significantly greater than disembodied service trade for both Japan and the U.S. Specifically, the ratios of embodied service exports (imports) to total exports (imports) for Japan in 1975 and 1985 were 0.78 (0.82) and 0.79 (0.80), while the corresponding ratio for the U.S. in 1982 was 0.78 (0.90). Urata (1994) extended the earlier analysis to study embodied and disembodied service trade for Japan in 1990. Similar to the earlier findings, he also found that the proportions of embodied service exports and imports in total exports and imports to be as high as 0.78 and 0.76. Urata also examined the patterns of embodied and disembodied service trade for five service categories, electricity, gas and water, commercial services, financial services, real estate, transportation and communication services, and other services. He found the proportion of embodied service exports to total exports to be extremely high for electricity, gas, and water, and real estate at 0.99. Knowing that these services are more or less completely non-tradable, his findings are understandable. Financial services and other services are found to have relatively high proportions
14
around 0.9, while the corresponding values for commercial services, and transportation and communication services are significantly lower, both at 0.7. Commercial services, and transportation and communication services are relatively easily traded compared to other services. The previous studies on developed countries showed the importance of service trade that is embodied in goods trade. Below we examine the patterns of embodied and disembodied service trade for selected East Asian economies. 4.2 The Methodology for Computing Service Trade Embodied in Goods Trade
Suppose that there are ),,1( Nn L= countries and ),,1( Ii L= commodities. Let country n ’s export vector be nEX ( 1×I vector), import vector be
nIM ( 1×I vector) and nD ( 1×I vector) be domestic final demand. nQ ( 1×I vector) and nA ( II × matrix) are output vector and input-output coefficient matrix, respectively. Let us drop country index n for simplicity. Incorporating these definitions, we can write the balance of domestic production and consumption as: (8) IMEXDAQQ −++≡ . With an assumption that nIM is exogenously determined and some manipulations, we obtain the magnitude of domestic production induced by exports and imports (import substitution) as: (9) EXAIQ 1)( −−≡EX and (10) IMAIQ 1)( −−=IM . Let us turn to the computation of services embodied in goods trade. Suppose that service industries are labeled from 1+h to I in i . In other words, if hi ≤ , sector i is agriculture or manufacture (merchandises), while if hi ≥ , sector i is
services. Let ))0,,0,,,,((' ''2
'1 LL hexexex= EX and ))0,,0,,,,((' ''
2'1 LL himimim= IM
be export and import vectors of goods. Domestic production induced by exports and imports of goods can be obtained as 'EXQ and 'IMQ below:
15
(11) ')( 1' EXAIQ −−≡EX
and (12) ')( 1
' IMAIQ −−=IM . Using equations (11) and (12) and taking the computed values for service sectors, we obtain trade in services that are embodied in goods trade. A few words of caution are in order. It should be noted that computed services are those required for the production of import-competing goods and not imports. To calculate service content of imports, one needs to use an input-output table of an exporting country. However, such exercise is difficult as it requires input-output tables of all the export source countries, and thus it is not attempted. This does not cause a problem if the production technologies, or input-output relations, are identical between countries, as assumed in the Heckscher-Ohlin model. However, in reality they are different, and thus one has to be careful in interpreting the estimated results presented and discussed below.
Another problem is the use of national input-output table for the computation of service content of exports. This is because production technologies used for the production of exports tend to be different from those for the production of goods sold in the domestic market. This problem is likely to appear in the case of transportation and distribution services. Generally export production does not use much transportation services, retail services, or multi-layered wholesale services, when compared with production for the domestic market.
One should also note that the differences in the treatment of services among the countries make it difficult to conduct an international comparison. In countries where markets are not well developed, services are provided in-house and thus service transactions do not appear in the statistics. By contrast, in countries where markets are more developed, services are traded between firms, and thus service transactions appear in the statistics. These differences in the treatment of services do influence the estimated service contents of goods trade. 4.3 The Data
We computed service trade embodied in goods trade for China, Malaysia, the Philippines, Singapore, and Taiwan in 1990, and for Japan in 1990 and 1995. The choice of the sample depended on the availability of comparable input-output tables,
16
which are required for the computation. Input-output tables of the selected East Asian economies are obtained from Statistical Research Department, Institute of Developing Economies (1995, 1996a, 1996b, 1997a, 1997b). These input-output tables are compiled by the Statistical Research Department of the Institute of Developing Economies as a part of the project for the construction of the international input-output table of 10 countries that include Japan, the U.S. and eight East Asian economies. Japan’s input-output tables are obtained from the Management and Coordination Agency (1994 and 1999).
The definition of services in an input-output table is different from that of the balance of payments (BOP) statistics, which were used in the earlier section. For instance, an input-output table in general excludes travel, which accounts for a large portion of service trade in the BOP statistics. On the other hand, an input-output table includes electricity, gas, and water, which are not included in the BOP statistics. These differences in the definition/treatment of services preclude one from making direct comparisons of the figures derived from these different sources. The description of the input-output tables used in the analysis is given in Appendix 2. 4.4 The Results
The results of the computation of embodied service trade, which are obtained by applying equations 11 and 12 to the selected East Asian economies for 1990, are shown with the statistics on disembodied service trade in Table 8. As was the case for developed countries, which were reviewed earlier, embodied service trade accounts for a large portion of service trade. Indeed, the proportions of embodied service exports/imports in total (disembodied and embodied) service exports/imports for the sample countries range between 0.24 (exports for the Philippines) and 0.95 (imports for China).16 The extremely low figure for the Philippines is attributable to a large share of semiconductors and electrical machinery in its goods exports that require only assembling operation and not much service content. Among the service sectors the proportion of embodied service in total service is found to be generally high for most sectors, reflecting non-tradable nature of services. However, the corresponding proportions are lower for transportation services for most countries and relatively low for telecommunications, and finance and insurance for some countries, reflecting
16 The figures referred here exclude the sectors, which record negative values in disembodied service trade, i.e., other services in Singapore and wholesale and retail trade in China. We need to investigate the meanings of these figures, before we make any interpretations.
17
relatively high tradability of these services. It is of interest to find that for some countries the direction of the balance of
embodied service trade differs from disembodied service trade. Specifically, for Japan the balance of disembodied service trade is in deficit, while that of embodied service trade is found to be in surplus. Indeed, the balance of embodied service trade is so large that it offsets the deficit in disembodied service trade, to result in a net surplus in total (disembodied and embodied service trade) service trade. The situation is opposite for Singapore and the Philippines, for which the balance of disembodied service trade is in surplus, while that of embodied service trade is in deficit. For these countries, the absolute magnitude of the balance of embodied service trade is smaller than that of disembodied service trade, and therefore the overall service trade balance is in surplus. Unlike the countries examined so far, Taiwan and China recorded a surplus in both disembodied and embodied service trade, while Malaysia recorded a deficit in both types of service trade.
We saw above the magnitude of disembodied and embodied service trade for the selected East Asian countries. It would be of interest to examine the impact of the trade and production of goods on embodied service trade. We computed the magnitude of embodied service trade, which result from the production of 1 million dollars worth of goods exports and imports. Such “normalization” would provide us with useful information for the international comparison of the patterns of trade and production.
The results of the computation shown in Table 9 indicate that the magnitude of service embodied in goods trade, or service content of goods trade, is similar for Japan, Singapore, Taiwan, and Malaysia, while the corresponding values for the Philippines and China are significantly smaller. These differences in service content of goods trade reflect the differences in the patterns of trade and the structure of production for these two groups of countries. The countries in the former group tend to trade goods that embody a large amount of services and/or tend to have overall production structure with significant amount of services being used as inputs, compared to the countries in the latter group.
To compare service contents of goods exports and imports, we computed the ratio between them, or service content ratio. Using unity for the service content ratio as a cutoff value we may divide the sample into two groups. One group, whose service content ratio is greater than unity, consists of Singapore and Taiwan, while the other group with the service content ratio being less than unity includes Japan, Malaysia, the Philippines, and China. These observations indicate that the countries in the first
18
group export services through goods trade, while the countries in the second group import services through goods trade. If the Heckscher-Ohlin theorem can be applied to this analysis, one may interpret these results to indicate that the countries in the first group, Singapore and Taiwan, are well endowed with services in comparison with other factors of production vis-à-vis their trading partners. By contrast, the countries in the second group, Japan, Malaysia, the Philippines, and China, are likely to be poorly endowed with services. Recognizing that the share of services in production tends to increase with the level of economic development, our findings are consistent with the Heckscher-Ohlin theorem except for Japan, because Japan being a well developed country is expected to be a net exporter of services, not a net importer.
One should note here that there are several reasons that our results may deviate from the predictions from the Heckscher-Ohlin theorem.17 First, the patterns of demand for services are likely to differ between countries, thus violating the assumption of the Heckscher-Ohlin theorem. Second, the patterns of demand for goods are likely to differ between countries as well, affecting the computed service content embodied in goods trade. Third, related to the second point, trade policy and discriminatory business practices distort demand patterns for goods, thus aggravating the problem just noted. Indeed, the unexpected result for the case of Japan may be due to these problems. The Japanese may have greater preference for the consumption of services compared to its trading partners, leading to the deficit in service trade. One may also argue that Japan with poor natural resource endowments imports a lot of raw materials, which embody substantial amount of transportation services.18 Furthermore, demand for raw materials in Japan may be upwardly biased, because manufactured imports are restricted by import restrictions and by discriminatory business practices against imports.
The computed results of the service content of goods trade at sectoral level show interesting patterns. It is found that the service contents at sectoral level are very similar among East Asian countries. Electricity, gas and water supply, wholesale and retail trade, finance and insurance, and transportation services have relatively higher values compared to other services, reflecting their importance in the goods production.
17 One should note that similar points have been made for the validity of the Heckscher-Ohlin theorem in explaining the pattern of goods trade. See, for example, Markusen et.al. (1995). 18 This point can be confirmed by the following statistics. The ratio of transportation services to output for the primary products, which include raw materials, in 1995 is 0.056, significantly higher compared with the corresponding ratio for the manufactured goods at 0.020.

19
A comparison of the service contents of goods exports and imports give interesting information concerning the patterns of service trade for the East Asian economies. Let us point out some notable observations. Japan is a huge net importer of electricity, gas, and water supply, public administration, transportation services, and education and research, while a net exporter of wholesale and retail services. In the recognition of the fact that Japan is a highly educated society, the finding on education and research contents does not seem to reflect the reality, and thus needs further examination. We will come back to this issue later, when we discuss the results obtained by using a more disaggregatged input-output table. The finding on wholesale and retail services may counter our expectation, because the Japanese distribution sector is generally regarded inefficient. Indeed, inefficiency may be a reason for our unexpected result. Specifically, the values used for our analysis are not adjusted for their quality or price, and, therefore, service inputs for Japan are overvalued in comparison with the value based on international prices, making Japan a large exporter of distribution services.19
Singapore is shown to be a large net exporter of finance and insurance, and education and research. These findings appear to be consistent with the characteristics of Singapore. Taiwan is found to be a notable net exporter of public administration services, telecommunications, and wholesale and retail services. Malaysia and the Philippines are large net exporters of transportation services and education and research, respectively, while China is a net importer for all the categories except wholesale and retail trade, for which China is a small net exporter.
Availability of detailed and more recent input-output tables for Japan enables us to investigate the patterns of service trade, both disembodied and embodied in goods, in more detail. Such analysis would shed light on the important patterns, which would be masked by the analysis at aggregated level. The results of the computation are shown in Tables 10 and 11. Some of the interesting observations include the followings.
The basic patterns of disembodied and embodied service trade remained more or less the same for 1990 and 1995. Japan registered a deficit in disembodied service trade but a huge surplus in embodied service trade, indicating that Japan exported services through goods trade for both years under study. As to disembodied trade,
19 The overblown or inefficient distribution sector in Japan may be shown by the relatively large share of wholesale services in total cost of production in Japan at 0.030, significantly higher compared with the case for Taiwan at 0.012, both figures are taken from respective input-output tables.
20
personal services registered a sizeable deficit, and the magnitude of the deficit increased from 1990 to 1995. Turning to the results on embodied service trade, one finds that an analysis at disaggregated level yields a larger figure concerning embodied service total compared to the results obtained from the analysis at aggregated level, indicating that an analysis using disaggregated data captures the complexity of input-output relations better. It is of interest to observe that in-house research and development in the private firms contributes significantly to the export of education and research services, which reflects that goods embodying private research activities tend to be exported at large scale. This in turn appears to indicate that Japan has a comparative advantage in the sectors that conduct in-house R&D actively. An examination of the results on business services reveals that the categories that are separately analyzed (advertising, and inquiry and information services) account for only a small portion of business services. A closer examination of this sector is needed. The results of “normalization” exercise, which are presented in Table 11, show that Japan is a huge net exporter of private R&D, while it is a net importer of many other services, particularly in transportation, finance and insurance services. 5. Conclusions We found in this paper that service trade in East Asia has been increasing in the recent decades. However, the share of East Asia in world service trade is smaller than the corresponding share for the goods trade. We also found that unlike goods trade many East Asian economies register a deficit in service trade. Our analysis of trade in services that are embodied in goods trade reveals that a large magnitude of services is “traded” via goods trade. Indeed, for many countries the overall balance in service trade (disembodied and embodied) turns out to be surplus, because the trade surplus in embodied service trade is greater than the trade deficit in disembodied service trade.
An examination of sectoral distribution of service exports and imports for the East Asian economies shows that many economies are heavily engaged in service trade (exports and imports) in transportation, travel, and other services with some variations among the economies. Our analysis of the determinants of service trade indicates that the Heckscher-Ohlin model can explain the patterns of trade in a few types of service trade such as computer and information but generally its validity cannot be confirmed. One important factor that may reduce the validity of the trade models such as the Heckscher-Ohlin model to explain the pattern of service trade is the presence of various barriers such as government regulations.
21
Further research on trade in services is acutely needed for several reasons. First, the importance of service trade appears to increase in the future because of the following reasons. Deregulation in the service sector and liberalization in service trade are likely to proceed, not only because of the multilateral and regional arrangements in services, but also because of the realization on the part of policy makers and business circles that such policy changes are required to increase the competitiveness of the service sector for improving competitiveness of the overall economy. Indeed, the World Bank (2000) reports the results of a study that show that liberalization of trade in goods and services would lead to a median GDP increase of 3.9 percent among major East Asian countries. Technical progress in telecommunications, which is likely to take place, would promote service trade by lowering the cost of conducting trade in services and by developing new means of cross-border service transactions. Expected increase in FDI would also promote trade in services, especially through the mode of commercial presence.
This paper analyzed the patterns and determinants of two types of service trade, cross-border supply and consumption abroad, and did not examine other types of service trade, namely service trade conducted through commercial presence, and the presence of natural persons. As noted earlier, service trade conducted through these forms is likely to increase rapidly in the future. Therefore, among various areas for possible future research in service trade, we think that service trade conducted through commercial presence and presence of natural persons are of particular importance. To conduct such analysis and other types of analyses on service trade, it has to be emphasized that the quality and quantity of data on service trade have to be improved and expanded.
22
References Aw, Bee Y. (1983) “The Interpretation of Cross-Section Regression Tests of the Heckscher-Ohlin Theorem with Many Goods and Factors,” Journal of International Economics, 14(1-2): 163-167. Baldwin, Robert E. (1971) “Determinants of the Commodity Structure of US Trade,” American Economic Review, 61: 126-46. Bowen, Harry P. (1983) “Changes in the International Distribution of Resources and Their Impact on U.S. Comparative Advantage,” Review of Economics and Statistics, 65(3): 402-414. ----------, Abraham Hollander and Jean-Marie Viaene (1998) Applied International Trade Analysis, Hampshire: Macmillan. ---------- and Leo Sveikauskas (1992) “Judging Factor Abundance,” Quarterly Journal of Economics, 107(2): 599-620. Council for Economic Planning and Development, Republic of China (1999) Taiwan Statistical Databook: Council for Economic Planning and Development, Republic of China. Deardorff, Alan V. (1984) “Testing Trade Theories and Predicting Trade Flows,” in Kenen, R.W. and Jones, P.B. eds. Handbook of International Economics, 1: 467-518, Amsterdam: North-Holland. Economic Research Department, the Central Bank of China (1999) Balance of Payments Quarterly, Taiwan District, the Republic of China: Economic Research Department, the Central Bank of China. Institute of Developing Economies (1996) International Input-Output Table Philippines-Japan 1990, Tokyo: Institute of Developing Economies. ---------- (1997a) International Input-Output Table China-Japan 1990, Tokyo: Institute of Developing Economies.
23
---------- (1997b) International Input-Output Table Malaysia-Japan 1990, Tokyo: Institute of Developing Economies. ---------- (1997c) International Input-Output Table Singapore-Japan 1990, Tokyo: Institute of Developing Economies. ---------- (1997d) International Input-Output Table Taiwan-Japan 1990, Tokyo: Institute of Developing Economies. ---------- (1998) Asian International Input-Output Table 1990, Tokyo: Institute of Developing Economies. International Monetary Fund (IMF) (1999a) Balance of Payments Statistics on CD-ROM, Washington D.C.: IMF. ---------- (1999b) International Financial Statistics on CD-ROM, Washington D.C.: IMF. Leamer, Edward E. and Harry P. Bowen (1981) “Cross-Section Tests of the Heckscher-Ohlin Theorem: Comment,” American Economic Review, 71(4): 1040-1043. ---------- and James Levinsohn (1995) “International Trade Theory and the Evidence,” in Grossman, Gene M. and Kenneth Rogoff eds. Handbook of International Economics, 3: 1341-1394, Amsterdam: Elsevier. Management and Coordination Agency (1994) 1990 Input-Output Table for Japan, Tokyo: Management and Coordination Agency. ---------- (1999) 1995 Input-Output Table for Japan, Tokyo: Management and Coordination Agency. Markusen, James R., James R. Melvin, William H. Kaimpfer, and Keith E. Maskus (1995) International Trade: Theory and Evidence, New York: McGraw-Hill, Inc. Petri, Peter A. (1991) “Market Structure, Comparative Advantage, and Japanese Trade
24
under the Strong Yen,” in Krugman, Paul eds. Trade with Japan: Has the Door Opened Wider? Chicago: University of Chicago Press. Sapir, Andre and Ernst Lutz (1981) “Trade in Services: Economic Determinants and Development Related Issues,” World Bank Staff Working Paper #480. Sazanami, Yoko and Shujiro Urata (1990) Service Trade: Theory, Present and Future Topics (Sabis Boueki: Riron, Genjo, Kadai), Tokyo: Toyokeizai Shinpo-sha (Japanese) . Stern, Robert M. and Keith F. Maskus (1981) “Determinants of the Structure of U.S. Foreign Trade,” Journal of International Economics, 11(2): 207-224. Tucker, Ken and Mark Sundberg (1998) International Trade in Services, London: Routledge. Urata, Shujiro (1983) “Factor Inputs and Japanese Manufacturing Trade Structure,” Review of Economics and Statistics, 65 (4): 678-684. ---------- (1995) “Service Trade Embodied in Merchandise Trade: Case of Japan,” World Economic Critiques (Sekai Keizai Hyouron), 38(5): 50-56. (Japanese) World Bank (1999) World Development Indicators on CD-ROM, Washington D.C.: World Bank. ---------- (2000) East Asia: Recovery and Beyond, Washington D.C.: World Bank.
25
Appendix 1 Derivation of Regression Equation Appendix 1 derives the regression equation. From equations (4) and (5), we
have:
(A1)
( ) ( )( ) ( ) ( )( ) ( )[ ] nW
tW
ti
ti
Wnt
Wtin
ti
WWnntini
Y
Y
Yt
EwEaA
EwEaEA
EEA
/
/
/
11
11
1
−−
−−
−
−=
−=
−=
α
Let wiy be the world output of commodity j . Substituting the world full
employment condition, ( ) WiWti y=− EA 1 , into equation (A1), we obtain:
(A2) ( )[ ] nWt
witini Yyt EwA /1 −= −
(6) ntjER=
where tjR is a vector of factor requirement for country n ’s net export of commodity
i with elements ( )Wjwiijij Ywyar /1 −= − .
Appendix 2 Data Description: Input-Output Tables for East Asian Countries
Appendix 2 describes the input-output tables used in this paper. The Input-Output Tables for East Asian Economies
The data used in this paper are taken from the Statistical Research Department, Institute of Developing Economies (1995, 1996a, 1996b, 1997a, 1997b). The input-output tables of East Asian countries are compiled by the Statistical Research Department, Institute of Developing Economies as a part of its project on the construction of the international input-output table including Japan, the U.S. and East Asian countries. The number of sectors for the input-output tables used in our analysis is as follows: 106 for China (25 service sectors), 187 for Japan (54 service sectors), 96 for Malaysia (37 services), 177 for Philippines (38 services), 174 for Singapore (45 services) and 150 for Taiwan (45 services). Since the sector classification is different among these tables, we aggregated the service sectors into nine categories by using the conversion method developed by the Institute of Developing Economies (1998). Appendix Table 1 presents these nine categories. This classification is also used in the construction of the international input-output table. Since the sample countries'
26
input-output tables are reported in the local currency, we converted these tables in local currency into those in the US dollar. The exchange rate used for the conversion is annual average exchange rate (rf) from IMF (1999a) and from Council of Economic Planning and Agency (1999) for Taiwan. The Japanese Input-Output Tables
For the detailed analysis of Japan's service trade embodied in goods trade, we used 187-sector input-output table for 1990 and 186-sector table for 1995. The sector classification used in the international input-output table is different from that of Japanese input-output table. Some sectors in the Japanese input-output table are excluded in the international input-output table. For instance, research and development at private company and repairing service are separately recorded in Japanese input-output table, but they are not included in the international input-output table.
When we examined the changes in embodied services in detail, we used the Japanese classification. This is because Japanese input-output tables provide detailed sector classification, which enabled us to perform more detailed analyses than the international input-output table. Therefore, the estimated results of embodied services for Japan differ between those based on the international input-output table and those based on the detailed Japanese input-output tables.
The calculated results are aggregated to 32-sector level (14 services), whose sector classification is shown in Appendix Table 1. The sector classification for the 1995 input-output table differed from that for the 1990 input-output table. However, the differences disappeared when we aggregated these two tables into 32 sectors.
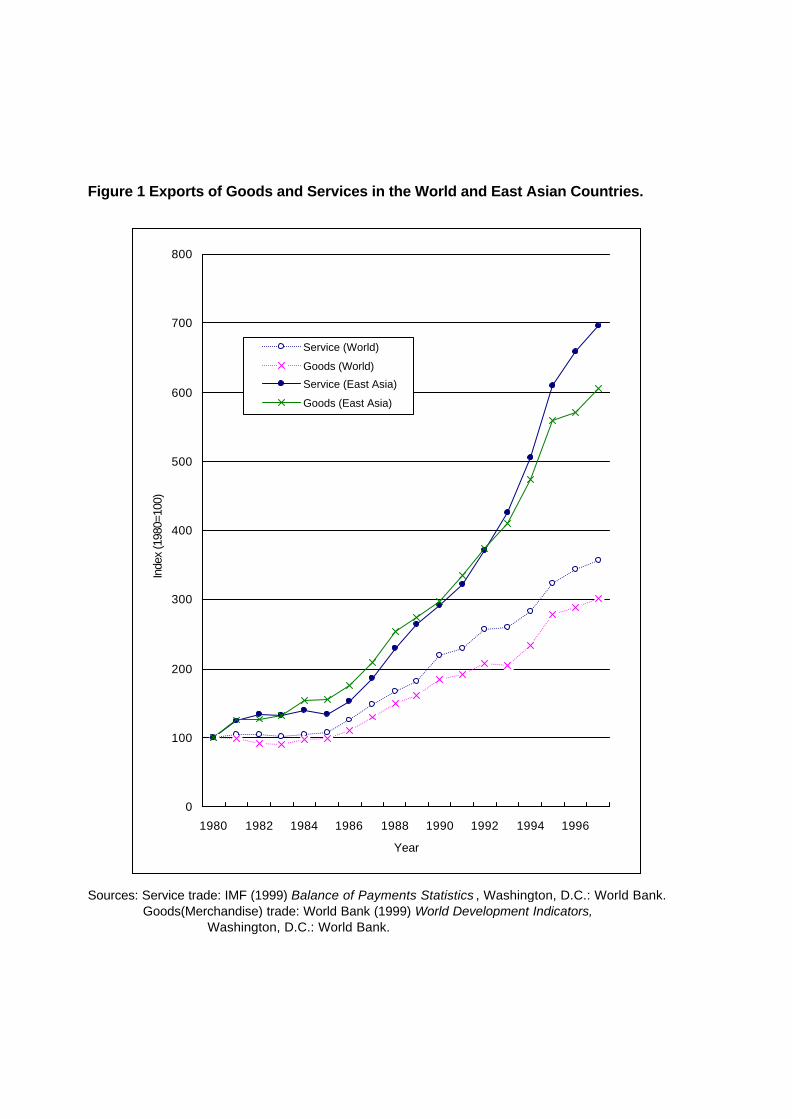
Figure 1 Exports of Goods and Services in the World and East Asian Countries.
Sources: Service trade: IMF (1999) Balance of Payments Statistics , Washington, D.C.: World Bank. Goods(Merchandise) trade: World Bank (1999) World Development Indicators, Washington, D.C.: World Bank.
0
100
200
300
400
500
600
700
800
1980 1982 1984 1986 1988 1990 1992 1994 1996
Year
Inde
x (1
980=
100)
Service (World)
Goods (World)Service (East Asia)
Goods (East Asia)
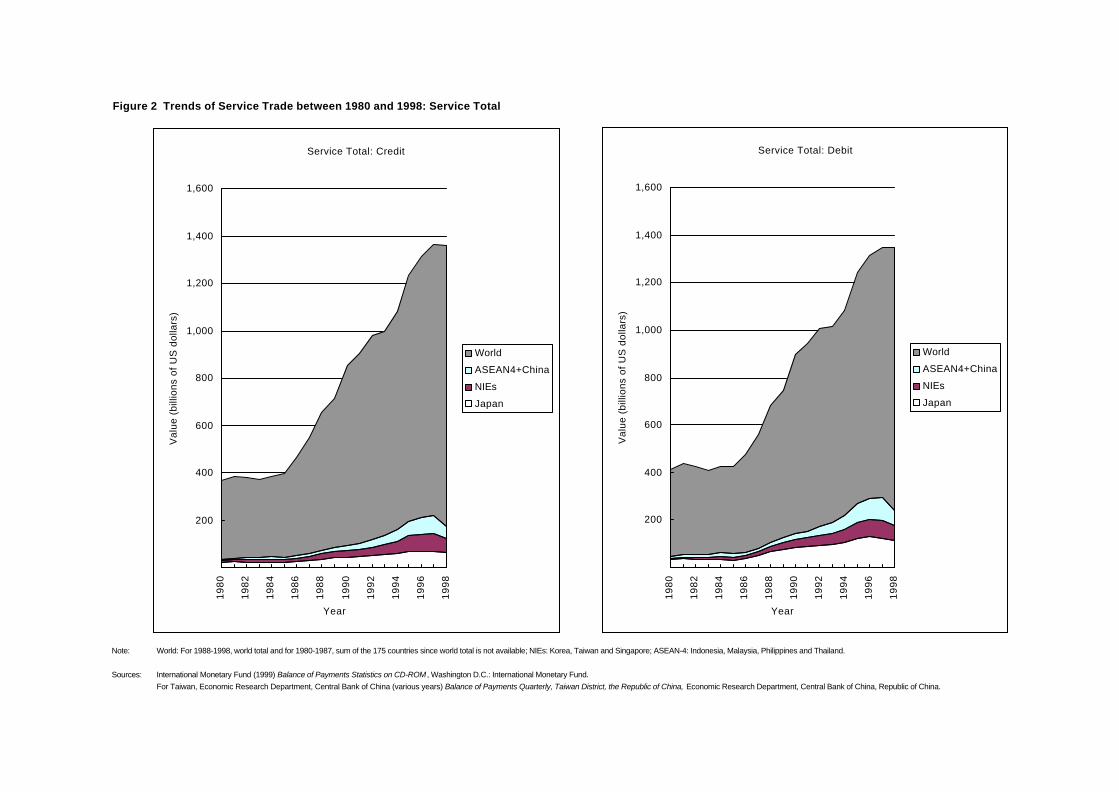
Figure 2 Trends of Service Trade between 1980 and 1998: Service Total
Note: World: For 1988-1998, world total and for 1980-1987, sum of the 175 countries since world total is not available; NIEs: Korea, Taiwan and Singapore; ASEAN-4: Indonesia, Malaysia, Philippines and Thailand.
Sources: International Monetary Fund (1999) Balance of Payments Statistics on CD-ROM , Washington D.C.: International Monetary Fund.For Taiwan, Economic Research Department, Central Bank of China (various years) Balance of Payments Quarterly, Taiwan District, the Republic of China, Economic Research Department, Central Bank of China, Republic of China.
Service Total: Credit
200
400
600
800
1,000
1,200
1,400
1,600
1980
1982
1984
1986
1988
1990
1992
1994
1996
1998
Year
Val
ue (b
illio
ns o
f US
dol
lars
)
WorldASEAN4+ChinaNIEsJapan
Service Total: Debit
200
400
600
800
1,000
1,200
1,400
1,600
1980
1982
1984
1986
1988
1990
1992
1994
1996
1998
YearV
alue
(bill
ions
of U
S d
olla
rs)
WorldASEAN4+ChinaNIEsJapan
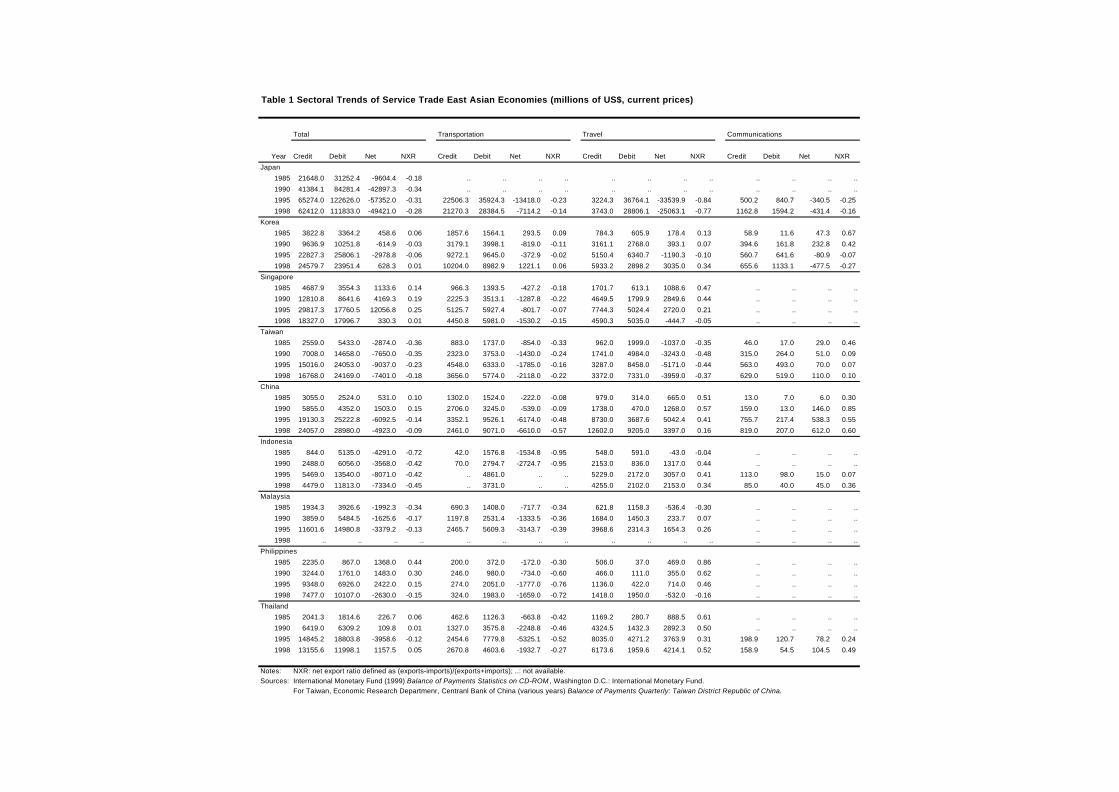
Table 1 Sectoral Trends of Service Trade East Asian Economies (millions of US$, current prices)
Total Transportation Travel Communications
Year Credit Debit Net NXR Credit Debit Net NXR Credit Debit Net NXR Credit Debit Net NXRJapan
1985 21648.0 31252.4 -9604.4 -0.18 .. .. .. .. .. .. .. .. .. .. .. ..1990 41384.1 84281.4 -42897.3 -0.34 .. .. .. .. .. .. .. .. .. .. .. ..1995 65274.0 122626.0 -57352.0 -0.31 22506.3 35924.3 -13418.0 -0.23 3224.3 36764.1 -33539.9 -0.84 500.2 840.7 -340.5 -0.251998 62412.0 111833.0 -49421.0 -0.28 21270.3 28384.5 -7114.2 -0.14 3743.0 28806.1 -25063.1 -0.77 1162.8 1594.2 -431.4 -0.16
Korea1985 3822.8 3364.2 458.6 0.06 1857.6 1564.1 293.5 0.09 784.3 605.9 178.4 0.13 58.9 11.6 47.3 0.671990 9636.9 10251.8 -614.9 -0.03 3179.1 3998.1 -819.0 -0.11 3161.1 2768.0 393.1 0.07 394.6 161.8 232.8 0.421995 22827.3 25806.1 -2978.8 -0.06 9272.1 9645.0 -372.9 -0.02 5150.4 6340.7 -1190.3 -0.10 560.7 641.6 -80.9 -0.071998 24579.7 23951.4 628.3 0.01 10204.0 8982.9 1221.1 0.06 5933.2 2898.2 3035.0 0.34 655.6 1133.1 -477.5 -0.27
Singapore1985 4687.9 3554.3 1133.6 0.14 966.3 1393.5 -427.2 -0.18 1701.7 613.1 1088.6 0.47 .. .. .. ..1990 12810.8 8641.6 4169.3 0.19 2225.3 3513.1 -1287.8 -0.22 4649.5 1799.9 2849.6 0.44 .. .. .. ..1995 29817.3 17760.5 12056.8 0.25 5125.7 5927.4 -801.7 -0.07 7744.3 5024.4 2720.0 0.21 .. .. .. ..1998 18327.0 17996.7 330.3 0.01 4450.8 5981.0 -1530.2 -0.15 4590.3 5035.0 -444.7 -0.05 .. .. .. ..
Taiwan1985 2559.0 5433.0 -2874.0 -0.36 883.0 1737.0 -854.0 -0.33 962.0 1999.0 -1037.0 -0.35 46.0 17.0 29.0 0.461990 7008.0 14658.0 -7650.0 -0.35 2323.0 3753.0 -1430.0 -0.24 1741.0 4984.0 -3243.0 -0.48 315.0 264.0 51.0 0.091995 15016.0 24053.0 -9037.0 -0.23 4548.0 6333.0 -1785.0 -0.16 3287.0 8458.0 -5171.0 -0.44 563.0 493.0 70.0 0.071998 16768.0 24169.0 -7401.0 -0.18 3656.0 5774.0 -2118.0 -0.22 3372.0 7331.0 -3959.0 -0.37 629.0 519.0 110.0 0.10
China1985 3055.0 2524.0 531.0 0.10 1302.0 1524.0 -222.0 -0.08 979.0 314.0 665.0 0.51 13.0 7.0 6.0 0.301990 5855.0 4352.0 1503.0 0.15 2706.0 3245.0 -539.0 -0.09 1738.0 470.0 1268.0 0.57 159.0 13.0 146.0 0.851995 19130.3 25222.8 -6092.5 -0.14 3352.1 9526.1 -6174.0 -0.48 8730.0 3687.6 5042.4 0.41 755.7 217.4 538.3 0.551998 24057.0 28980.0 -4923.0 -0.09 2461.0 9071.0 -6610.0 -0.57 12602.0 9205.0 3397.0 0.16 819.0 207.0 612.0 0.60
Indonesia1985 844.0 5135.0 -4291.0 -0.72 42.0 1576.8 -1534.8 -0.95 548.0 591.0 -43.0 -0.04 .. .. .. ..1990 2488.0 6056.0 -3568.0 -0.42 70.0 2794.7 -2724.7 -0.95 2153.0 836.0 1317.0 0.44 .. .. .. ..1995 5469.0 13540.0 -8071.0 -0.42 .. 4861.0 .. .. 5229.0 2172.0 3057.0 0.41 113.0 98.0 15.0 0.071998 4479.0 11813.0 -7334.0 -0.45 .. 3731.0 .. .. 4255.0 2102.0 2153.0 0.34 85.0 40.0 45.0 0.36
Malaysia1985 1934.3 3926.6 -1992.3 -0.34 690.3 1408.0 -717.7 -0.34 621.8 1158.3 -536.4 -0.30 .. .. .. ..1990 3859.0 5484.5 -1625.6 -0.17 1197.8 2531.4 -1333.5 -0.36 1684.0 1450.3 233.7 0.07 .. .. .. ..1995 11601.6 14980.8 -3379.2 -0.13 2465.7 5609.3 -3143.7 -0.39 3968.6 2314.3 1654.3 0.26 .. .. .. ..1998 .. .. .. .. .. .. .. .. .. .. .. .. .. .. .. ..
Philippines1985 2235.0 867.0 1368.0 0.44 200.0 372.0 -172.0 -0.30 506.0 37.0 469.0 0.86 .. .. .. ..1990 3244.0 1761.0 1483.0 0.30 246.0 980.0 -734.0 -0.60 466.0 111.0 355.0 0.62 .. .. .. ..1995 9348.0 6926.0 2422.0 0.15 274.0 2051.0 -1777.0 -0.76 1136.0 422.0 714.0 0.46 .. .. .. ..1998 7477.0 10107.0 -2630.0 -0.15 324.0 1983.0 -1659.0 -0.72 1418.0 1950.0 -532.0 -0.16 .. .. .. ..
Thailand1985 2041.3 1814.6 226.7 0.06 462.6 1126.3 -663.8 -0.42 1169.2 280.7 888.5 0.61 .. .. .. ..1990 6419.0 6309.2 109.8 0.01 1327.0 3575.8 -2248.8 -0.46 4324.5 1432.3 2892.3 0.50 .. .. .. ..1995 14845.2 18803.8 -3958.6 -0.12 2454.6 7779.8 -5325.1 -0.52 8035.0 4271.2 3763.9 0.31 198.9 120.7 78.2 0.241998 13155.6 11998.1 1157.5 0.05 2670.8 4603.6 -1932.7 -0.27 6173.6 1959.6 4214.1 0.52 158.9 54.5 104.5 0.49
Notes: NXR: net export ratio defined as (exports-imports)/(exports+imports); ..: not available.Sources: International Monetary Fund (1999) Balance of Payments Statistics on CD-ROM , Washington D.C.: International Monetary Fund.
For Taiwan, Economic Research Departmenr, Centranl Bank of China (various years) Balance of Payments Quarterly: Taiwan District Republic of China.
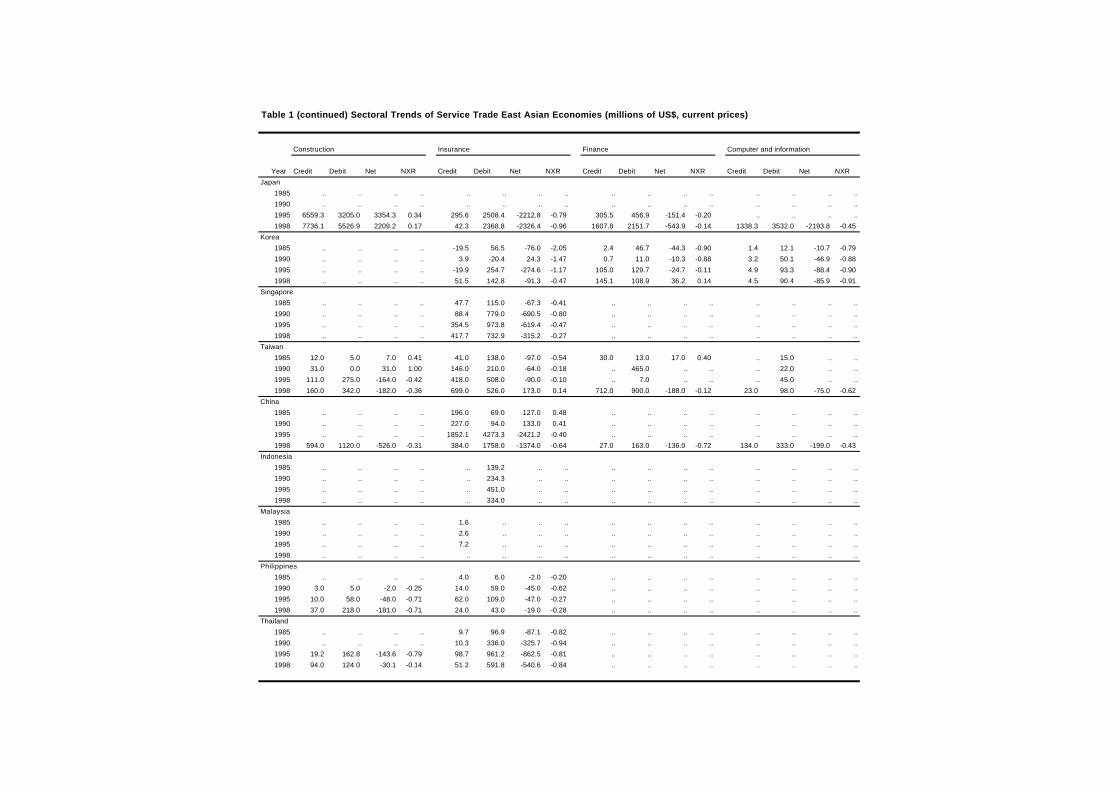
Table 1 (continued) Sectoral Trends of Service Trade East Asian Economies (millions of US$, current prices)
Construction Insurance Finance Computer and information
Year Credit Debit Net NXR Credit Debit Net NXR Credit Debit Net NXR Credit Debit Net NXRJapan
1985 .. .. .. .. .. .. .. .. .. .. .. .. .. .. .. ..1990 .. .. .. .. .. .. .. .. .. .. .. .. .. .. .. ..1995 6559.3 3205.0 3354.3 0.34 295.6 2508.4 -2212.8 -0.79 305.5 456.9 -151.4 -0.20 .. .. .. ..1998 7736.1 5526.9 2209.2 0.17 42.3 2368.8 -2326.4 -0.96 1607.8 2151.7 -543.9 -0.14 1338.3 3532.0 -2193.8 -0.45
Korea1985 .. .. .. .. -19.5 56.5 -76.0 -2.05 2.4 46.7 -44.3 -0.90 1.4 12.1 -10.7 -0.791990 .. .. .. .. 3.9 -20.4 24.3 -1.47 0.7 11.0 -10.3 -0.88 3.2 50.1 -46.9 -0.881995 .. .. .. .. -19.9 254.7 -274.6 -1.17 105.0 129.7 -24.7 -0.11 4.9 93.3 -88.4 -0.901998 .. .. .. .. 51.5 142.8 -91.3 -0.47 145.1 108.9 36.2 0.14 4.5 90.4 -85.9 -0.91
Singapore1985 .. .. .. .. 47.7 115.0 -67.3 -0.41 .. .. .. .. .. .. .. ..1990 .. .. .. .. 88.4 779.0 -690.5 -0.80 .. .. .. .. .. .. .. ..1995 .. .. .. .. 354.5 973.8 -619.4 -0.47 .. .. .. .. .. .. .. ..1998 .. .. .. .. 417.7 732.9 -315.2 -0.27 .. .. .. .. .. .. .. ..
Taiwan1985 12.0 5.0 7.0 0.41 41.0 138.0 -97.0 -0.54 30.0 13.0 17.0 0.40 .. 15.0 .. ..1990 31.0 0.0 31.0 1.00 146.0 210.0 -64.0 -0.18 .. 465.0 .. .. .. 22.0 .. ..1995 111.0 275.0 -164.0 -0.42 418.0 508.0 -90.0 -0.10 .. 7.0 .. .. .. 45.0 .. ..1998 160.0 342.0 -182.0 -0.36 699.0 526.0 173.0 0.14 712.0 900.0 -188.0 -0.12 23.0 98.0 -75.0 -0.62
China1985 .. .. .. .. 196.0 69.0 127.0 0.48 .. .. .. .. .. .. .. ..1990 .. .. .. .. 227.0 94.0 133.0 0.41 .. .. .. .. .. .. .. ..1995 .. .. .. .. 1852.1 4273.3 -2421.2 -0.40 .. .. .. .. .. .. .. ..1998 594.0 1120.0 -526.0 -0.31 384.0 1758.0 -1374.0 -0.64 27.0 163.0 -136.0 -0.72 134.0 333.0 -199.0 -0.43
Indonesia1985 .. .. .. .. .. 139.2 .. .. .. .. .. .. .. .. .. ..1990 .. .. .. .. .. 234.3 .. .. .. .. .. .. .. .. .. ..1995 .. .. .. .. .. 451.0 .. .. .. .. .. .. .. .. .. ..1998 .. .. .. .. .. 334.0 .. .. .. .. .. .. .. .. .. ..
Malaysia1985 .. .. .. .. 1.6 .. .. .. .. .. .. .. .. .. .. ..1990 .. .. .. .. 2.6 .. .. .. .. .. .. .. .. .. .. ..1995 .. .. .. .. 7.2 .. .. .. .. .. .. .. .. .. .. ..1998 .. .. .. .. .. .. .. .. .. .. .. .. .. .. .. ..
Philippines1985 .. .. .. .. 4.0 6.0 -2.0 -0.20 .. .. .. .. .. .. .. ..1990 3.0 5.0 -2.0 -0.25 14.0 59.0 -45.0 -0.62 .. .. .. .. .. .. .. ..1995 10.0 58.0 -48.0 -0.71 62.0 109.0 -47.0 -0.27 .. .. .. .. .. .. .. ..1998 37.0 218.0 -181.0 -0.71 24.0 43.0 -19.0 -0.28 .. .. .. .. .. .. .. ..
Thailand1985 .. .. .. .. 9.7 96.9 -87.1 -0.82 .. .. .. .. .. .. .. ..1990 .. .. .. .. 10.3 336.0 -325.7 -0.94 .. .. .. .. .. .. .. ..1995 19.2 162.8 -143.6 -0.79 98.7 961.2 -862.5 -0.81 .. .. .. .. .. .. .. ..1998 94.0 124.0 -30.1 -0.14 51.2 591.8 -540.6 -0.84 .. .. .. .. .. .. .. ..
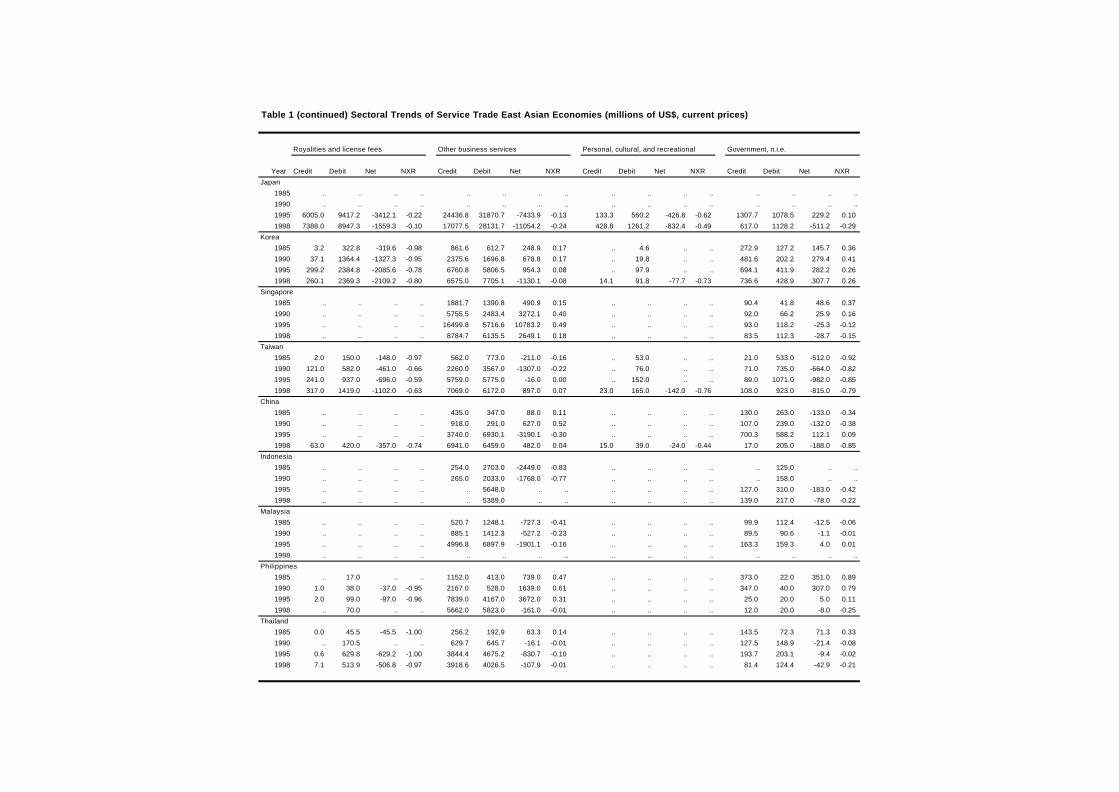
Table 1 (continued) Sectoral Trends of Service Trade East Asian Economies (millions of US$, current prices)
Royalities and license fees Other business services Personal, cultural, and recreational Government, n.i.e.
Year Credit Debit Net NXR Credit Debit Net NXR Credit Debit Net NXR Credit Debit Net NXRJapan
1985 .. .. .. .. .. .. .. .. .. .. .. .. .. .. .. ..1990 .. .. .. .. .. .. .. .. .. .. .. .. .. .. .. ..1995 6005.0 9417.2 -3412.1 -0.22 24436.8 31870.7 -7433.9 -0.13 133.3 560.2 -426.8 -0.62 1307.7 1078.5 229.2 0.101998 7388.0 8947.3 -1559.3 -0.10 17077.5 28131.7 -11054.2 -0.24 428.8 1261.2 -832.4 -0.49 617.0 1128.2 -511.2 -0.29
Korea1985 3.2 322.8 -319.6 -0.98 861.6 612.7 248.9 0.17 .. 4.6 .. .. 272.9 127.2 145.7 0.361990 37.1 1364.4 -1327.3 -0.95 2375.6 1696.8 678.8 0.17 .. 19.8 .. .. 481.6 202.2 279.4 0.411995 299.2 2384.8 -2085.6 -0.78 6760.8 5806.5 954.3 0.08 .. 97.9 .. .. 694.1 411.9 282.2 0.261998 260.1 2369.3 -2109.2 -0.80 6575.0 7705.1 -1130.1 -0.08 14.1 91.8 -77.7 -0.73 736.6 428.9 307.7 0.26
Singapore1985 .. .. .. .. 1881.7 1390.8 490.9 0.15 .. .. .. .. 90.4 41.8 48.6 0.371990 .. .. .. .. 5755.5 2483.4 3272.1 0.40 .. .. .. .. 92.0 66.2 25.9 0.161995 .. .. .. .. 16499.8 5716.6 10783.2 0.49 .. .. .. .. 93.0 118.2 -25.3 -0.121998 .. .. .. .. 8784.7 6135.5 2649.1 0.18 .. .. .. .. 83.5 112.3 -28.7 -0.15
Taiwan1985 2.0 150.0 -148.0 -0.97 562.0 773.0 -211.0 -0.16 .. 53.0 .. .. 21.0 533.0 -512.0 -0.921990 121.0 582.0 -461.0 -0.66 2260.0 3567.0 -1307.0 -0.22 .. 76.0 .. .. 71.0 735.0 -664.0 -0.821995 241.0 937.0 -696.0 -0.59 5759.0 5775.0 -16.0 0.00 .. 152.0 .. .. 89.0 1071.0 -982.0 -0.851998 317.0 1419.0 -1102.0 -0.63 7069.0 6172.0 897.0 0.07 23.0 165.0 -142.0 -0.76 108.0 923.0 -815.0 -0.79
China1985 .. .. .. .. 435.0 347.0 88.0 0.11 .. .. .. .. 130.0 263.0 -133.0 -0.341990 .. .. .. .. 918.0 291.0 627.0 0.52 .. .. .. .. 107.0 239.0 -132.0 -0.381995 .. .. .. .. 3740.0 6930.1 -3190.1 -0.30 .. .. .. .. 700.3 588.2 112.1 0.091998 63.0 420.0 -357.0 -0.74 6941.0 6459.0 482.0 0.04 15.0 39.0 -24.0 -0.44 17.0 205.0 -188.0 -0.85
Indonesia1985 .. .. .. .. 254.0 2703.0 -2449.0 -0.83 .. .. .. .. .. 125.0 .. ..1990 .. .. .. .. 265.0 2033.0 -1768.0 -0.77 .. .. .. .. .. 158.0 .. ..1995 .. .. .. .. .. 5648.0 .. .. .. .. .. .. 127.0 310.0 -183.0 -0.421998 .. .. .. .. .. 5389.0 .. .. .. .. .. .. 139.0 217.0 -78.0 -0.22
Malaysia1985 .. .. .. .. 520.7 1248.1 -727.3 -0.41 .. .. .. .. 99.9 112.4 -12.5 -0.061990 .. .. .. .. 885.1 1412.3 -527.2 -0.23 .. .. .. .. 89.5 90.6 -1.1 -0.011995 .. .. .. .. 4996.8 6897.9 -1901.1 -0.16 .. .. .. .. 163.3 159.3 4.0 0.011998 .. .. .. .. .. .. .. .. .. .. .. .. .. .. .. ..
Philippines1985 .. 17.0 .. .. 1152.0 413.0 739.0 0.47 .. .. .. .. 373.0 22.0 351.0 0.891990 1.0 38.0 -37.0 -0.95 2167.0 528.0 1639.0 0.61 .. .. .. .. 347.0 40.0 307.0 0.791995 2.0 99.0 -97.0 -0.96 7839.0 4167.0 3672.0 0.31 .. .. .. .. 25.0 20.0 5.0 0.111998 .. 70.0 .. .. 5662.0 5823.0 -161.0 -0.01 .. .. .. .. 12.0 20.0 -8.0 -0.25
Thailand1985 0.0 45.5 -45.5 -1.00 256.2 192.9 63.3 0.14 .. .. .. .. 143.5 72.3 71.3 0.331990 .. 170.5 .. .. 629.7 645.7 -16.1 -0.01 .. .. .. .. 127.5 148.9 -21.4 -0.081995 0.6 629.8 -629.2 -1.00 3844.4 4675.2 -830.7 -0.10 .. .. .. .. 193.7 203.1 -9.4 -0.021998 7.1 513.9 -506.8 -0.97 3918.6 4026.5 -107.9 -0.01 .. .. .. .. 81.4 124.4 -42.9 -0.21
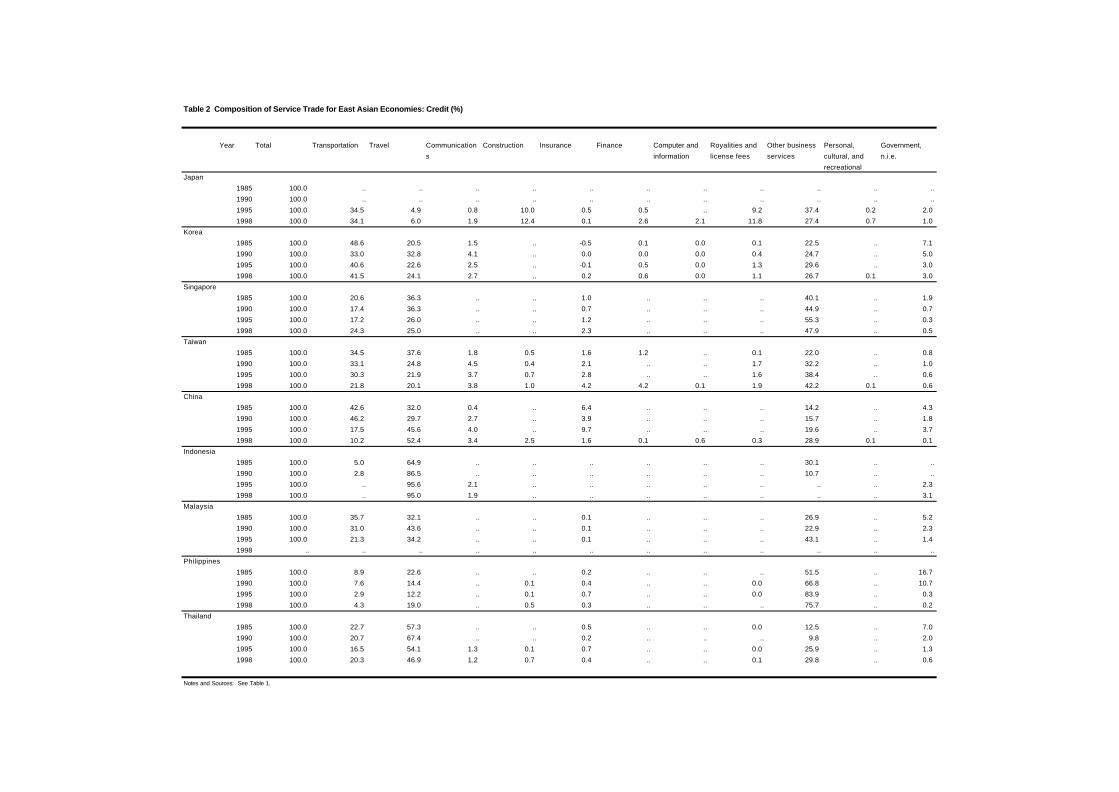
Table 2 Composition of Service Trade for East Asian Economies: Credit (%)
Year Total Transportation Travel Communications
Construction Insurance Finance Computer andinformation
Royalities andlicense fees
Other businessservices
Personal,cultural, andrecreational
Government,n.i.e.
Japan1985 100.0 .. .. .. .. .. .. .. .. .. .. ..1990 100.0 .. .. .. .. .. .. .. .. .. .. ..1995 100.0 34.5 4.9 0.8 10.0 0.5 0.5 .. 9.2 37.4 0.2 2.01998 100.0 34.1 6.0 1.9 12.4 0.1 2.6 2.1 11.8 27.4 0.7 1.0
Korea1985 100.0 48.6 20.5 1.5 .. -0.5 0.1 0.0 0.1 22.5 .. 7.11990 100.0 33.0 32.8 4.1 .. 0.0 0.0 0.0 0.4 24.7 .. 5.01995 100.0 40.6 22.6 2.5 .. -0.1 0.5 0.0 1.3 29.6 .. 3.01998 100.0 41.5 24.1 2.7 .. 0.2 0.6 0.0 1.1 26.7 0.1 3.0
Singapore1985 100.0 20.6 36.3 .. .. 1.0 .. .. .. 40.1 .. 1.91990 100.0 17.4 36.3 .. .. 0.7 .. .. .. 44.9 .. 0.71995 100.0 17.2 26.0 .. .. 1.2 .. .. .. 55.3 .. 0.31998 100.0 24.3 25.0 .. .. 2.3 .. .. .. 47.9 .. 0.5
Taiwan1985 100.0 34.5 37.6 1.8 0.5 1.6 1.2 .. 0.1 22.0 .. 0.81990 100.0 33.1 24.8 4.5 0.4 2.1 .. .. 1.7 32.2 .. 1.01995 100.0 30.3 21.9 3.7 0.7 2.8 .. .. 1.6 38.4 .. 0.61998 100.0 21.8 20.1 3.8 1.0 4.2 4.2 0.1 1.9 42.2 0.1 0.6
China1985 100.0 42.6 32.0 0.4 .. 6.4 .. .. .. 14.2 .. 4.31990 100.0 46.2 29.7 2.7 .. 3.9 .. .. .. 15.7 .. 1.81995 100.0 17.5 45.6 4.0 .. 9.7 .. .. .. 19.6 .. 3.71998 100.0 10.2 52.4 3.4 2.5 1.6 0.1 0.6 0.3 28.9 0.1 0.1
Indonesia1985 100.0 5.0 64.9 .. .. .. .. .. .. 30.1 .. ..1990 100.0 2.8 86.5 .. .. .. .. .. .. 10.7 .. ..1995 100.0 .. 95.6 2.1 .. .. .. .. .. .. .. 2.31998 100.0 .. 95.0 1.9 .. .. .. .. .. .. .. 3.1
Malaysia1985 100.0 35.7 32.1 .. .. 0.1 .. .. .. 26.9 .. 5.21990 100.0 31.0 43.6 .. .. 0.1 .. .. .. 22.9 .. 2.31995 100.0 21.3 34.2 .. .. 0.1 .. .. .. 43.1 .. 1.41998 .. .. .. .. .. .. .. .. .. .. .. ..
Philippines1985 100.0 8.9 22.6 .. .. 0.2 .. .. .. 51.5 .. 16.71990 100.0 7.6 14.4 .. 0.1 0.4 .. .. 0.0 66.8 .. 10.71995 100.0 2.9 12.2 .. 0.1 0.7 .. .. 0.0 83.9 .. 0.31998 100.0 4.3 19.0 .. 0.5 0.3 .. .. .. 75.7 .. 0.2
Thailand1985 100.0 22.7 57.3 .. .. 0.5 .. .. 0.0 12.5 .. 7.01990 100.0 20.7 67.4 .. .. 0.2 .. .. .. 9.8 .. 2.01995 100.0 16.5 54.1 1.3 0.1 0.7 .. .. 0.0 25.9 .. 1.31998 100.0 20.3 46.9 1.2 0.7 0.4 .. .. 0.1 29.8 .. 0.6
Notes and Sources: See Table 1.
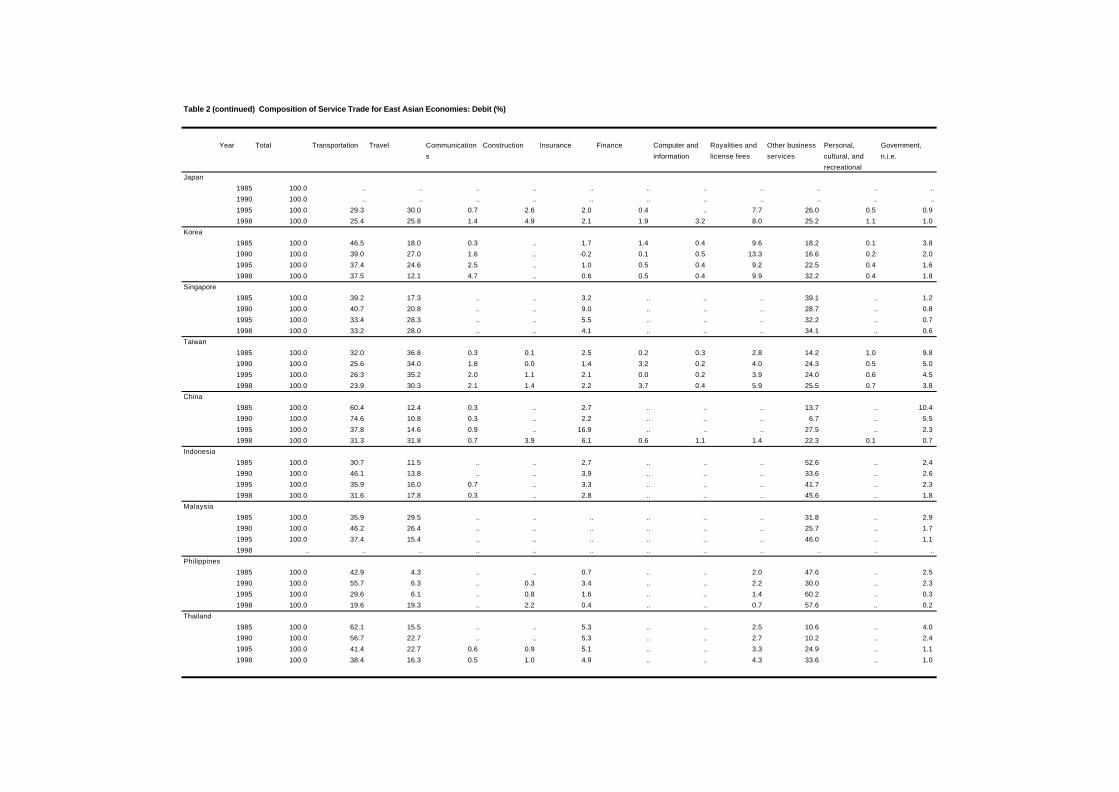
Table 2 (continued) Composition of Service Trade for East Asian Economies: Debit (%)
Year Total Transportation Travel Communications
Construction Insurance Finance Computer andinformation
Royalities andlicense fees
Other businessservices
Personal,cultural, andrecreational
Government,n.i.e.
Japan1985 100.0 .. .. .. .. .. .. .. .. .. .. ..1990 100.0 .. .. .. .. .. .. .. .. .. .. ..1995 100.0 29.3 30.0 0.7 2.6 2.0 0.4 .. 7.7 26.0 0.5 0.91998 100.0 25.4 25.8 1.4 4.9 2.1 1.9 3.2 8.0 25.2 1.1 1.0
Korea1985 100.0 46.5 18.0 0.3 .. 1.7 1.4 0.4 9.6 18.2 0.1 3.81990 100.0 39.0 27.0 1.6 .. -0.2 0.1 0.5 13.3 16.6 0.2 2.01995 100.0 37.4 24.6 2.5 .. 1.0 0.5 0.4 9.2 22.5 0.4 1.61998 100.0 37.5 12.1 4.7 .. 0.6 0.5 0.4 9.9 32.2 0.4 1.8
Singapore1985 100.0 39.2 17.3 .. .. 3.2 .. .. .. 39.1 .. 1.21990 100.0 40.7 20.8 .. .. 9.0 .. .. .. 28.7 .. 0.81995 100.0 33.4 28.3 .. .. 5.5 .. .. .. 32.2 .. 0.71998 100.0 33.2 28.0 .. .. 4.1 .. .. .. 34.1 .. 0.6
Taiwan1985 100.0 32.0 36.8 0.3 0.1 2.5 0.2 0.3 2.8 14.2 1.0 9.81990 100.0 25.6 34.0 1.8 0.0 1.4 3.2 0.2 4.0 24.3 0.5 5.01995 100.0 26.3 35.2 2.0 1.1 2.1 0.0 0.2 3.9 24.0 0.6 4.51998 100.0 23.9 30.3 2.1 1.4 2.2 3.7 0.4 5.9 25.5 0.7 3.8
China1985 100.0 60.4 12.4 0.3 .. 2.7 .. .. .. 13.7 .. 10.41990 100.0 74.6 10.8 0.3 .. 2.2 .. .. .. 6.7 .. 5.51995 100.0 37.8 14.6 0.9 .. 16.9 .. .. .. 27.5 .. 2.31998 100.0 31.3 31.8 0.7 3.9 6.1 0.6 1.1 1.4 22.3 0.1 0.7
Indonesia1985 100.0 30.7 11.5 .. .. 2.7 .. .. .. 52.6 .. 2.41990 100.0 46.1 13.8 .. .. 3.9 .. .. .. 33.6 .. 2.61995 100.0 35.9 16.0 0.7 .. 3.3 .. .. .. 41.7 .. 2.31998 100.0 31.6 17.8 0.3 .. 2.8 .. .. .. 45.6 .. 1.8
Malaysia1985 100.0 35.9 29.5 .. .. .. .. .. .. 31.8 .. 2.91990 100.0 46.2 26.4 .. .. .. .. .. .. 25.7 .. 1.71995 100.0 37.4 15.4 .. .. .. .. .. .. 46.0 .. 1.11998 .. .. .. .. .. .. .. .. .. .. .. ..
Philippines1985 100.0 42.9 4.3 .. .. 0.7 .. .. 2.0 47.6 .. 2.51990 100.0 55.7 6.3 .. 0.3 3.4 .. .. 2.2 30.0 .. 2.31995 100.0 29.6 6.1 .. 0.8 1.6 .. .. 1.4 60.2 .. 0.31998 100.0 19.6 19.3 .. 2.2 0.4 .. .. 0.7 57.6 .. 0.2
Thailand1985 100.0 62.1 15.5 .. .. 5.3 .. .. 2.5 10.6 .. 4.01990 100.0 56.7 22.7 .. .. 5.3 .. .. 2.7 10.2 .. 2.41995 100.0 41.4 22.7 0.6 0.9 5.1 .. .. 3.3 24.9 .. 1.11998 100.0 38.4 16.3 0.5 1.0 4.9 .. .. 4.3 33.6 .. 1.0
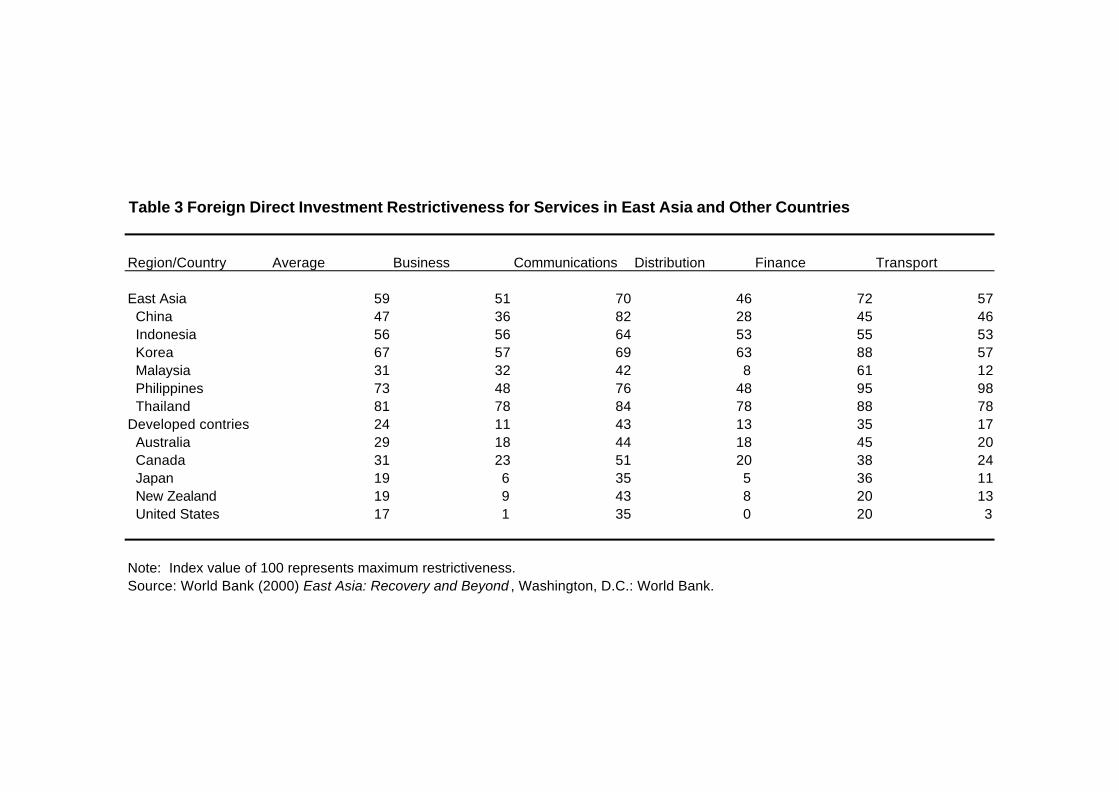
Table 3 Foreign Direct Investment Restrictiveness for Services in East Asia and Other Countries
Region/Country Average Business Communications Distribution Finance Transport
East Asia 59 51 70 46 72 57 China 47 36 82 28 45 46 Indonesia 56 56 64 53 55 53 Korea 67 57 69 63 88 57 Malaysia 31 32 42 8 61 12 Philippines 73 48 76 48 95 98 Thailand 81 78 84 78 88 78Developed contries 24 11 43 13 35 17 Australia 29 18 44 18 45 20 Canada 31 23 51 20 38 24 Japan 19 6 35 5 36 11 New Zealand 19 9 43 8 20 13 United States 17 1 35 0 20 3
Note: Index value of 100 represents maximum restrictiveness.Source: World Bank (2000) East Asia: Recovery and Beyond , Washington, D.C.: World Bank.
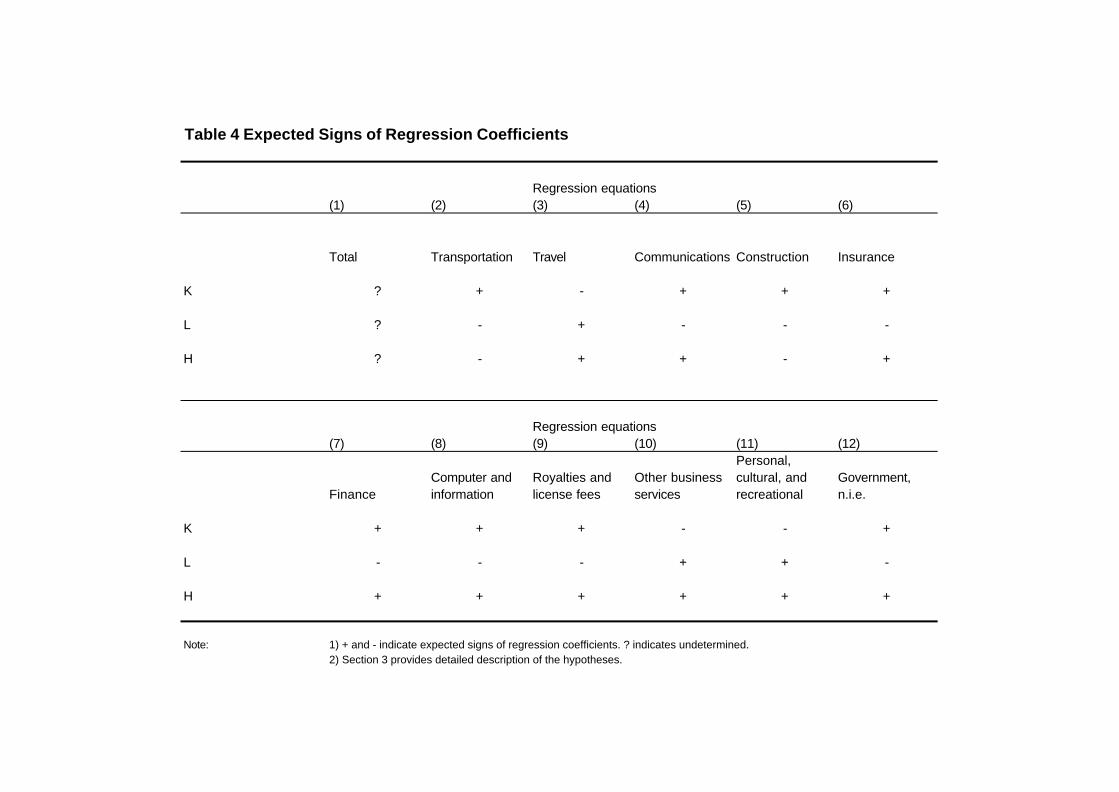
Table 4 Expected Signs of Regression Coefficients
Regression equations(1) (2) (3) (4) (5) (6)
Total Transportation Travel Communications Construction Insurance
K ? + - + + +
L ? - + - - -
H ? - + + - +
Regression equations(7) (8) (9) (10) (11) (12)
FinanceComputer andinformation
Royalties andlicense fees
Other businessservices
Personal,cultural, andrecreational
Government,n.i.e.
K + + + - - +
L - - - + + -
H + + + + + +
Note: 1) + and - indicate expected signs of regression coefficients. ? indicates undetermined.2) Section 3 provides detailed description of the hypotheses.
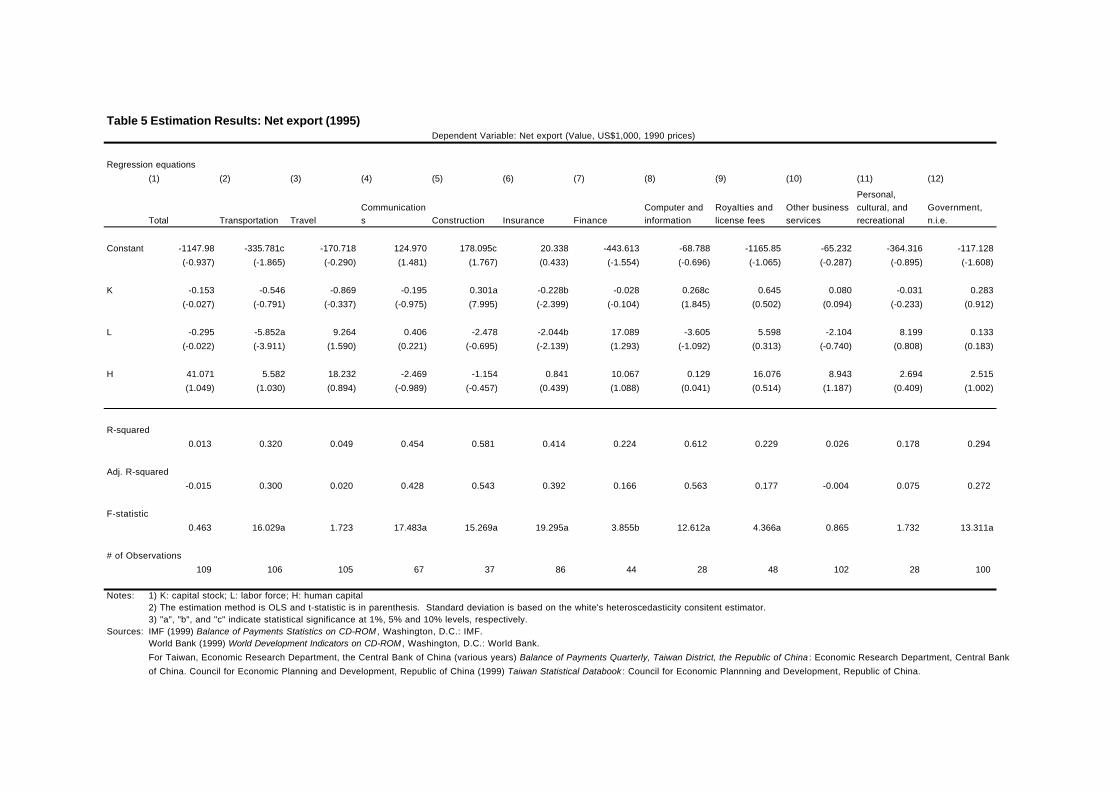
Table 5 Estimation Results: Net export (1995)Dependent Variable: Net export (Value, US$1,000, 1990 prices)
Regression equations(1) (2) (3) (4) (5) (6) (7) (8) (9) (10) (11) (12)
Total Transportation TravelCommunications Construction Insurance Finance
Computer andinformation
Royalties andlicense fees
Other businessservices
Personal,cultural, andrecreational
Government,n.i.e.
Constant -1147.98 -335.781c -170.718 124.970 178.095c 20.338 -443.613 -68.788 -1165.85 -65.232 -364.316 -117.128(-0.937) (-1.865) (-0.290) (1.481) (1.767) (0.433) (-1.554) (-0.696) (-1.065) (-0.287) (-0.895) (-1.608)
K -0.153 -0.546 -0.869 -0.195 0.301a -0.228b -0.028 0.268c 0.645 0.080 -0.031 0.283(-0.027) (-0.791) (-0.337) (-0.975) (7.995) (-2.399) (-0.104) (1.845) (0.502) (0.094) (-0.233) (0.912)
L -0.295 -5.852a 9.264 0.406 -2.478 -2.044b 17.089 -3.605 5.598 -2.104 8.199 0.133(-0.022) (-3.911) (1.590) (0.221) (-0.695) (-2.139) (1.293) (-1.092) (0.313) (-0.740) (0.808) (0.183)
H 41.071 5.582 18.232 -2.469 -1.154 0.841 10.067 0.129 16.076 8.943 2.694 2.515(1.049) (1.030) (0.894) (-0.989) (-0.457) (0.439) (1.088) (0.041) (0.514) (1.187) (0.409) (1.002)
R-squared0.013 0.320 0.049 0.454 0.581 0.414 0.224 0.612 0.229 0.026 0.178 0.294
Adj. R-squared-0.015 0.300 0.020 0.428 0.543 0.392 0.166 0.563 0.177 -0.004 0.075 0.272
F-statistic0.463 16.029a 1.723 17.483a 15.269a 19.295a 3.855b 12.612a 4.366a 0.865 1.732 13.311a
# of Observations109 106 105 67 37 86 44 28 48 102 28 100
Notes: 1) K: capital stock; L: labor force; H: human capital2) The estimation method is OLS and t-statistic is in parenthesis. Standard deviation is based on the white's heteroscedasticity consitent estimator.3) "a", "b", and "c" indicate statistical significance at 1%, 5% and 10% levels, respectively.
Sources: IMF (1999) Balance of Payments Statistics on CD-ROM , Washington, D.C.: IMF.World Bank (1999) World Development Indicators on CD-ROM , Washington, D.C.: World Bank.For Taiwan, Economic Research Department, the Central Bank of China (various years) Balance of Payments Quarterly, Taiwan District, the Republic of China : Economic Research Department, Central Bankof China. Council for Economic Planning and Development, Republic of China (1999) Taiwan Statistical Databook : Council for Economic Plannning and Development, Republic of China.
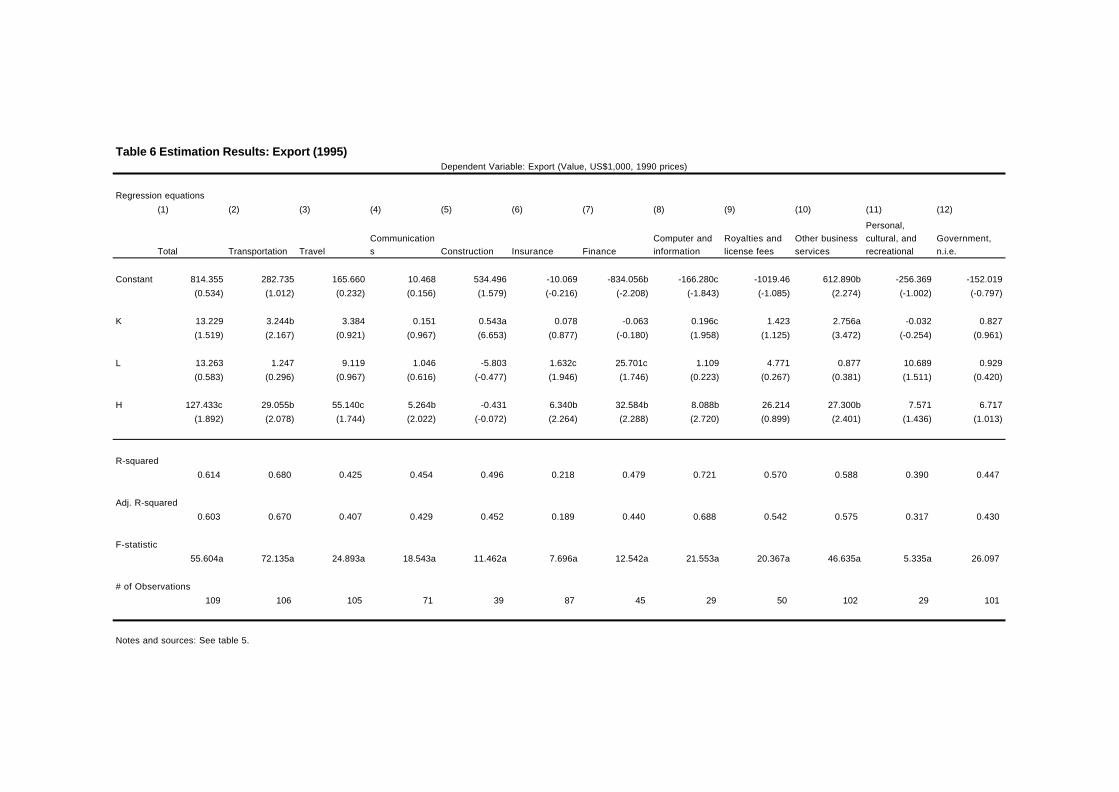
Table 6 Estimation Results: Export (1995)Dependent Variable: Export (Value, US$1,000, 1990 prices)
Regression equations(1) (2) (3) (4) (5) (6) (7) (8) (9) (10) (11) (12)
Total Transportation TravelCommunications Construction Insurance Finance
Computer andinformation
Royalties andlicense fees
Other businessservices
Personal,cultural, andrecreational
Government,n.i.e.
Constant 814.355 282.735 165.660 10.468 534.496 -10.069 -834.056b -166.280c -1019.46 612.890b -256.369 -152.019(0.534) (1.012) (0.232) (0.156) (1.579) (-0.216) (-2.208) (-1.843) (-1.085) (2.274) (-1.002) (-0.797)
K 13.229 3.244b 3.384 0.151 0.543a 0.078 -0.063 0.196c 1.423 2.756a -0.032 0.827(1.519) (2.167) (0.921) (0.967) (6.653) (0.877) (-0.180) (1.958) (1.125) (3.472) (-0.254) (0.961)
L 13.263 1.247 9.119 1.046 -5.803 1.632c 25.701c 1.109 4.771 0.877 10.689 0.929(0.583) (0.296) (0.967) (0.616) (-0.477) (1.946) (1.746) (0.223) (0.267) (0.381) (1.511) (0.420)
H 127.433c 29.055b 55.140c 5.264b -0.431 6.340b 32.584b 8.088b 26.214 27.300b 7.571 6.717(1.892) (2.078) (1.744) (2.022) (-0.072) (2.264) (2.288) (2.720) (0.899) (2.401) (1.436) (1.013)
R-squared0.614 0.680 0.425 0.454 0.496 0.218 0.479 0.721 0.570 0.588 0.390 0.447
Adj. R-squared0.603 0.670 0.407 0.429 0.452 0.189 0.440 0.688 0.542 0.575 0.317 0.430
F-statistic55.604a 72.135a 24.893a 18.543a 11.462a 7.696a 12.542a 21.553a 20.367a 46.635a 5.335a 26.097
# of Observations109 106 105 71 39 87 45 29 50 102 29 101
Notes and sources: See table 5.
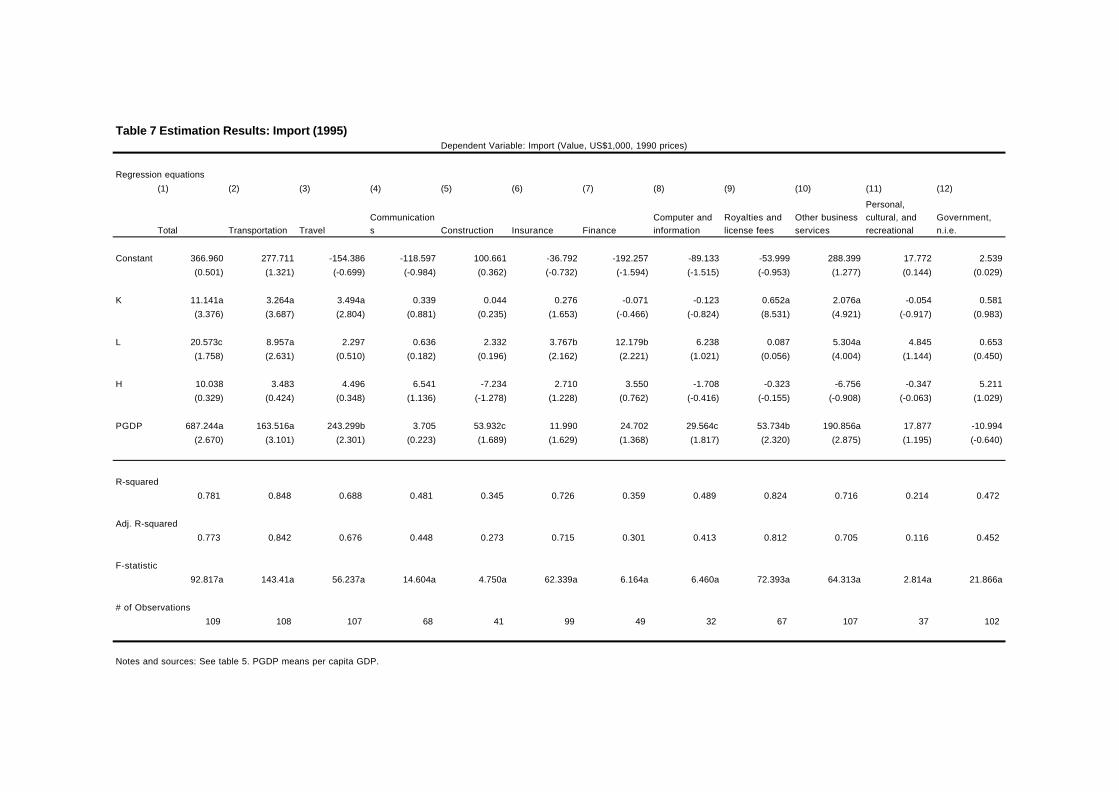
Table 7 Estimation Results: Import (1995)Dependent Variable: Import (Value, US$1,000, 1990 prices)
Regression equations(1) (2) (3) (4) (5) (6) (7) (8) (9) (10) (11) (12)
Total Transportation TravelCommunications Construction Insurance Finance
Computer andinformation
Royalties andlicense fees
Other businessservices
Personal,cultural, andrecreational
Government,n.i.e.
Constant 366.960 277.711 -154.386 -118.597 100.661 -36.792 -192.257 -89.133 -53.999 288.399 17.772 2.539(0.501) (1.321) (-0.699) (-0.984) (0.362) (-0.732) (-1.594) (-1.515) (-0.953) (1.277) (0.144) (0.029)
K 11.141a 3.264a 3.494a 0.339 0.044 0.276 -0.071 -0.123 0.652a 2.076a -0.054 0.581(3.376) (3.687) (2.804) (0.881) (0.235) (1.653) (-0.466) (-0.824) (8.531) (4.921) (-0.917) (0.983)
L 20.573c 8.957a 2.297 0.636 2.332 3.767b 12.179b 6.238 0.087 5.304a 4.845 0.653(1.758) (2.631) (0.510) (0.182) (0.196) (2.162) (2.221) (1.021) (0.056) (4.004) (1.144) (0.450)
H 10.038 3.483 4.496 6.541 -7.234 2.710 3.550 -1.708 -0.323 -6.756 -0.347 5.211(0.329) (0.424) (0.348) (1.136) (-1.278) (1.228) (0.762) (-0.416) (-0.155) (-0.908) (-0.063) (1.029)
PGDP 687.244a 163.516a 243.299b 3.705 53.932c 11.990 24.702 29.564c 53.734b 190.856a 17.877 -10.994(2.670) (3.101) (2.301) (0.223) (1.689) (1.629) (1.368) (1.817) (2.320) (2.875) (1.195) (-0.640)
R-squared0.781 0.848 0.688 0.481 0.345 0.726 0.359 0.489 0.824 0.716 0.214 0.472
Adj. R-squared0.773 0.842 0.676 0.448 0.273 0.715 0.301 0.413 0.812 0.705 0.116 0.452
F-statistic92.817a 143.41a 56.237a 14.604a 4.750a 62.339a 6.164a 6.460a 72.393a 64.313a 2.814a 21.866a
# of Observations109 108 107 68 41 99 49 32 67 107 37 102
Notes and sources: See table 5. PGDP means per capita GDP.
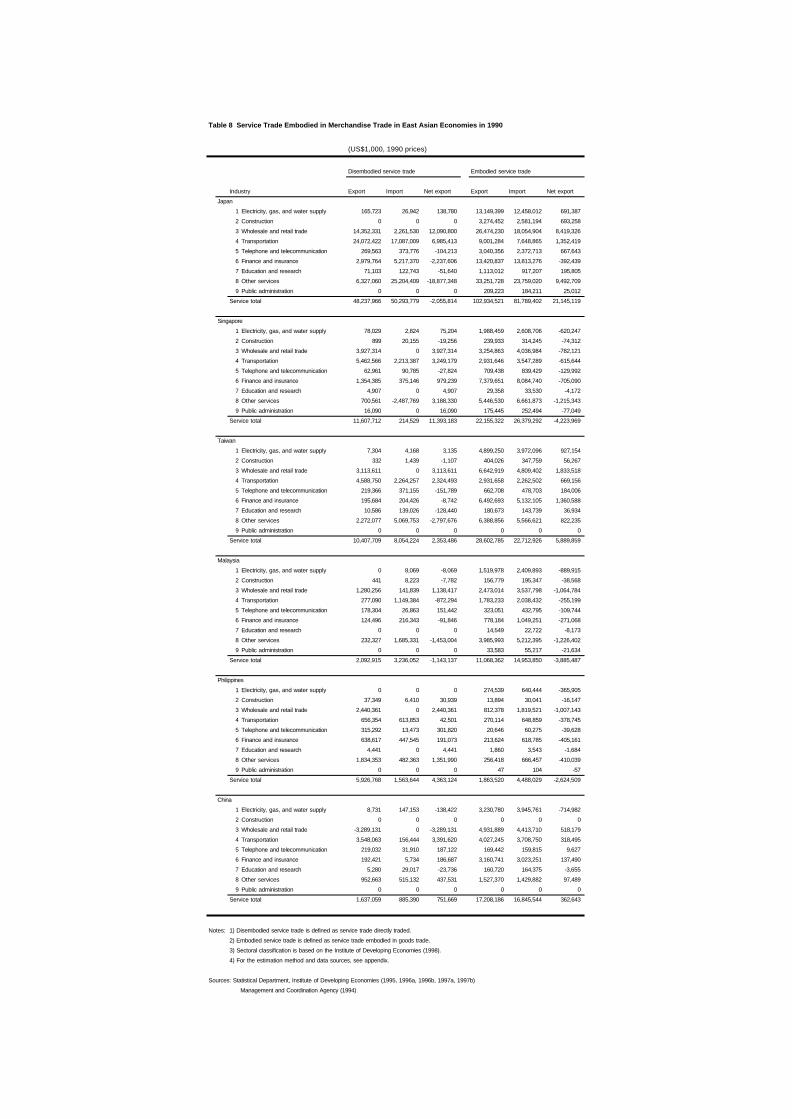
Table 8 Service Trade Embodied in Merchandise Trade in East Asian Economies in 1990
(US$1,000, 1990 prices)
Disembodied service trade Embodied service trade
Industry Export Import Net export Export Import Net exportJapan
1 Electricity, gas, and water supply 165,723 26,942 138,780 13,149,399 12,458,012 691,3872 Construction 0 0 0 3,274,452 2,581,194 693,2583 Wholesale and retail trade 14,352,331 2,261,530 12,090,800 26,474,230 18,054,904 8,419,3264 Transportation 24,072,422 17,087,009 6,985,413 9,001,284 7,648,865 1,352,4195 Telephone and telecommunication 269,563 373,776 -104,213 3,040,356 2,372,713 667,6436 Finance and insurance 2,979,764 5,217,370 -2,237,606 13,420,837 13,813,276 -392,4397 Education and research 71,103 122,743 -51,640 1,113,012 917,207 195,8058 Other services 6,327,060 25,204,409 -18,877,348 33,251,728 23,759,020 9,492,7099 Public administration 0 0 0 209,223 184,211 25,012
Service total 48,237,966 50,293,779 -2,055,814 102,934,521 81,789,402 21,145,119
Singapore1 Electricity, gas, and water supply 78,029 2,824 75,204 1,988,459 2,608,706 -620,2472 Construction 899 20,155 -19,256 239,933 314,245 -74,3123 Wholesale and retail trade 3,927,314 0 3,927,314 3,254,863 4,036,984 -782,1214 Transportation 5,462,566 2,213,387 3,249,179 2,931,646 3,547,289 -615,6445 Telephone and telecommunication 62,961 90,785 -27,824 709,438 839,429 -129,9926 Finance and insurance 1,354,385 375,146 979,239 7,379,651 8,084,740 -705,0907 Education and research 4,907 0 4,907 29,358 33,530 -4,1728 Other services 700,561 -2,487,769 3,188,330 5,446,530 6,661,873 -1,215,3439 Public administration 16,090 0 16,090 175,445 252,494 -77,049
Service total 11,607,712 214,529 11,393,183 22,155,322 26,379,292 -4,223,969
Taiwan1 Electricity, gas, and water supply 7,304 4,168 3,135 4,899,250 3,972,096 927,1542 Construction 332 1,439 -1,107 404,026 347,759 56,2673 Wholesale and retail trade 3,113,611 0 3,113,611 6,642,919 4,809,402 1,833,5184 Transportation 4,588,750 2,264,257 2,324,493 2,931,658 2,262,502 669,1565 Telephone and telecommunication 219,366 371,155 -151,789 662,708 478,703 184,0066 Finance and insurance 195,684 204,426 -8,742 6,492,693 5,132,105 1,360,5887 Education and research 10,586 139,026 -128,440 180,673 143,739 36,9348 Other services 2,272,077 5,069,753 -2,797,676 6,388,856 5,566,621 822,2359 Public administration 0 0 0 0 0 0
Service total 10,407,709 8,054,224 2,353,486 28,602,785 22,712,926 5,889,859
Malaysia1 Electricity, gas, and water supply 0 8,069 -8,069 1,519,978 2,409,893 -889,9152 Construction 441 8,223 -7,782 156,779 195,347 -38,5683 Wholesale and retail trade 1,280,256 141,839 1,138,417 2,473,014 3,537,798 -1,064,7844 Transportation 277,090 1,149,384 -872,294 1,783,233 2,038,432 -255,1995 Telephone and telecommunication 178,304 26,863 151,442 323,051 432,795 -109,7446 Finance and insurance 124,496 216,343 -91,846 778,184 1,049,251 -271,0687 Education and research 0 0 0 14,549 22,722 -8,1738 Other services 232,327 1,685,331 -1,453,004 3,985,993 5,212,395 -1,226,4029 Public administration 0 0 0 33,583 55,217 -21,634
Service total 2,092,915 3,236,052 -1,143,137 11,068,362 14,953,850 -3,885,487
Philippines1 Electricity, gas, and water supply 0 0 0 274,539 640,444 -365,9052 Construction 37,349 6,410 30,939 13,894 30,041 -16,1473 Wholesale and retail trade 2,440,361 0 2,440,361 812,378 1,819,521 -1,007,1434 Transportation 656,354 613,853 42,501 270,114 648,859 -378,7455 Telephone and telecommunication 315,292 13,473 301,820 20,646 60,275 -39,6286 Finance and insurance 638,617 447,545 191,073 213,624 618,785 -405,1617 Education and research 4,441 0 4,441 1,860 3,543 -1,6848 Other services 1,834,353 482,363 1,351,990 256,418 666,457 -410,0399 Public administration 0 0 0 47 104 -57
Service total 5,926,768 1,563,644 4,363,124 1,863,520 4,488,029 -2,624,509
China1 Electricity, gas, and water supply 8,731 147,153 -138,422 3,230,780 3,945,761 -714,9822 Construction 0 0 0 0 0 03 Wholesale and retail trade -3,289,131 0 -3,289,131 4,931,889 4,413,710 518,1794 Transportation 3,548,063 156,444 3,391,620 4,027,245 3,708,750 318,4955 Telephone and telecommunication 219,032 31,910 187,122 169,442 159,815 9,6276 Finance and insurance 192,421 5,734 186,687 3,160,741 3,023,251 137,4907 Education and research 5,280 29,017 -23,736 160,720 164,375 -3,6558 Other services 952,663 515,132 437,531 1,527,370 1,429,882 97,4899 Public administration 0 0 0 0 0 0
Service total 1,637,059 885,390 751,669 17,208,186 16,845,544 362,643
Notes: 1) Disembodied service trade is defined as service trade directly traded.2) Embodied service trade is defined as service trade embodied in goods trade.3) Sectoral classification is based on the Institute of Developing Economies (1998).4) For the estimation method and data sources, see appendix.
Sources: Statistical Department, Institute of Developing Economies (1995, 1996a, 1996b, 1997a, 1997b) Management and Coordination Agency (1994)
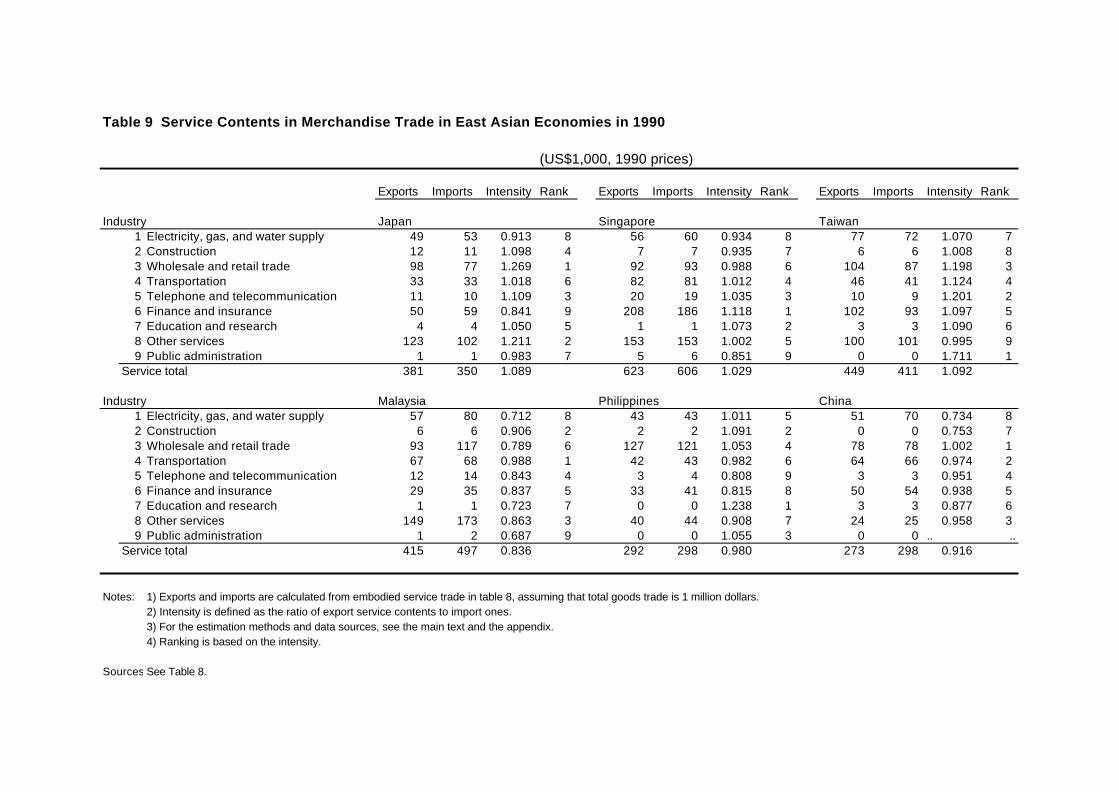
Table 9 Service Contents in Merchandise Trade in East Asian Economies in 1990
(US$1,000, 1990 prices)
Exports Imports Intensity Rank Exports Imports Intensity Rank Exports Imports Intensity Rank
Industry Japan Singapore Taiwan1 Electricity, gas, and water supply 49 53 0.913 8 56 60 0.934 8 77 72 1.070 72 Construction 12 11 1.098 4 7 7 0.935 7 6 6 1.008 83 Wholesale and retail trade 98 77 1.269 1 92 93 0.988 6 104 87 1.198 34 Transportation 33 33 1.018 6 82 81 1.012 4 46 41 1.124 45 Telephone and telecommunication 11 10 1.109 3 20 19 1.035 3 10 9 1.201 26 Finance and insurance 50 59 0.841 9 208 186 1.118 1 102 93 1.097 57 Education and research 4 4 1.050 5 1 1 1.073 2 3 3 1.090 68 Other services 123 102 1.211 2 153 153 1.002 5 100 101 0.995 99 Public administration 1 1 0.983 7 5 6 0.851 9 0 0 1.711 1
Service total 381 350 1.089 623 606 1.029 449 411 1.092
Industry Malaysia Philippines China1 Electricity, gas, and water supply 57 80 0.712 8 43 43 1.011 5 51 70 0.734 82 Construction 6 6 0.906 2 2 2 1.091 2 0 0 0.753 73 Wholesale and retail trade 93 117 0.789 6 127 121 1.053 4 78 78 1.002 14 Transportation 67 68 0.988 1 42 43 0.982 6 64 66 0.974 25 Telephone and telecommunication 12 14 0.843 4 3 4 0.808 9 3 3 0.951 46 Finance and insurance 29 35 0.837 5 33 41 0.815 8 50 54 0.938 57 Education and research 1 1 0.723 7 0 0 1.238 1 3 3 0.877 68 Other services 149 173 0.863 3 40 44 0.908 7 24 25 0.958 39 Public administration 1 2 0.687 9 0 0 1.055 3 0 0 .. ..
Service total 415 497 0.836 292 298 0.980 273 298 0.916
Notes: 1) Exports and imports are calculated from embodied service trade in table 8, assuming that total goods trade is 1 million dollars.2) Intensity is defined as the ratio of export service contents to import ones.3) For the estimation methods and data sources, see the main text and the appendix.4) Ranking is based on the intensity.
Sources:See Table 8.
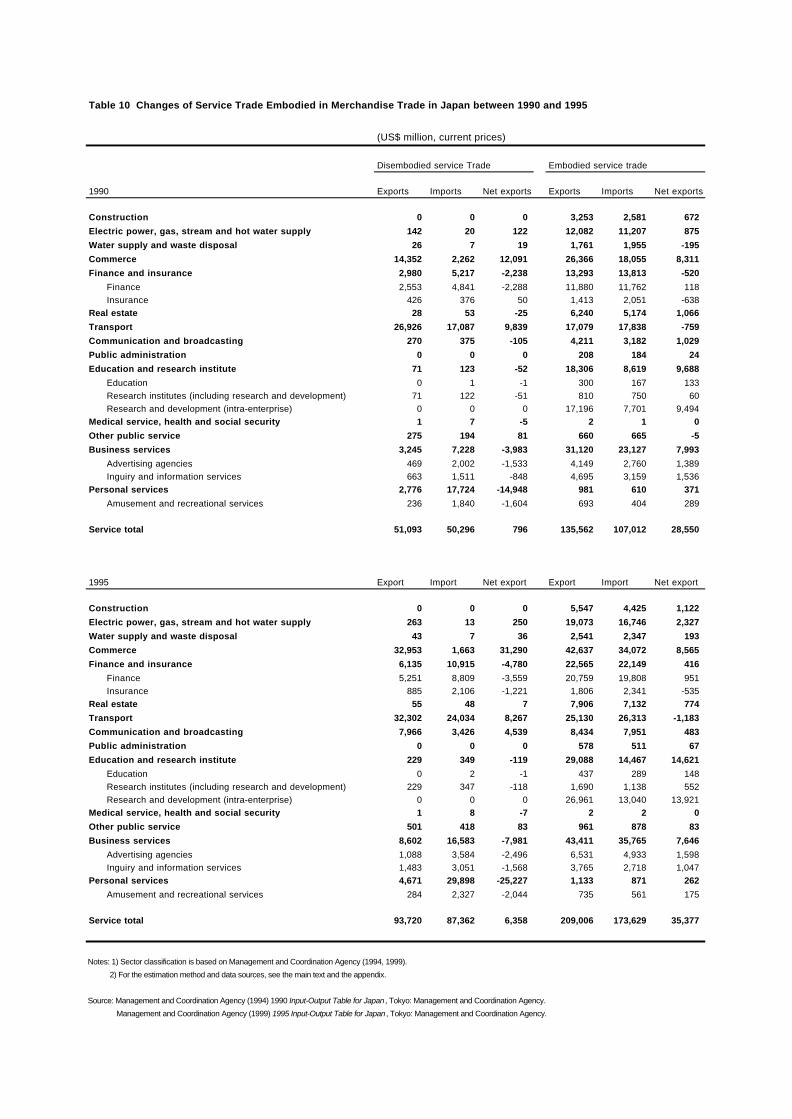
Table 10 Changes of Service Trade Embodied in Merchandise Trade in Japan between 1990 and 1995
(US$ million, current prices)
Disembodied service Trade Embodied service trade
1990 Exports Imports Net exports Exports Imports Net exports
Construction 0 0 0 3,253 2,581 672
Electric power, gas, stream and hot water supply 142 20 122 12,082 11,207 875
Water supply and waste disposal 26 7 19 1,761 1,955 -195
Commerce 14,352 2,262 12,091 26,366 18,055 8,311
Finance and insurance 2,980 5,217 -2,238 13,293 13,813 -520
Finance 2,553 4,841 -2,288 11,880 11,762 118Insurance 426 376 50 1,413 2,051 -638
Real estate 28 53 -25 6,240 5,174 1,066
Transport 26,926 17,087 9,839 17,079 17,838 -759
Communication and broadcasting 270 375 -105 4,211 3,182 1,029
Public administration 0 0 0 208 184 24
Education and research institute 71 123 -52 18,306 8,619 9,688
Education 0 1 -1 300 167 133Research institutes (including research and development) 71 122 -51 810 750 60Research and development (intra-enterprise) 0 0 0 17,196 7,701 9,494
Medical service, health and social security 1 7 -5 2 1 0
Other public service 275 194 81 660 665 -5
Business services 3,245 7,228 -3,983 31,120 23,127 7,993
Advertising agencies 469 2,002 -1,533 4,149 2,760 1,389Inguiry and information services 663 1,511 -848 4,695 3,159 1,536
Personal services 2,776 17,724 -14,948 981 610 371
Amusement and recreational services 236 1,840 -1,604 693 404 289
Service total 51,093 50,296 796 135,562 107,012 28,550
1995 Export Import Net export Export Import Net export
Construction 0 0 0 5,547 4,425 1,122
Electric power, gas, stream and hot water supply 263 13 250 19,073 16,746 2,327
Water supply and waste disposal 43 7 36 2,541 2,347 193
Commerce 32,953 1,663 31,290 42,637 34,072 8,565
Finance and insurance 6,135 10,915 -4,780 22,565 22,149 416
Finance 5,251 8,809 -3,559 20,759 19,808 951Insurance 885 2,106 -1,221 1,806 2,341 -535
Real estate 55 48 7 7,906 7,132 774
Transport 32,302 24,034 8,267 25,130 26,313 -1,183
Communication and broadcasting 7,966 3,426 4,539 8,434 7,951 483
Public administration 0 0 0 578 511 67
Education and research institute 229 349 -119 29,088 14,467 14,621
Education 0 2 -1 437 289 148Research institutes (including research and development) 229 347 -118 1,690 1,138 552Research and development (intra-enterprise) 0 0 0 26,961 13,040 13,921
Medical service, health and social security 1 8 -7 2 2 0
Other public service 501 418 83 961 878 83
Business services 8,602 16,583 -7,981 43,411 35,765 7,646
Advertising agencies 1,088 3,584 -2,496 6,531 4,933 1,598Inguiry and information services 1,483 3,051 -1,568 3,765 2,718 1,047
Personal services 4,671 29,898 -25,227 1,133 871 262
Amusement and recreational services 284 2,327 -2,044 735 561 175
Service total 93,720 87,362 6,358 209,006 173,629 35,377
Notes: 1) Sector classification is based on Management and Coordination Agency (1994, 1999). 2) For the estimation method and data sources, see the main text and the appendix.
Source: Management and Coordination Agency (1994) 1990 Input-Output Table for Japan , Tokyo: Management and Coordination Agency. Management and Coordination Agency (1999) 1995 Input-Output Table for Japan , Tokyo: Management and Coordination Agency.
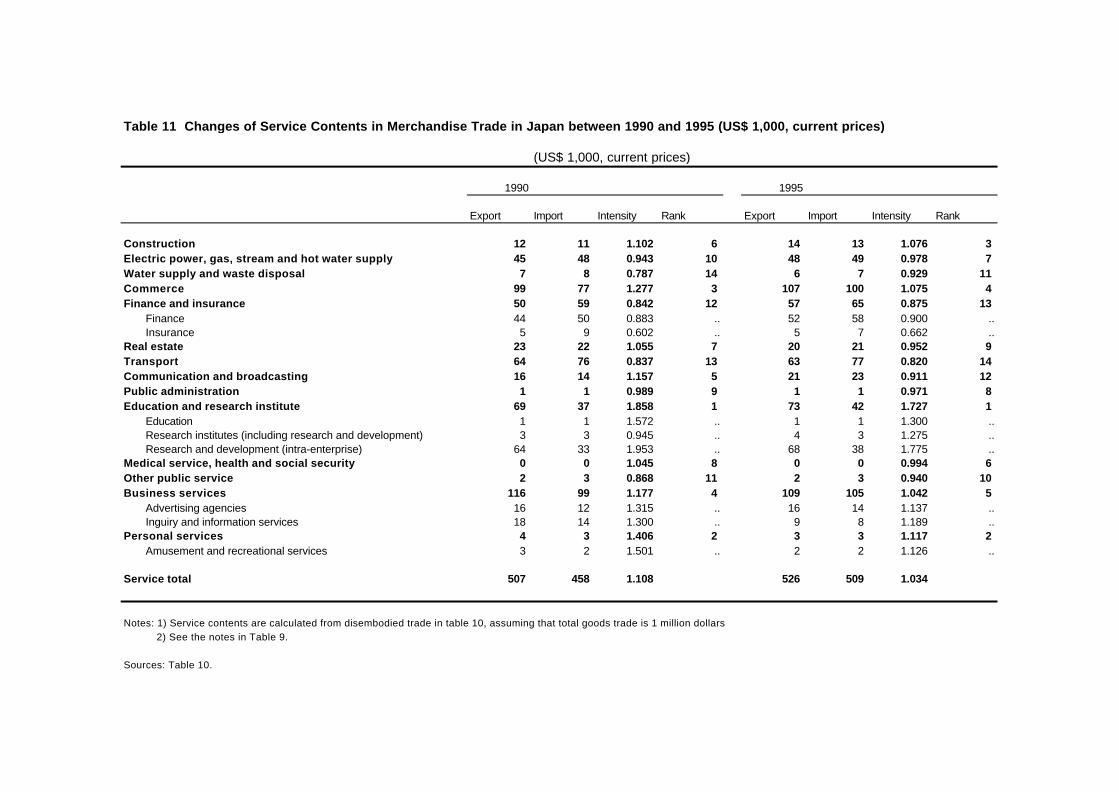
Table 11 Changes of Service Contents in Merchandise Trade in Japan between 1990 and 1995 (US$ 1,000, current prices)
(US$ 1,000, current prices)
1990 1995
Export Import Intensity Rank Export Import Intensity Rank
Construction 12 11 1.102 6 14 13 1.076 3Electric power, gas, stream and hot water supply 45 48 0.943 10 48 49 0.978 7Water supply and waste disposal 7 8 0.787 14 6 7 0.929 11Commerce 99 77 1.277 3 107 100 1.075 4Finance and insurance 50 59 0.842 12 57 65 0.875 13
Finance 44 50 0.883 .. 52 58 0.900 ..Insurance 5 9 0.602 .. 5 7 0.662 ..
Real estate 23 22 1.055 7 20 21 0.952 9Transport 64 76 0.837 13 63 77 0.820 14Communication and broadcasting 16 14 1.157 5 21 23 0.911 12Public administration 1 1 0.989 9 1 1 0.971 8Education and research institute 69 37 1.858 1 73 42 1.727 1
Education 1 1 1.572 .. 1 1 1.300 ..Research institutes (including research and development) 3 3 0.945 .. 4 3 1.275 ..Research and development (intra-enterprise) 64 33 1.953 .. 68 38 1.775 ..
Medical service, health and social security 0 0 1.045 8 0 0 0.994 6Other public service 2 3 0.868 11 2 3 0.940 10Business services 116 99 1.177 4 109 105 1.042 5
Advertising agencies 16 12 1.315 .. 16 14 1.137 ..Inguiry and information services 18 14 1.300 .. 9 8 1.189 ..
Personal services 4 3 1.406 2 3 3 1.117 2Amusement and recreational services 3 2 1.501 .. 2 2 1.126 ..
Service total 507 458 1.108 526 509 1.034
Notes: 1) Service contents are calculated from disembodied trade in table 10, assuming that total goods trade is 1 million dollars 2) See the notes in Table 9.
Sources: Table 10.
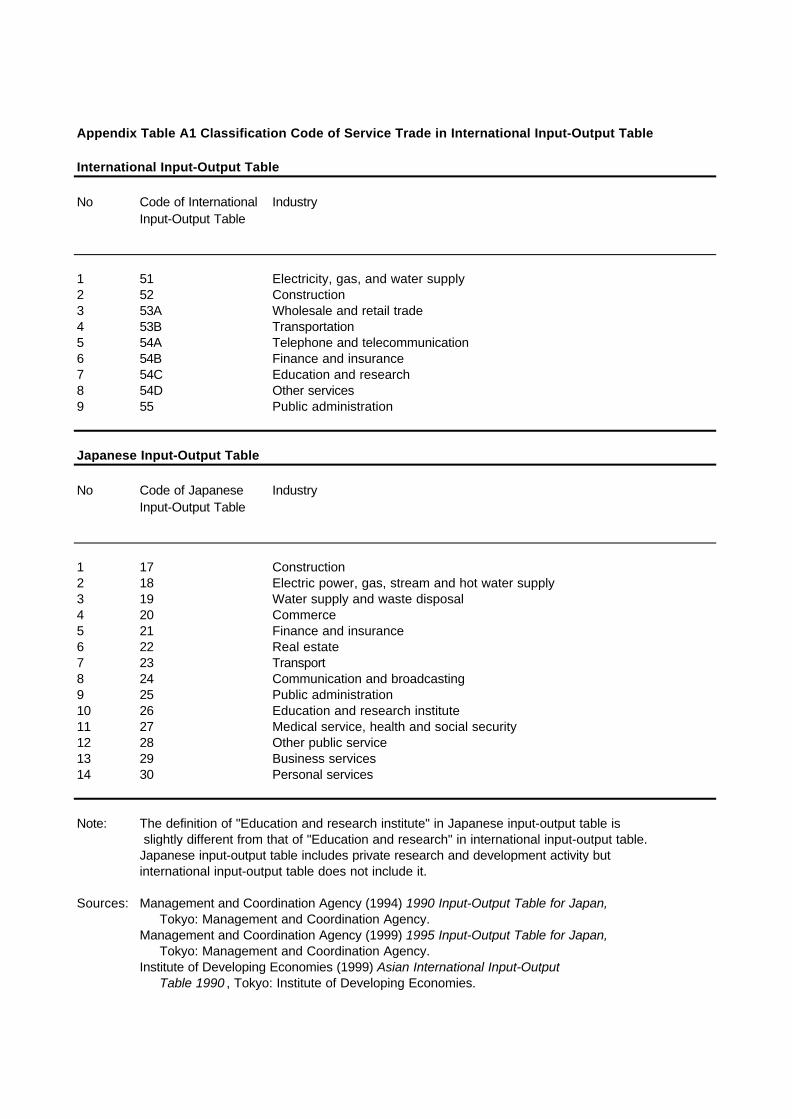
Appendix Table A1 Classification Code of Service Trade in International Input-Output Table
International Input-Output Table
No Code of InternationalInput-Output Table
Industry
1 51 Electricity, gas, and water supply2 52 Construction3 53A Wholesale and retail trade4 53B Transportation5 54A Telephone and telecommunication6 54B Finance and insurance7 54C Education and research8 54D Other services9 55 Public administration
Japanese Input-Output Table
No Code of JapaneseInput-Output Table
Industry
1 17 Construction2 18 Electric power, gas, stream and hot water supply3 19 Water supply and waste disposal4 20 Commerce5 21 Finance and insurance6 22 Real estate7 23 Transport8 24 Communication and broadcasting9 25 Public administration10 26 Education and research institute11 27 Medical service, health and social security12 28 Other public service13 29 Business services14 30 Personal services
Note: The definition of "Education and research institute" in Japanese input-output table is slightly different from that of "Education and research" in international input-output table.Japanese input-output table includes private research and development activity butinternational input-output table does not include it.
Sources: Management and Coordination Agency (1994) 1990 Input-Output Table for Japan, Tokyo: Management and Coordination Agency.Management and Coordination Agency (1999) 1995 Input-Output Table for Japan, Tokyo: Management and Coordination Agency.Institute of Developing Economies (1999) Asian International Input-Output Table 1990 , Tokyo: Institute of Developing Economies.