Embed Size (px)
Citation preview

STATISTICS DEPARTMENT. BANCO DE ESPAÑA
Session 1. Central Balance Sheet Data
New developments in Central Balance Sheet Data Office at Banco de España
Financial Information Forum (FIF). CEMLA/Banco Central de Chile
FIF III meeting. Santiago de Chile, 4-5 October 2017
Manuel Ortega
Head of Central Balance Sheet Data Office Division. Banco de España

2STATISTICS DEPARTMENT
GENERAL CONTENT
1. Banco de España´s CBSO (Central Balance Sheet Data Office): databases, products and
users
2. Recent remarkable developments:
1. Increase of microdata use at Banco de España
2. Use of CBSO in SNA 2008 implementation
3. SMEs risk assessment analysis using CBSO data
4. EBITDA: an harmonization effort using CBSO data
5. Adjustments to individual data due to intragroup operations
6. New tools to detect outliers in quarterly database

3STATISTICS DEPARTMENT
1. Databases, products and users
CBSO, main databases
Quaterly database Listed groups Unlisted groups
NUMBER OF COMPANIES / GROUPS (left scale)
COVERAGE: Gross value added at basic prices of the database w ith respect to non-financial companies total (right scale). In the case of consolidated accounts, the
numerator also includes the GVA generated by non-resident subsidiaries, w hat affects the reliability of this indicator.
"Central de Balances", databases, number of companies and coverage. Year 2017/2015
Individual accounts Consolidated accounts (groups)
Annual databases
8.991
865
114
1.128
45,2
29,1
16,1
13,0
21,4
16,5
0,0
10,0
20,0
30,0
40,0
50,0
0
2.000
4.000
6.000
8.000
10.000
2015 2015 2015 Q1 - Q1 2017 2016 2015
Direct survey (CBA)
Administrative source (Mercantile Registers) (CBB)
Direct survey (CBQ)
Stock exchange Commission
(CNMV)
Administrative source (Mercantile
Registers)
520.555529.546
Integrated Database
(CBI)

4STATISTICS DEPARTMENT
Aggregated data
Public web site, including:
– Annual CBSO report
– Sectoral aggregates
Grossing up (total population) MENF
Public enterprises aggregate and Central Government portfolio
Quarterly report
Statistical series (statistical bulletin)
Summary indicators of NFCs
Contribution to BACH database
Aggregated sectoral studies, on demand
Financial Soundness Indicators (FSI)
Statistical distributions
Contribution to BACH (RSE) database
Ratios of Spanish sectors of activity
Individual data:
Corporations reports
“CB on line”
Groups database (map of subsidiaries relations)
Users
General public (GP)
–GP
–GP, but especially Universities
NSI; Financial Accounts of Spanish Economy (FASE)
Internal use and FASE
Governing Council (Banco de España). Weeks later, GP and reporting companies
GP
Governing Council (Banco de España)
European Committee of Central Balance Sheet Data Offices
Banking Supervision and Regulation Departments; other departments of Directorate
General Economics, Statistics and Research
IMF and GP (Statistical bulletin)
GP / Credit institutions (risk assessment)
GP
Reporting companies. Banking Regulation and Supervision Departments; Financial Risk
Department (risk assessment in collateral list); other divisions of Directorate General
Economics, Statistics and Research (Balance of Payments)
Internal use at Banco de España
1. Databases, products and users
CBSO, products and users

5STATISTICS DEPARTMENT
Corporation demography
OCDE ScoreBoard on SMEs:
– Bankruptcies, total and SMEs
– Payment delays, B2B
FSI of the IMF:
– Total debt to equity
– Return on equity
– Earnings to interest and principal expenses
FSAP of the IMF: “analysis of vulnerabilities of private sector balance sheets and risks to the financial sector” with
Spanish microdata (info by size and sector of activity)
Key performance indicators in several statistical publications (Economic Indicators / Indicators for the Council /
Statistical Bulletin):
– Return of equity / Return on investment / Debt ratio / Financial cost / EBITDA
– Quarterly performance of large companies
ESA 2010 (SNA 2008) needs:
– Holdings (full set of accounts: current, capital and financial accounts, and balance)
– Stock options
– Pension fund schemes
1. Databases, products and users
CBSO, other products

6STATISTICS DEPARTMENT
GENERAL CONTENT
1. Banco de España´s CBSO (Central Balance Sheet Data Office): databases, products and
users
2. Recent remarkable developments:
1. Increase use of microdata at Banco de España
2. Use of CBSO in SNA 2008 implementation
3. SMEs risk assessment analysis using CBSO data
4. EBITDA: an harmonization effort using CBSO data
5. Adjustments to individual data due to intragroup operations
6. New tools to detect outliers in quarterly database

7STATISTICS DEPARTMENT
2.1. Recent remarkable developments: increase use of microdata (one
example)
“Internal funding has been key during the crisis and the recovery, buffering debt contraction” “The finance of corporate investment in Spain along the current recovery phase” Banco de España. Source INE (NA) /BdE (FASE)

8STATISTICS DEPARTMENT
-80
-60
-40
-20
0
20
40
60
80
40
30
20
10
0
10
20
30
40
2008 2009 2010 2011 2012 2013 2014 2015
% GVA
ASSETS AND LIABILITIES OF NFCs WITH NEGATIVE
NET INVESTMENT. FLOWS
%
Re
so
urc
es
Use
s
-28-27-26-25-24-23-22-21-20-19-18-17-16-15-14-13-12-11-10-9-8-7-6-5-4-3-2-10 GROSS FIXED CAPITAL FORMATION INTERNAL FUNDING (GROSS SAVINGS)
FINANCIAL DEBT NEW SHARES AND OTHER EQUITY
FINANCIAL ASSETS OTHER
FIRMS AS PERCENTAGE OF TOTAL (RHS)
-80
-60
-40
-20
0
20
40
60
80
-40
-30
-20
-10
0
10
20
30
40
2008 2009 2010 2011 2012 2013 2014 2015
% GVA
ASSETS AND LIABILITIES OF NFCs WITH POSITIVE OR
ZERO NET INVESTMENT. FLOWS
%
Re
so
urc
es
Use
s
“Aggregate deleveraging has been compatible with a significant share of investing firms raising their
indebtedness” “The finance of corporate investment in Spain along the current recovery phase” Banco de España. Source CBSO
2.1. Recent remarkable developments: increase use of microdata (one
example)
Microdata availability eases correct analysis of Financial Accounts

9STATISTICS DEPARTMENT
GENERAL CONTENT
1. Banco de España´s CBSO (Central Balance Sheet Data Office): databases, products and
users
2. Recent remarkable developments:
1. Increase use of microdata at Banco de España
2. Use of CBSO in SNA 2008 implementation
3. SMEs risk assessment analysis using CBSO data
4. EBITDA: an harmonization effort using CBSO data
5. Adjustments to individual data due to intragroup operations
6. New tools to detect outliers in quarterly database

10STATISTICS DEPARTMENT
1. Data available in CBSO has been used as direct source and source of contrast in FASE. Phases of the
project
1. Building intermediate system (from business accounting to FASE)
2. Grossing up the sample to the total population
3. Including adjustments to obtain market value of balance items
4. Final result: full set of accounts (Current / Accumulation / Balances)
2. Recently CBSO has been used to cover some SNA 2008 new needs:
• Stock options
• Pension funds schemes
• Holding companies data
2.2. Use of CBSO in SNA 2008 implementation
FASE (Financial Accounts of the Spanish
Economy)
To know more, go to the end of the power point (extra slides)

11STATISTICS DEPARTMENT
GENERAL CONTENT
1. Banco de España´s CBSO (Central Balance Sheet Data Office): databases, products and
users
2. Recent remarkable developments:
1. Increase use of microdata at Banco de España
2. Use of CBSO in SNA 2008 implementation
3. SMEs risk assessment analysis using CBSO data
4. EBITDA: an harmonization effort using CBSO data
5. Adjustments to individual data due to intragroup operations
6. New tools to detect outliers in quarterly database

12STATISTICS DEPARTMENT
• Law 5/2015 promoting SME financing
• How to promote financing to SMEs: easing access, increasing the
alternative methods of financing
• Easing access: reducing the information asymmetry gap
• To that end, the law obliges financial institutions to provide a financial
report on financial situation and payment track record to SMEs that will
see their credit facilities reduced. This is the “SME financial information”
report (“Información Financiera-PYME”)
• The Banco de España was obliged by this law to:
• Standardise this document
• Create a standardised methodology for the assessment of the
credit quality of an SME (also including sole proprietorships)
2.3. SMEs risk assessment analysis using CBSO data

13STATISTICS DEPARTMENT
• In June 2015 Banco de España published Circular 6/2016: harmonized
content of the report and of the risk assessment methodology
• Content of the “SME financial information” report: mainly, records with
the credit history of the company (Central Credit Register statements;
Information provided to private data compilators about solvency history;
movements over the last year in financial contracts; credit rating)
• The report has also to provide the relative position of the Company within its
sector of activity
• Harmonised risk assessment method. Taking into account these
variables:
• Financial situation of the debtor
• Qualitative variables (years of relationship, sector of activity, shareholder
experience...)
• Behavioural variables (default, payment delays, overdrafts...)
2.3. SMEs risk assessment analysis using CBSO data

14STATISTICS DEPARTMENT
Company data:
• Annual accounts officially deposited in Mercantile Registers (XBRL)
• 15 variables from Balance Sheet, 11 from profit and loss account
2.3. SMEs risk assessment analysis using CBSO data

15STATISTICS DEPARTMENT
NUMBER OF ANNUAL ACCOUNTS FILED
85% of companies
submit their annual
financial statements with
XBRL
Mercantile Registers receive every year thousands of annual accounts (XBRL
instance documents)
2.3. SMEs risk assessment analysis using CBSO data
16STATISTICS DEPARTMENT
Sector of activity and size of the Company: data
available in RSE database
Only using 9 ratios
2.3. SMEs risk assessment analysis using CBSO data

17STATISTICS DEPARTMENT
RSE (statistical distributions) database, created by Banco de España
and Mercantile Registers
This database provides information for the comparative analysis of individual corporations with aggregates of
non-financial corporations, using 29 ratios, with details by size (turnover), economic activity and country
2.3. SMEs risk assessment analysis using CBSO data

18STATISTICS DEPARTMENT
Company Data
Report
Sector Data
Instructions
XBRL Import
Clear ReportManual Filling
Clear ReportExcel Import
Final Report
2.3. SMEs risk assessment analysis using CBSO data
Excel/XBRL tool, free of charge
(www.bde.es)

19STATISTICS DEPARTMENT
Using 26 accounting concepts and 9 sectorial ratios, we see in a nutshell the financial situation of a company
within its sector of activity
2.3. SMEs risk assessment analysis using CBSO
data

20STATISTICS DEPARTMENT
1) Exclusion of anomalous microdata (“outliers”)
2) Confidentiality criteria (confidentiality)
3) Revision of Banque de France
Requirements (Banque de France
Requirements)
6) Concentration of the observations near the
quartiles (density of the sample)
4) Additional controls to censore nodes with
anomalous values (Box plot controls)
5) Representativeness of the provisional sample
(december of t+1) compared to the definitive one (june
of t+2) (homogeneity of provisional sample)
7) The coverage of the sample: Saving nodes
with a high coverage despite of its data
(Coverage)
New fears: statistics directly applied to risk assessment decision / Need for stability
2.3. SMEs risk assessment analysis using CBSO
data / Need of additional quality control processes

21STATISTICS DEPARTMENT
GENERAL CONTENT
1. Banco de España´s CBSO (Central Balance Sheet Data Office): databases, products and
users
2. Recent remarkable developments:
1. Increase use of microdata at Banco de España
2. Use of CBSO in SNA 2008 implementation
3. SMEs risk assessment analysis using CBSO data
4. EBITDA: an harmonization effort using CBSO data
5. Adjustments to individual data due to intragroup operations
6. New tools to detect outliers in quarterly database

22STATISTICS DEPARTMENT
2.4 EBITDA: an harmonization effort using CBSO data
Liquid modernity (Baumans´
theories): everything fast, short, “in
a nutshell”
There was once a life where human beings tried to show their deepest and inner value, providing
all kinds of details, to show why should somebody trust on them (i.e. love letters genre)
Detailed data vs KPI (key performance
indicators)

23STATISTICS DEPARTMENT
This applies also to financial reports, annual accounts
and studies of a company: “less is more”
2.4 EBITDA: an harmonization effort using CBSO data

24STATISTICS DEPARTMENT
• Financial statements: the benefit of the details
• Annual reports (including Annex and Management commentary): rich,
flexible and detailed information useful for all kind of advanced analysts
• The Company can describe and tell “his history and story” to show
users and investors “how they are” to convince to fund the Company
• KPI / APM: the benefit of summarized figures. Useful for all kind of
users (specialized investors and other, like custormers, employees). But only
if:
• Homogeneous definition (among companies and countries)
• Therefore, comparable (with other companies of the sector of activity)
• Does it make any sense to let companies to “fine tune” an APM definition?
Accounting information provides both options
2.4 EBITDA: an harmonization effort using CBSO
data / KPI vs detailed data

25STATISTICS DEPARTMENT
Manual Filling
XBRL Import
2.4 EBITDA: an harmonization effort using CBSO dataExcel/XBRL tool to compare a company
with its peers (see in www.aeca.es)

26STATISTICS DEPARTMENT
EBITDA: calculation with company data
AECA DEFINITION OF EBITDA:
Indirect approach: Adjustments to Total
Losses and profits
Fine tunning: non-
recurring income or
expenses,
accordingly to
Company opinion
2.4 EBITDA: an harmonization effort using CBSO
data

27STATISTICS DEPARTMENT
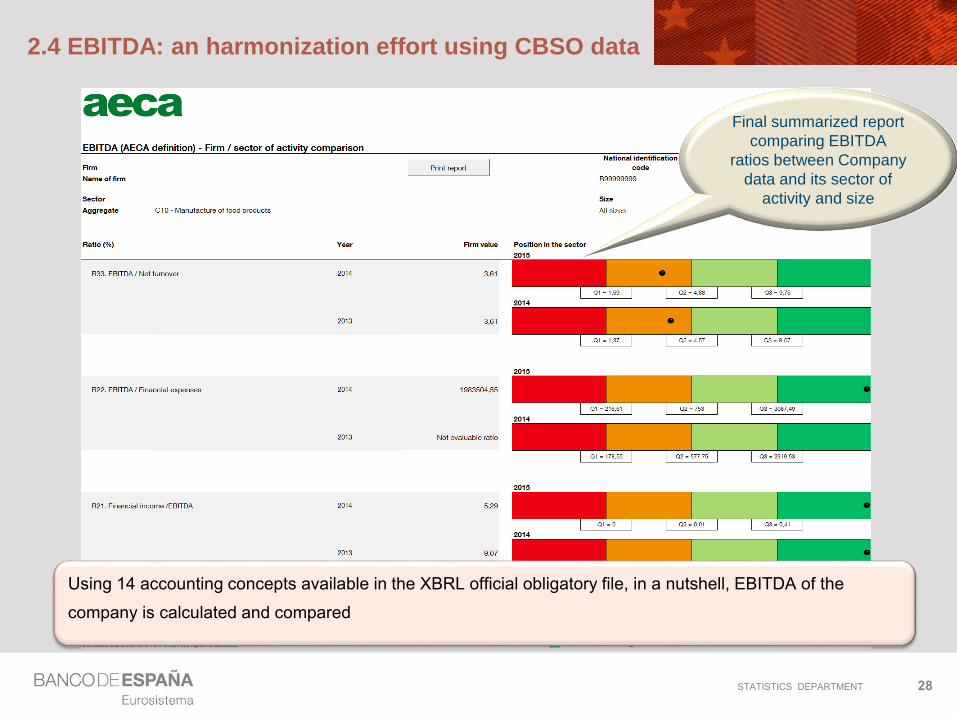
SECTOR DATA: Available in the Excel template, coming from BACH DATABASE (3 ratios)
Information from BACH database updated in January 2017
Selection of year
Selection of sector
Selection of size according to the amount of net turnover
Percentage (%)
Ratio Name of Ratio Number of firms Q1 Q2 Q3
Operating costs, earnings and profitability
R33/BACH EBITDA / Net turnover (2015) 3.883 1,69 4,88 9,76
R33/BACH EBITDA / Net turnover (2014) 3.824 1,37 4,57 9,07
R22/BACH EBITDA / Financial expenses (2015) 3.308 216,61 753,00 3.087,49
R22/BACH EBITDA / Financial expenses (2014) 3.252 178,55 577,75 2.319,53
R21/BACH Financial income / EBITDA (2015) 3.283 0,00 0,01 0,41
R21/BACH Financial income / EBITDA (2014) 3.149 0,00 0,02 0,68
Selection of comparative sector and size (BACH database 2014 - 2015)
Clear questionnaire
C10 - Manufacture of food products
All sizes
2015
2.4 EBITDA: an harmonization effort using CBSO data
28STATISTICS DEPARTMENT
Using 14 accounting concepts available in the XBRL official obligatory file, in a nutshell, EBITDA of the
company is calculated and compared
Final summarized report
comparing EBITDA
ratios between Company
data and its sector of
activity and size
2.4 EBITDA: an harmonization effort using CBSO data

29STATISTICS DEPARTMENT
GENERAL CONTENT
1. Banco de España´s CBSO (Central Balance Sheet Data Office): databases, products and
users
2. Recent remarkable developments:
1. Increase use of microdata at Banco de España
2. Use of CBSO in SNA 2008 implementation
3. SMEs risk assessment analysis using CBSO data
4. EBITDA: an harmonization effort using CBSO data
5. Adjustments to individual data due to intragroup operations
6. New tools to detect outliers in quarterly database

30STATISTICS DEPARTMENT
Individual accounts
• Essential for sector of activity analysis
• Inconvenient: Duplicity of certain
operations
• Solution in CBBE: Elimination adjustments
for main groups and certain operations
Consolidated accounts
• Essential for some kind of analysis: risk
analysis, financial positions (debt)
• Inconvenient:
• Perimeter changes
• Non resident activity
• Segmented information non
homogeneous
The importance of both data: Individual Accounts or Consolidated accounts?
2.5. Recent developments: intragroup adjustments
Individual versus consolidated accounts

31STATISTICS DEPARTMENT
Map of possible uses of accounting data
National accounts Monetary policy Bank supervision
Economic analysis Economic analysis Risk assessment trends structures
Research Other statistics Financial stability panel data
Individual accounts Aggregated Individual
Consolidated accounts Same scope Dif. scope
TruncatedSource: ERICA WG of ECCBSO
2.5. Recent developments: intragroup adjustments
Individual versus consolidated accounts

32STATISTICS DEPARTMENT
1. Since 1998 we keep record of intergroup relations:
30 Groups / 300 subsidiaries / 18.000 items of information
Several targets:
• correct analysis of aggregated figures (avoid double accounting)
• improve quality (new checking to balance figures)
• new information for analysts (financial links within group structure)
Items collected:
• Loans (credit/debit)
• Interest (expenses/incomes)
• Dividends (paid/received) / Superdividends
• Negative revaluation of the portfolio / losses in the subsidiaries
Indicators subject to consolidation (pseudo):
• Net ordinary profit / Net result / Debt ratio (Debt/GAV)
2. In 2016 we improved the quality of the system:
Individual counterpart, controlled in the uploading process
More details about portfolio value for future developments (ROE adjusted)
Needs and scope of the exercise
2.5. Recent developments: intragroup adjustments

33STATISTICS DEPARTMENT
New tool to improve the system
2.5. Recent developments: intragroup adjustments
New system allowing to capture details of subsidiary/partner at once
Figure (thousand euro)
COD_NINT_EMPRESA1 COD_CLAVE1 COD_NINT_EMPRESA2 COD_CLAVE2 COD_TIPO_CUESTIONARIO COD_PLAN_CONTABLE COD_EJERCICIO COD_TRIMESTRE IMPORTE FECHA_MODIFICACION
36251 813019 177979 811039 CBA 2007 2008 0 5533835 22/06/2016 13:46:27
36251 813029 177979 811049 CBA 2007 2008 0 5533835 22/06/2016 13:46:27
36251 81302 177979 81104 CBT 2007 2008 1 4610080 03/11/2016 15:25
36251 81301 177979 81103 CBT 2007 2008 1 4610080 03/11/2016 15:25
83575 81105 1711859 81303 CBA 2007 2008 0 4505614 27/06/2016 15:50:29
83575 81103 1711859 81301 CBA 2007 2008 0 4505614 27/06/2016 15:50:29
83575 81105 1711859 81303 CBT 2007 2008 4 4505614 07/11/2016 17:54
83575 81103 1711859 81301 CBT 2007 2008 4 4505614 07/11/2016 17:54
83575 81105 1711859 81303 CBT 2007 2008 1 4500000 07/11/2016 17:54
83575 81103 1711859 81301 CBT 2007 2008 1 4500000 07/11/2016 17:54
Corporation 1 Corporation 2
Accouting Item 1
Ie. Credit (asset)
Accouting Item 2
Ie. Debt (liability)
Date of the operation

34STATISTICS DEPARTMENT
Mixing data with groups structure database: map of financial relations
Some possible uses
2.5. Recent developments: intragroup adjustments

35STATISTICS DEPARTMENT
GENERAL CONTENT
1. Banco de España´s CBSO (Central Balance Sheet Data Office): databases, products and
users
2. Recent remarkable developments:
1. Increase use of microdata at Banco de España
2. Use of CBSO in SNA 2008 implementation
3. SMEs risk assessment analysis using CBSO data
4. EBITDA: an harmonization effort using CBSO data
5. Adjustments to individual data due to intragroup operations
6. New tools to detect outliers in quarterly database

36STATISTICS DEPARTMENT
1. “Demetra” / “Tramo-Seats” / “Terror” (module to detect outliers)
2. Since 2000 used for aggregated quality controls
3. Recently (2015), used for microdata checking:
1. Observed figure
2. ARIMA forecast obtained using Terror
3. “Tramo” qualify the outlier: “likely” / “possible” outlier
2.6. New tools to detect outliers in quaterly database
Nser series Title Date New Value Forecast Log(New Value) Log(Forecast) Difference Std Deviation T-Value Results dif valor abs 387 CANAL DE ISABEL II 03-2014 2.871 108.273 - - -105402,2 11038,68 -9,54845 Likely 105.402
1663 NAVANTIA, S_A_ 03-2014 176.324 81.866 12,08008 11,31284 0,7672361 0,1304431 5,88177 Likely 94.458
380 CALSONIC KANSEI SPAIN S_A_ 03-2014 29.897 7.224 10,30551 8,885186 1,420328 0,2530033 5,61387 Likely 22.673
1506 LIVE NATION ESPANA, SAU 03-2014 16.919 184 9,736193 5,214274 4,521918 0,7001137 6,458835 Likely 16.735
1381 INTERPARTNER ASSISTANCE SERV_ ESPANA,S_A03-2014 16.076 5.708 9,685083 8,649669 1,035413 0,2414655 4,288039 Possible 10.368
444 CEMENGAL SA 03-2014 74 8.234 4,304065 9,016034 -4,711969 0,9562404 -4,927599 Possible 8.160
1247 IBERDROLA GENERACION, S_A_U_ 03-2014 6.121 3.025 8,719409 8,014724 0,7046847 0,1552985 4,537615 Possible 3.095
575 COMUNIDAD DE PROPIETARIOS APARTOTEL MELI 03-2014 8.356 5.761 9,030735 8,658912 0,3718232 0,0885171 4,20058 Possible 2.595
1240 IBERDROLA DISTRIBUCION ELECTRICA, S_A_U_ 03-2014 854 474 6,749855 6,16185 0,5880053 0,120709 4,871262 Possible 380
1907 REPSOL TESORERIA Y GESTION FINANCIERA SA 03-2014 3.636 4.000 8,198639 8,294131 -0,095492 0,019079 -5,005062 Likely 364
2033 SERVICIO DE AGUAS Y SANEAMIENTO DE TERUE 03-2014 458 337 6,126869 5,821554 0,3053155 0,072308 4,222432 Possible 121
1092 GENERAL DE TERRENOS Y EDIFICIOS, S_ L_ 03-2014 2 117 0,6931472 4,765938 -4,072791 0,8210099 -4,960708 Possible 115

STATISTICS DEPARTMENT
THANK YOU FOR YOUR ATTENTION
MANUEL ORTEGA
38STATISTICS DEPARTMENT
2.2. Use of CBSO in SNA 2008 implementation
FASE (Financial Accounts of the Spanish
Economy)
More details in next slides

39STATISTICS DEPARTMENT
Intermediate system, from business accounting to NA:
- To obtain the full set of accounts and balances
- Adjustments from accounting value to a proxy of market value
Data are classified into a matrix according to:
- Legal form (public limited companies / private limited companies / cooperatives and similar / state-
owned companies)
- Size (9 categories)
- Sector of activity (37 categories)
Grossing up, from sample to population:
The matrix is grossed up to the total economy using an extrapolation factor for each cell ( ci), where:
ci
= workers DIRCE */ workers CBSO
Rare companies (outliers) excluded ahead of grossing-up
*DIRCE: INE (NSI) Central Directory of Firms.
2.2. SNA 2008 implementation: use of CBSO in FASE
Grossing-up of non financial corp (MENF project)FASE (Financial Accounts of the Spanish
Economy)

40STATISTICS DEPARTMENT
Use of CBSO data in FASE (SNA 2008)
Balance sheets Financial transactions
FA L FA L
Currency and deposits Currency (1) Currency (1)
Debt securities
Loans
LIsted shares
Unlisted shares (2)
Other equity (3) (3)
Mutual fund shares
Insurance, pension and standardised
guarantees
(4) (4)
Financial derivatives and stock
options
(4)
Trade credits (5) (5) (5) (5)
Other accounts receivable
2.2. SNA 2008 implementation: use of CBSO in FASE
Grossing-up of non financial corp (MENF project)FASE (Financial Accounts of the Spanish
Economy)

41STATISTICS DEPARTMENT
Partial integration of data, mainly by ratios
(no direct integration of aggregated figures)
– [1] Currency: cash ratio (currency/transferable deposits)
– [2] Unquoted shares issued by NFCs
Market value = ONR (Profits)/[r (Discount rate) +3%]
r = IRR from stock market
3% = illiquidity premium
– [3] Shares held by general government (State portfolio in NFCs)
Book value or market value (for public liability companies)
– [4] Pension entitlements / Stock options
Accounting data provided by companies (actuarial calculations)
– [5] Trade credits (aim: to maintain same structure of balance sheet)
R1 = suppliers / MFI loans
R2 = clients / suppliers
Information on commercial paper discounted at MFIs
Ratio loans granted / received from RoW
2.2. SNA 2008 implementation: use of CBSO in FASE
Grossing-up of non financial corp (MENF project)FASE (Financial Accounts of the Spanish
Economy)

42STATISTICS DEPARTMENT
1. Data available in business accounting:
• Theoretically the following information is available:
1. IFRS 2, for listed groups
2. Valuation rule 17, in Spanish GAAP
• In 2014, 29 companies (individual) reported to CBSO that they had stock option plans for their staff
(Yes/No)
2. But the reality is different:
• Later special survey for details on these 29 companies, some said “No” where the said “yes” before
• Lack of harmonisation. Example of 15 listed groups, whose data have to be provided in their Annex; some
results:
1. Lack of harmonisation in definition of plans (who will provide the shares?): parent company shares /
subsidiaries (Spanish or foreign)
2. Lack of harmonisation in information disclosed: compensation to employees well declared; difficult
to distinguish between financial transactions and revaluation
• Anyway, information received since 2015 has improved its quality
2.2. Other uses of CBSO in FASE:
SNA 2008, Stock Options at NFCsFASE (Financial Accounts of the Spanish
Economy)

43STATISTICS DEPARTMENT
2.2. Other uses of CBSO in FASE:
SNA 2008, Holding Companies in Spain
1. We follow the decisions taken by the Task Force on Holding Companies, Head Offices and similar
entities (June 2013), in brief:
1. To be an institutional unit (independence), and signs (obtained by CBSO):
1. More than 1 owner
2. In all cases when the owner is “Rest of the world” (non-resident units)
2. Declaring itself to be a holding company (NACE 6420) and having more than 50% of its assets in shares
and other equity, and less than 3 employees (0,1 or 2)
3. Not having significant turnover
2. Some figures:
1. Number of corporations changed from NFCs to Financial institutions: 370
2. Balance sheet data transferred (% of GVA)
1. Total liabilities (18%)
2. Loans (3%)
3. Shares and other equity (15%)
FASE (Financial Accounts of the Spanish
Economy)
44STATISTICS DEPARTMENT
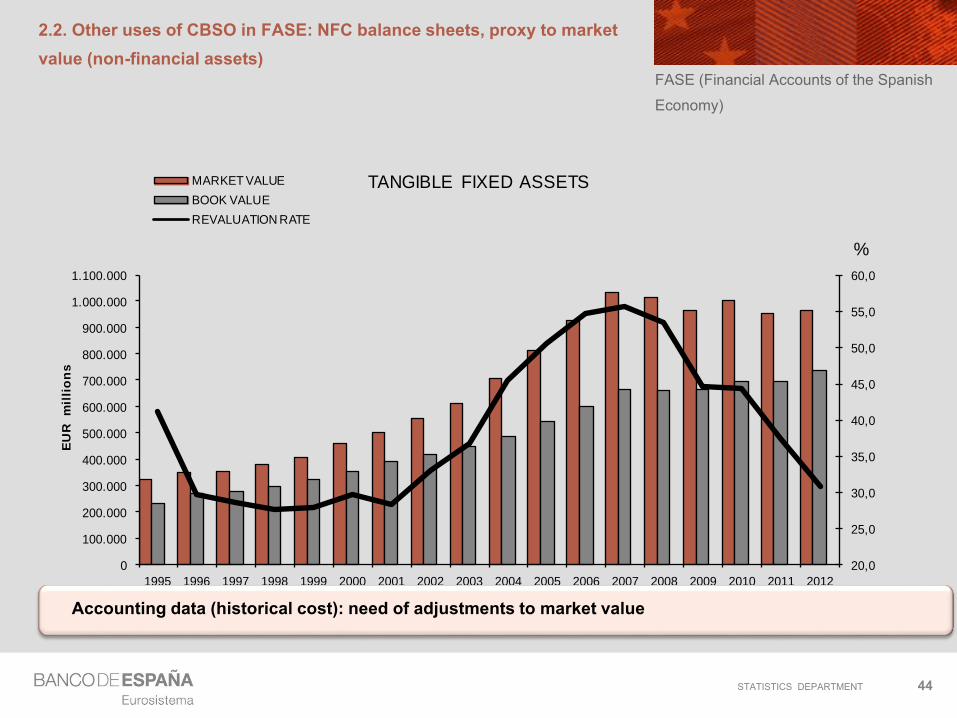
2.2. Other uses of CBSO in FASE: NFC balance sheets, proxy to market
value (non-financial assets)
20,0
25,0
30,0
35,0
40,0
45,0
50,0
55,0
60,0
0
100.000
200.000
300.000
400.000
500.000
600.000
700.000
800.000
900.000
1.000.000
1.100.000
1995 1996 1997 1998 1999 2000 2001 2002 2003 2004 2005 2006 2007 2008 2009 2010 2011 2012
EU
R m
illi
on
s
MARKET VALUE
BOOK VALUE
REVALUATION RATE%
TANGIBLE FIXED ASSETS
%
FASE (Financial Accounts of the Spanish
Economy)
Accounting data (historical cost): need of adjustments to market value