Embed Size (px)
Citation preview
Research, Applied Analytics,
and Statistics
Session 1. Interventions: Influencing Taxpayer Compliance
Moderator: Brenda Schafer
IRS, RAAS, Office of Research
Taxpayer Responses to Third-Party Income
Reporting: Evidence from a Natural
Experiment in the Taxicab Industry
Bibek Adhikari
Illinois State University
Do Audits Deter Future Noncompliance?
Evidence on Self-Employed Taxpayers
Erich Kirchler
University of Vienna, Austria
Impact of Fresh Start Initiative on Lien
Filings and Taxpayer Compliance
Alex Turk
IRS, SB/SE
Discussant: Alan Plumley
IRS, RAAS

Taxpayer Responses to Third-Party Income Reporting: Evidence from a Natural Experiment in the Taxicab Industry
Bibek Adhikari, Illinois State University
James Alm, Tulane University
Brett Collins, Internal Revenue Service
Michael Sebastiani, Internal Revenue Service
Eleanor Wilking, University of Michigan
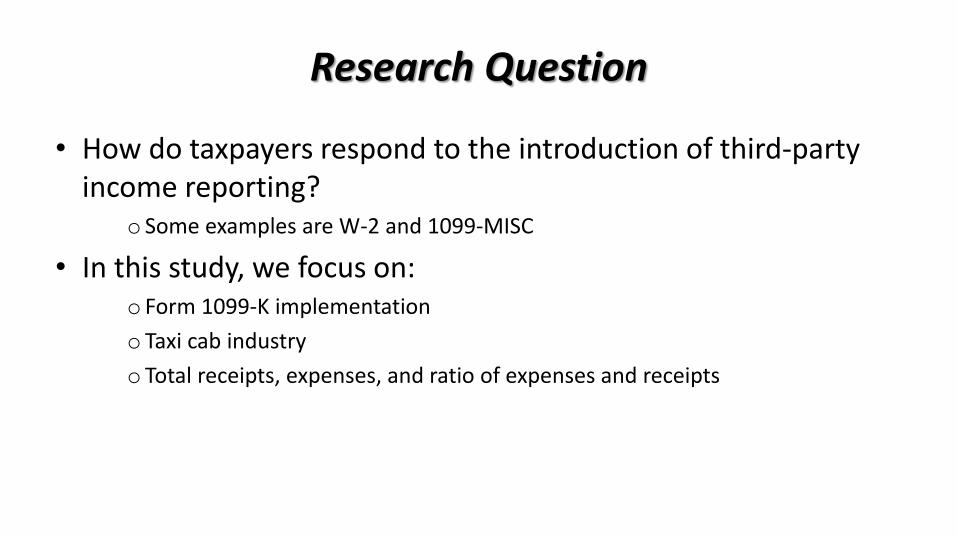
Research Question
• How do taxpayers respond to the introduction of third-party income reporting?
o Some examples are W-2 and 1099-MISC
• In this study, we focus on: o Form 1099-K implementation
o Taxi cab industry
o Total receipts, expenses, and ratio of expenses and receipts

The Context of 1099-K
• Percentage of income properly reported and taxed (IRS, 2012) o Wages and Salary = 99%
o Business income not subject to third-party reporting = 44%
• New third-party reporting law (1099-K): Electronic payment companies such as credit card, debit card, PayPal are required to report revenue that businesses receive through such electronic payment system
• Business income (except for cash receipts) are third-party reported
• However, expenses are still not third-party reported
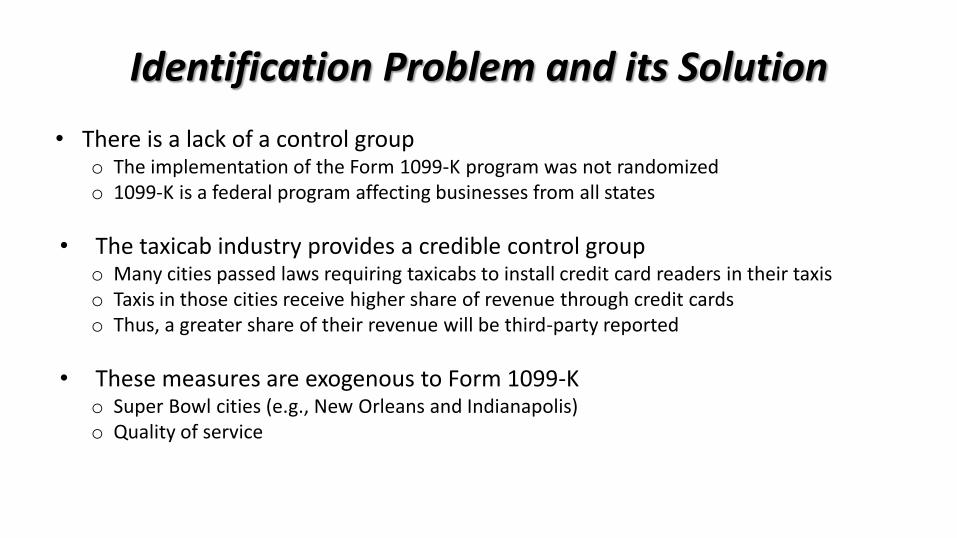
Identification Problem and its Solution
• There is a lack of a control group o The implementation of the Form 1099-K program was not randomized o 1099-K is a federal program affecting businesses from all states
• The taxicab industry provides a credible control group o Many cities passed laws requiring taxicabs to install credit card readers in their taxis o Taxis in those cities receive higher share of revenue through credit cards o Thus, a greater share of their revenue will be third-party reported
• These measures are exogenous to Form 1099-K o Super Bowl cities (e.g., New Orleans and Indianapolis) o Quality of service
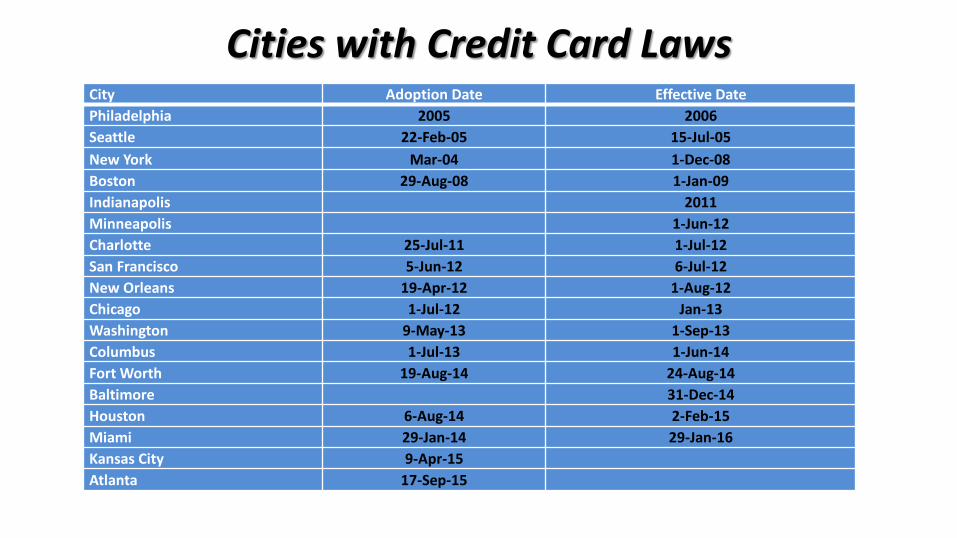
Cities with Credit Card Laws City Adoption Date Effective Date
Philadelphia 2005 2006
Seattle 22-Feb-05 15-Jul-05
New York Mar-04 1-Dec-08
Boston 29-Aug-08 1-Jan-09
Indianapolis 2011
Minneapolis 1-Jun-12
Charlotte 25-Jul-11 1-Jul-12
San Francisco 5-Jun-12 6-Jul-12
New Orleans 19-Apr-12 1-Aug-12
Chicago 1-Jul-12 Jan-13
Washington 9-May-13 1-Sep-13
Columbus 1-Jul-13 1-Jun-14
Fort Worth 19-Aug-14 24-Aug-14
Baltimore 31-Dec-14
Houston 6-Aug-14 2-Feb-15
Miami 29-Jan-14 29-Jan-16
Kansas City 9-Apr-15
Atlanta 17-Sep-15
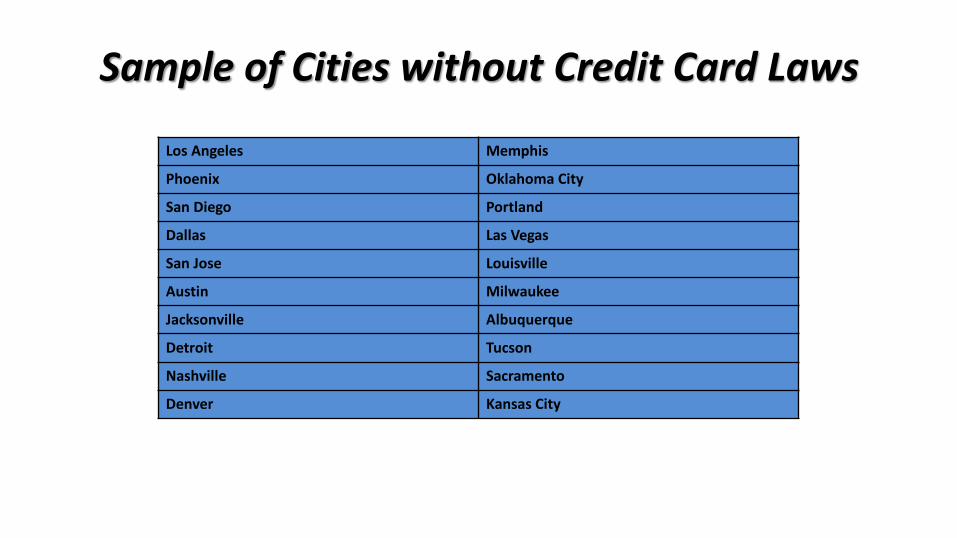
Sample of Cities without Credit Card Laws
Los Angeles Memphis
Phoenix Oklahoma City
San Diego Portland
Dallas Las Vegas
San Jose Louisville
Austin Milwaukee
Jacksonville Albuquerque
Detroit Tucson
Nashville Sacramento
Denver Kansas City

Empirical Strategy
• Difference-in-Differences research design
• Treatment = Post-1099K and Post-Credit Card Law
• Treated Group = Taxicabs in cities with mandatory credit card reader laws after 2011
• Control Group = Taxicabs in other cities or before 2011
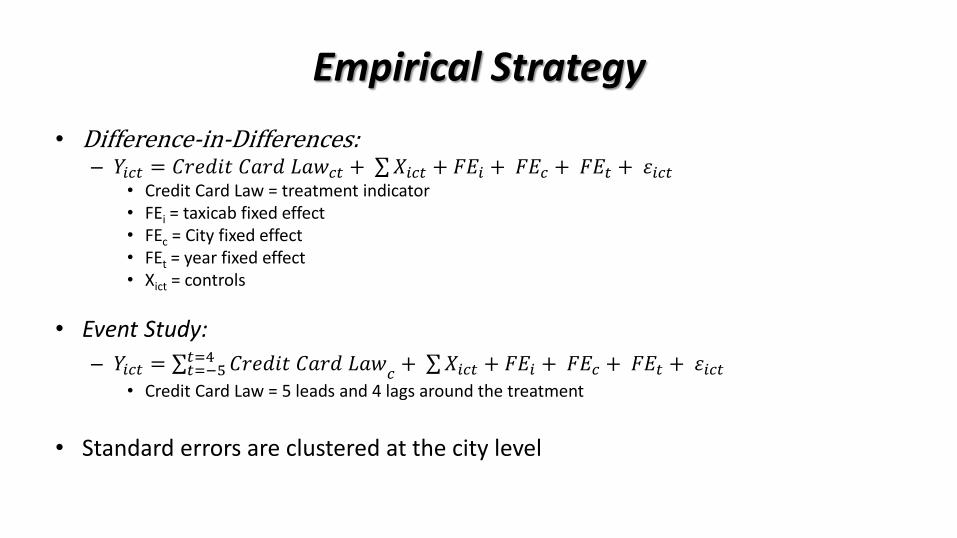
Empirical Strategy
• Difference-in-Differences: – 𝑌𝑖𝑐𝑡 = 𝐶𝑟𝑒𝑑𝑖𝑡 𝐶𝑎𝑟𝑑 𝐿𝑎𝑤𝑐𝑡 + 𝑋𝑖𝑐𝑡 + 𝐹𝐸𝑖 + 𝐹𝐸𝑐 + 𝐹𝐸𝑡 + 𝜀𝑖𝑐𝑡
• Credit Card Law = treatment indicator • FEi = taxicab fixed effect • FEc = City fixed effect • FEt = year fixed effect • Xict = controls
• Event Study:
– 𝑌𝑖𝑐𝑡 = 𝐶𝑟𝑒𝑑𝑖𝑡 𝐶𝑎𝑟𝑑 𝐿𝑎𝑤𝑡=4𝑡=−5 𝑐
+ 𝑋𝑖𝑐𝑡 + 𝐹𝐸𝑖 + 𝐹𝐸𝑐 + 𝐹𝐸𝑡 + 𝜀𝑖𝑐𝑡 • Credit Card Law = 5 leads and 4 lags around the treatment
• Standard errors are clustered at the city level
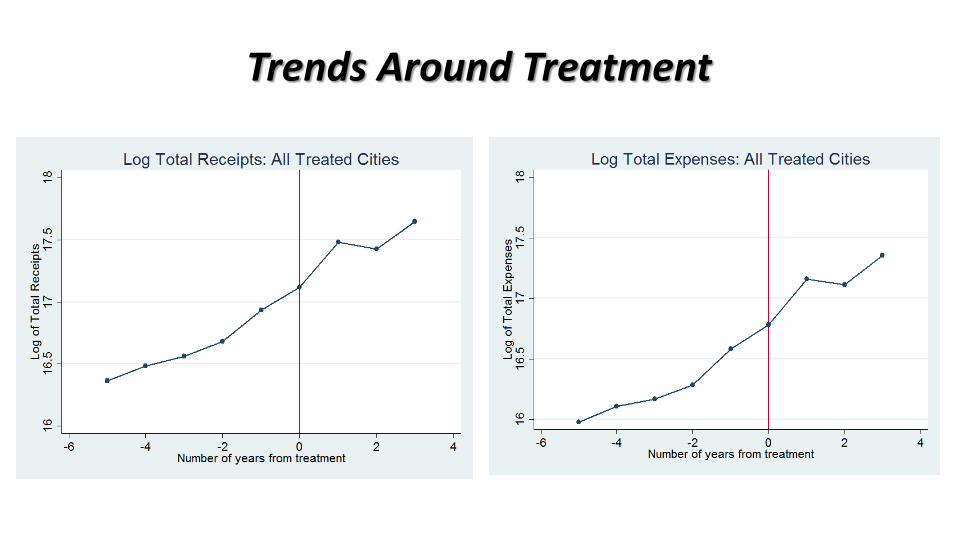
Trends Around Treatment
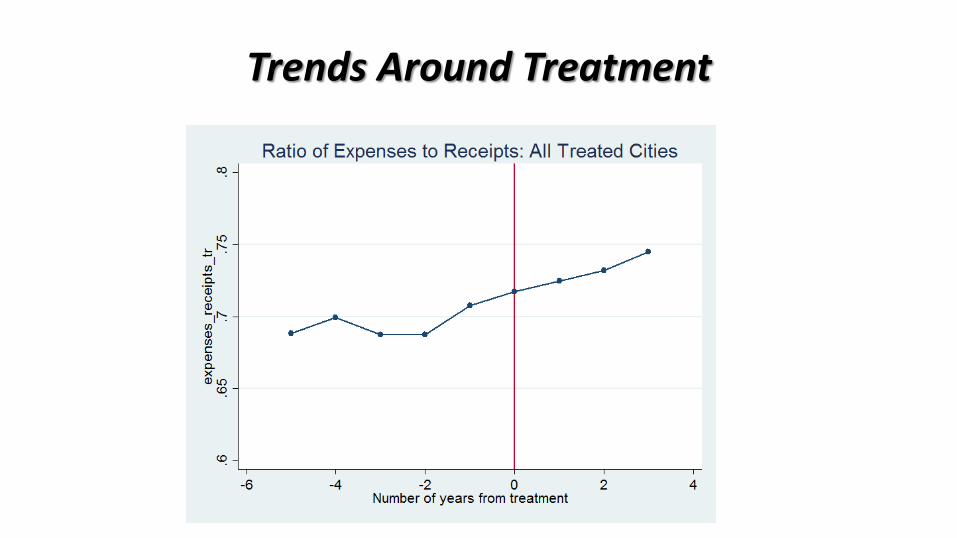
Trends Around Treatment

Difference-in-Differences Results
Outcome Variable Coefficient t-Statistics P-Value
Log Total Receipts 0.22 5.21 0.00
Log Total Expenses 0.25 5.05 0.00
Expenses/Receipts 0.02 2.12 0.04
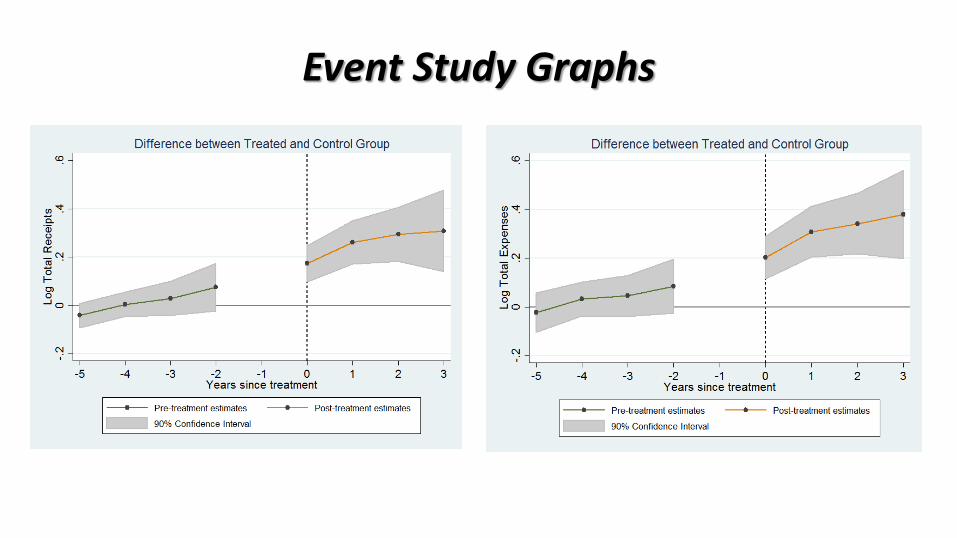
Event Study Graphs

Event Study Graph

Conclusions
• Results are still preliminary
• Firms report more revenue after the introduction of Form 1099-K
• The increase in reported revenue was accompanied by offsetting increases in expenses
• So: taxpayers respond to information reporting but in offsetting ways

Sebastian Beer1, Matthias Kasper1, Erich Kirchler1 & Brian Erard2
1University of Vienna, Austria 2B. Erard & Associates, Reston, VA, USA
IRS-TPC Research Conference
Washington, 2016
Do Audits Deter Future Non-compliance?
Evidence on Self-Employed Taxpayers
http://www.taxpayeradvocate.irs.gov/Media/Default/Documents/2015ARC/ ARC15_Volume2_3-AuditImpact.pdf
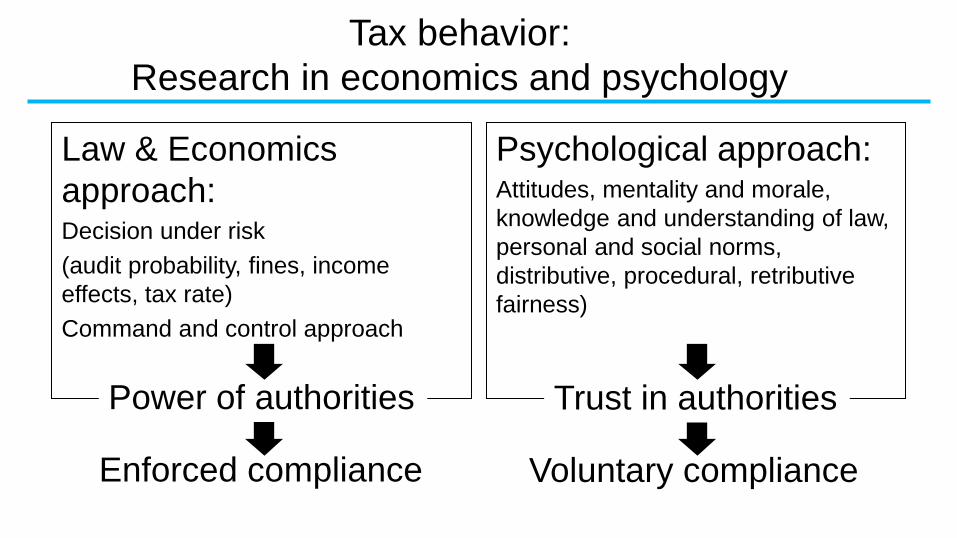
Law & Economics
approach: Decision under risk
(audit probability, fines, income
effects, tax rate)
Command and control approach
Psychological approach: Attitudes, mentality and morale,
knowledge and understanding of law,
personal and social norms,
distributive, procedural, retributive
fairness)
Power of authorities Trust in authorities
Enforced compliance Voluntary compliance
Tax behavior:
Research in economics and psychology

Introduction
• IRS audits 1.5% of self-employed taxpayers
annually (IRS, 2015)
• Direct/mechanical revenue effect: > $3bn
additional assessments
• Little knowledge about indirect effects: audit
experience might impact on subsequent
reporting behavior
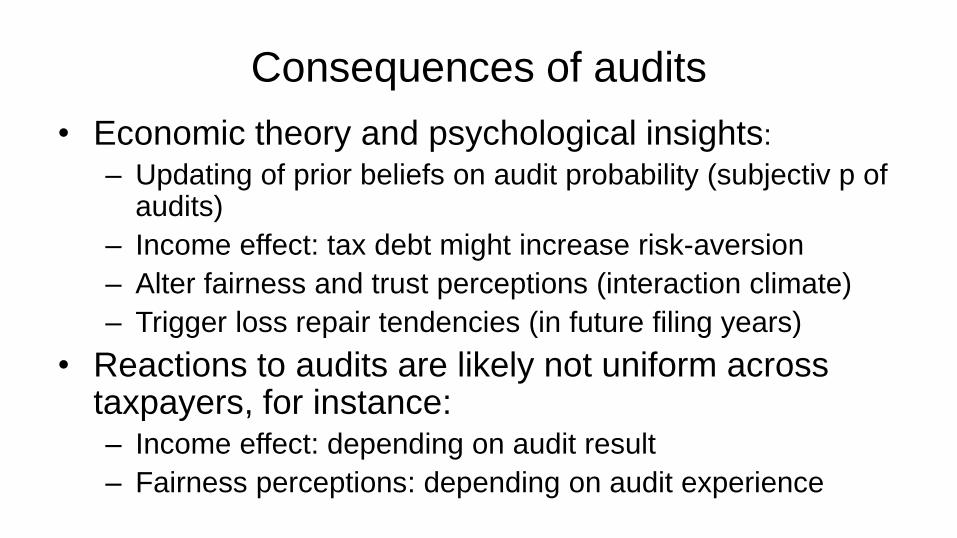
Consequences of audits
• Economic theory and psychological insights:
– Updating of prior beliefs on audit probability (subjectiv p of audits)
– Income effect: tax debt might increase risk-aversion
– Alter fairness and trust perceptions (interaction climate)
– Trigger loss repair tendencies (in future filing years)
• Reactions to audits are likely not uniform across taxpayers, for instance: – Income effect: depending on audit result
– Fairness perceptions: depending on audit experience
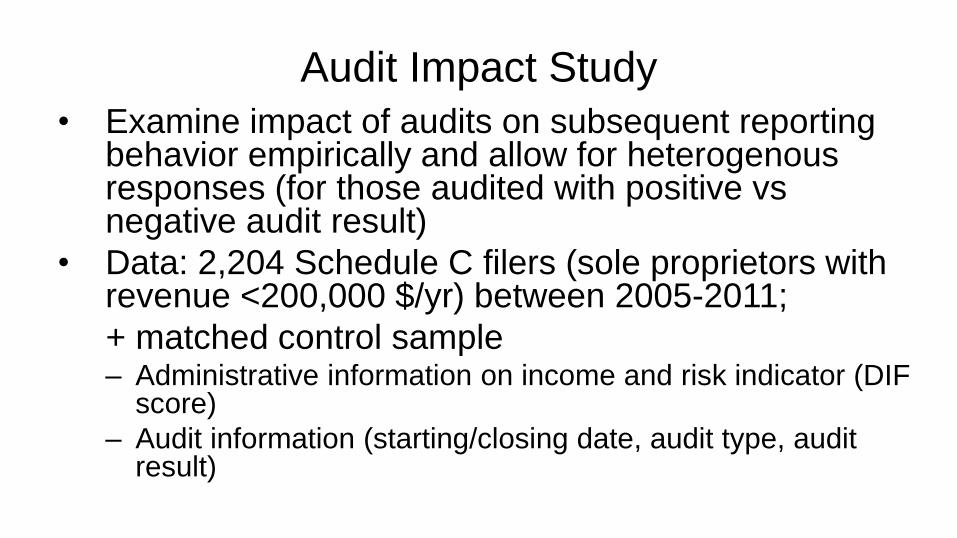
Audit Impact Study
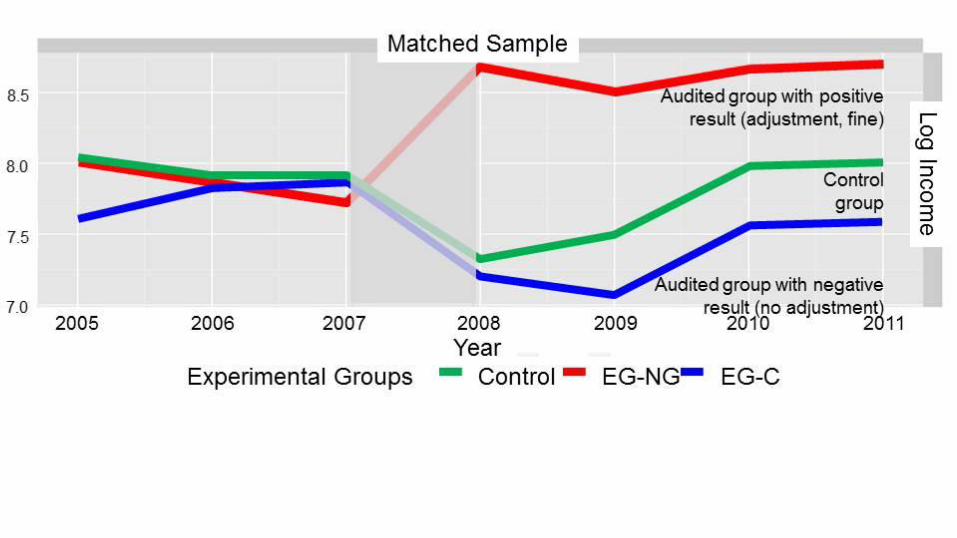
• Examine impact of audits on subsequent reporting behavior empirically and allow for heterogenous responses (for those audited with positive vs negative audit result)
• Data: 2,204 Schedule C filers (sole proprietors with revenue <200,000 $/yr) between 2005-2011;
+ matched control sample – Administrative information on income and risk indicator (DIF
score)
– Audit information (starting/closing date, audit type, audit result)
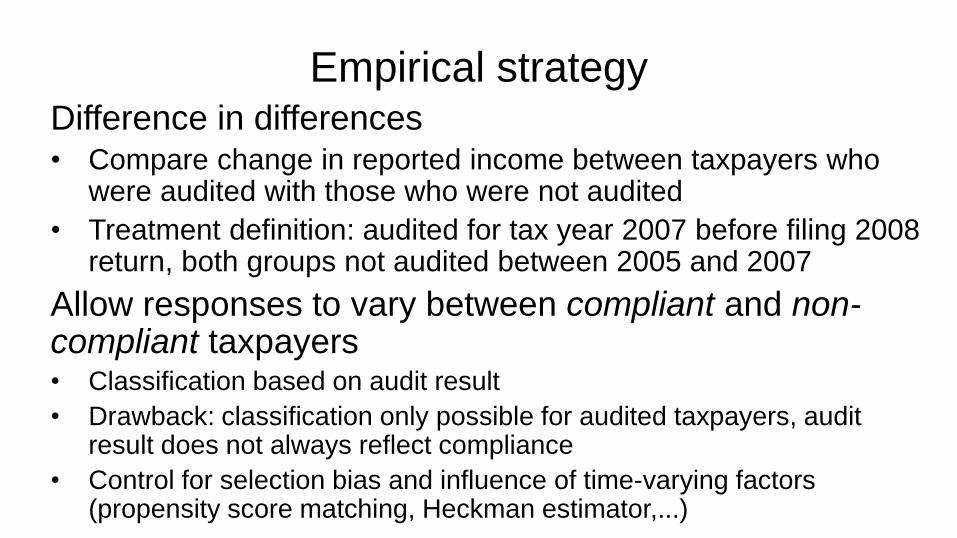
Empirical strategy Difference in differences • Compare change in reported income between taxpayers who
were audited with those who were not audited
• Treatment definition: audited for tax year 2007 before filing 2008 return, both groups not audited between 2005 and 2007
Allow responses to vary between compliant and non-compliant taxpayers • Classification based on audit result
• Drawback: classification only possible for audited taxpayers, audit result does not always reflect compliance
• Control for selection bias and influence of time-varying factors (propensity score matching, Heckman estimator,...)
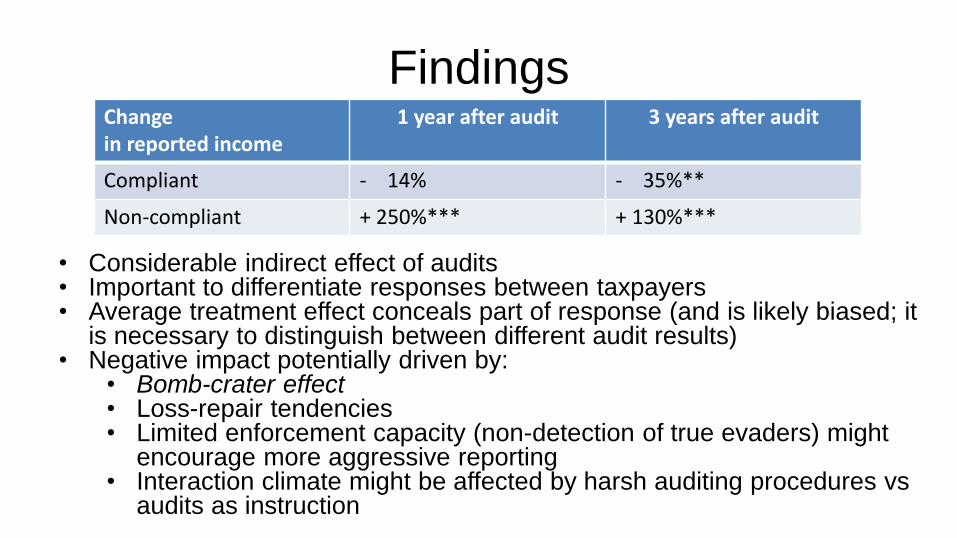
Findings Change in reported income
1 year after audit 3 years after audit
Compliant - 14% - 35%**
Non-compliant + 250%*** + 130%***
• Considerable indirect effect of audits • Important to differentiate responses between taxpayers • Average treatment effect conceals part of response (and is likely biased; it
is necessary to distinguish between different audit results) • Negative impact potentially driven by:
• Bomb-crater effect • Loss-repair tendencies • Limited enforcement capacity (non-detection of true evaders) might
encourage more aggressive reporting • Interaction climate might be affected by harsh auditing procedures vs
audits as instruction
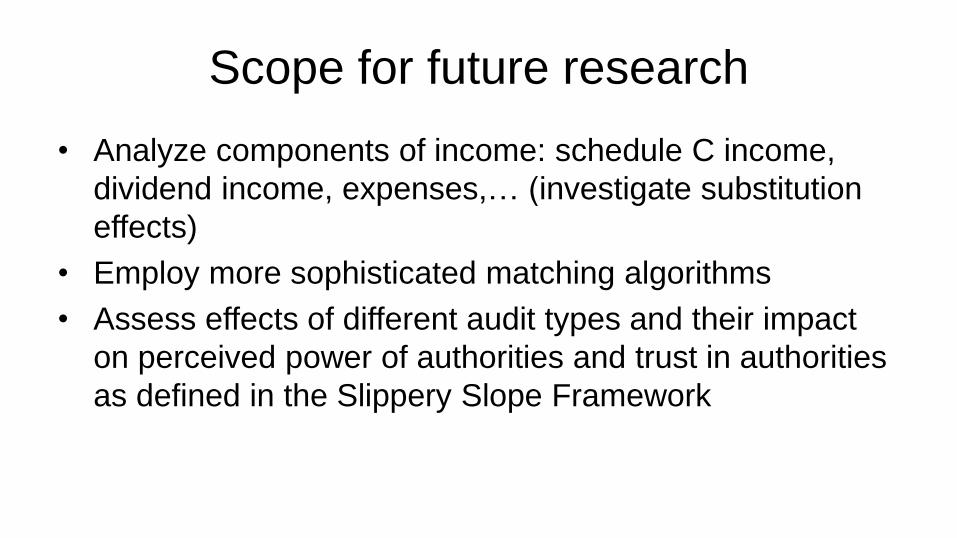
Scope for future research
• Analyze components of income: schedule C income,
dividend income, expenses,… (investigate substitution
effects)
• Employ more sophisticated matching algorithms
• Assess effects of different audit types and their impact
on perceived power of authorities and trust in authorities
as defined in the Slippery Slope Framework

Command and control …
Audits and fines …
are a simple answer to a complex phenomenon!
For every complex problem there is an answer that is clear, simple, and wrong. Henry Louis Mencken (12 September 1880-29 January 1956), was a twentieth-century journalist, satirist, social critic, cynic, and freethinker, known as the "Sage of Baltimore" and the "American Nietzsche”.
SAM: Strategic Analysis and Modeling
CIDS: Collection Inventory Selection and Delivery
Small Business Self Employed
Internal Revenue Service
Resolving Unpaid Taxes and the Notice of Federal Tax Lien:
Evidence from the Fresh Start Initiative
June 23, 2016
IRS Research Conference
Alex Turk, Supervisory Economist
Stacy Orlett, Operations Research Analyst
John Iuranich, Operations Research Analyst
Saurabh Datta, Operations Research Analyst
DISCLAIMER: The views and opinions presented in this presentation reflect those of the authors. They do not necessarily reflect the views
or the official position of the Internal Revenue Service.
Presentation Outline Background
NFTLs & Unpaid Assessments
Previous Research
Methodology Data Construction
Model Specifications
Results Estimates of NFTL Marginal Effects
Illustration of impact of not filing the NFTL
Conclusions and Direction for Future Research
DISCLAIMER: The views and opinions presented in this presentation reflect those of the authors. They do not necessarily reflect the
views or the official position of the Internal Revenue Service.

Overview of the Collection Process for Unpaid
Assessment
Final Notice 1st Notice
ACS
Field
Collection
Queue
Other
DISCLAIMER: The views and opinions presented in this presentation reflect those of the authors. They do not necessarily reflect the
views or the official position of the Internal Revenue Service.
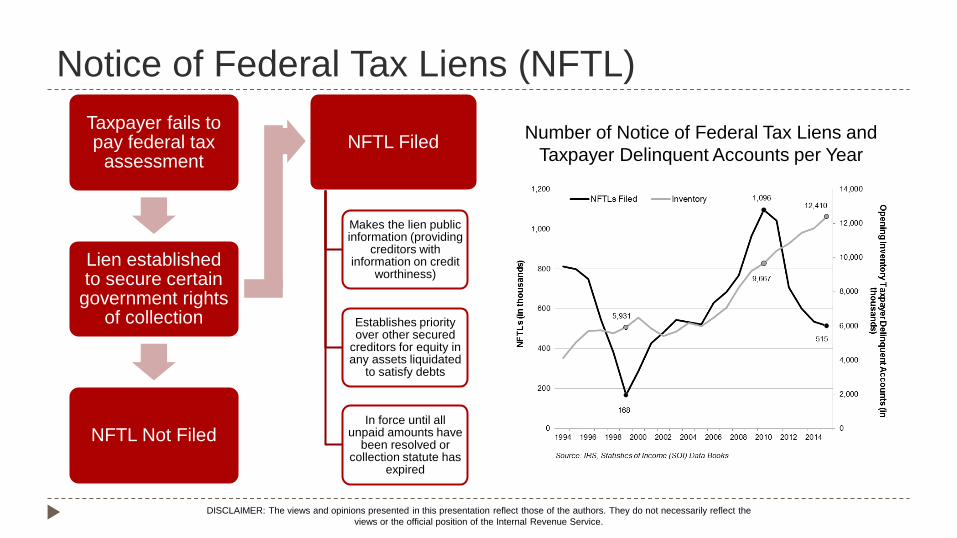
Notice of Federal Tax Liens (NFTL)
Taxpayer fails to pay federal tax
assessment
Lien established to secure certain
government rights of collection
NFTL Not Filed
NFTL Filed
Makes the lien public information (providing
creditors with information on credit
worthiness)
Establishes priority over other secured
creditors for equity in any assets liquidated
to satisfy debts
In force until all unpaid amounts have
been resolved or collection statute has
expired
Number of Notice of Federal Tax Liens and
Taxpayer Delinquent Accounts per Year
DISCLAIMER: The views and opinions presented in this presentation reflect those of the authors. They do not necessarily reflect the
views or the official position of the Internal Revenue Service.
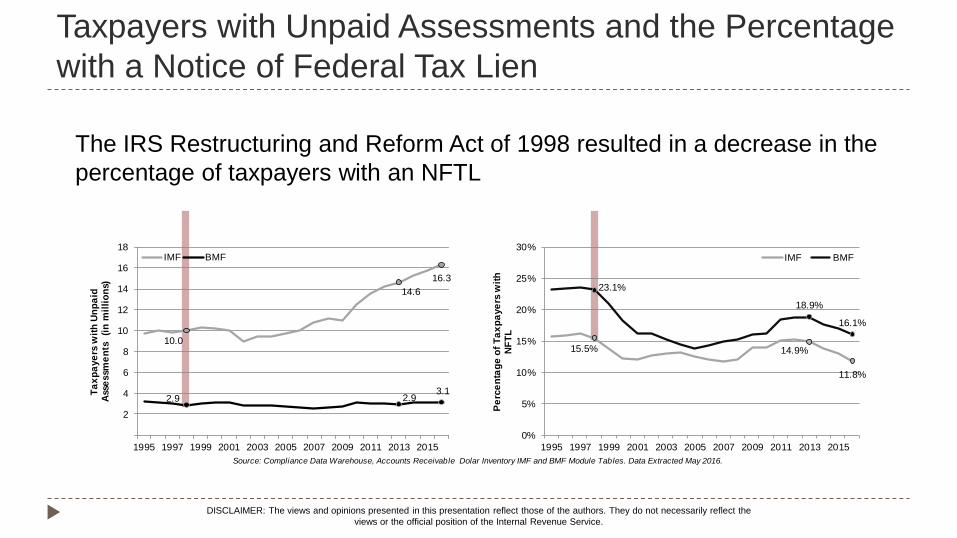
Taxpayers with Unpaid Assessments and the Percentage
with a Notice of Federal Tax Lien
The IRS Restructuring and Reform Act of 1998 resulted in a decrease in the
percentage of taxpayers with an NFTL
DISCLAIMER: The views and opinions presented in this presentation reflect those of the authors. They do not necessarily reflect the
views or the official position of the Internal Revenue Service.
Source: Compliance Data Warehouse, Accounts Receivable Dolar Inventory IMF and BMF Module Tables. Data Extracted May 2016.
10.0
14.6
16.3
2.9 2.93.1
2
4
6
8
10
12
14
16
18
1995 1997 1999 2001 2003 2005 2007 2009 2011 2013 2015
Ta
xp
aye
rs w
ith
Un
pa
id
Ass
essm
en
ts
(in
mil
lio
ns)
IMF BMF
15.5% 14.9%
11.8%
23.1%
18.9%
16.1%
0%
5%
10%
15%
20%
25%
30%
1995 1997 1999 2001 2003 2005 2007 2009 2011 2013 2015
Pe
rce
nta
ge
of
Ta
xp
aye
rs w
ith
N
FT
L
IMF BMF
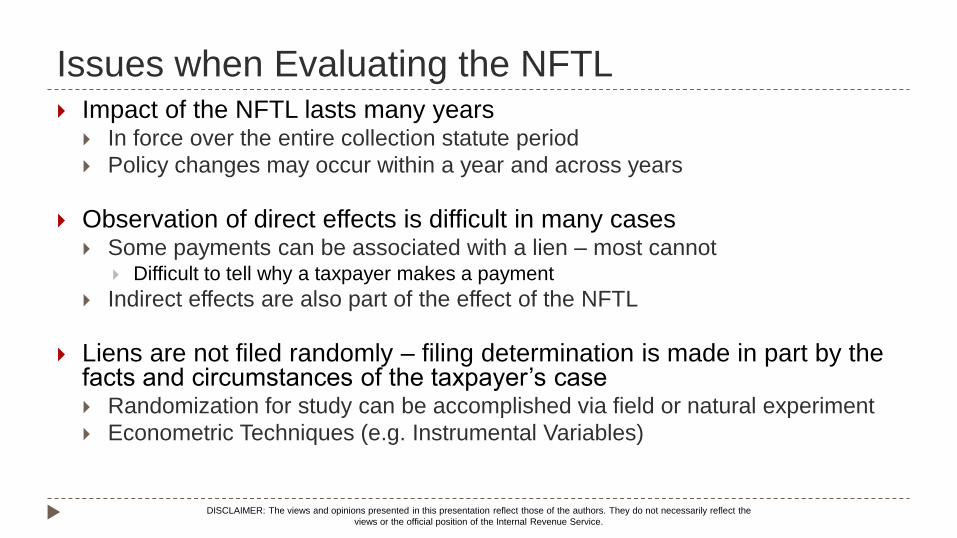
Issues when Evaluating the NFTL Impact of the NFTL lasts many years
In force over the entire collection statute period
Policy changes may occur within a year and across years
Observation of direct effects is difficult in many cases Some payments can be associated with a lien – most cannot
Difficult to tell why a taxpayer makes a payment
Indirect effects are also part of the effect of the NFTL
Liens are not filed randomly – filing determination is made in part by the facts and circumstances of the taxpayer’s case Randomization for study can be accomplished via field or natural experiment
Econometric Techniques (e.g. Instrumental Variables)
DISCLAIMER: The views and opinions presented in this presentation reflect those of the authors. They do not necessarily reflect the
views or the official position of the Internal Revenue Service.

“Fresh Start” Provides a “Natural Experiment”
March
2011
September
2011
September
2010
September
2013
Period of transfers
for cases examined
“Fresh Start” changes (February 2011-March 2011) Threshold for NFTL determinations increased from $5,000 to $10,000
Threshold for NFTL filing increased for cases systemically transferred from the IRS’s Automated Collection System to the Field Collection Queue
Cases transferred six months before and after “Fresh Start” change used as “natural experiment”
Compare cohorts of cases with unpaid balances within the policy change parameters
Model the likelihood the taxpayer will fully or partially resolve their unpaid balances and the expected change in the unpaid balance
Used outcome data for two years after the transfer of a case
DISCLAIMER: The views and opinions presented in this presentation reflect those of the authors. They do not necessarily reflect the
views or the official position of the Internal Revenue Service.
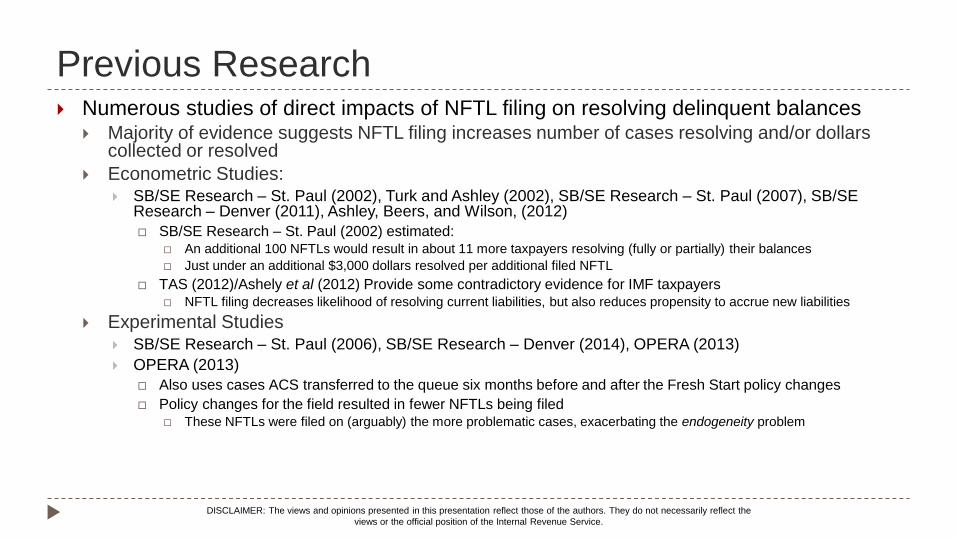
Previous Research Numerous studies of direct impacts of NFTL filing on resolving delinquent balances
Majority of evidence suggests NFTL filing increases number of cases resolving and/or dollars collected or resolved
Econometric Studies: SB/SE Research – St. Paul (2002), Turk and Ashley (2002), SB/SE Research – St. Paul (2007), SB/SE
Research – Denver (2011), Ashley, Beers, and Wilson, (2012)
SB/SE Research – St. Paul (2002) estimated: An additional 100 NFTLs would result in about 11 more taxpayers resolving (fully or partially) their balances
Just under an additional $3,000 dollars resolved per additional filed NFTL
TAS (2012)/Ashely et al (2012) Provide some contradictory evidence for IMF taxpayers NFTL filing decreases likelihood of resolving current liabilities, but also reduces propensity to accrue new liabilities
Experimental Studies SB/SE Research – St. Paul (2006), SB/SE Research – Denver (2014), OPERA (2013)
OPERA (2013)
Also uses cases ACS transferred to the queue six months before and after the Fresh Start policy changes
Policy changes for the field resulted in fewer NFTLs being filed These NFTLs were filed on (arguably) the more problematic cases, exacerbating the endogeneity problem
DISCLAIMER: The views and opinions presented in this presentation reflect those of the authors. They do not necessarily reflect the
views or the official position of the Internal Revenue Service.

Previous Research
Impact on Payment Compliance Behavior
SB/SE Research (2002) (arguably) captures indirect effects
Indirect effect hard to identify: area of opportunity for further research
Impact on the Taxpayer
OPERA (2014) contracted with Experian
Experian Advantage score dropped by less than 5 points on average
Larger impact on taxpayers in sub-prime range who have very little access to credit
40% of NFTL filings did not appear on credit report within 90 days
TAS (2011)
NFTL associated with 5.2% to 7.9% decline in income
Unclear if annual or aggregate, likely initial negative impact on income
Could be coincidental to filing, not a result of filing
DISCLAIMER: The views and opinions presented in this presentation reflect those of the authors. They do not necessarily reflect the
views or the official position of the Internal Revenue Service.
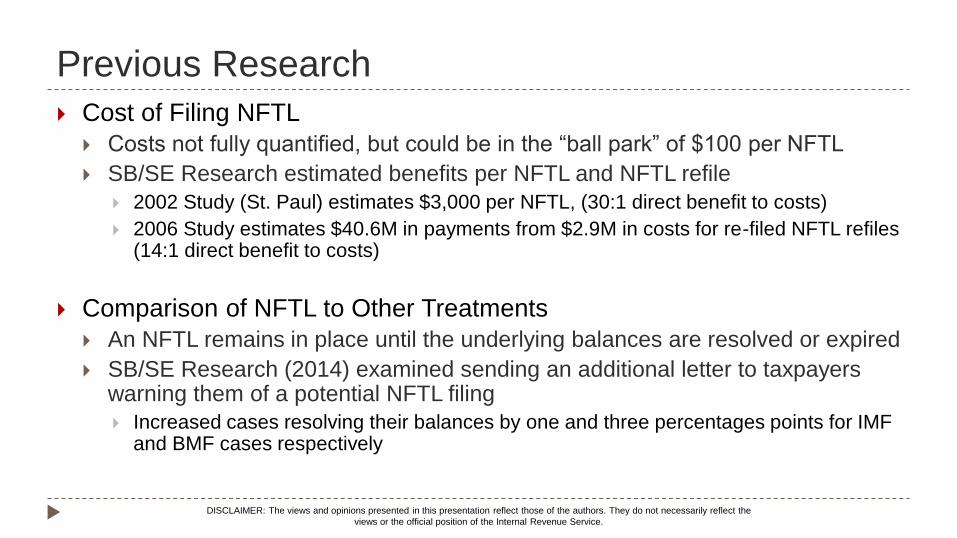
Previous Research
Cost of Filing NFTL
Costs not fully quantified, but could be in the “ball park” of $100 per NFTL
SB/SE Research estimated benefits per NFTL and NFTL refile
2002 Study (St. Paul) estimates $3,000 per NFTL, (30:1 direct benefit to costs)
2006 Study estimates $40.6M in payments from $2.9M in costs for re-filed NFTL refiles (14:1 direct benefit to costs)
Comparison of NFTL to Other Treatments
An NFTL remains in place until the underlying balances are resolved or expired
SB/SE Research (2014) examined sending an additional letter to taxpayers warning them of a potential NFTL filing
Increased cases resolving their balances by one and three percentages points for IMF and BMF cases respectively
DISCLAIMER: The views and opinions presented in this presentation reflect those of the authors. They do not necessarily reflect the
views or the official position of the Internal Revenue Service.
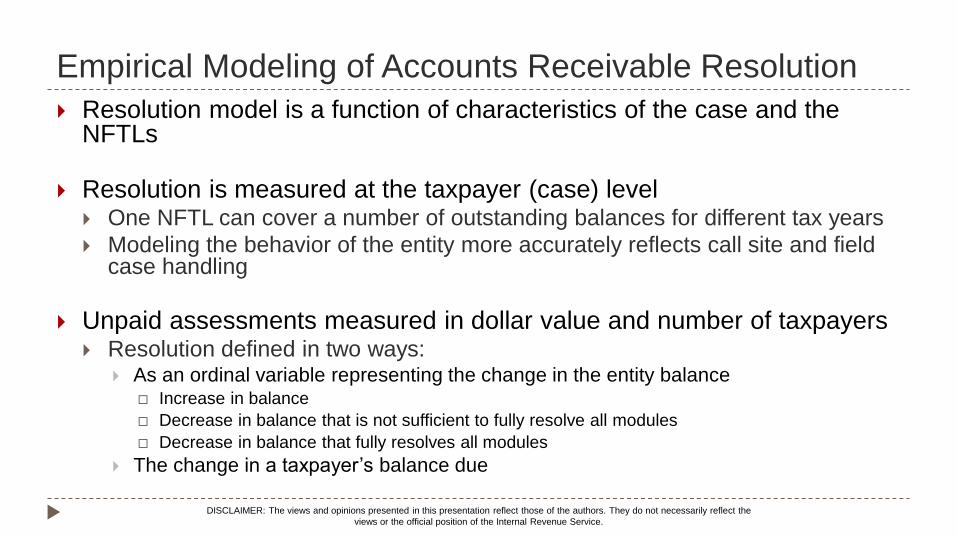
Empirical Modeling of Accounts Receivable Resolution
Resolution model is a function of characteristics of the case and the NFTLs
Resolution is measured at the taxpayer (case) level One NFTL can cover a number of outstanding balances for different tax years
Modeling the behavior of the entity more accurately reflects call site and field case handling
Unpaid assessments measured in dollar value and number of taxpayers Resolution defined in two ways:
As an ordinal variable representing the change in the entity balance Increase in balance
Decrease in balance that is not sufficient to fully resolve all modules
Decrease in balance that fully resolves all modules
The change in a taxpayer’s balance due
DISCLAIMER: The views and opinions presented in this presentation reflect those of the authors. They do not necessarily reflect the
views or the official position of the Internal Revenue Service.
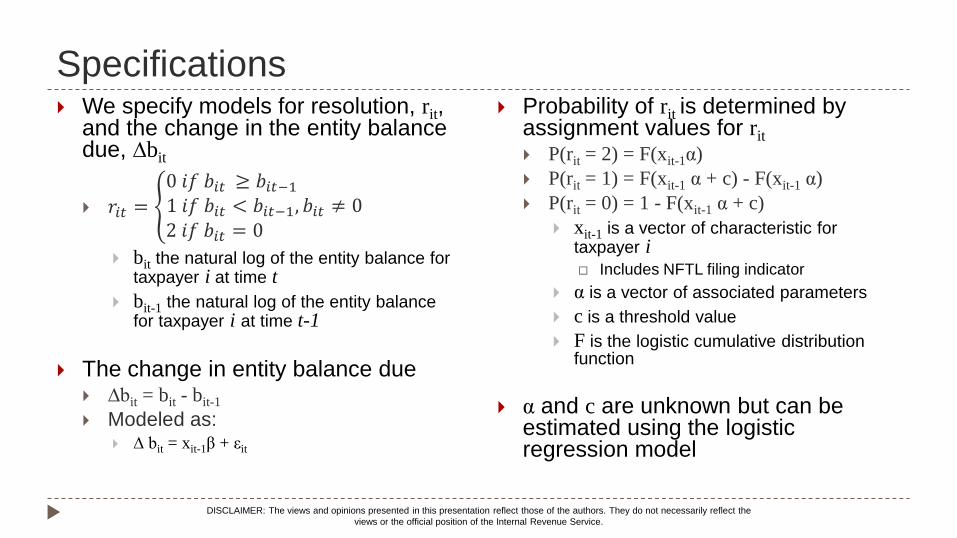
Specifications We specify models for resolution, rit,
and the change in the entity balance due, ∆bit
𝑟𝑖𝑡 =
0 𝑖𝑓 𝑏𝑖𝑡 ≥ 𝑏𝑖𝑡−1 1 𝑖𝑓 𝑏𝑖𝑡 < 𝑏𝑖𝑡−1, 𝑏𝑖𝑡 ≠ 02 𝑖𝑓 𝑏𝑖𝑡 = 0
bit the natural log of the entity balance for taxpayer i at time t
bit-1 the natural log of the entity balance for taxpayer i at time t-1
The change in entity balance due ∆bit = bit - bit-1
Modeled as: ∆ bit = xit-1β + εit
Probability of rit is determined by assignment values for rit P(rit = 2) = F(xit-1α)
P(rit = 1) = F(xit-1 α + c) - F(xit-1 α)
P(rit = 0) = 1 - F(xit-1 α + c)
xit-1 is a vector of characteristic for taxpayer i Includes NFTL filing indicator
α is a vector of associated parameters
c is a threshold value
F is the logistic cumulative distribution function
α and c are unknown but can be estimated using the logistic regression model
DISCLAIMER: The views and opinions presented in this presentation reflect those of the authors. They do not necessarily reflect the
views or the official position of the Internal Revenue Service.
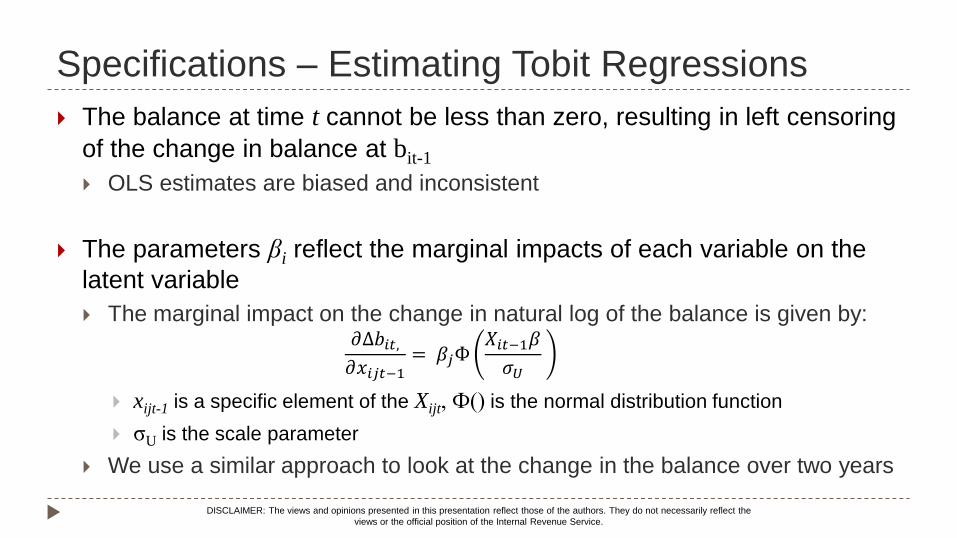
Specifications – Estimating Tobit Regressions
The balance at time t cannot be less than zero, resulting in left censoring
of the change in balance at bit-1
OLS estimates are biased and inconsistent
The parameters βi reflect the marginal impacts of each variable on the
latent variable
The marginal impact on the change in natural log of the balance is given by: 𝜕∆𝑏𝑖𝑡,𝜕𝑥𝑖𝑗𝑡−1
= 𝛽𝑗Ф𝑋𝑖𝑡−1𝛽
𝜎𝑈
xijt-1 is a specific element of the Xijt, Ф() is the normal distribution function
σU is the scale parameter
We use a similar approach to look at the change in the balance over two years
DISCLAIMER: The views and opinions presented in this presentation reflect those of the authors. They do not necessarily reflect the
views or the official position of the Internal Revenue Service.
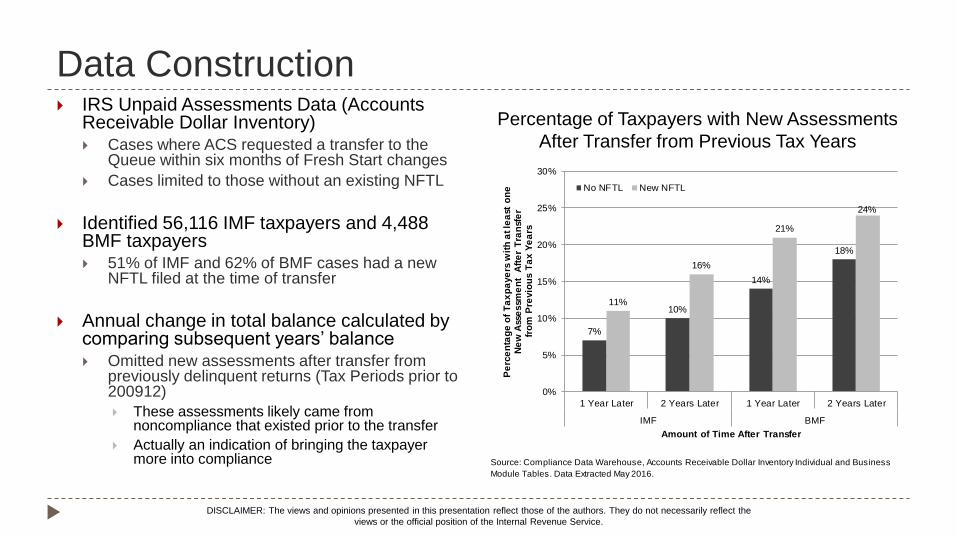
Data Construction IRS Unpaid Assessments Data (Accounts
Receivable Dollar Inventory) Cases where ACS requested a transfer to the
Queue within six months of Fresh Start changes
Cases limited to those without an existing NFTL
Identified 56,116 IMF taxpayers and 4,488 BMF taxpayers 51% of IMF and 62% of BMF cases had a new
NFTL filed at the time of transfer
Annual change in total balance calculated by comparing subsequent years’ balance Omitted new assessments after transfer from
previously delinquent returns (Tax Periods prior to 200912)
These assessments likely came from noncompliance that existed prior to the transfer
Actually an indication of bringing the taxpayer more into compliance
Percentage of Taxpayers with New Assessments
After Transfer from Previous Tax Years
DISCLAIMER: The views and opinions presented in this presentation reflect those of the authors. They do not necessarily reflect the
views or the official position of the Internal Revenue Service.
Source: Compliance Data Warehouse, Accounts Receivable Dollar Inventory Individual and Business
Module Tables. Data Extracted May 2016.
7%
10%
14%
18%
11%
16%
21%
24%
0%
5%
10%
15%
20%
25%
30%
1 Year Later 2 Years Later 1 Year Later 2 Years Later
IMF BMF
Pe
rce
nta
ge
of
Ta
xp
aye
rs w
ith
at le
ast
on
e
Ne
w A
sse
ssm
en
t A
fte
r T
ran
sfe
r fr
om
Pre
vio
us
Ta
x Y
ea
rs
Amount of Time After Transfer
No NFTL New NFTL

Payments and Abatements After Transfer Balance due may be reduced via payments and/or abatements after transfer
We treat payments and abatements equally in our analysis as both are important in resolving the outstanding balance
The figures below show the percentage of cases that made a payment or had an abatement within one or two years after transfer Cases receiving a new NFTL had a higher percentage of payments and abatements after transfer
Source: Compliance Data Warehouse, Accounts Receivable Dollar Inventory Individual and Business Module Tables. Data Extracted May 2016.
38%
50%
9%
16%
44%
56%
12%
20%
0%
10%
20%
30%
40%
50%
60%
After 1 Year After 2 Years After 1 Year After 2 Years
Payments Abatements
Ta
xp
aye
rs S
yst
em
ica
lly T
ran
sfe
rre
d f
rom
AC
S t
o
the
Qu
eu
e (N
o P
rio
r N
FT
L a
t T
ran
sfe
r)
IMF
No NFTL
New NFTL
31%
40%
18%
28%
47%
54%
25%
40%
0%
10%
20%
30%
40%
50%
60%
After 1 Year After 2 Years After 1 Year After 2 Years
Payments Abatements
BMF
DISCLAIMER: The views and opinions presented in this presentation reflect those of the authors. They do not necessarily reflect the
views or the official position of the Internal Revenue Service.
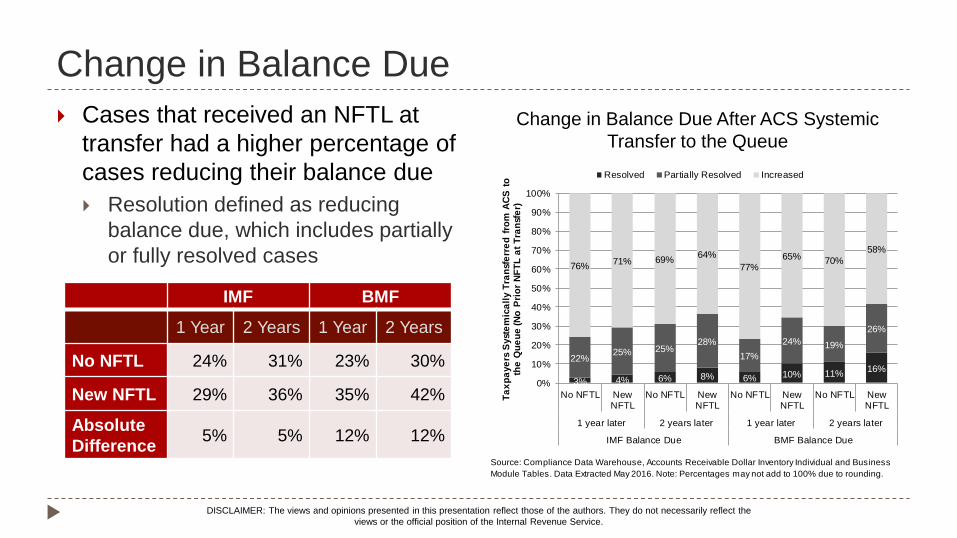
Change in Balance Due
Cases that received an NFTL at
transfer had a higher percentage of
cases reducing their balance due
Resolution defined as reducing
balance due, which includes partially
or fully resolved cases
Change in Balance Due After ACS Systemic
Transfer to the Queue
IMF BMF
1 Year 2 Years 1 Year 2 Years
No NFTL 24% 31% 23% 30%
New NFTL 29% 36% 35% 42%
Absolute
Difference 5% 5% 12% 12%
DISCLAIMER: The views and opinions presented in this presentation reflect those of the authors. They do not necessarily reflect the
views or the official position of the Internal Revenue Service.
Source: Compliance Data Warehouse, Accounts Receivable Dollar Inventory Individual and Business
Module Tables. Data Extracted May 2016. Note: Percentages may not add to 100% due to rounding.
3% 4% 6% 8% 6% 10% 11%16%
22%25% 25%
28%
17%
24% 19%
26%
76%71% 69%
64%
77%65% 70%
58%
0%
10%
20%
30%
40%
50%
60%
70%
80%
90%
100%
No NFTL NewNFTL
No NFTL NewNFTL
No NFTL NewNFTL
No NFTL NewNFTL
1 year later 2 years later 1 year later 2 years later
IMF Balance Due BMF Balance Due
Ta
xp
aye
rs S
yst
em
ica
lly T
ran
sfe
rre
d f
rom
AC
S t
o
the
Qu
eu
e (N
o P
rio
r N
FT
L a
t T
ran
sfe
r)
Resolved Partially Resolved Increased
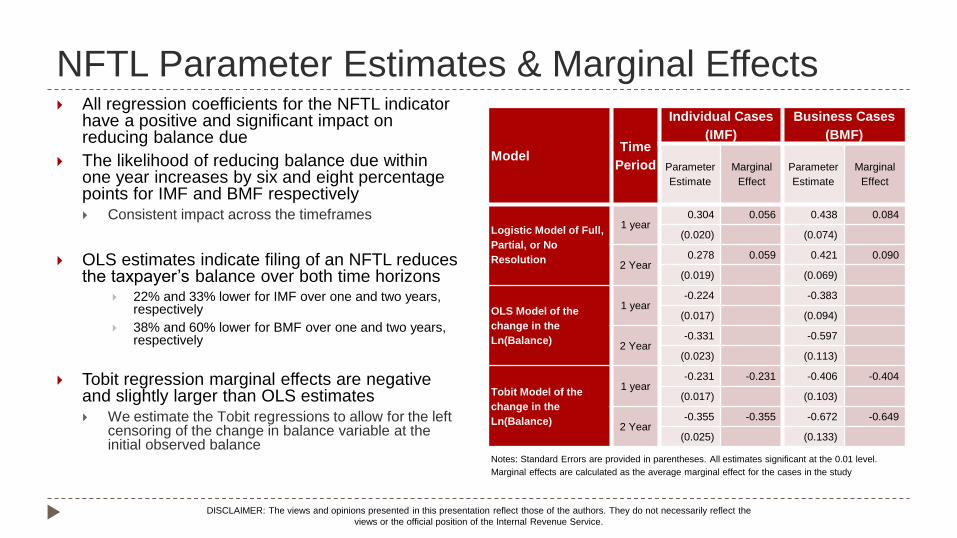
NFTL Parameter Estimates & Marginal Effects All regression coefficients for the NFTL indicator
have a positive and significant impact on reducing balance due
The likelihood of reducing balance due within one year increases by six and eight percentage points for IMF and BMF respectively Consistent impact across the timeframes
OLS estimates indicate filing of an NFTL reduces the taxpayer’s balance over both time horizons
22% and 33% lower for IMF over one and two years, respectively
38% and 60% lower for BMF over one and two years, respectively
Tobit regression marginal effects are negative and slightly larger than OLS estimates We estimate the Tobit regressions to allow for the left
censoring of the change in balance variable at the initial observed balance
Model Time
Period
Individual Cases
(IMF)
Business Cases
(BMF)
Parameter
Estimate
Marginal
Effect
Parameter
Estimate
Marginal
Effect
Logistic Model of Full,
Partial, or No
Resolution
1 year 0.304 0.056 0.438 0.084
(0.020) (0.074)
2 Year 0.278 0.059 0.421 0.090
(0.019) (0.069)
OLS Model of the
change in the
Ln(Balance)
1 year -0.224 -0.383
(0.017) (0.094)
2 Year -0.331 -0.597
(0.023) (0.113)
Tobit Model of the
change in the
Ln(Balance)
1 year -0.231 -0.231 -0.406 -0.404
(0.017) (0.103)
2 Year -0.355 -0.355 -0.672 -0.649
(0.025) (0.133)
Notes: Standard Errors are provided in parentheses. All estimates significant at the 0.01 level.
Marginal effects are calculated as the average marginal effect for the cases in the study
DISCLAIMER: The views and opinions presented in this presentation reflect those of the authors. They do not necessarily reflect the
views or the official position of the Internal Revenue Service.
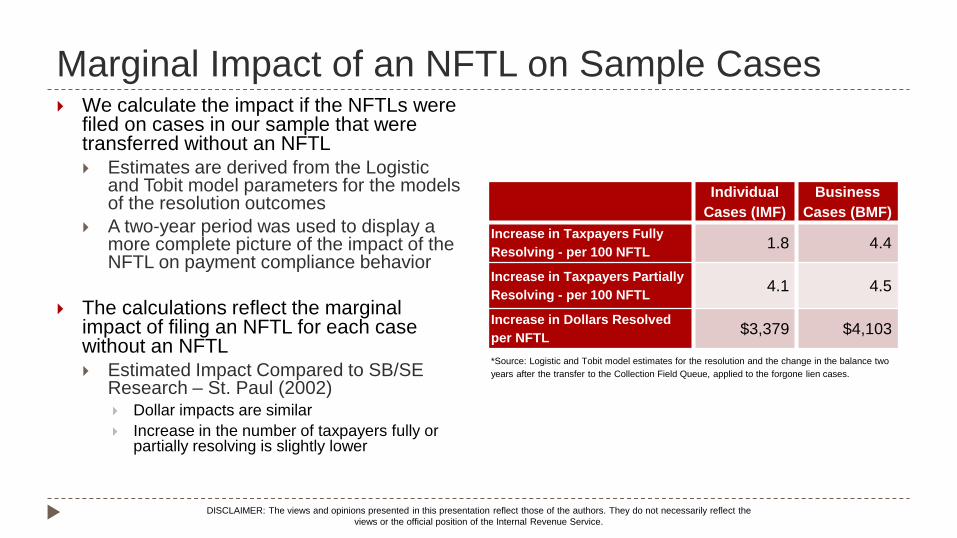
Marginal Impact of an NFTL on Sample Cases We calculate the impact if the NFTLs were
filed on cases in our sample that were transferred without an NFTL
Estimates are derived from the Logistic and Tobit model parameters for the models of the resolution outcomes
A two-year period was used to display a more complete picture of the impact of the NFTL on payment compliance behavior
The calculations reflect the marginal impact of filing an NFTL for each case without an NFTL
Estimated Impact Compared to SB/SE Research – St. Paul (2002) Dollar impacts are similar
Increase in the number of taxpayers fully or partially resolving is slightly lower
Individual
Cases (IMF)
Business
Cases (BMF)
Increase in Taxpayers Fully
Resolving - per 100 NFTL 1.8 4.4
Increase in Taxpayers Partially
Resolving - per 100 NFTL 4.1 4.5
Increase in Dollars Resolved
per NFTL $3,379 $4,103
*Source: Logistic and Tobit model estimates for the resolution and the change in the balance two
years after the transfer to the Collection Field Queue, applied to the forgone lien cases.
DISCLAIMER: The views and opinions presented in this presentation reflect those of the authors. They do not necessarily reflect the
views or the official position of the Internal Revenue Service.

Conclusions
NFTL is an effective tool in resolving unpaid balances
Increasing the NFTL filing thresholds has a negative impact on the
resolution of unpaid assessments
Study is limited to cases that have not been resolved in the IRS call site, and are
being transferred to the field queue for potential contact by a Revenue Officer
Results are consistent with much of the previous research
NFTL has a persistent effect over time
A reasonable estimate of the NFTL impact can be obtained within
a one-year time horizon
DISCLAIMER: The views and opinions presented in this presentation reflect those of the authors. They do not necessarily reflect the
views or the official position of the Internal Revenue Service.

Direction for Further Research
Additional research around the impact of the withdrawal
provisions is probably warranted
The indirect effect of NFTL filing on Payment Compliance
Behavior is an area of opportunity for further research
A larger scale econometric study of all collection treatment
options:
Allows for exploration of the relative effectiveness of treatment paths
Enables estimates of direct and indirect effects of policy
DISCLAIMER: The views and opinions presented in this presentation reflect those of the authors. They do not necessarily reflect the
views or the official position of the Internal Revenue Service.