Embed Size (px)
Citation preview
Research, Applied Analytics,
and Statistics
Session 4. Behavioral Research: Why do people do what they do?
Moderator: Sandy Lin
IRS, RAAS, National Research Program
Examining Motivations to Volunteer with
the VITA Program: How Motivations
Influence Future Volunteer Behavior
Patti J. Davis-Smith
IRS, W&I Research and Analysis
The Effect of Social Norms on Taxpayer
Payment Compliance
Caroline von Bose
Fors Marsh Group
Understanding the Nonfiler/Late-Filer Melissa Vigil
IRS, RAAS, Office of Research
Discussant: Joe Rosenberg
Tax Policy Center
Examining Motivations to Volunteer with the Volunteer Income Tax Assistance (VITA) Program: How Motivations Influence Future Volunteer Behavior
Patti J. Davis-Smith, Robert P. Thomas, and David C. Cico Internal Revenue Service, Wage & Investment Strategies and Solutions Research
Introduction
• Volunteerism: seeking opportunities; consideration of time, involvement level and needs; and making an ongoing commitment
• Volunteering serves different functions for different people.
• Self-Determination Theory suggests that engaging in volunteer work satisfies an individuals’ competence, autonomy, and relatedness needs.
• The Functional Approach to Volunteerism suggests that volunteering can serve six functions: values , understanding, career enhancement, social, protective, and esteem enhancement.
• Two studies in which we expected to be a relationship between psychological motivations and volunteering with the VITA Program.
Examining Motivations to Volunteer with VITA | W&I Research
Study 1 Method
• Study 1: Survey current and prospective VITA volunteer to understand motivations to volunteer with the VITA Program.
• Approximately 1,400 volunteer respondents: VITA Volunteers, IRS Employees, and General Volunteers.
• Measures:
• Volunteer Functions Inventory (Functional Approach)
• Volunteer Need Satisfaction (SDT)
• Benefits of Volunteering
• Aspects of VITA Volunteer Experience
• Demographics
Examining Motivations to Volunteer with VITA | W&I Research
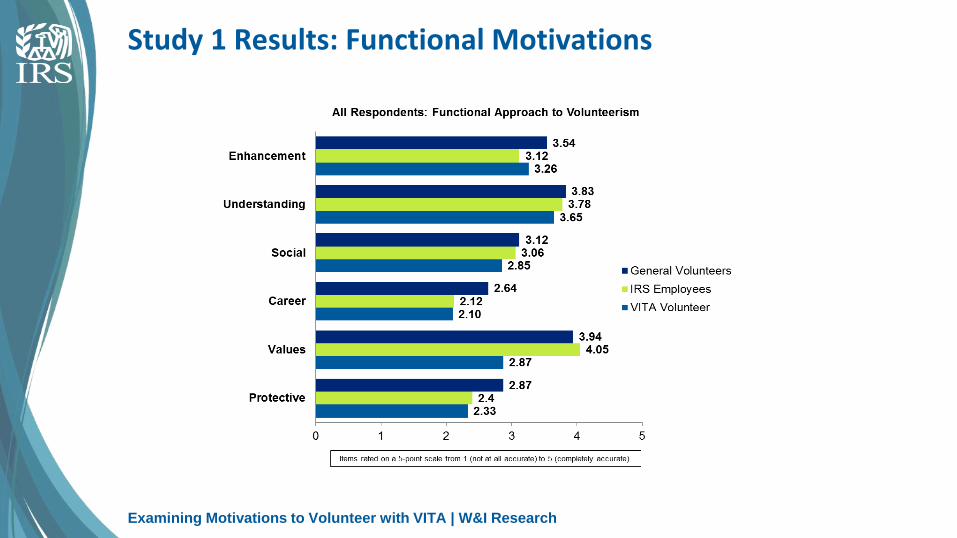
Study 1 Results: Functional Motivations
Examining Motivations to Volunteer with VITA | W&I Research
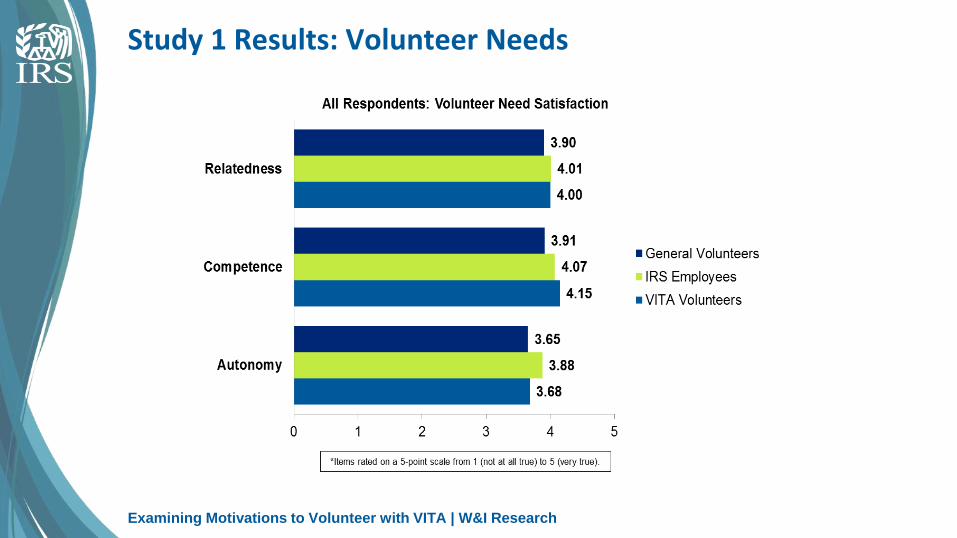
Study 1 Results: Volunteer Needs
Examining Motivations to Volunteer with VITA | W&I Research
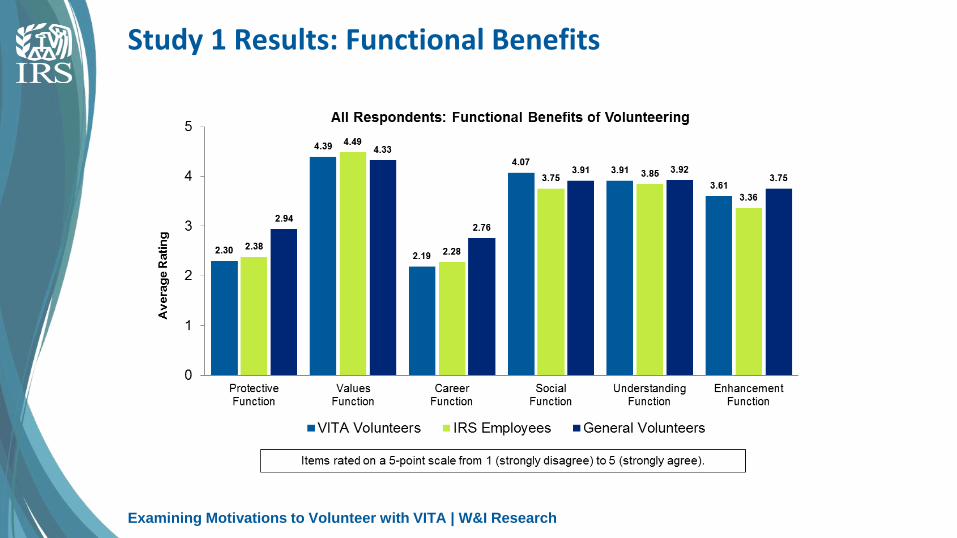
Study 1 Results: Functional Benefits
Examining Motivations to Volunteer with VITA | W&I Research
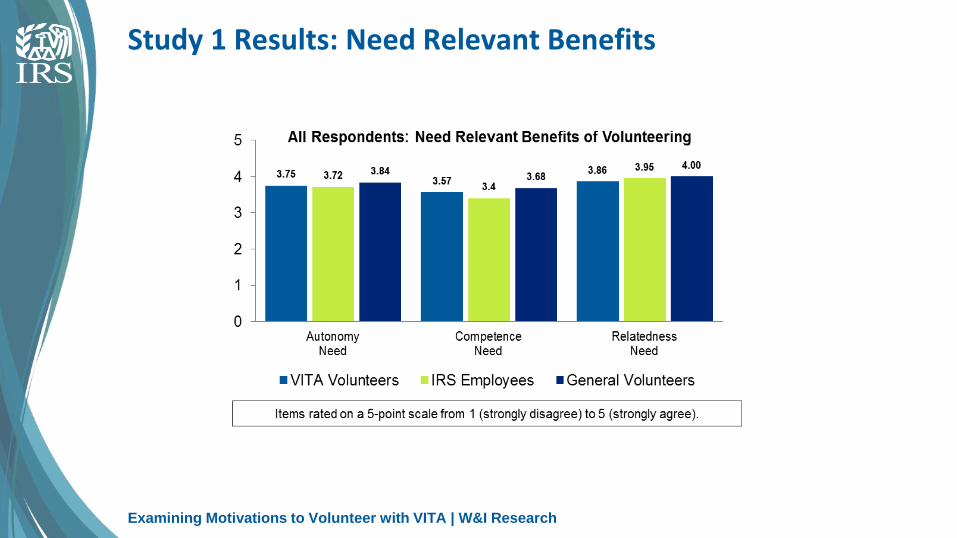
Study 1 Results: Need Relevant Benefits
Examining Motivations to Volunteer with VITA | W&I Research
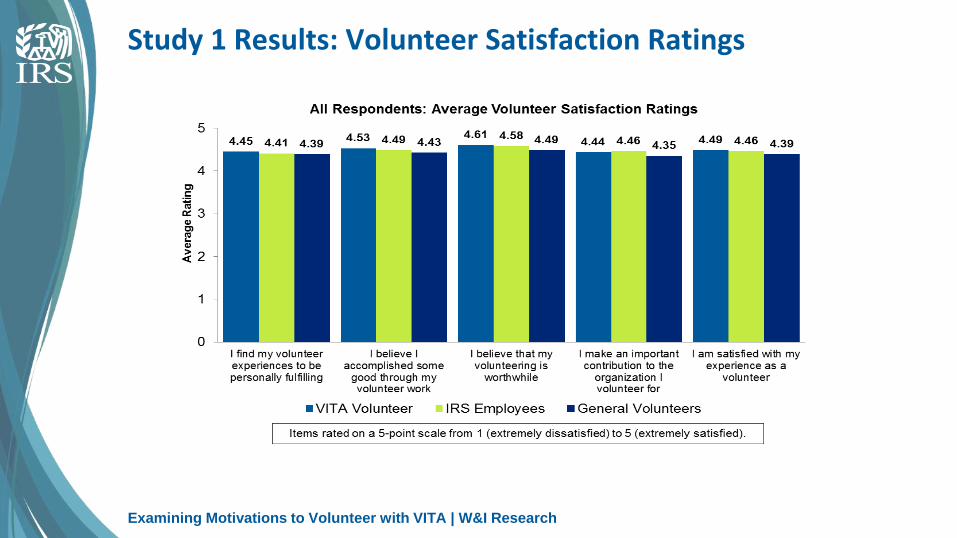
Study 1 Results: Volunteer Satisfaction Ratings
Examining Motivations to Volunteer with VITA | W&I Research
Study 1 Summary
• Volunteering facilitated respondents need-based and functionally relevant motivations.
• General Volunteers and IRS Employees: Values function and values benefits
• VITA Volunteers: Understanding function and values benefits
• All groups: Competence needs and relatedness benefits
• Receiving motivational benefits contributes to respondents overall satisfaction with their volunteer work.
Examining Motivations to Volunteer with VITA | W&I Research
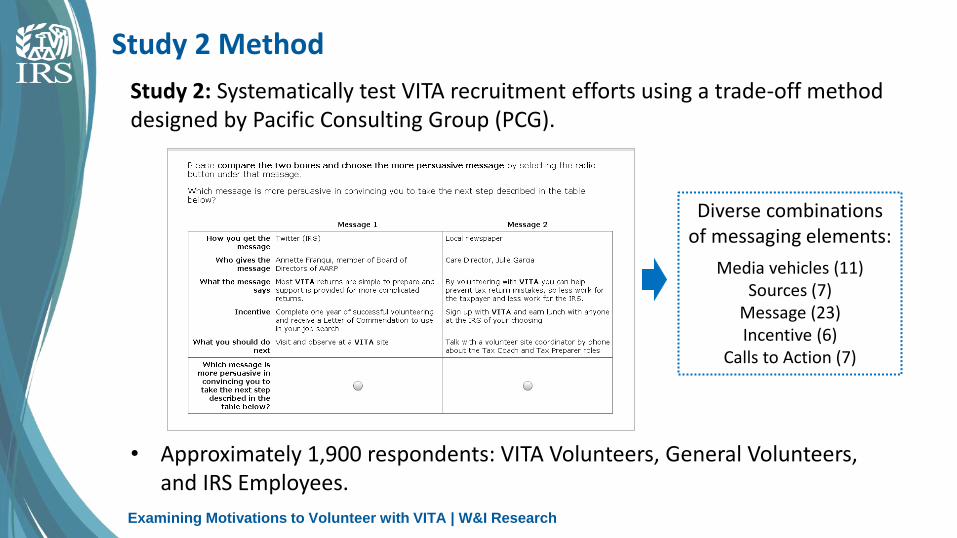
Study 2 Method
Study 2: Systematically test VITA recruitment efforts using a trade-off method designed by Pacific Consulting Group (PCG).
Diverse combinations of messaging elements:
Media vehicles (11) Sources (7)
Message (23) Incentive (6)
Calls to Action (7)
• Approximately 1,900 respondents: VITA Volunteers, General Volunteers, and IRS Employees.
Examining Motivations to Volunteer with VITA | W&I Research
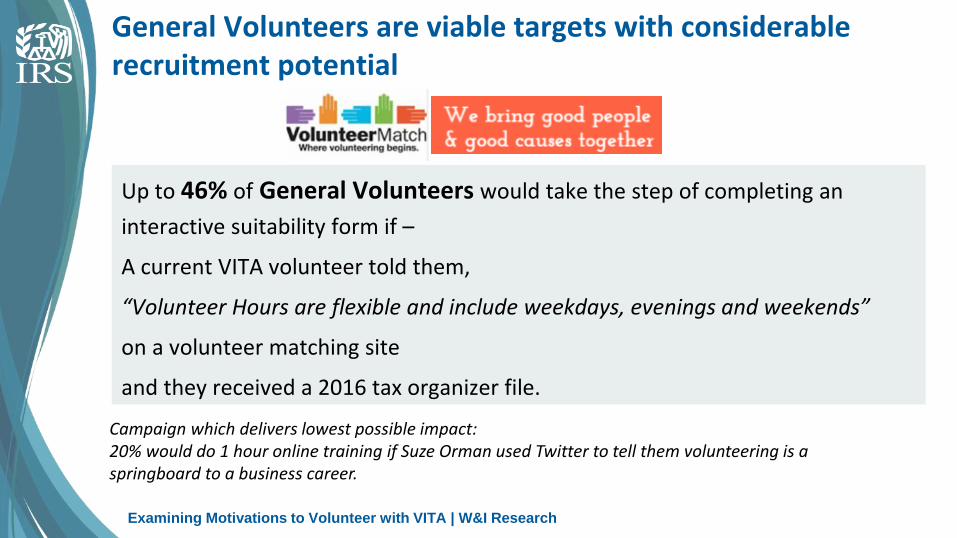
General Volunteers are viable targets with considerable recruitment potential
Up to 46% of General Volunteers would take the step of completing an
interactive suitability form if –
A current VITA volunteer told them,
“Volunteer Hours are flexible and include weekdays, evenings and weekends”
on a volunteer matching site
and they received a 2016 tax organizer file.
Campaign which delivers lowest possible impact: 20% would do 1 hour online training if Suze Orman used Twitter to tell them volunteering is a springboard to a business career.
Examining Motivations to Volunteer with VITA | W&I Research
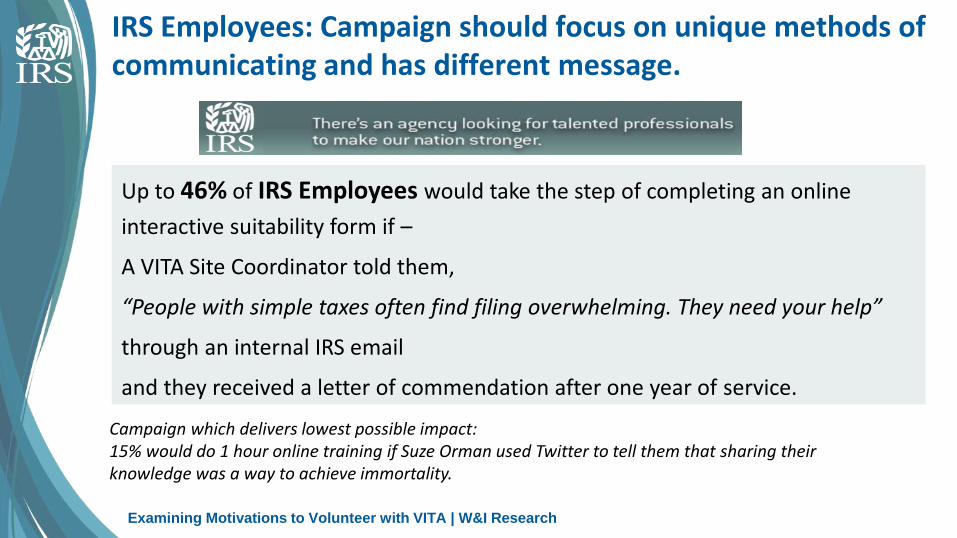
IRS Employees: Campaign should focus on unique methods of communicating and has different message.
Up to 46% of IRS Employees would take the step of completing an online
interactive suitability form if –
A VITA Site Coordinator told them,
“People with simple taxes often find filing overwhelming. They need your help”
through an internal IRS email
and they received a letter of commendation after one year of service.
Campaign which delivers lowest possible impact: 15% would do 1 hour online training if Suze Orman used Twitter to tell them that sharing their knowledge was a way to achieve immortality.
Examining Motivations to Volunteer with VITA | W&I Research
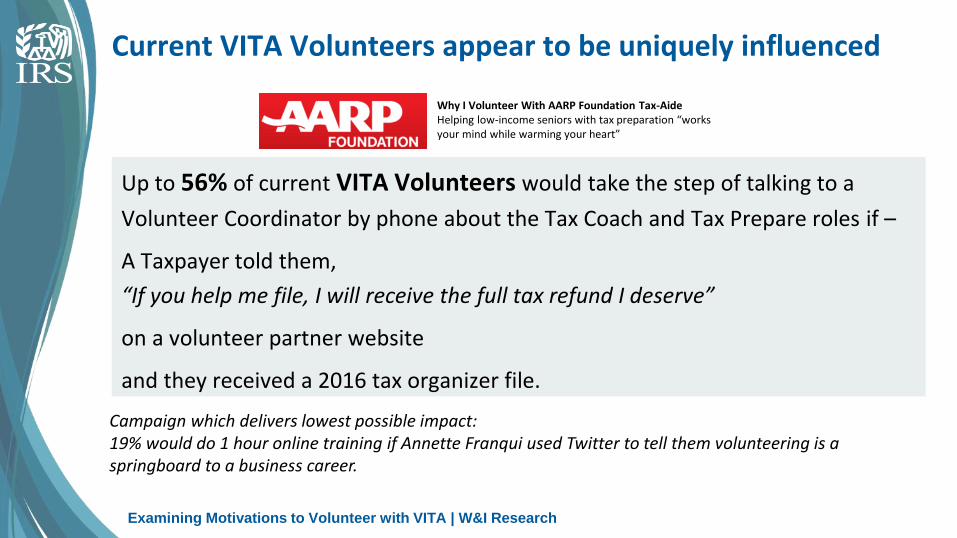
Current VITA Volunteers appear to be uniquely influenced
Up to 56% of current VITA Volunteers would take the step of talking to a
Volunteer Coordinator by phone about the Tax Coach and Tax Prepare roles if –
A Taxpayer told them,
“If you help me file, I will receive the full tax refund I deserve”
on a volunteer partner website
and they received a 2016 tax organizer file.
Campaign which delivers lowest possible impact: 19% would do 1 hour online training if Annette Franqui used Twitter to tell them volunteering is a springboard to a business career.
Why I Volunteer With AARP Foundation Tax-Aide Helping low-income seniors with tax preparation “works your mind while warming your heart”
Examining Motivations to Volunteer with VITA | W&I Research
Study 2 Summary
• Combining messaging elements into campaigns with the highest impact would persuade nearly half of General Volunteers and IRS Employees to take the next step.
• Both IRS Employees and General Volunteers are viable recruitment populations with considerable potential.
• Messages that appeal to the nature of volunteering were rated most highly; spokespersons with ties to the program VITA were desirable.
Examining Motivations to Volunteer with VITA | W&I Research
General Discussion and Implications
• Functional and psychological need fulfillment motivated volunteers and lead to greater volunteer satisfaction. [Study 1]
• Messaging that highlights the motivational benefits of VITA volunteerism, using spokespersons close to the program held more persuasive appeal. [Study 2]
• Limitations: sample composition, hypothetical choices, model inputs
• Implications for the practice and nature of volunteering:
• Coordinators: provide opportunities that maximize benefits.
• Generally focused on potential helpers and spontaneous helping situations, rather than person-based processes in helping.
• Reminder: behavior is jointly determined.
Examining Motivations to Volunteer with VITA | W&I Research
Do Appeals to Social Norms Increase
Taxpayer Compliance?
IRS Tax Policy Conference 2016
James Alm, Michael McKee, William D. Schulze,
Carrie von Bose, and Jubo Yan
Goal: Increase Voluntary Tax Compliance
→Ideally, people will
– Report and pay all their taxes
– Pay on time, and
– Withhold enough money in advance
→How can the IRS increase tax compliance outside
of traditional audit enforcement mechanisms?
– Messages based on social norms may influence
taxpayer behavior
Social Norms Influence Decisions
→Humans care a lot about
– What other people are doing
– What other people think about us
→Social norms can create reference points
→Social approval generates utility
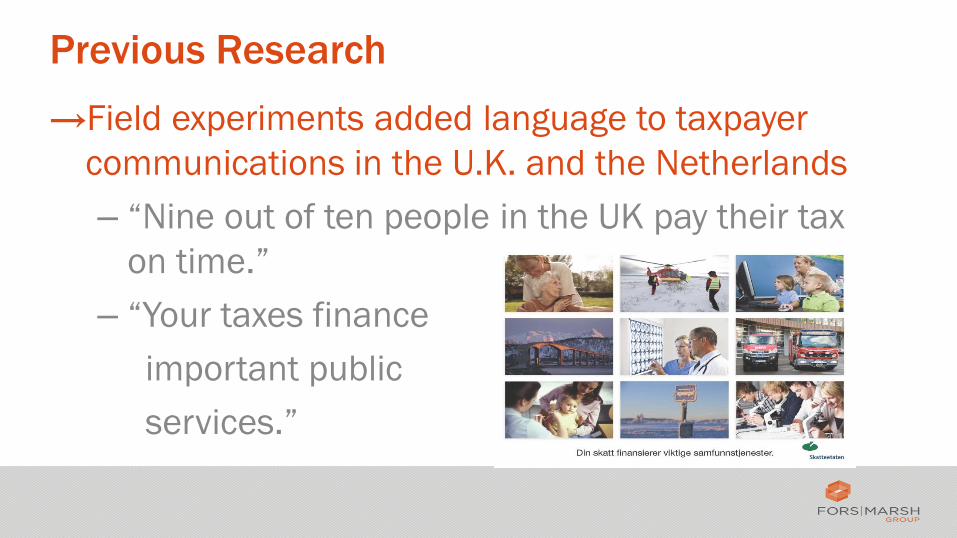
Previous Research
→Field experiments added language to taxpayer
communications in the U.K. and the Netherlands
– “Nine out of ten people in the UK pay their tax
on time.”
– “Your taxes finance
important public
services.”
Designing the Social Norm Messages
→Conducted focus groups to gauge reactions to
various messages
– Descriptive norm – describes typical/most
frequent behavior
– Injunctive norm – describes behavior that
“constitutes morally approved and disapproved
conduct”
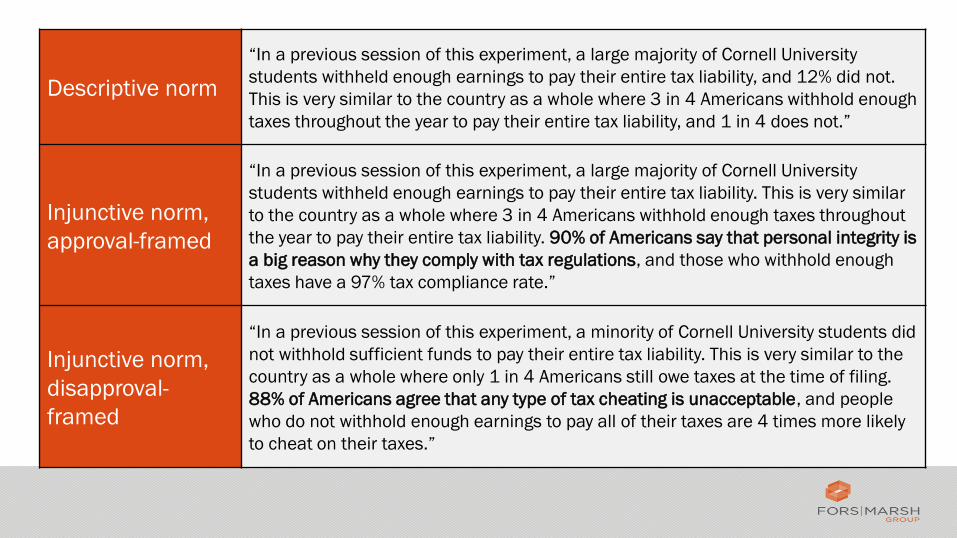
Descriptive norm
“In a previous session of this experiment, a large majority of Cornell University
students withheld enough earnings to pay their entire tax liability, and 12% did not.
This is very similar to the country as a whole where 3 in 4 Americans withhold enough
taxes throughout the year to pay their entire tax liability, and 1 in 4 does not.”
Injunctive norm,
approval-framed
“In a previous session of this experiment, a large majority of Cornell University
students withheld enough earnings to pay their entire tax liability. This is very similar
to the country as a whole where 3 in 4 Americans withhold enough taxes throughout
the year to pay their entire tax liability. 90% of Americans say that personal integrity is
a big reason why they comply with tax regulations, and those who withhold enough
taxes have a 97% tax compliance rate.”
Injunctive norm,
disapproval-
framed
“In a previous session of this experiment, a minority of Cornell University students did
not withhold sufficient funds to pay their entire tax liability. This is very similar to the
country as a whole where only 1 in 4 Americans still owe taxes at the time of filing.
88% of Americans agree that any type of tax cheating is unacceptable, and people
who do not withhold enough earnings to pay all of their taxes are 4 times more likely
to cheat on their taxes.”
Experiment Setup
→In each round, participants go through the
following steps
– Step 1: Earn income
– Step 2: Choose withholding amount
– Step 3: Claim a deduction amount
– Step 4: Find out if they are audited, learn audit
outcome and final earnings
Treatments
→For each of the three messages, participants
are shown the messages for rounds 11-20
→Control group does not receive a message at
any point
→We compare the compliance behavior within
and between groups

Effects on Compliance Treatment Tax Paid
1st Half 2nd Half
Control
(Treatment 1)
3241.53
(715.15)
3162.33
(736.89)
Descriptive norm
(Treatment 2)
3284.38
(773.75)
3149.00
(777.31)
Injunctive norm, approval-framed (Treatment 3) 3214.26
(756.12)
3145.73
(757.89)
Injunctive norm, disapproval-framed (Treatment 4) 3279.44
(747.57)
3216.05
(709.01)
Note: Standard deviations are in parentheses.
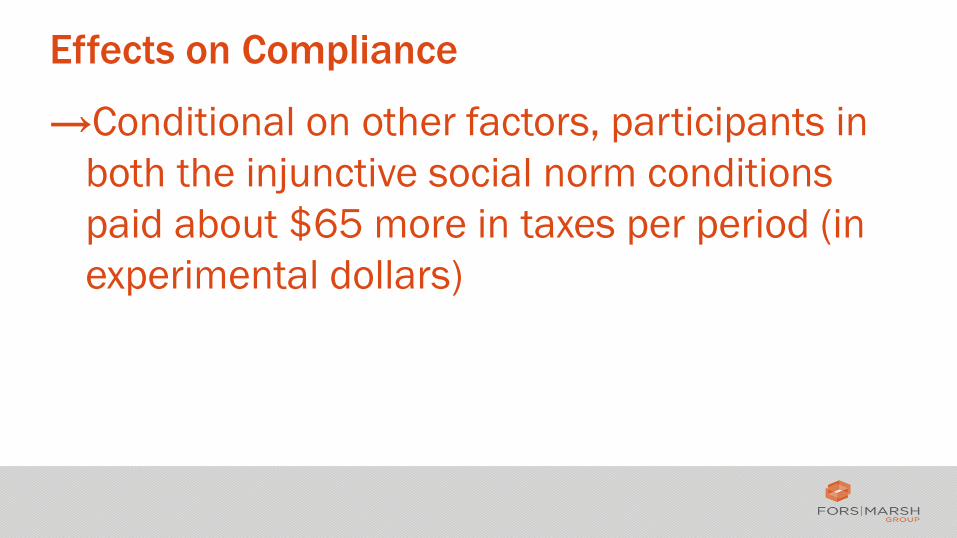
Effects on Compliance
→Conditional on other factors, participants in
both the injunctive social norm conditions
paid about $65 more in taxes per period (in
experimental dollars)
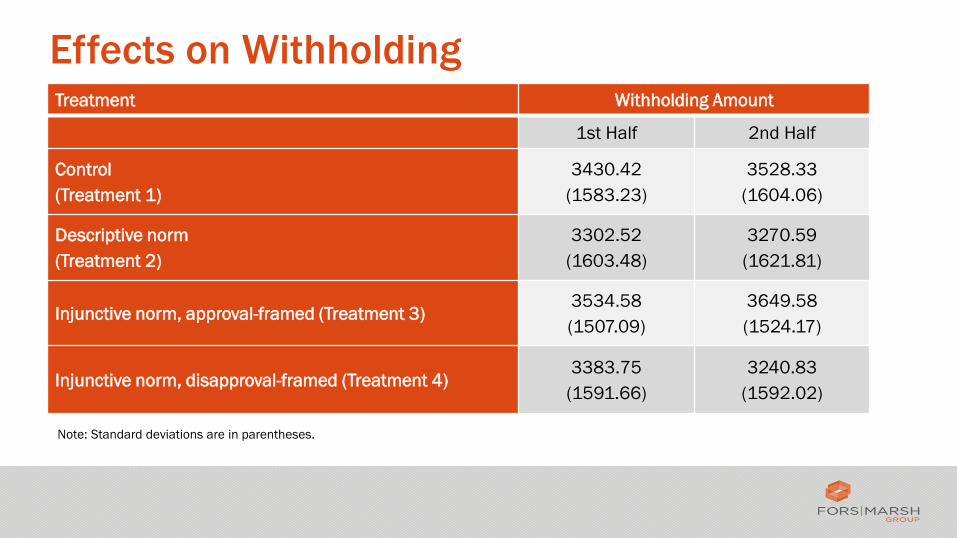
Effects on Withholding Treatment Withholding Amount
1st Half 2nd Half
Control
(Treatment 1)
3430.42
(1583.23)
3528.33
(1604.06)
Descriptive norm
(Treatment 2)
3302.52
(1603.48)
3270.59
(1621.81)
Injunctive norm, approval-framed (Treatment 3) 3534.58
(1507.09)
3649.58
(1524.17)
Injunctive norm, disapproval-framed (Treatment 4) 3383.75
(1591.66)
3240.83
(1592.02)
Note: Standard deviations are in parentheses.
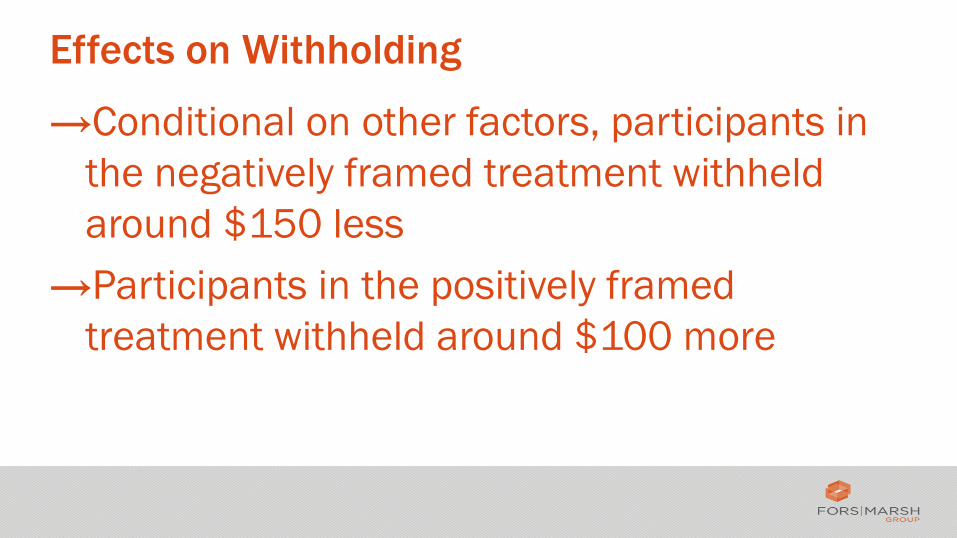
Effects on Withholding
→Conditional on other factors, participants in
the negatively framed treatment withheld
around $150 less
→Participants in the positively framed
treatment withheld around $100 more
Conclusion
→The descriptive norm had no effect
→Injunctive norms both increased the amount of
taxes paid
→The positively framed injunctive norm
increased withholding amount
→Social approval/disapproval is a strong
motivator in tax compliance

Thank you. Questions?
Preliminary Findings
Understanding the Nonfiler/Late-Filer
IRS/TPC Research Conference
June 23, 2016
Disclaimer: This research does not represent any official opinions or views of the Internal Revenue Service, United States
Treasury or any other government agency.
Jose Colon De La Matta, John Guyton, Ronald Hodge II, Patrick Langetieg, Stacy
Orlett, Mark Payne, Ahmad Qadri, Lisa Rupert, Brenda Schafer, Alex Turk, Melissa Vigil
Internal Revenue Service
Agenda
• Background
• Key Findings
• Definitions
• Survey Population Characteristics
• Preliminary Findings
• Preliminary Recommendations
• IRS Initiatives Supported by Study Findings
• Further Research
Understanding the Nonfiler/Late-Filer – Preliminary Findings
Background
Purpose of Study • Gain insight into drivers of nonfiling and the taxpayer’s experience
resolving an issue with an unfiled return.
• Desired Outcomes o Understand barriers to filing on time
o Gain insight into behavior
• Why do taxpayers file late?
• What prompts them to file?
• What actions do they perform to become compliant?
• What are taxpayers’ perceptions of the process?
• How much time and money taxpayers spend to become compliant?
• How can IRS facilitate filing?
Understanding the Nonfiler/Late-Filer – Preliminary Findings
Key Factors that Drive Nonfiling Inability to Pay • Many of the respondents with liquidity issues are unaware of payment
options.
Life Events Pose Barriers to Filing • Life events (e.g., death, illness, unemployment) are a significant factor
for not filing for many respondents.
Not all Documents are Available • Many respondents do not file on time simply because they do not have
all of their tax documents.
Filing an Extension • Taxpayers who file an extension may believe they have filed or may
forget to file as they get farther away from filing season.
Understanding the Nonfiler/Late-Filer – Preliminary Findings
Definitions General Definitions • Nonfiler – An individual who appears to be required to file a return but has not
filed.
• Late-filer – An individual who files a required return after the due date.
• SFR (Substitute for Return) – Process by which IRS calculates tax liability for
certain nonfilers.
• Study Population – Individual taxpayers contacted by IRS about an unfiled
return. Taxpayer either filed a return or agreed to the proposed assessment in
CY2014.
Survey Strata • ASFR (Automated Substitute for Return) – An automated process to contact
nonfilers and make a substitute for return assessment if they don’t respond.
• SFR Exam – Nonfiler cases worked by Examinations division.
• Non-SFR – Nonfiler cases where returns were secured by the notice process,
automated collection system (ACS), or field collection.
Understanding the Nonfiler/Late-Filer – Preliminary Findings
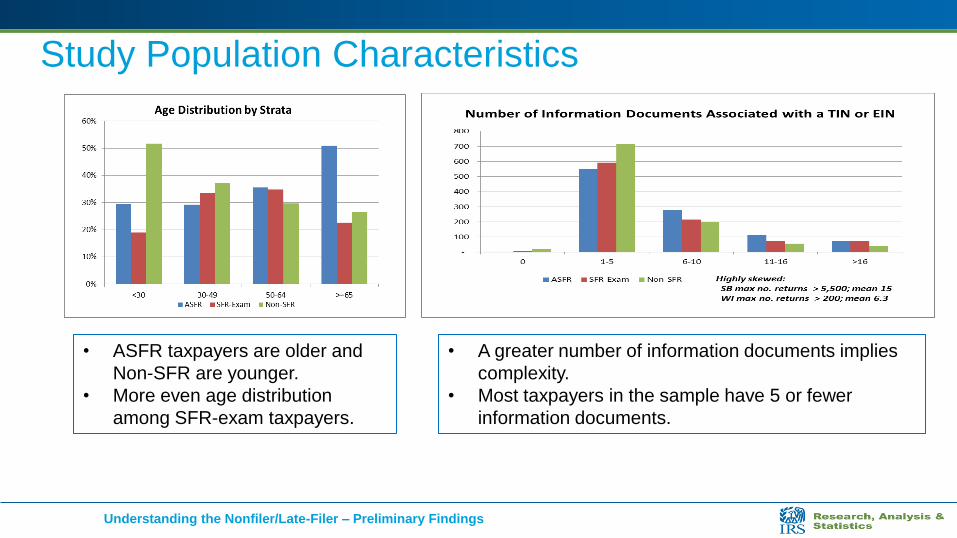
Study Population Characteristics
• ASFR taxpayers are older and
Non-SFR are younger.
• More even age distribution
among SFR-exam taxpayers.
• A greater number of information documents implies
complexity.
• Most taxpayers in the sample have 5 or fewer
information documents.
Understanding the Nonfiler/Late-Filer – Preliminary Findings
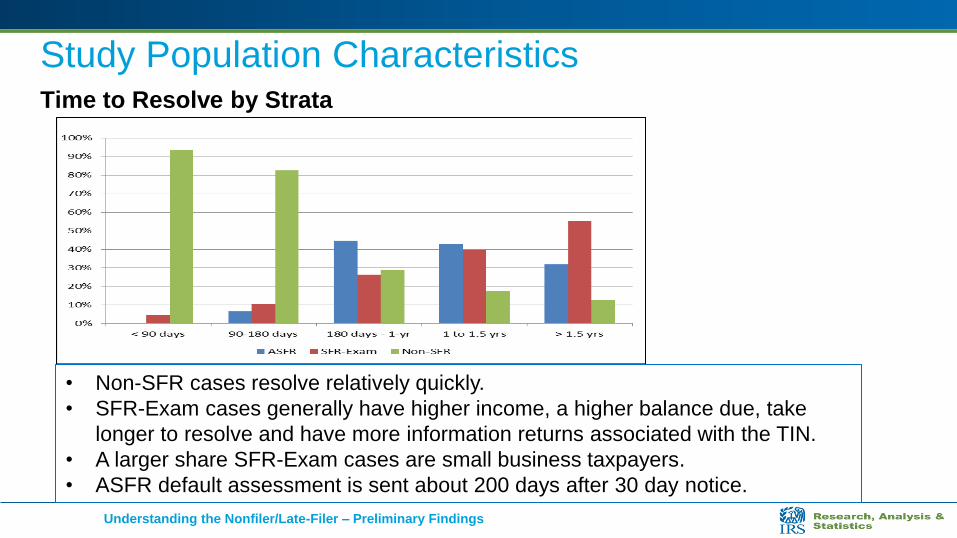
Time to Resolve by Strata
• Non-SFR cases resolve relatively quickly.
• SFR-Exam cases generally have higher income, a higher balance due, take
longer to resolve and have more information returns associated with the TIN.
• A larger share SFR-Exam cases are small business taxpayers.
• ASFR default assessment is sent about 200 days after 30 day notice.
Study Population Characteristics
Understanding the Nonfiler/Late-Filer – Preliminary Findings
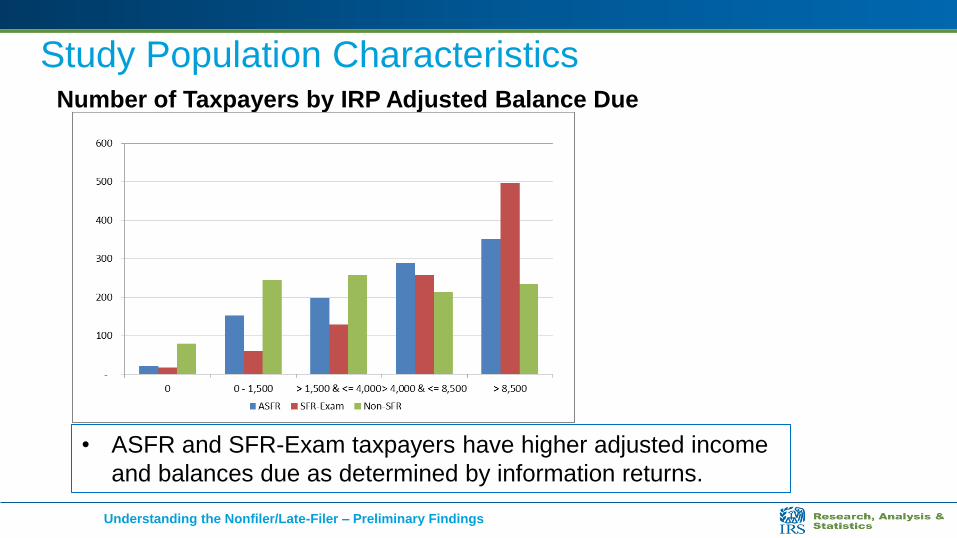
Study Population Characteristics Number of Taxpayers by IRP Adjusted Balance Due
• ASFR and SFR-Exam taxpayers have higher adjusted income
and balances due as determined by information returns.
Understanding the Nonfiler/Late-Filer – Preliminary Findings
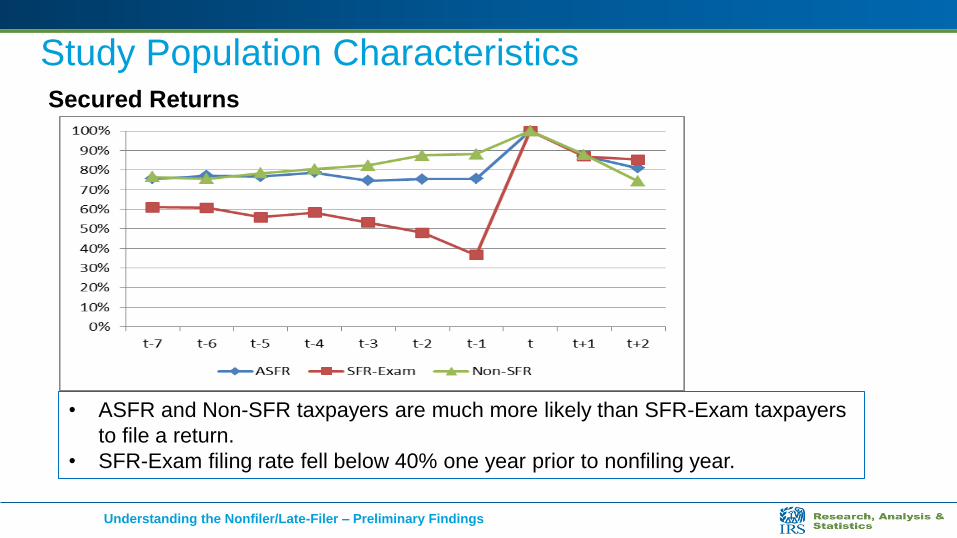
Study Population Characteristics Secured Returns
• ASFR and Non-SFR taxpayers are much more likely than SFR-Exam taxpayers
to file a return.
• SFR-Exam filing rate fell below 40% one year prior to nonfiling year.
Understanding the Nonfiler/Late-Filer – Preliminary Findings
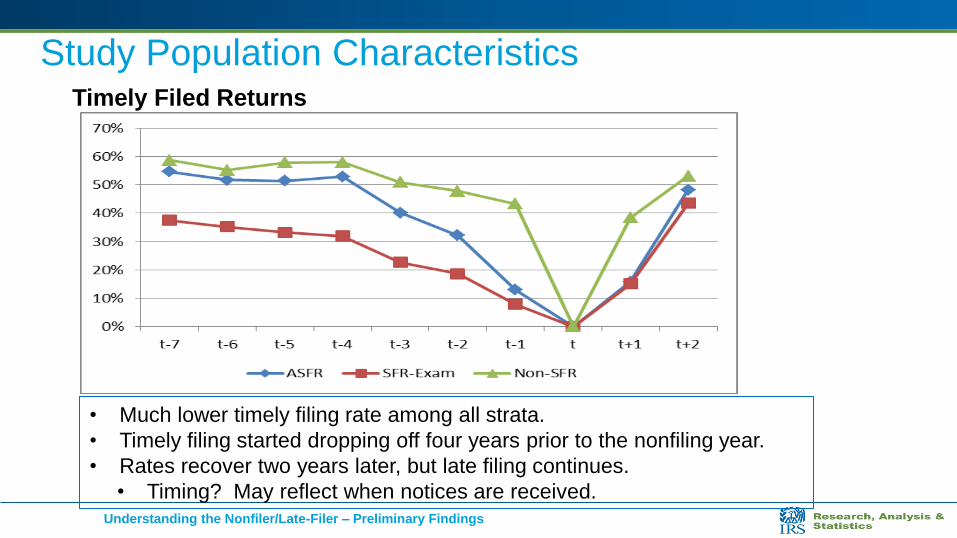
Study Population Characteristics Timely Filed Returns
• Much lower timely filing rate among all strata.
• Timely filing started dropping off four years prior to the nonfiling year.
• Rates recover two years later, but late filing continues.
• Timing? May reflect when notices are received. Understanding the Nonfiler/Late-Filer – Preliminary Findings
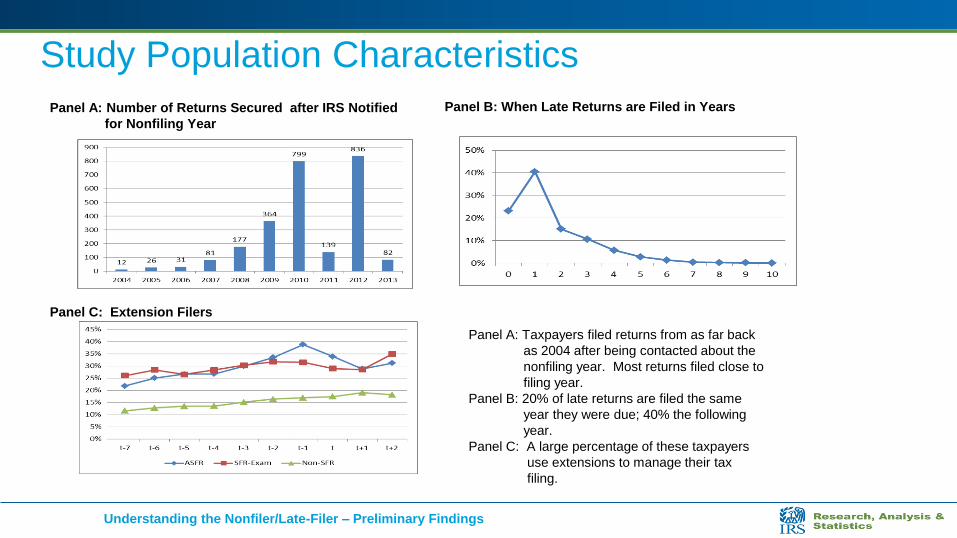
Study Population Characteristics
Panel B: When Late Returns are Filed in Years Panel A: Number of Returns Secured after IRS Notified
for Nonfiling Year
Panel C: Extension Filers
Panel A: Taxpayers filed returns from as far back
as 2004 after being contacted about the
nonfiling year. Most returns filed close to
filing year.
Panel B: 20% of late returns are filed the same
year they were due; 40% the following
year.
Panel C: A large percentage of these taxpayers
use extensions to manage their tax
filing.
Understanding the Nonfiler/Late-Filer – Preliminary Findings
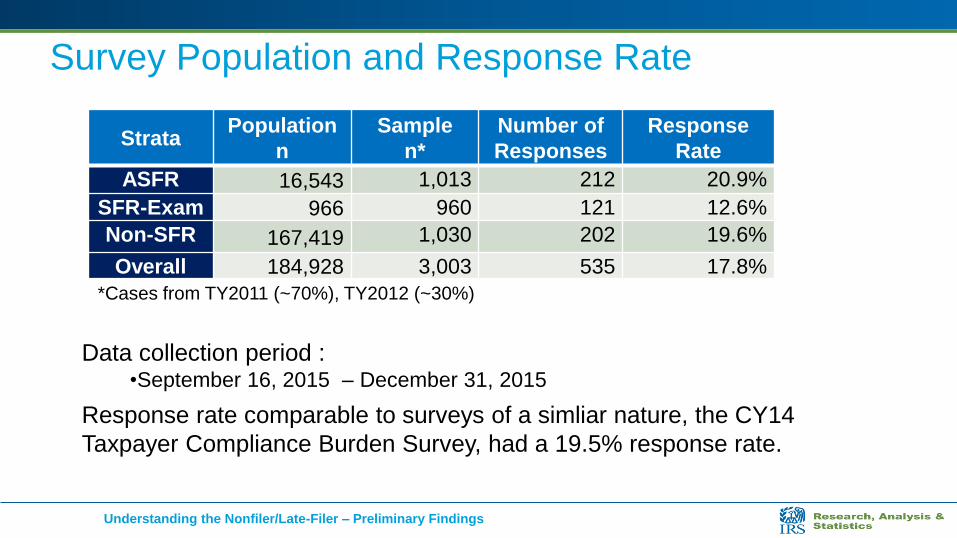
Survey Population and Response Rate
Data collection period : •September 16, 2015 – December 31, 2015
Response rate comparable to surveys of a simliar nature, the CY14
Taxpayer Compliance Burden Survey, had a 19.5% response rate.
Strata Population
n
Sample
n*
Number of
Responses
Response
Rate
ASFR 16,543 1,013 212 20.9%
SFR-Exam 966 960 121 12.6%
Non-SFR 167,419 1,030 202 19.6%
Overall 184,928 3,003 535 17.8%
*Cases from TY2011 (~70%), TY2012 (~30%)
Understanding the Nonfiler/Late-Filer – Preliminary Findings
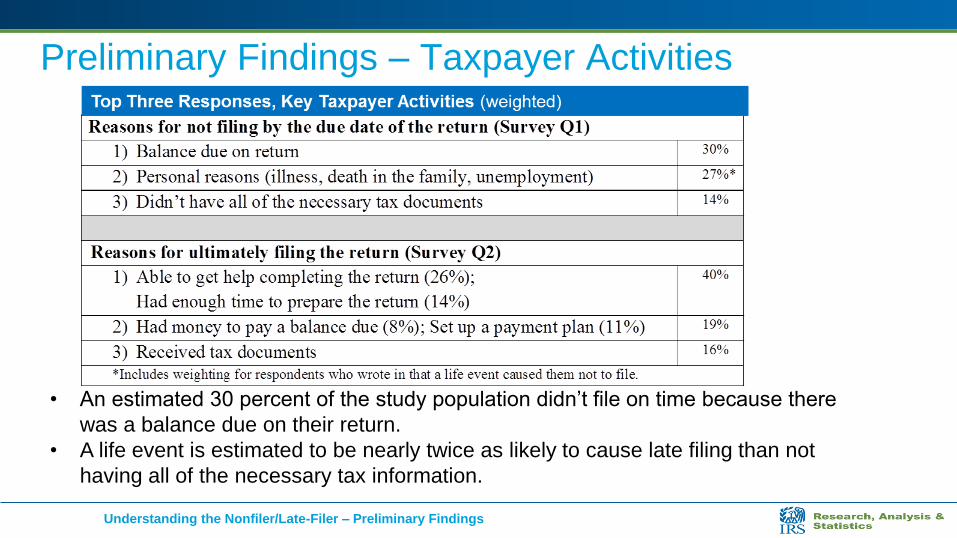
Preliminary Findings – Taxpayer Activities
• An estimated 30 percent of the study population didn’t file on time because there
was a balance due on their return.
• A life event is estimated to be nearly twice as likely to cause late filing than not
having all of the necessary tax information.
Understanding the Nonfiler/Late-Filer – Preliminary Findings
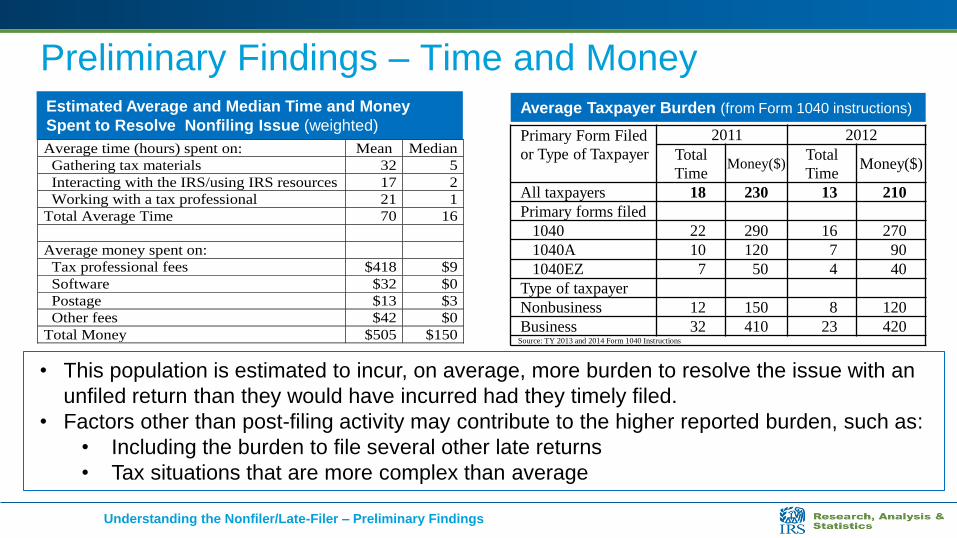
Preliminary Findings – Time and Money
Primary Form Filed
or Type of Taxpayer 2011 2012
Total
Time Money($)
Total
Time Money($)
All taxpayers 18 230 13 210 Primary forms filed 1040 22 290 16 270 1040A 10 120 7 90 1040EZ 7 50 4 40 Type of taxpayer Nonbusiness 12 150 8 120 Business 32 410 23 420
Source: TY 2013 and 2014 Form 1040 Instructions
Average Taxpayer Burden (from Form 1040 instructions) Estimated Average and Median Time and Money
Spent to Resolve Nonfiling Issue (weighted)
Average time (hours) spent on: Mean Median
Gathering tax materials 32 5
Interacting with the IRS/using IRS resources 17 2
Working with a tax professional 21 1
Total Average Time 70 16
Average money spent on:
Tax professional fees $418 $9
Software $32 $0
Postage $13 $3
Other fees $42 $0
Total Money $505 $150
• This population is estimated to incur, on average, more burden to resolve the issue with an
unfiled return than they would have incurred had they timely filed.
• Factors other than post-filing activity may contribute to the higher reported burden, such as:
• Including the burden to file several other late returns
• Tax situations that are more complex than average
Understanding the Nonfiler/Late-Filer – Preliminary Findings
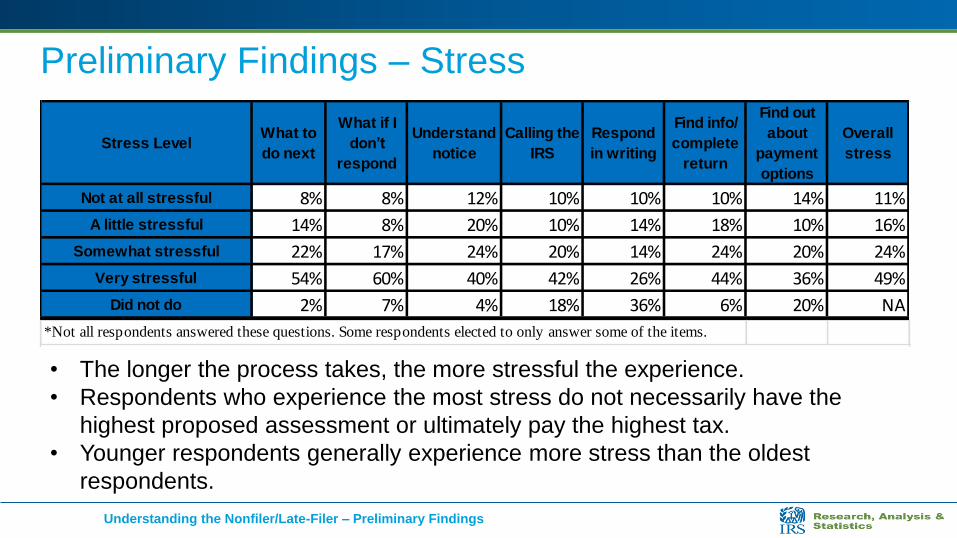
Preliminary Findings – Stress
Stress LevelWhat to
do next
What if I
don’t
respond
Understand
notice
Calling the
IRS
Respond
in writing
Find info/
complete
return
Find out
about
payment
options
Overall
stress
Not at all stressful 8% 8% 12% 10% 10% 10% 14% 11%
A little stressful 14% 8% 20% 10% 14% 18% 10% 16%
Somewhat stressful 22% 17% 24% 20% 14% 24% 20% 24%
Very stressful 54% 60% 40% 42% 26% 44% 36% 49%
Did not do 2% 7% 4% 18% 36% 6% 20% NA
*Not all respondents answered these questions. Some respondents elected to only answer some of the items.
• The longer the process takes, the more stressful the experience.
• Respondents who experience the most stress do not necessarily have the
highest proposed assessment or ultimately pay the highest tax.
• Younger respondents generally experience more stress than the oldest
respondents.
Understanding the Nonfiler/Late-Filer – Preliminary Findings
Preliminary Findings - Other
• An estimated 14 percent of the study population do not
open the first IRS notice. • Fear and stress kept many from taking any action.
• These taxpayers are open to communicating via email or
an online taxpayer account. • Considerable feedback to improve existing process.
• Earlier notification of an issue, which would minimize
penalty and interest, would be appreciated.
Understanding the Nonfiler/Late-Filer – Preliminary Findings
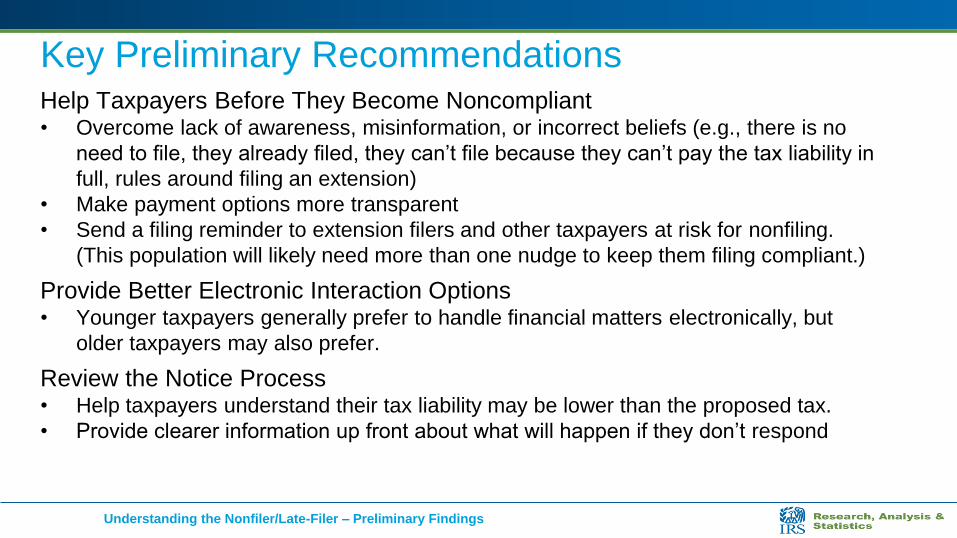
Key Preliminary Recommendations Help Taxpayers Before They Become Noncompliant • Overcome lack of awareness, misinformation, or incorrect beliefs (e.g., there is no
need to file, they already filed, they can’t file because they can’t pay the tax liability in
full, rules around filing an extension)
• Make payment options more transparent
• Send a filing reminder to extension filers and other taxpayers at risk for nonfiling.
(This population will likely need more than one nudge to keep them filing compliant.)
Provide Better Electronic Interaction Options • Younger taxpayers generally prefer to handle financial matters electronically, but
older taxpayers may also prefer.
Review the Notice Process • Help taxpayers understand their tax liability may be lower than the proposed tax.
• Provide clearer information up front about what will happen if they don’t respond
Understanding the Nonfiler/Late-Filer – Preliminary Findings
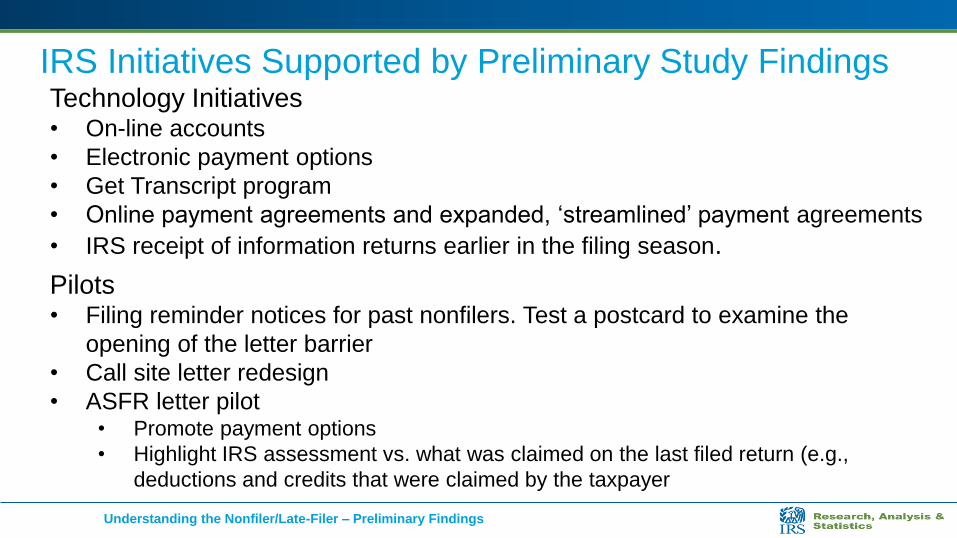
IRS Initiatives Supported by Preliminary Study Findings Technology Initiatives • On-line accounts
• Electronic payment options
• Get Transcript program
• Online payment agreements and expanded, ‘streamlined’ payment agreements
• IRS receipt of information returns earlier in the filing season.
Pilots • Filing reminder notices for past nonfilers. Test a postcard to examine the
opening of the letter barrier
• Call site letter redesign
• ASFR letter pilot • Promote payment options
• Highlight IRS assessment vs. what was claimed on the last filed return (e.g.,
deductions and credits that were claimed by the taxpayer
Understanding the Nonfiler/Late-Filer – Preliminary Findings
Further Research
• Continue analysis and modeling
• Identify the root cause and key drivers of nonfiling behavior
• Conduct pilot studies based on this study’s
recommendations
Understanding the Nonfiler/Late-Filer – Preliminary Findings