Embed Size (px)
Citation preview
Session 42 PD, Public and Private Disability Insurance: Past, Present, and Future
Moderator:
Ali Zaker-Shahrak, FSA, MAAA, Ph.D.
Presenters: Stephen Goss, ASA, MAAA
Doug Vrooman, FSA, MAAA
Social Security Disability Insurance: Benefits, Actuarial Status, Future
Stephen C. Goss, Chief Actuary, Social Security Administration
Society of Actuaries 2016 Health Meeting: Session 42 June 15, 2016
2
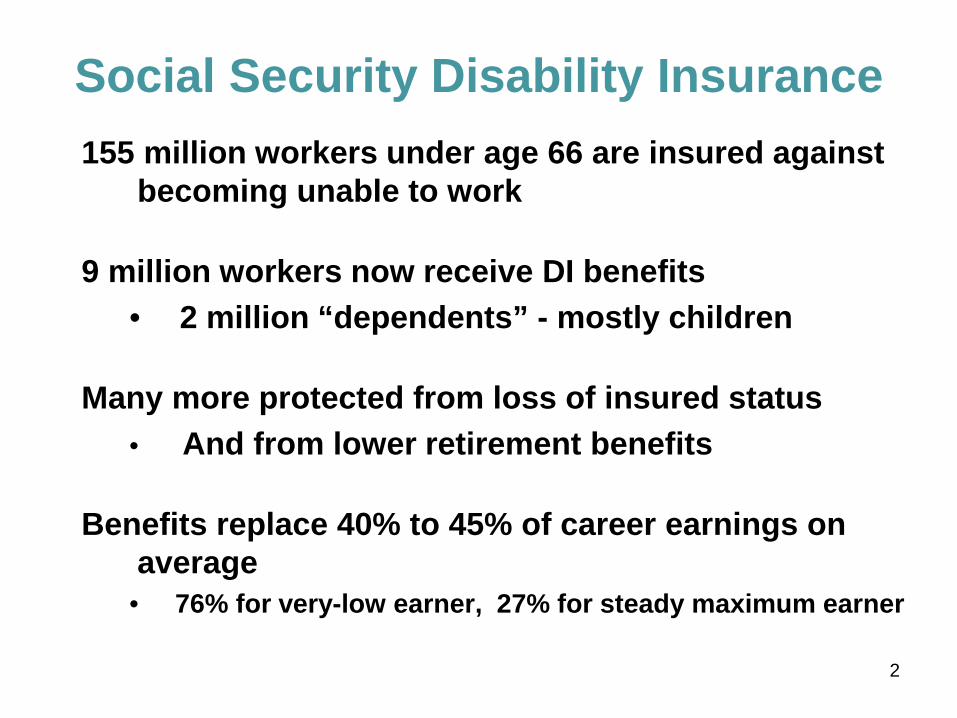
Social Security Disability Insurance155 million workers under age 66 are insured against
becoming unable to work
9 million workers now receive DI benefits• 2 million “dependents” - mostly children
Many more protected from loss of insured status• And from lower retirement benefits
Benefits replace 40% to 45% of career earnings on average
• 76% for very-low earner, 27% for steady maximum earner
3
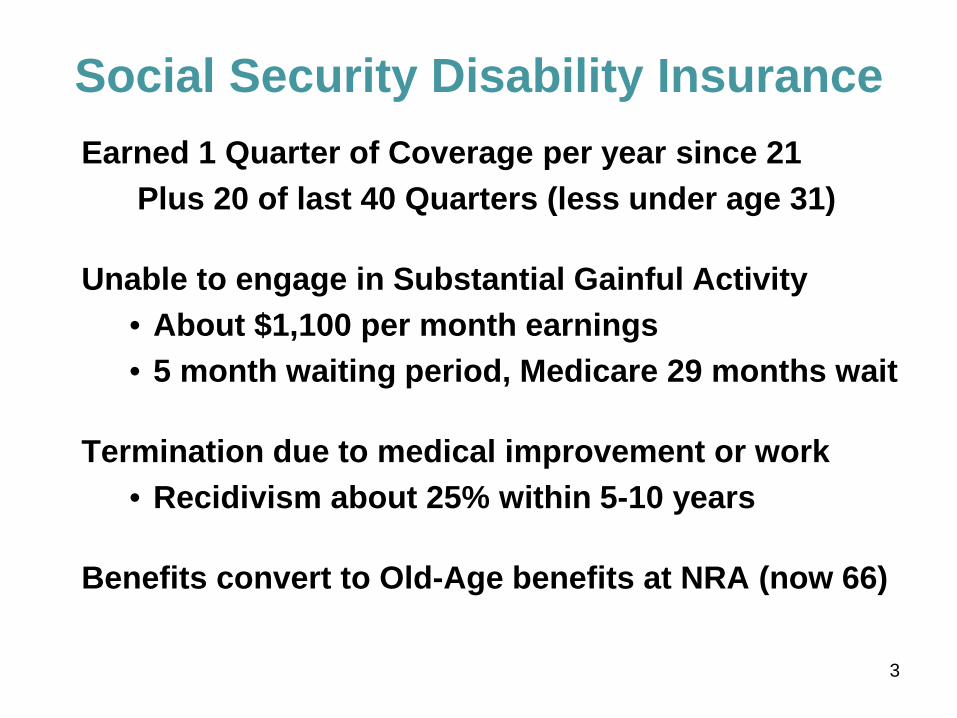
Social Security Disability InsuranceEarned 1 Quarter of Coverage per year since 21
Plus 20 of last 40 Quarters (less under age 31)
Unable to engage in Substantial Gainful Activity• About $1,100 per month earnings• 5 month waiting period, Medicare 29 months wait
Termination due to medical improvement or work• Recidivism about 25% within 5-10 years
Benefits convert to Old-Age benefits at NRA (now 66)
4
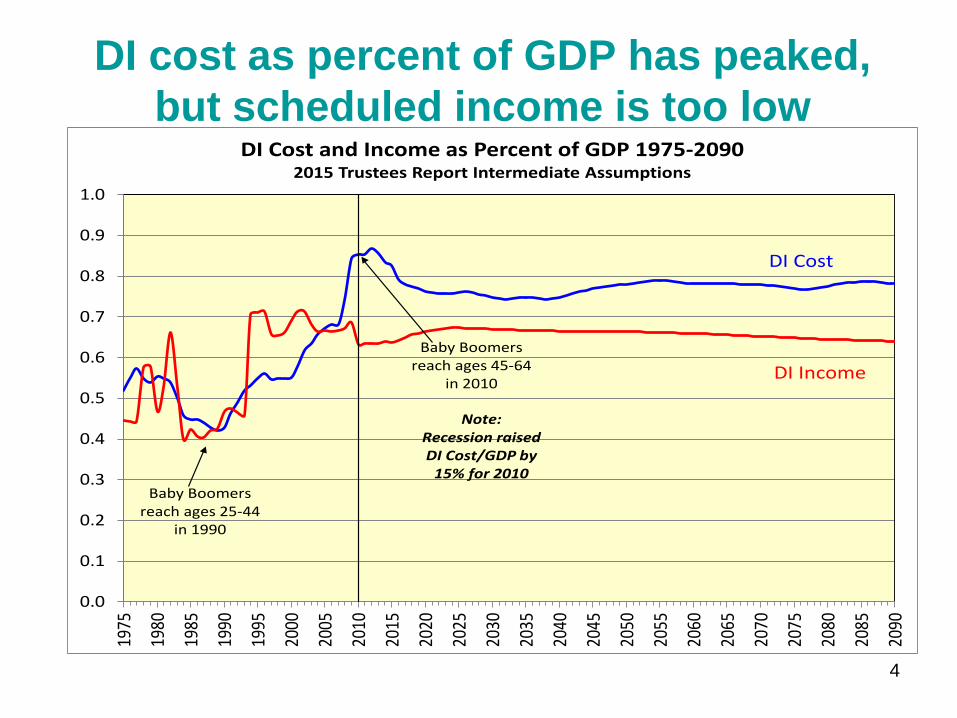
DI cost as percent of GDP has peaked, but scheduled income is too low
0.0
0.1
0.2
0.3
0.4
0.5
0.6
0.7
0.8
0.9
1.0
1975
1980
1985
1990
1995
2000
2005
2010
2015
2020
2025
2030
2035
2040
2045
2050
2055
2060
2065
2070
2075
2080
2085
2090
DI Cost and Income as Percent of GDP 1975-20902015 Trustees Report Intermediate Assumptions
Baby Boomers reach ages 45-64
in 2010
Baby Boomers reach ages 25-44
in 1990
Note: Recession raisedDI Cost/GDP by
15% for 2010
DI Cost
DI Income
5
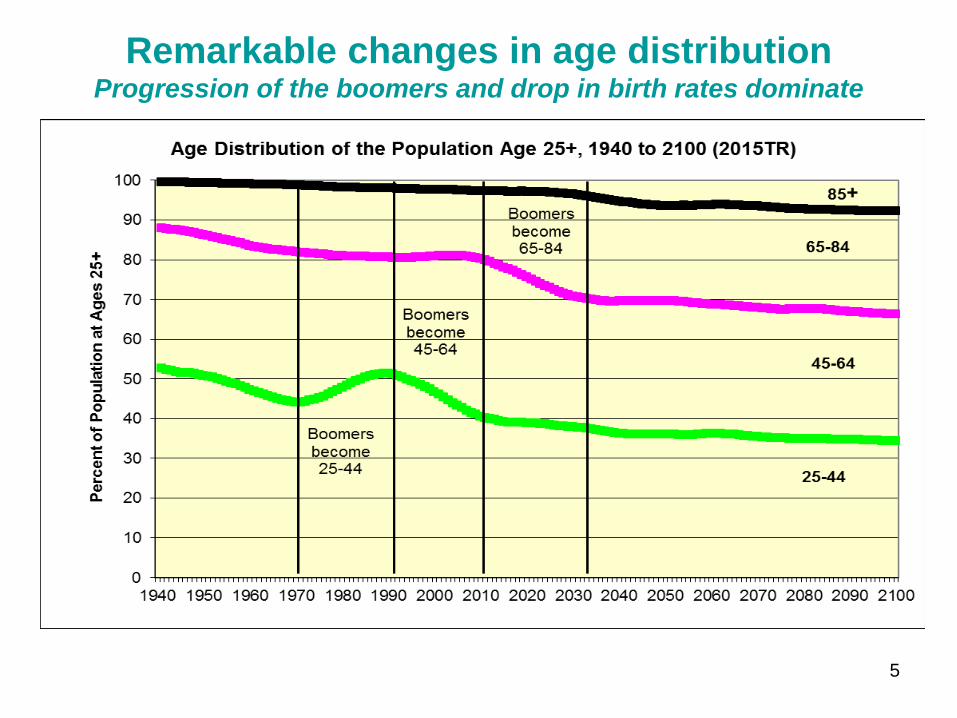
Remarkable changes in age distributionProgression of the boomers and drop in birth rates dominate
6
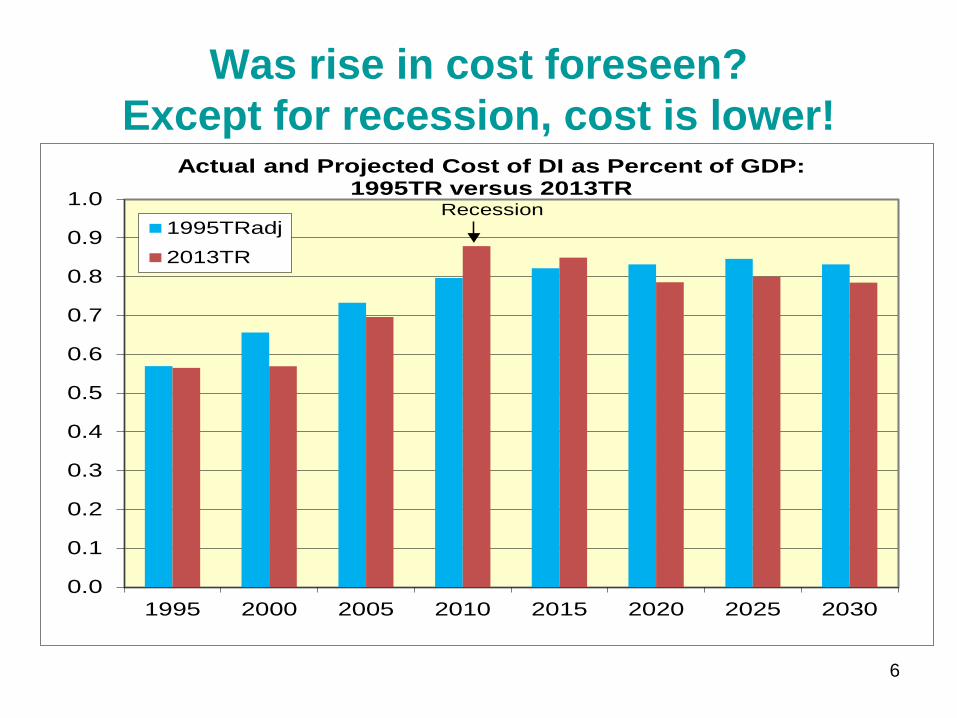
Was rise in cost foreseen?Except for recession, cost is lower!
0.0
0.1
0.2
0.3
0.4
0.5
0.6
0.7
0.8
0.9
1.0
1995 2000 2005 2010 2015 2020 2025 2030
Actual and Projected Cost of DI as Percent of GDP: 1995TR versus 2013TR
1995TRadj2013TR
Recession
7
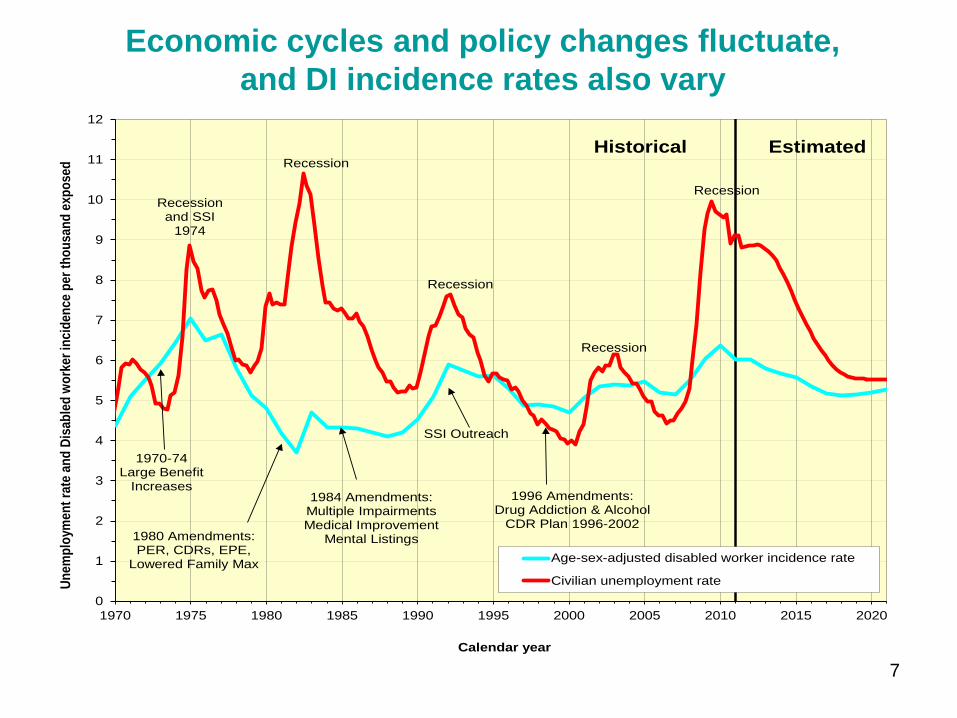
Economic cycles and policy changes fluctuate, and DI incidence rates also vary
0
1
2
3
4
5
6
7
8
9
10
11
12
1970 1975 1980 1985 1990 1995 2000 2005 2010 2015 2020
Unem
ploy
men
t rat
e an
d Di
sabl
ed w
orke
r inc
iden
ce p
er th
ousa
nd e
xpos
ed
Calendar year
Age-sex-adjusted disabled worker incidence rate
Civilian unemployment rate
Historical Estimated
Recession and SSI
1974
Recession
Recession
Recession
1980 Amendments: PER, CDRs, EPE,
Lowered Family Max
1984 Amendments: Multiple Impairments Medical Improvement
Mental Listings
1996 Amendments: Drug Addiction & Alcohol
CDR Plan 1996-2002
SSI Outreach
1970-74 Large Benefit
Increases
Recession
8
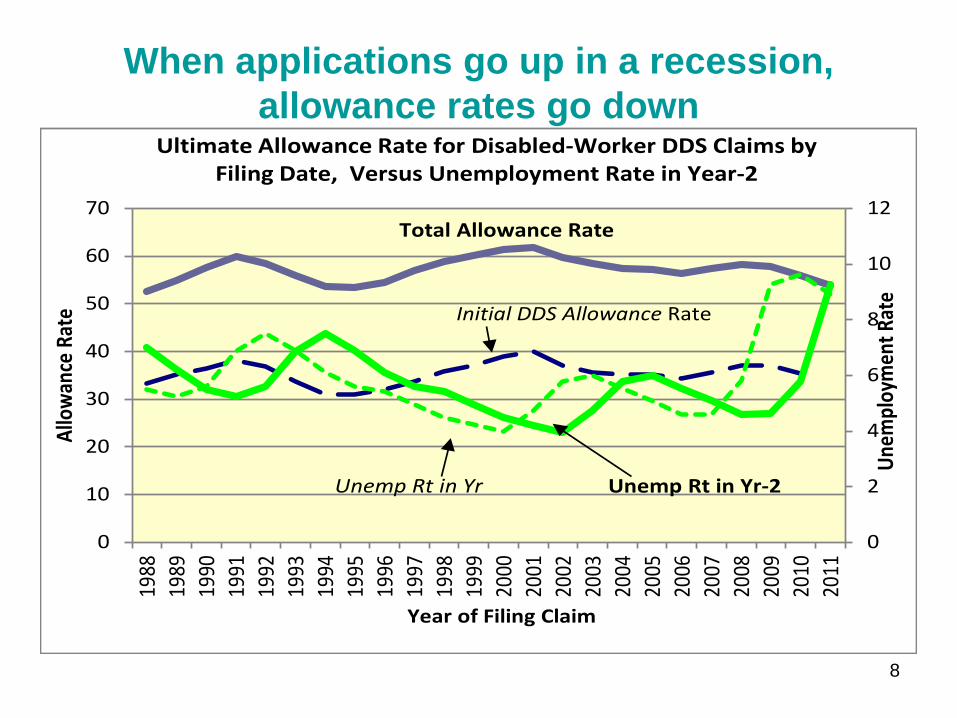
When applications go up in a recession, allowance rates go down
0
2
4
6
8
10
12
0
10
20
30
40
50
60
70
1988
1989
1990
1991
1992
1993
1994
1995
1996
1997
1998
1999
2000
2001
2002
2003
2004
2005
2006
2007
2008
2009
2010
2011
Unem
ploy
men
t Rat
e
Allo
wan
ce R
ate
Year of Filing Claim
Ultimate Allowance Rate for Disabled-Worker DDS Claims by Filing Date, Versus Unemployment Rate in Year-2
Total Allowance Rate
Unemp Rt in Yr Unemp Rt in Yr-2
Initial DDS Allowance Rate
9
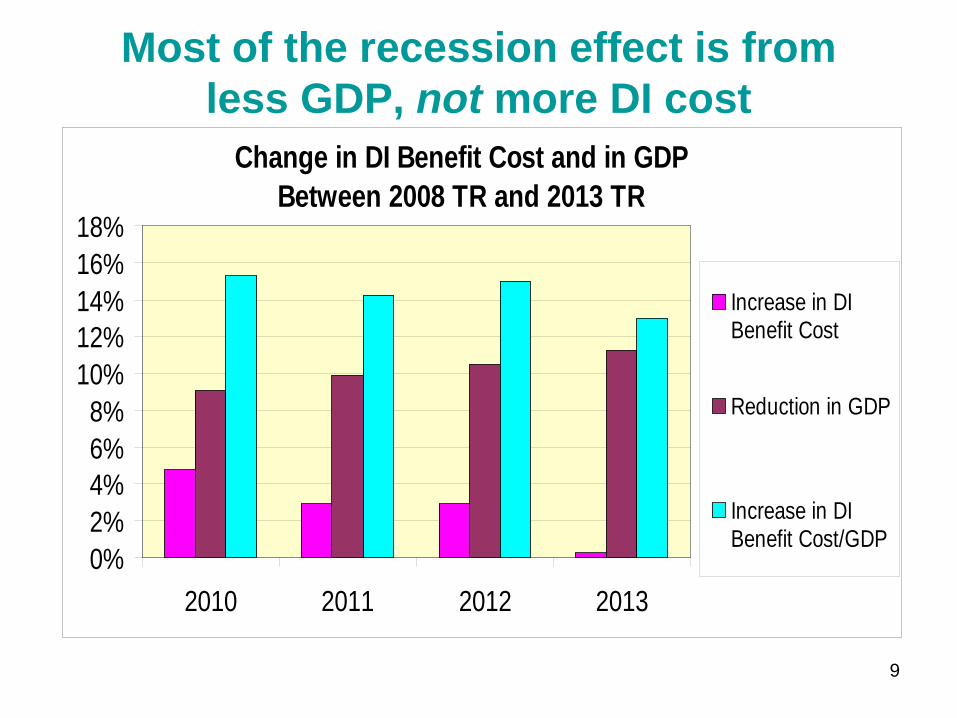
Most of the recession effect is from less GDP, not more DI cost
Change in DI Benefit Cost and in GDP Between 2008 TR and 2013 TR
0%2%4%6%8%
10%12%14%16%18%
2010 2011 2012 2013
Increase in DIBenefit Cost
Reduction in GDP
Increase in DIBenefit Cost/GDP
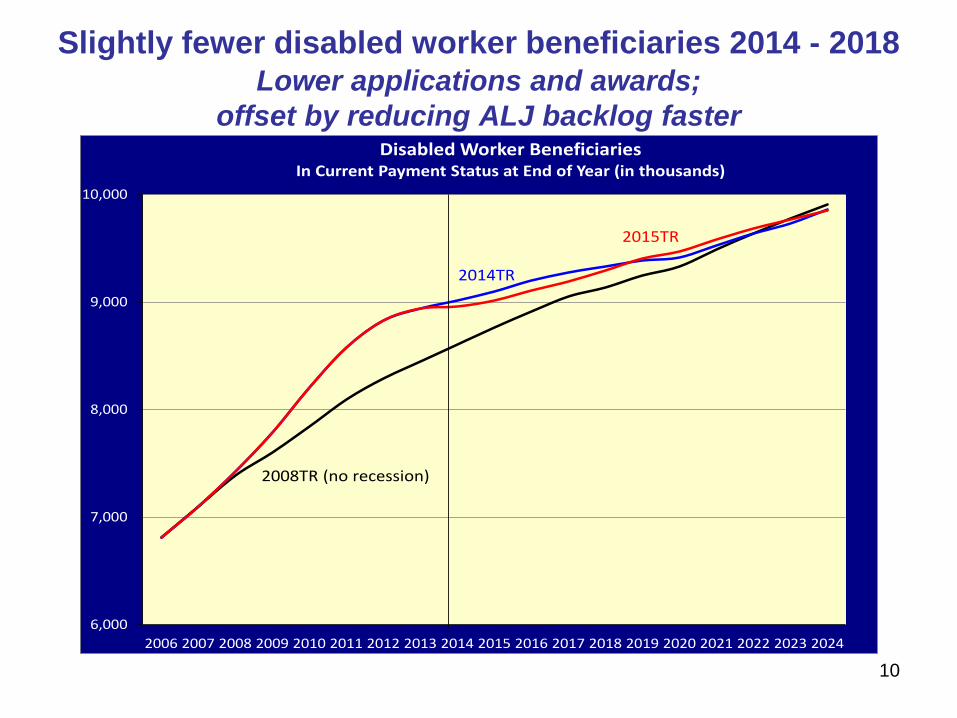
Slightly fewer disabled worker beneficiaries 2014 - 2018Lower applications and awards;
offset by reducing ALJ backlog faster
6,000
7,000
8,000
9,000
10,000
2006 2007 2008 2009 2010 2011 2012 2013 2014 2015 2016 2017 2018 2019 2020 2021 2022 2023 2024
Disabled Worker BeneficiariesIn Current Payment Status at End of Year (in thousands)
2008TR (no recession)
2015TR
2014TR
10
11
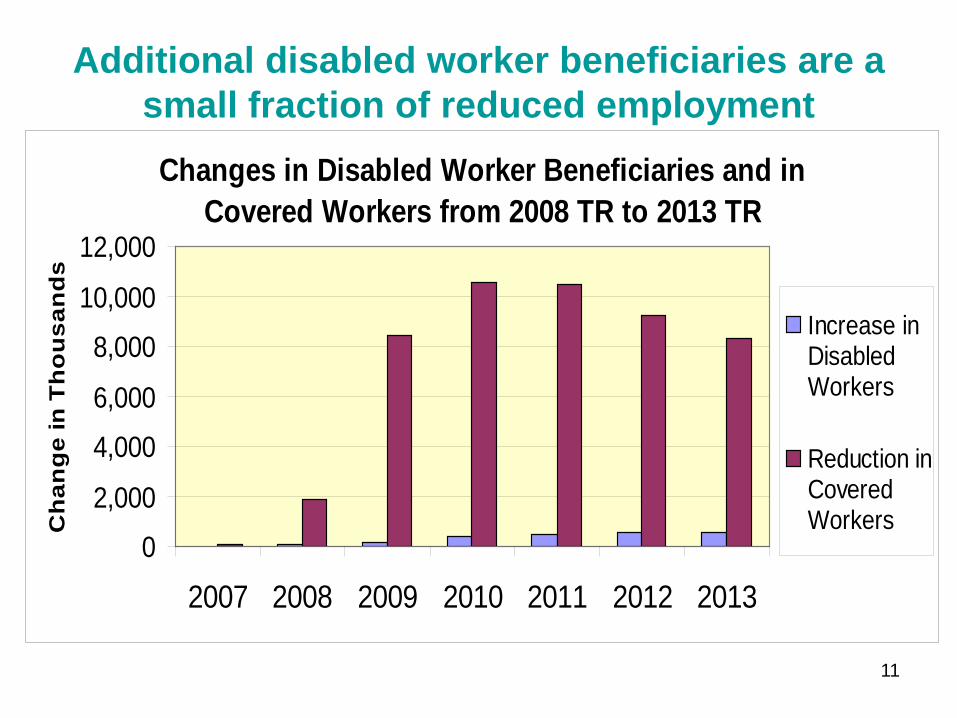
Additional disabled worker beneficiaries are a small fraction of reduced employment
Changes in Disabled Worker Beneficiaries and in Covered Workers from 2008 TR to 2013 TR
0
2,000
4,000
6,000
8,000
10,000
12,000
2007 2008 2009 2010 2011 2012 2013
Ch
ang
e in
Th
ou
san
ds
Increase inDisabledWorkers
Reduction inCoveredWorkers
12
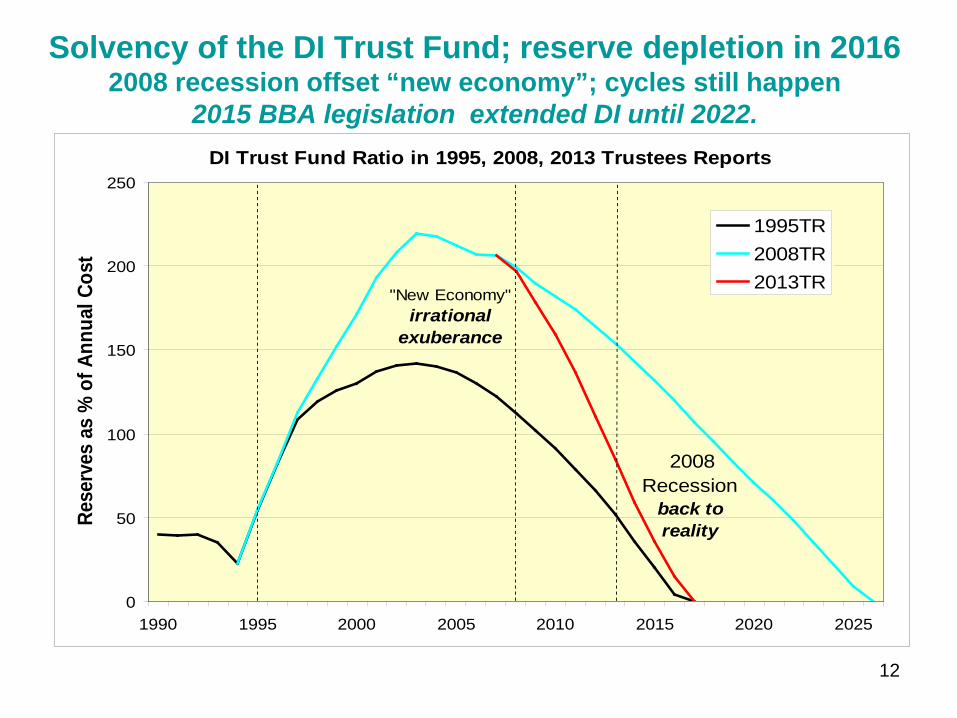
Solvency of the DI Trust Fund; reserve depletion in 20162008 recession offset “new economy”; cycles still happen
2015 BBA legislation extended DI until 2022.DI Trust Fund Ratio in 1995, 2008, 2013 Trustees Reports
0
50
100
150
200
250
1990 1995 2000 2005 2010 2015 2020 2025
Rese
rves
as
% o
f Ann
ual C
ost
1995TR2008TR2013TR
"New Economy" irrational
exuberance
2008 Recession
back to reality
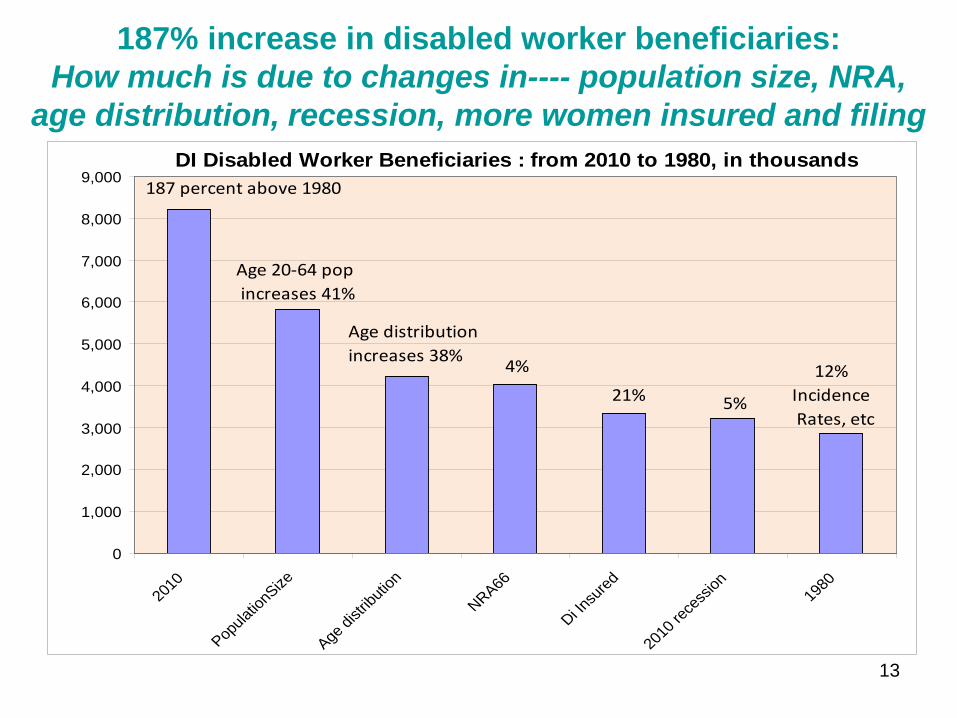
187% increase in disabled worker beneficiaries: How much is due to changes in---- population size, NRA,
age distribution, recession, more women insured and filing
13
DI Disabled Worker Beneficiaries : from 2010 to 1980, in thousands
0
1,000
2,000
3,000
4,000
5,000
6,000
7,000
8,000
9,000
2010
Popula
tionS
ize
Age di
stribu
tion
NRA66
Di Insu
red
2010
rece
ssion 19
80
187 percent above 1980
Age 20-64 pop increases 41%
Age distribution increases 38% 4%
21% 5%
12% Incidence Rates, etc
14
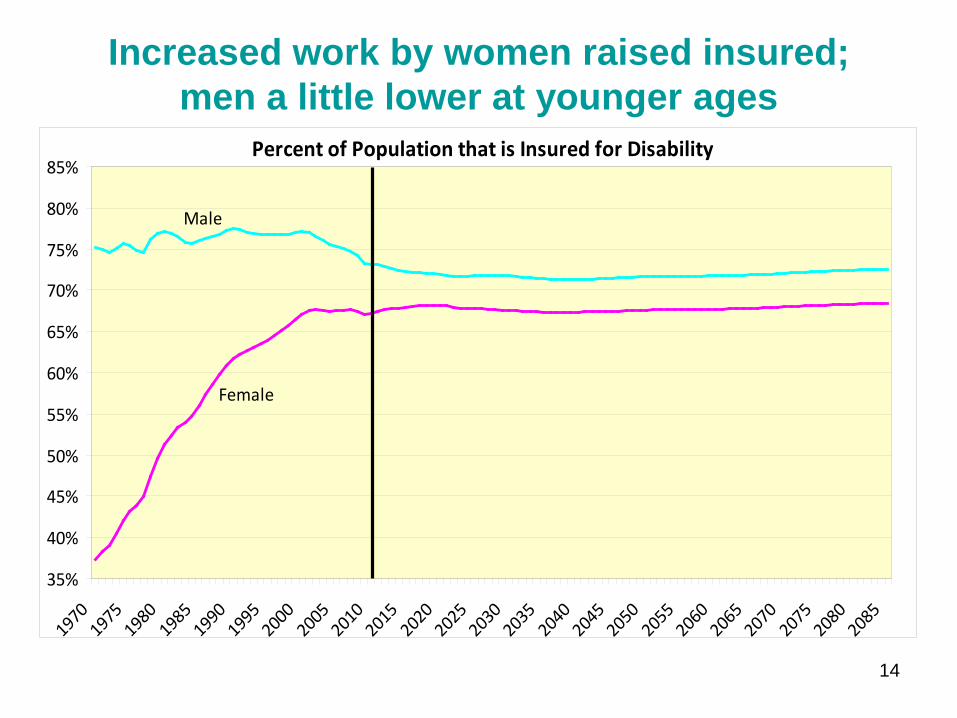
Increased work by women raised insured; men a little lower at younger ages
Percent of Population that is Insured for Disability
35%
40%
45%
50%
55%
60%
65%
70%
75%
80%
85%
19701975
19801985
19901995
20002005
20102015
20202025
20302035
20402045
20502055
20602065
20702075
20802085
Male
Female
15
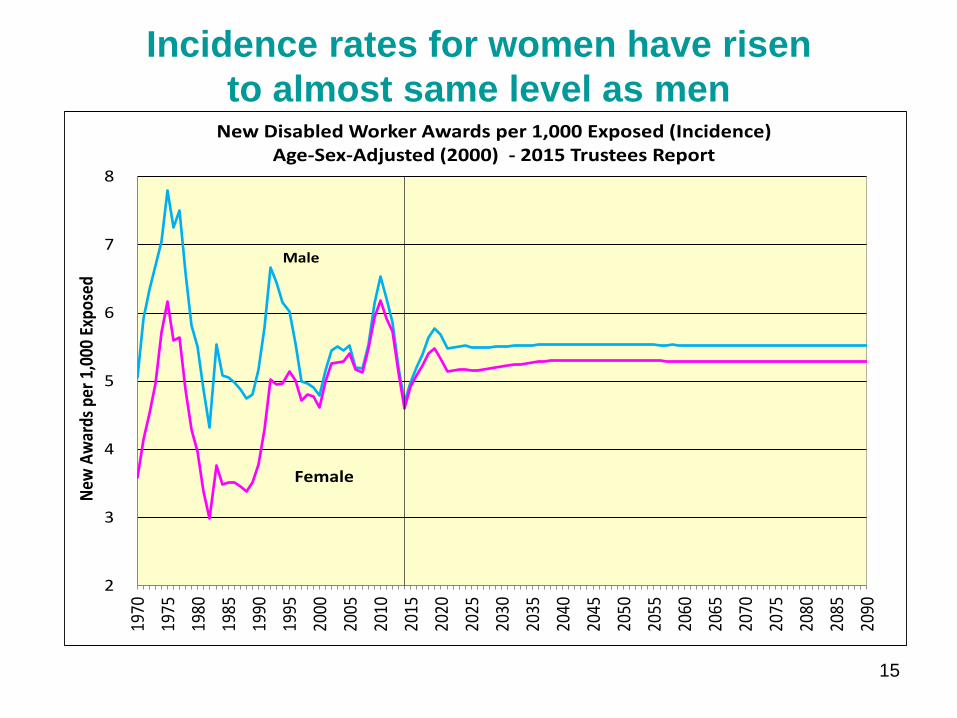
Incidence rates for women have risen to almost same level as men
2
3
4
5
6
7
8
1970
1975
1980
1985
1990
1995
2000
2005
2010
2015
2020
2025
2030
2035
2040
2045
2050
2055
2060
2065
2070
2075
2080
2085
2090
New
Aw
ards
per
1,0
00 E
xpos
ed
New Disabled Worker Awards per 1,000 Exposed (Incidence) Age-Sex-Adjusted (2000) - 2015 Trustees Report
Male
Female
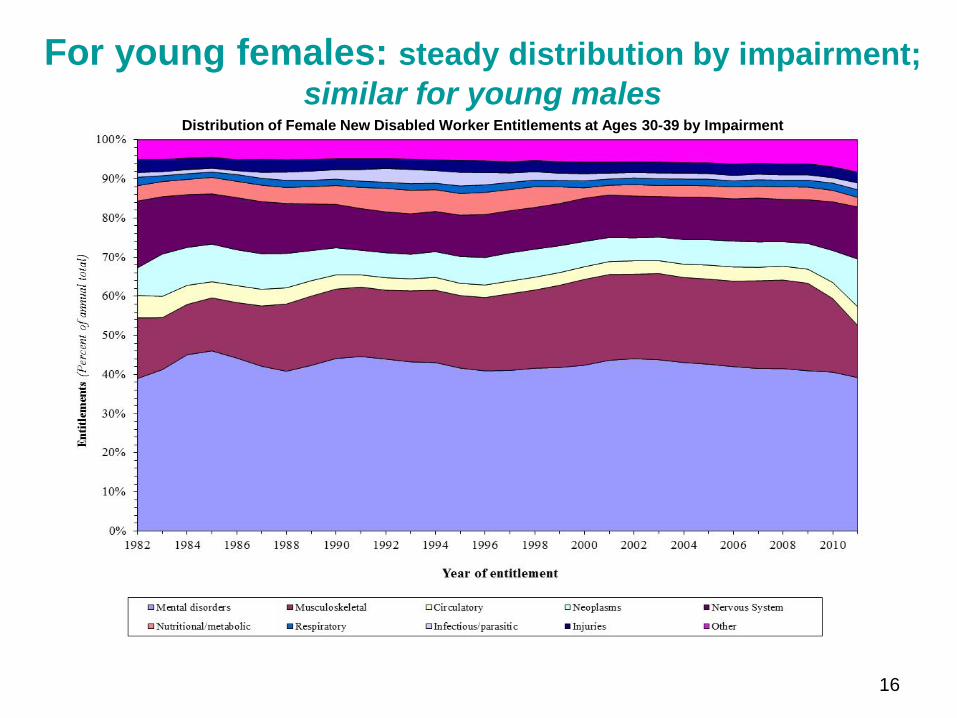
For young females: steady distribution by impairment;similar for young males
Distribution of Female New Disabled Worker Entitlements at Ages 30-39 by Impairment
16
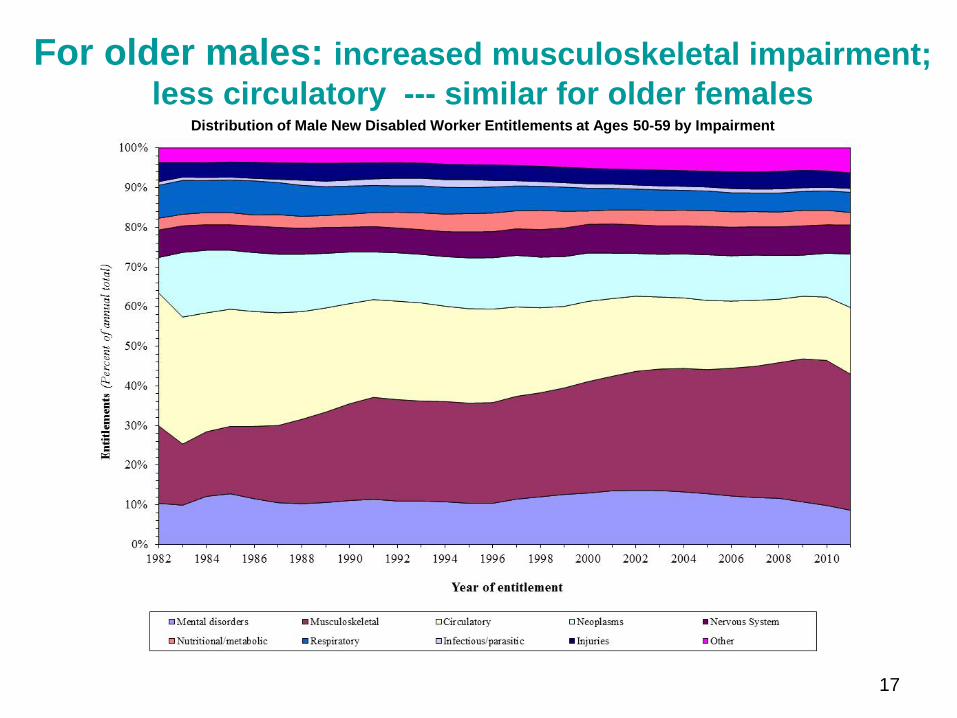
For older males: increased musculoskeletal impairment; less circulatory --- similar for older females
Distribution of Male New Disabled Worker Entitlements at Ages 50-59 by Impairment
17
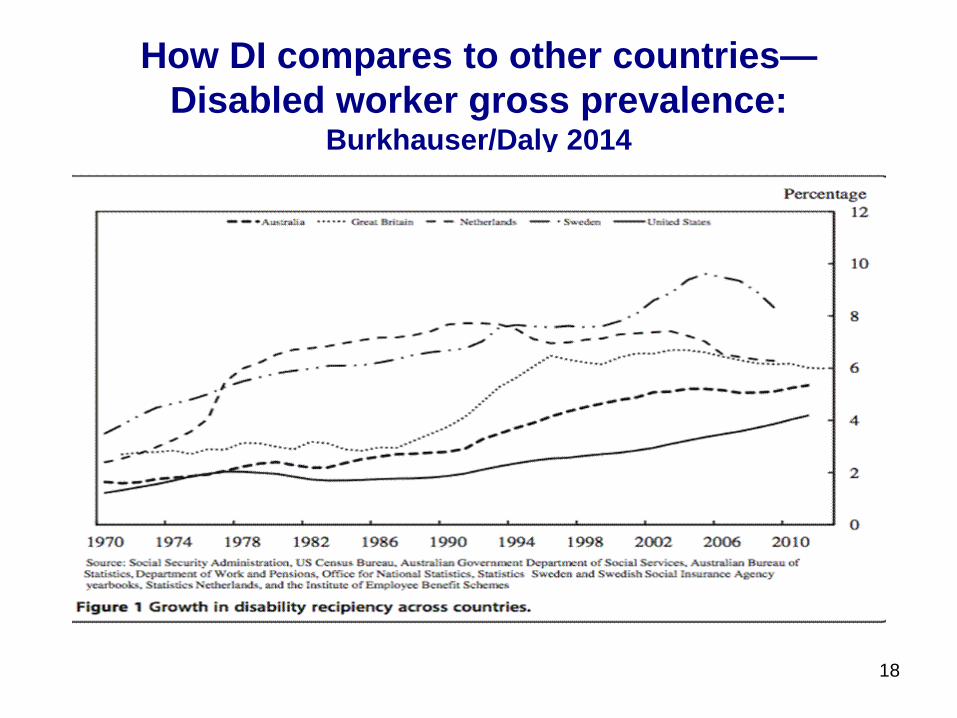
How DI compares to other countries—Disabled worker gross prevalence:
Burkhauser/Daly 2014
18
19
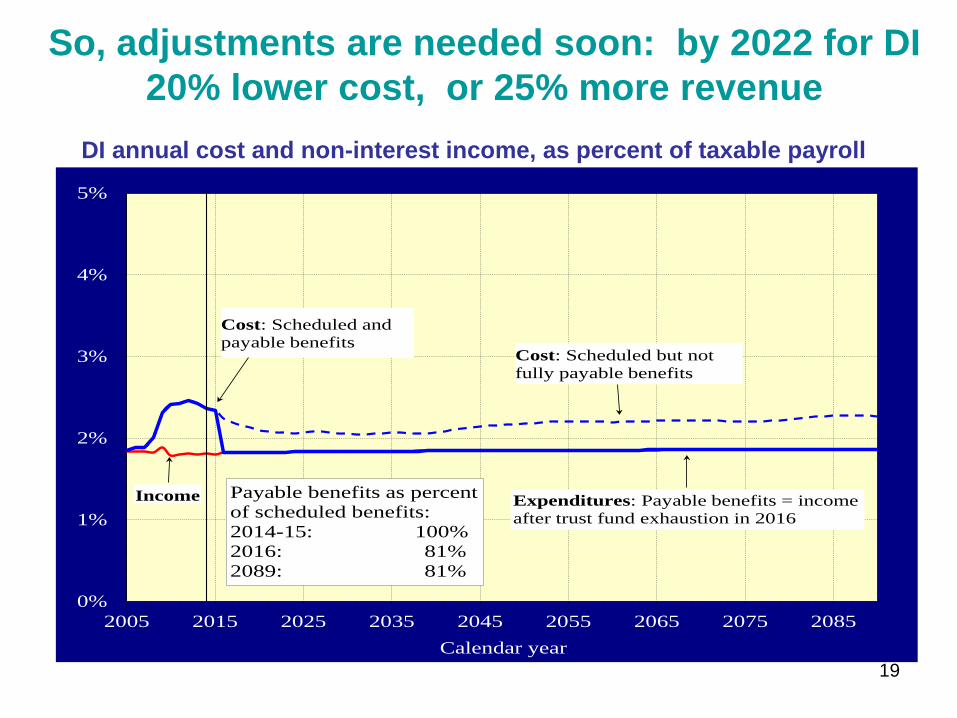
So, adjustments are needed soon: by 2022 for DI20% lower cost, or 25% more revenue
0%
1%
2%
3%
4%
5%
2005 2015 2025 2035 2045 2055 2065 2075 2085Calendar year
Cost: Scheduled and payable benefits
Income Payable benefits as percentof scheduled benefits:2014-15: 100%2016: 81%2089: 81%
Cost: Scheduled but not fully payable benefits
Expenditures: Payable benefits = income after trust fund exhaustion in 2016
DI annual cost and non-interest income, as percent of taxable payroll
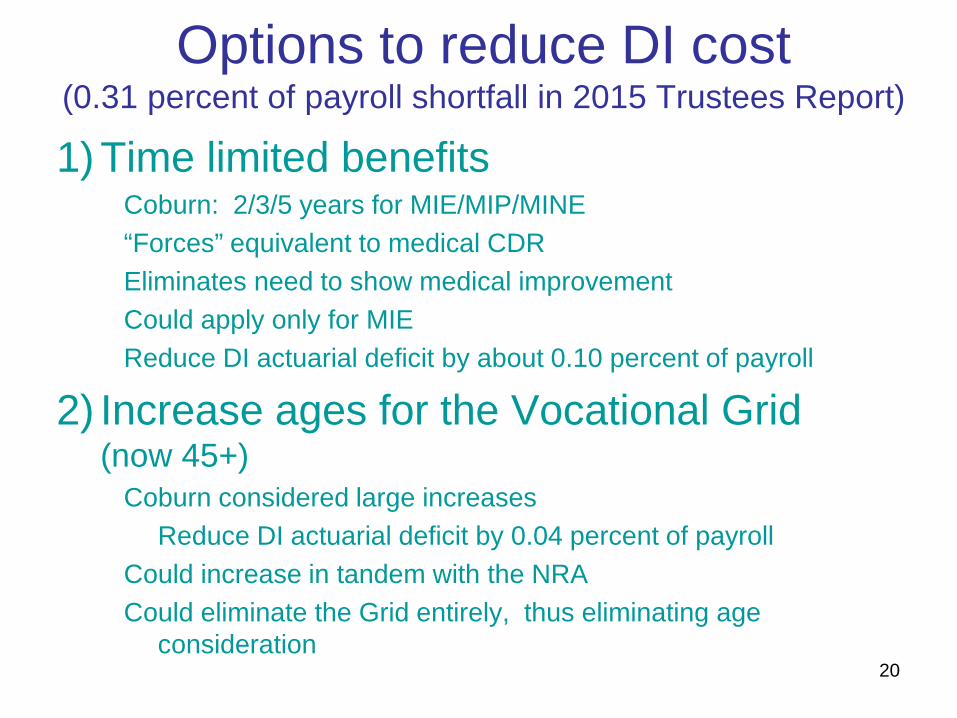
Options to reduce DI cost (0.31 percent of payroll shortfall in 2015 Trustees Report)
1) Time limited benefitsCoburn: 2/3/5 years for MIE/MIP/MINE“Forces” equivalent to medical CDREliminates need to show medical improvementCould apply only for MIE Reduce DI actuarial deficit by about 0.10 percent of payroll
2) Increase ages for the Vocational Grid (now 45+)
Coburn considered large increasesReduce DI actuarial deficit by 0.04 percent of payroll
Could increase in tandem with the NRACould eliminate the Grid entirely, thus eliminating age
consideration20
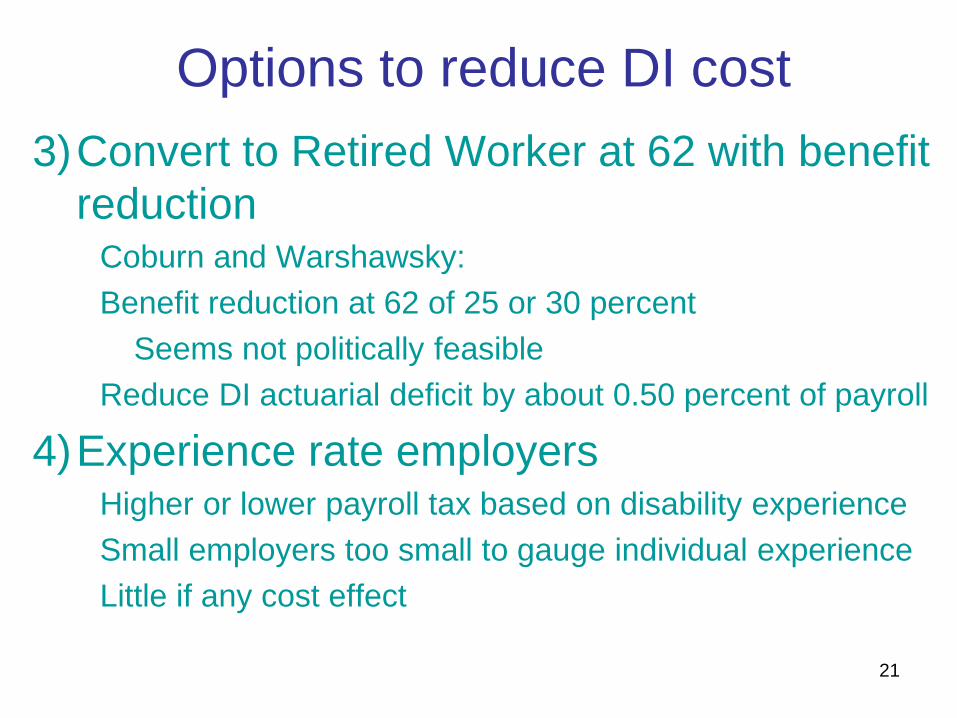
Options to reduce DI cost3)Convert to Retired Worker at 62 with benefit
reductionCoburn and Warshawsky:Benefit reduction at 62 of 25 or 30 percent
Seems not politically feasibleReduce DI actuarial deficit by about 0.50 percent of payroll
4)Experience rate employersHigher or lower payroll tax based on disability experience Small employers too small to gauge individual experienceLittle if any cost effect
21
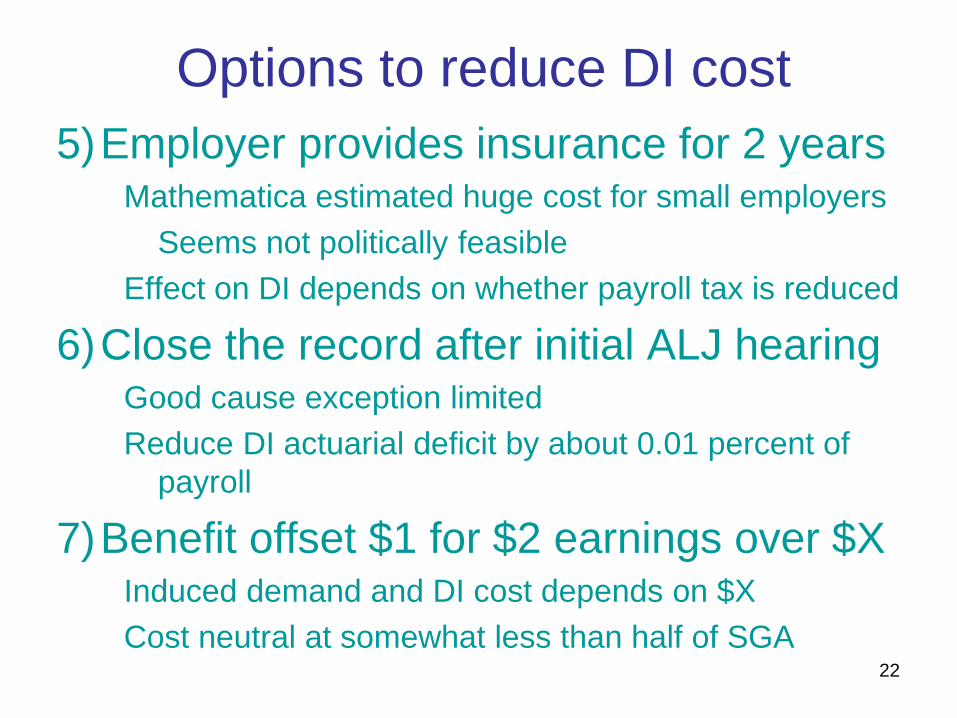
Options to reduce DI cost5)Employer provides insurance for 2 years
Mathematica estimated huge cost for small employersSeems not politically feasible
Effect on DI depends on whether payroll tax is reduced
6)Close the record after initial ALJ hearingGood cause exception limitedReduce DI actuarial deficit by about 0.01 percent of
payroll
7)Benefit offset $1 for $2 earnings over $XInduced demand and DI cost depends on $X Cost neutral at somewhat less than half of SGA
22
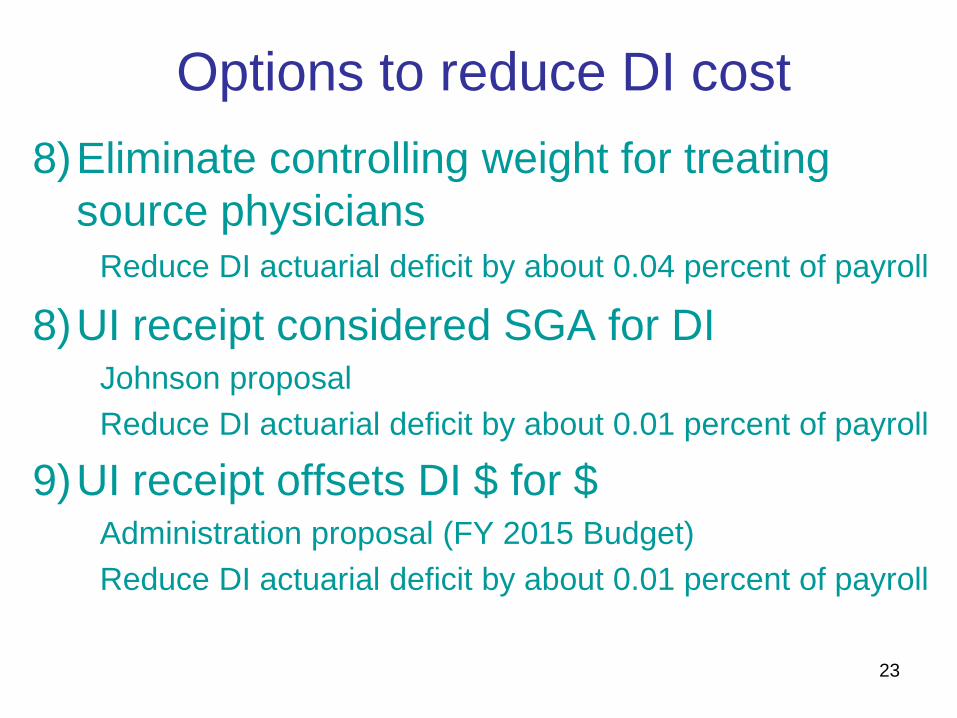
Options to reduce DI cost8)Eliminate controlling weight for treating
source physiciansReduce DI actuarial deficit by about 0.04 percent of payroll
8)UI receipt considered SGA for DIJohnson proposal Reduce DI actuarial deficit by about 0.01 percent of payroll
9)UI receipt offsets DI $ for $Administration proposal (FY 2015 Budget)Reduce DI actuarial deficit by about 0.01 percent of payroll
23
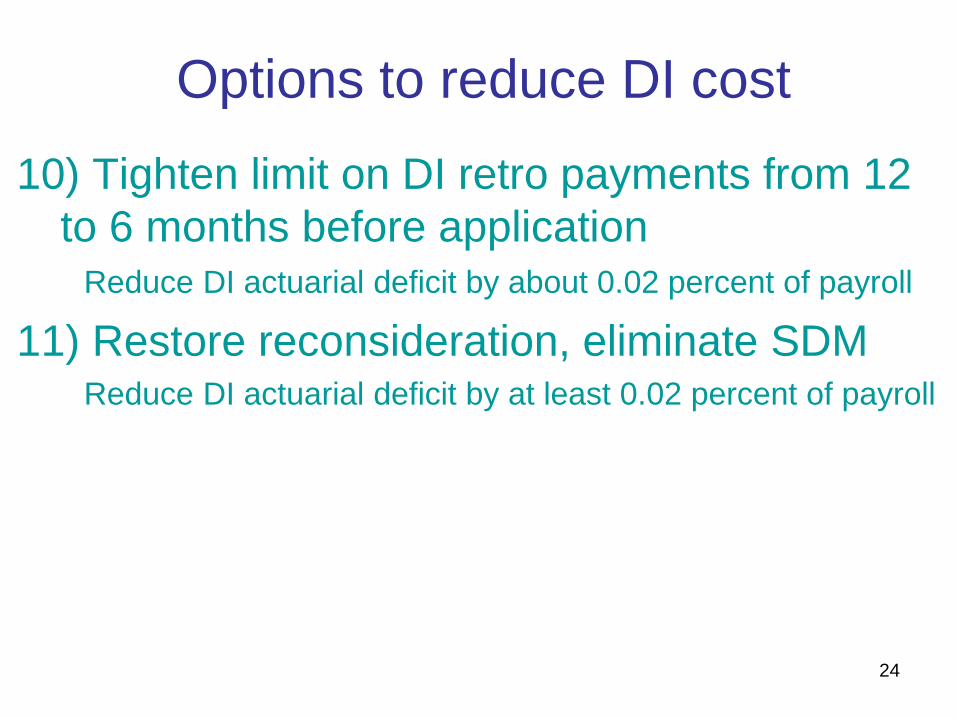
Options to reduce DI cost
10) Tighten limit on DI retro payments from 12 to 6 months before application
Reduce DI actuarial deficit by about 0.02 percent of payroll
11) Restore reconsideration, eliminate SDMReduce DI actuarial deficit by at least 0.02 percent of payroll
24
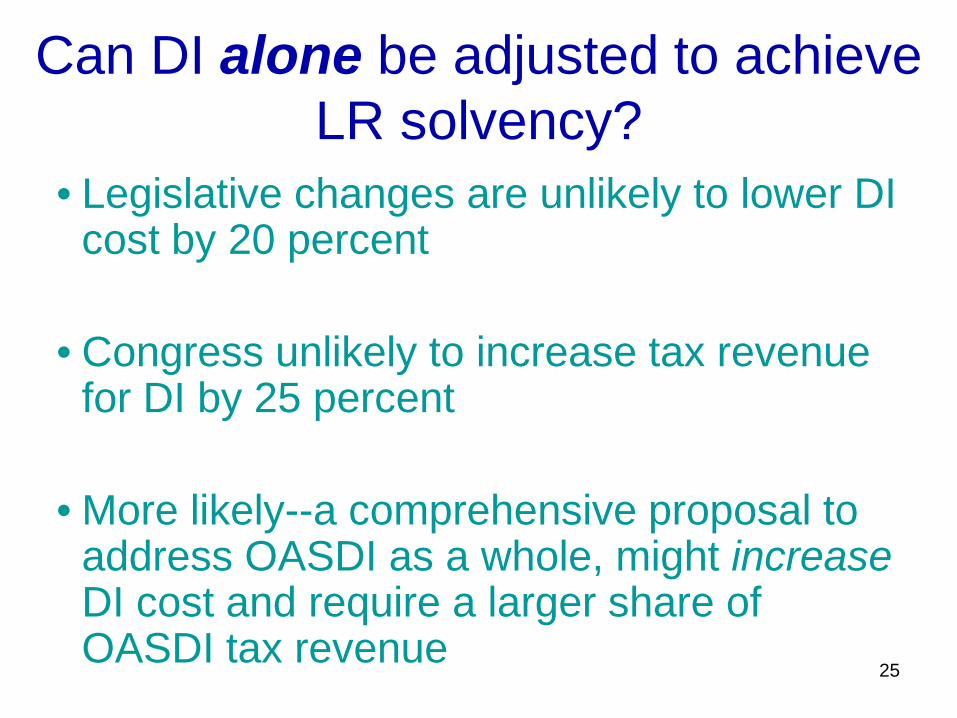
Can DI alone be adjusted to achieve LR solvency?
• Legislative changes are unlikely to lower DI cost by 20 percent
• Congress unlikely to increase tax revenue for DI by 25 percent
• More likely--a comprehensive proposal to address OASDI as a whole, might increaseDI cost and require a larger share of OASDI tax revenue
25
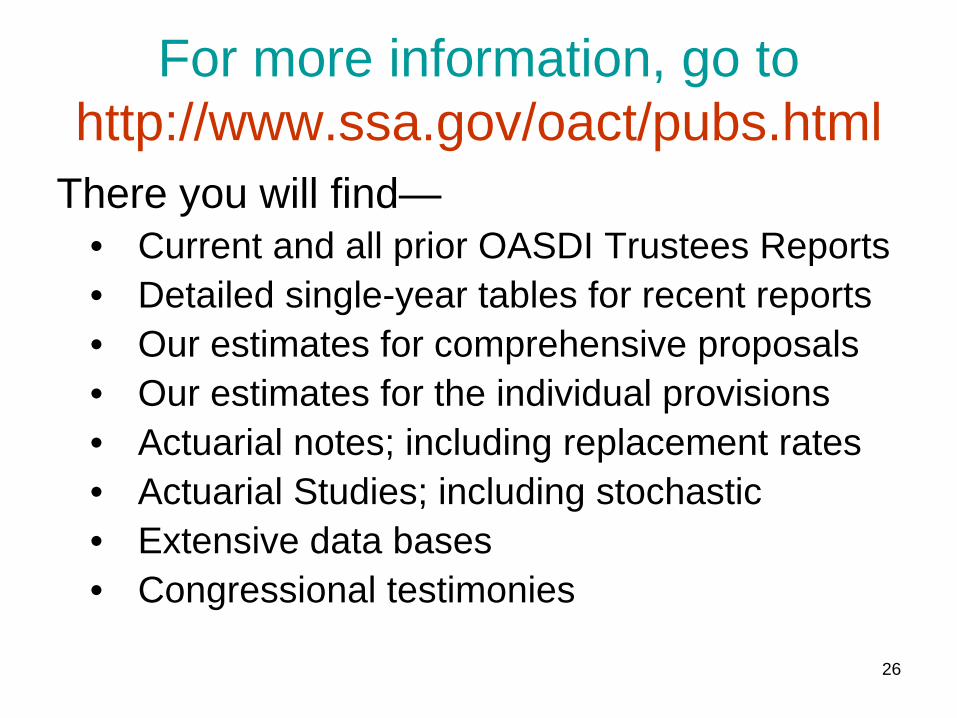
For more information, go tohttp://www.ssa.gov/oact/pubs.html
There you will find—• Current and all prior OASDI Trustees Reports• Detailed single-year tables for recent reports• Our estimates for comprehensive proposals• Our estimates for the individual provisions• Actuarial notes; including replacement rates• Actuarial Studies; including stochastic• Extensive data bases• Congressional testimonies
26

2016 SOA Health Meeting
Doug Vrooman, FSA, MAAA
Private Disability Insurance:Past, Present, and Future
June 15th, 2016
Private Disability Insurance:Past, Present, and Future
2
Risks Covered
• Quality of Life through Income Protection
• More than just “expense” or “indemnity” reimbursement
3
Who Covers These Risks
• Federal Government
• State Government
• Employers
• Private Industry
4
How Does Private Sector Cover Risks
• Employer Benefits• Salary/Bonus
• Major Medical
• 401(K)/Pension
• PTO
• Life Insurance/Supplemental Medical
• Disability
• LTD/STD Coverages that Join with Other Plans• Plenty of Bells and Whistles to Differentiate
5
How Well Does Private Sector Cover Risks• Private insurance covers much more than abject
poverty
• Covers risk well when there is access
• Need access/education/wallet share
6
The Future:Opportunities and Challenges For Private DI
7
Possible Federal Legislation
• The ACA Pathway
• “Medical” -vs- “Disability”
• SSDI Legislation• Budget Act of 2015
• Future Legislation
8
Possible State Legislation
• Disability Insurance positive laws
• Interstate Compact Risk
• Risks• Mental Health Parity
• Offsets
• Pre Ex
• MN Limits
• 2012 GLTD Table
9
Education
• Employers/Employees/Legislators/Regulators
• Different education needed for each group
• Insurance sold not bought
10
Pricing Opportunities and Challenges
• Federal Issues• SSDI
• Budget Act of 2015 extended solvency
• Need significant action
• Impact on Private Industry
• McCrery Pomeroy Solutions
• Fund backed by US Treasuries
• Incidence/Terminations of SSDI after Budget Act
11
Pricing Opportunities and Challenges
• State Issues• PERS/STRS
• Under stress due to Boomer exodus
• Some states have altered plans
• Lower offsets -> Higher prices
12
Changing US Demographics and Attitudes• Baby Boomers
• Longevity Risk
• Increasing diagnoses
• Purchasing behaviors
13
Economy
• Low Interest Rate Environment
• Unemployment Rates
• State Budgets
14
Growth Opportunities
• Worksite is getting crowded
• Wallet Share Issues
• How to capitalize on growth opportunities
• Marketing Platform
15
ACA Impacts
• Competition Increasing in DI
• Part-Time Employees
• Employer Paid –vs- Voluntary
16

![Petrology and Origin of Intrusive Masses of Zaker Located ... · The selected samples of intrusives in the Middlemost (1985) classification [5] diagram is located in monzonite to](https://img.pdfslide.net/doc/110x75/5e8cc449b93b141aed311ca3/petrology-and-origin-of-intrusive-masses-of-zaker-located-the-selected-samples.jpg)